
94% of researchers rate our articles as excellent or good
Learn more about the work of our research integrity team to safeguard the quality of each article we publish.
Find out more
ORIGINAL RESEARCH article
Front. Endocrinol., 25 February 2025
Sec. Cardiovascular Endocrinology
Volume 16 - 2025 | https://doi.org/10.3389/fendo.2025.1502792
This article is part of the Research TopicScreening Remnant Lipid Markers in Cardiometabolic DiseasesView all 10 articles
 Yilin Hou1,2
 Peipei Tian1,2
 Guangyao Song1,2,3*
 An Song4Dandan Liu1,2Zhimin Wang1,2Yihe Shi1,2Yale Tang1,2Xiaoyu Wang1,2Luxuan Li1,2
 Luping Ren1,2,3*
Background: Carotid atherosclerosis (CAS), a key precipitator of cardiovascular incidents, is linked to postprandial triglyceride-rich lipoproteins (TRL), as reflected by elevated triglycerides (TG) and remnant cholesterol (RC). This study explores the oral fat tolerance test (OFTT) for its predictive value in CAS, using postprandial TRL levels as a diagnostic biomarker.
Methods: A total of 107 volunteers with normal fasting lipid profiles and no CAS at baseline were included. They received an OFTT after consuming a meal containing 60% fat (1500 kcal). Serum lipid profiles were monitored at fasting and 2, 4, 6, 8, and 10 h postprandially. The participants were categorized into postprandial normotriglyceridemia and postprandial hypertriglyceridemia groups based on their postprandial TG levels. After a 6-year follow-up, fasting lipid profiles and CAS status were reassessed. The baseline fasting and postprandial lipid levels in the CAS and non-CAS groups were compared. Repeated-measures analysis of variance was used to analyze the postprandial lipid profiles across different groups. Logistic regression models were constructed to assess the effects of postprandial TG and RC levels on CAS incidence.
Results: The incidence of CAS in the postprandial hypertriglyceridemia group was 66.0%, which was significantly higher than the 13.3% observed in the postprandial normotriglyceridemia group (P < 0.001). In the CAS group, postprandial TG and RC levels peaked 4 h after a high-fat meal and did not return to fasting levels, even after 10 h. The levels of 4h-postprandial TG (TG4h), maximum postprandial TG (TGmax), 4h-postprandial RC (RC4h), and maximum postprandial RC (RCmax) were significantly higher in the CAS group than in the non-CAS group (P < 0.05). At baseline, TG4h (P < 0.001), TGmax (P = 0.006), RC4h (P < 0.001), and RCmax (P = 0.003) were statistically significant predictors of CAS, whereas fasting TG (P = 0.200) and fasting RC (P = 0.200) were not significantly associated with CAS.
Conclusion: The standardized OFTT has predictive value for CAS, and elevated TRL levels after a high-fat meal in individuals with normal fasting lipid profiles may serve as an early marker for CAS.
Atherosclerotic cardiovascular disease (ASCVD) poses a major global threat to human health. Carotid atherosclerosis (CAS), an early indicator of ASCVD, has attracted considerable attention due to its significance as a marker of systemic atherosclerosis. Identifying and managing CAS progression is essential for reducing ASCVD risk (1). In 2020, an estimated 28% of individuals worldwide aged 30–79 years had CAS, with the highest prevalence observed in China and other Western Pacific countries (2). A Chinese survey of individuals over 20 years of age reported a CAS prevalence as high as 26.2% (3). Early signs of CAS typically include increased carotid intima-media thickness (cIMT), which may progress to carotid plaque formation, arterial stenosis, or occlusion. Carotid ultrasonography, a noninvasive screening tool, is widely employed to assess CAS and identify high-risk populations effectively (4).
Dyslipidemia is a risk factor for ASCVD, and lipid management plays a critical role in its prevention and treatment. Triglycerides (TG) are primarily transported in the body by TG-rich lipoproteins (TRL), such as chylomicrons, very-low-density lipoproteins, and their metabolic remnants, collectively known as remnant cholesterol (RC). RC, characterized by high cholesterol content and small particle size, can penetrate the vascular endothelial barrier, infiltrate the arterial wall, and be engulfed by macrophages. This process leads to foam cell formation and promotes atherosclerotic plaque development (5). RC’s atherogenic potential may surpass that of low-density lipoprotein cholesterol (LDL-C), making it a valuable supplementary marker for assessing cardiovascular disease risk. Consequently, TRL have become a major focus of global research. Reflecting advances in TG metabolism, the 2021 European Atherosclerosis Society consensus redefined fasting TG levels, classifying levels below 1.2 mmol/L as optimal, 1.2–1.7 mmol/L as borderline, and levels of 1.7 mmol/L or higher as elevated (6).
Postprandial lipid fluctuations significantly influence ASCVD development. Epidemiological studies suggest that non-fasting TG levels measured within 8 h after a meal are better predictors of ASCVD risk than fasting TG levels (7). However, capturing accurate TG peaks in non-standardized dietary conditions is challenging. The oral fat tolerance test (OFTT) addresses this limitation by dynamically monitoring postprandial lipid levels following the consumption of a standardized high-fat meal. The OFTT effectively identifies individuals with postprandial hypertriglyceridemia (PH) even when normal fasting lipids levels are normal. It also captures TG peaks while controlling factors such as dietary habits, fasting duration, and physical activity (8, 9).
Our previous research has shown that postprandial dyslipidemia induced by a single high-fat meal is associated with several metabolic dysfunctions, including fatty liver disease, inflammatory responses, insulin resistance, and abnormal apolipoprotein secretion (10–18). Apolipoprotein B (ApoB), a structural protein for LDL and very low-density lipoproteins, is implicated in atherosclerosis progression (19). Similarly, apolipoprotein C3 (ApoC3) inhibits lipoprotein lipase activity, delaying TRL clearance and increasing plasma levels of TG and cholesterol. This mechanism promotes the accumulation of atherogenic lipoprotein remnants during atherosclerosis (6). Additionally, interleukin-6 (IL-6) and high-sensitivity C reactive protein (hs-CRP), both positively correlated with serum TG levels, play roles in the shared pathophysiological mechanisms of lipid metabolism disorder and atherosclerosis (20).
Despite these insights, long-term follow-up studies of the Chinese population after an OFTT are limited. This study aimed to identify individuals with normal fasting lipid levels and no evidence of CAS during routine physical examinations, differentiate postprandial lipid states using the OFTT, and conduct long-term follow-ups. Our objectives were to explore the association between postprandial lipid changes and CAS, evaluate the potential value of the OFTT in early CAS prevention, and provide valuable longitudinal research data.
This follow-up study, conducted in 2024, included 107 adult participants who underwent an OFTT at Hebei General Hospital, China, in 2018. All participants provided informed consent, and the study was approved by the Hebei General Hospital Ethics Committee (2018-02). This trial was registered with the Chinese Clinical Trial Center (ChiCTR1800019514).
Inclusion criteria required participants to have baseline fasting TG < 1.7 mmol/L, total cholesterol (TC) < 5.2 mmol/L, and LDL-C < 3.4 mmol/L (21). Additionally, baseline physical examinations had to show a cIMT < 1.0 mm, no localized thickening, and no plaque formation (4).
Exclusion criteria included self-reported history of pregnancy, cardiovascular disease, diabetes, thyroid disease, liver or kidney disease, cancer, or other serious illnesses. Participants who smoked, quit smoking within the past 3 years, or consumed alcohol more than once per week in the previous year were excluded, as were those who had taken oral hypoglycemic agents, lipid-lowering drugs, antihypertensive medications, or other drugs affecting blood lipid levels within the past year. Exclusion also applied to individuals experiencing stress conditions, such as infection, surgery, or major trauma, within the previous month.
General information, including age and sex, was recorded. Trained personnel performed physical examinations, measuring height and weight in order to determine their body mass index (BMI). Measurements were taken of the waist and hip circumferences to calculate the waist-to-hip ratio. Blood pressure measurements included systolic blood pressure (SBP) and diastolic blood pressure (DBP).
A 7600 automatic biochemical analyzer (Hitachi Instruments Ltd., Japan) was used to measure serum TC, TG, high-density lipoprotein cholesterol (HDL-C), LDL-C, blood glucose, Apo B, and hs-CRP. LDL-C was calculated using the Friedewald equation [LDL-C = TC − (HDL-C) − TG/2.2] for TG levels ≤ 4 mmol/L; for TG levels > 4 mmol/L, measured LDL-C values were used (22). RC was calculated as RC = TC –(HDL-C) – (LDL-C), and non-HDL-C was calculated as non-HDL-C = TC – (HDL-C). Glycated hemoglobin (HbA1c) was measured using a VARIAN II hemoglobin analyzer (Bio-Rad Laboratories, USA). Apo C3 and IL-6 levels were determined using enzyme-linked immunosorbent assay kits from R&D Systems, USA, and Elabscience, China, respectively.
Participants were categorized based on an optimal fasting TG level of 1.2 mmol/L (6). Group A included those with fasting TG levels < 1.2 mmol/L; in contrast, Group B included participants with fasting TG levels between 1.2 and 1.7 mmol/L.
Participants were instructed to avoid vigorous physical activity and high-fat or high-protein meals for 1 week before the trial. They also fasted for at least 8 h before the test. On the trial day, participants consumed a standardized test meal at the hospital between 7:00 and 8:00 AM. The test meal was prepared as specialized energy bars formulated by a professional nutritionist. Each bar consisted of 97 g of peanut oil (Luhua Group Co., Ltd., China), 86 g of flour (Wilmar International Limited, China), and 86 g of whey protein (Nestle Health Science Co., Ltd., United States). The meal’s nutritional content included 99.2 g of fat (17.5 g saturated fat, 43.1 g monounsaturated fat, and 37.5 g polyunsaturated fat), 66.9 g of carbohydrates, and 83.2 g of protein, amounting to approximately 1,500 kcal. Participants finished the meal within 10 min and refrained from consuming any food or beverages (except water) for 10 h postprandially. Vigorous physical activity was also prohibited during this period. Blood samples were collected every 2 h for 10 h postprandially, and the serum was stored at -80°C (Haier Group, China) for subsequent testing.
Using the 2010 European criteria (8), PH was defined as any postprandial TG level > 2.5 mmol/L. In contrast, postprandial normal (PN) was defined as postprandial TG levels consistently ≤ 2.5 mmol/L.
Carotid ultrasound assessments were conducted by experienced physicians at Hebei General Hospital using the EPIQ 7C color ultrasound diagnostic system (Philips Ultrasound, Inc., FL, USA). cIMT was measured as the average thickness of the intima-media layer of the bilateral common carotid arteries, their bifurcations, and the internal carotid arteries at three sites. CAS was identified based on an average cIMT ≥ 1.0 mm and/or the presence of carotid atherosclerotic plaques. Plaques were defined as localized structures extending into the arterial lumen by ≥ 0.5 mm, vascular lumen thickness exceeding 50% of the surrounding cIMT, or a cIMT ≥ 1.5 mm (2, 4).
Statistical analyses and graphing were performed using R software (version 4.4.1) and GraphPad Prism 8. Descriptive statistics were used to analyze baseline and follow-up data, as well as changes in blood lipid levels during the OFTT, categorized by PH and CAS. Quantitative data with normal distributions are expressed as the mean ± standard deviation; in contrast, non-normally distributed data are expressed as the median (interquartile range). Categorical data are presented as counts and percentages (n, %). Independent sample t-tests were used to compare quantitative data between groups, and chi-squared tests were used for categorical data. Two-way repeated-measures analysis of variance was applied to assess the effects of time and group on blood lipid levels during the OFTT, with pairwise comparisons conducted using the Šidák method. Postprandial blood lipid levels were represented by the maximum values of TG and RC at any time postprandially (TGmax and RCmax, respectively), as well as TG and RC at 4 h postprandially (TG4h and RC4h). Univariate and multivariate logistic regression analyses were performed to evaluate associations between independent variables and CAS, with subgroup analyses based on age, sex, and BMI. Odds ratios (OR) and 95% confidence intervals (95% CI) were calculated. Statistical significance was defined as P < 0.05, with all tests conducted as two-tailed.
This study included 107 participants who underwent follow-up after an OFTT, categorized into PN (n = 54) and PH (n = 53) groups. Table 1 presents the baseline and follow-up clinical characteristics of participants with different postprandial TG levels. The cohort comprised 52 men and 55 women, with a baseline age of 47 (39–53) years and a follow-up age of 53 (45–59) years.
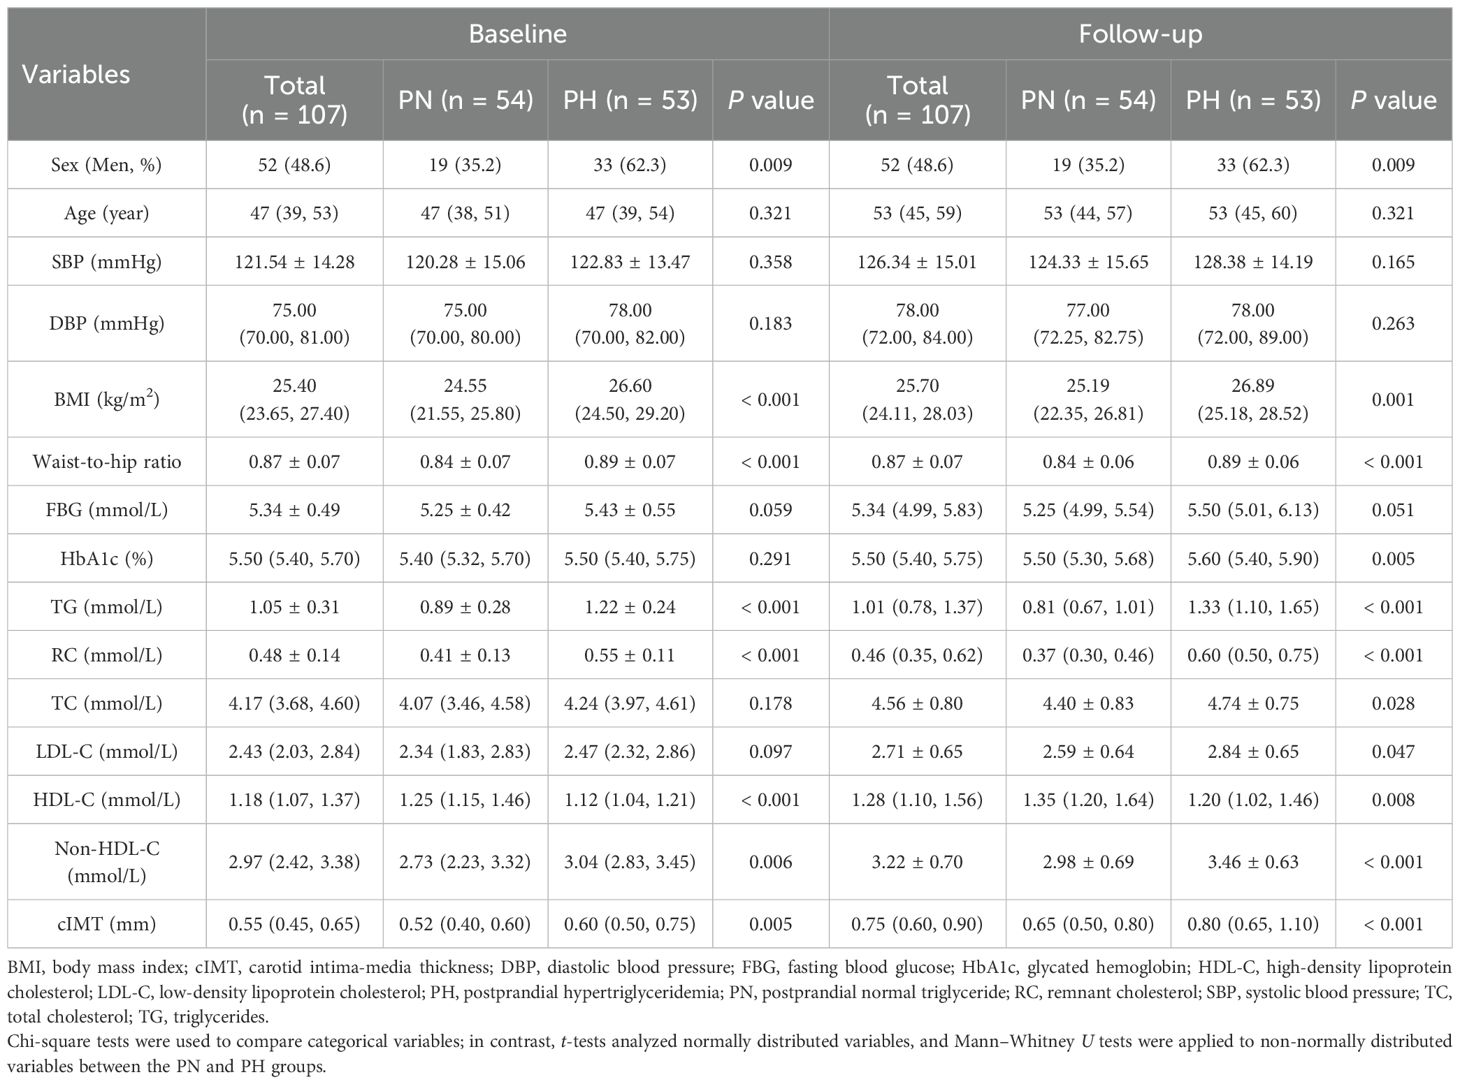
Table 1. Clinical characteristics of the participants with different postprandial TG levels.
The proportion of males was significantly higher in the PH group than in the PN group (P = 0.009). At baseline and follow-up, BMI, waist-to-hip ratio, fasting TG, RC, non-HDL-C levels, and cIMT were significantly higher in the PH group than in the PN group (P < 0.05). Additionally, HDL-C levels were significantly lower in the PH group (P < 0.05). At follow-up, HbA1c, TC, and LDL-C levels were also significantly higher in the PH group (P < 0.05). No significant differences were observed in age, SBP, or DBP between the two groups at baseline or follow-up (P > 0.05).
Among the participants, 42 (39.3%) developed CAS. As shown in Figure 1A, the proportion of participants with CAS in the PH group was 66.0%, significantly higher than the 13.0% observed in the PN group (P < 0.001).

Figure 1. Percentage bar chart. (A) Proportion of carotid atherosclerosis (CAS) and Non-CAS participants in the postprandial normal triglyceride (PN) and postprandial hypertriglyceridemia (PH) groups. (B, C) Proportion of CAS participants in the A (fasting triglyceride < 1.2 mmol/L) and B (fasting triglyceride 1.2–1.7 mmol/L) groups at baseline and follow-up, respectively. (D, E) Proportion of PN and PH participants in the A and B groups at baseline and follow-up, respectively.
Figure 2 illustrates blood lipid changes during the OFTT in the PN and PH groups. At all time points, TG, RC, and non-HDL-C levels were significantly higher in the PH group than in the PN group (P < 0.05); in contrast, HDL-C levels were significantly lower (P < 0.05). No significant differences were observed in the TC and LDL-C levels between the groups at any time point (P > 0.05). Following a high-fat meal, both groups showed increased TG and RC levels. The PN group reached peak levels at 2 h, returning to fasting levels by 10 h. In contrast, the PH group peaked at 4 h, with levels remaining significantly elevated at 10 h (P < 0.05). In the PN group, postprandial TC levels were significantly higher than fasting levels at 8–10 h (P < 0.05); in contrast, the PH group exhibited this increase at 6–10 h (P < 0.05). The postprandial LDL-C levels reached their lowest at 2 h in the PN group and at 4 h in the PH group, with both groups returning to fasting levels by 10 h. For postprandial HDL-C levels, the lowest levels occurred at 4 h in the PN group and 6 h in the PH group, with both groups returning to fasting levels by 8 h. Postprandial non-HDL-C levels increased between 6 and 10 h in the PN group and between 4 and 10 h in the PH group, with neither group returning to fasting levels by 10 h.
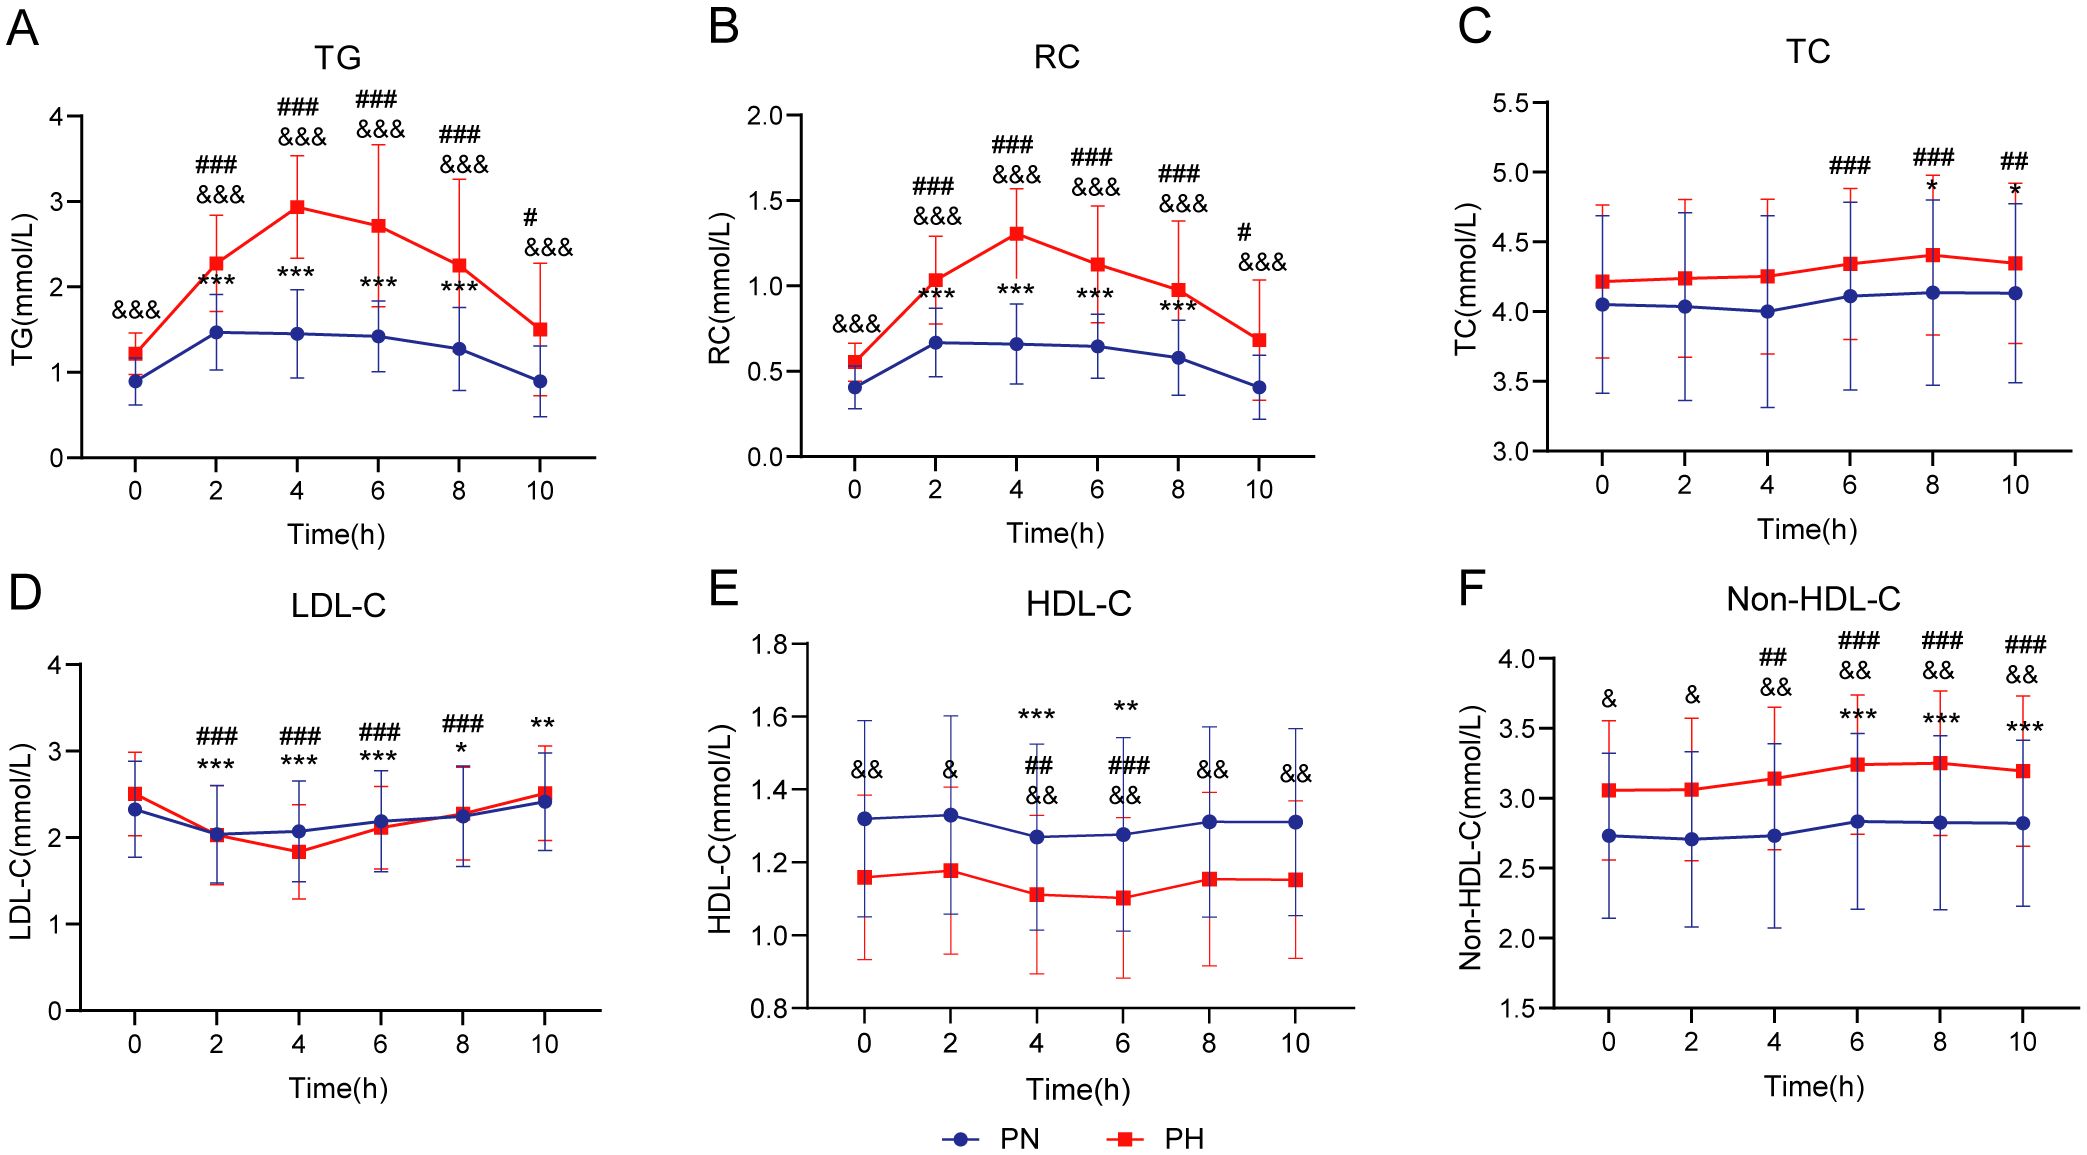
Figure 2. Lipid profile changes during oral fat tolerance tests among individuals stratified by postprandial triglyceride levels. (A) Triglyceride (TG). (B) Remnant cholesterol (RC). (C) Total cholesterol (TC). (D) Low-density lipoprotein cholesterol (LDL-C). (E) High-density lipoprotein cholesterol (HDL-C). (F) Non-HDL-C. Data are presented as mean ± standard deviation. Statistical significance is indicated as follows: *P < 0.05, **P < 0.01, and ***P < 0.001 compared to the fasting level in the postprandial normal triglyceride (PN) group, #P < 0.05, ##P < 0.01, and ###P < 0.001 compared to the fasting level in the postprandial hypertriglyceridemia (PH) group, and &P < 0.05, &&P < 0.01, and &&&P < 0.001 compared to the corresponding time point in the PN group. Two-way repeated-measures analysis of variance was used to compare the effects of time and group on blood lipid levels during the oral fat tolerance tests, using the Šidák method for multiple comparisons.
Table 2 summarizes the clinical data of participants with and without CAS at baseline and follow-up. At both time points, age, BMI, fasting TG, RC levels, and cIMT were significantly higher in the CAS group than in the non-CAS group (P < 0.05). The baseline HDL-C level was significantly lower in the CAS group than in the non-CAS group (P = 0.007); however, no significant difference was observed at follow-up (P = 0.140). At follow-up, fasting blood glucose (FBG) and HbA1c levels were significantly higher in the CAS group; in contrast, no significant differences were found at baseline (P < 0.05). No statistically significant differences in sex, SBP, DBP, TC, LDL-C, or non-HDL-C levels were observed between the groups at either baseline or follow-up (P > 0.05).
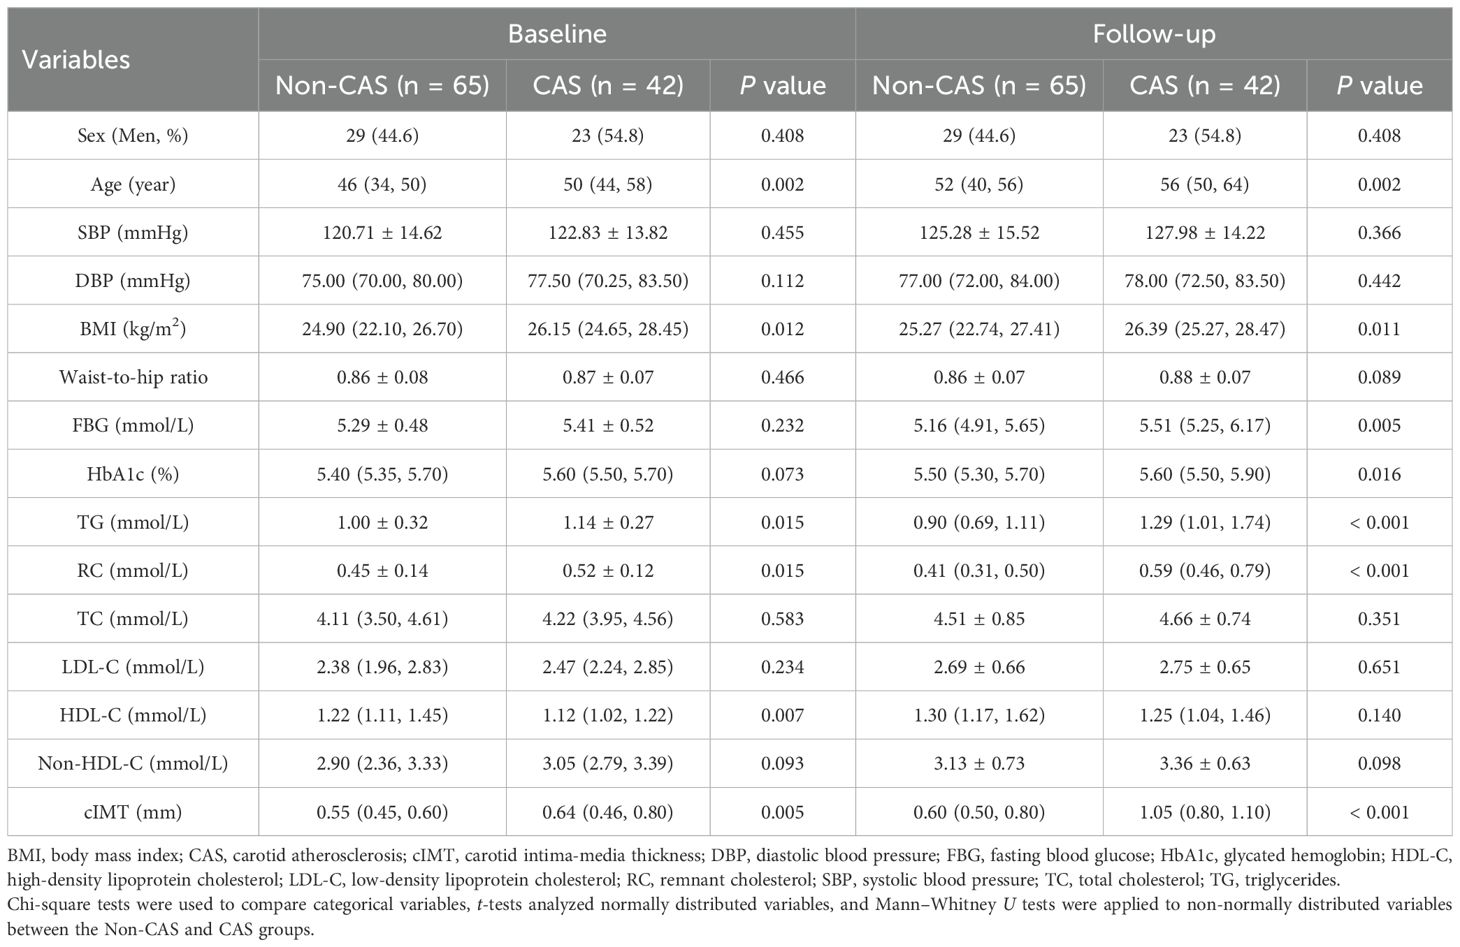
Table 2. Clinical characteristics of the participants with and without CAS.
Figure 3 illustrates the blood lipid changes during the OFTT in the non-CAS and CAS groups. Fasting TG and RC levels did not significantly differ between the groups. However, from 2 to 10 h postprandially, TG and RC levels were significantly higher in the CAS group than in the non-CAS group (P < 0.05). No significant differences in TC, LDL-C, HDL-C, or non-HDL-C levels were observed between the groups at any time point. Following the high-fat meal, both groups experienced increases in TG and RC levels, peaking at 4 h. In the non-CAS group, these levels returned to fasting levels by 8 h, whereas in the CAS group, they remained significantly elevated even at 10 h (P < 0.05). Postprandial TC levels were significantly higher than fasting levels from 8 to 10 h in the non-CAS group (P < 0.05) and from 6 to 10 h in the CAS group (P < 0.05). Postprandial LDL-C and HDL-C levels reached their lowest points at 4 h in both groups and returned to fasting levels within 10 h. Postprandial non-HDL-C levels increased from 6 to 10 h in the non-CAS group and from 4 to 10 h in the CAS group, with neither group returning to fasting levels by 10 h.
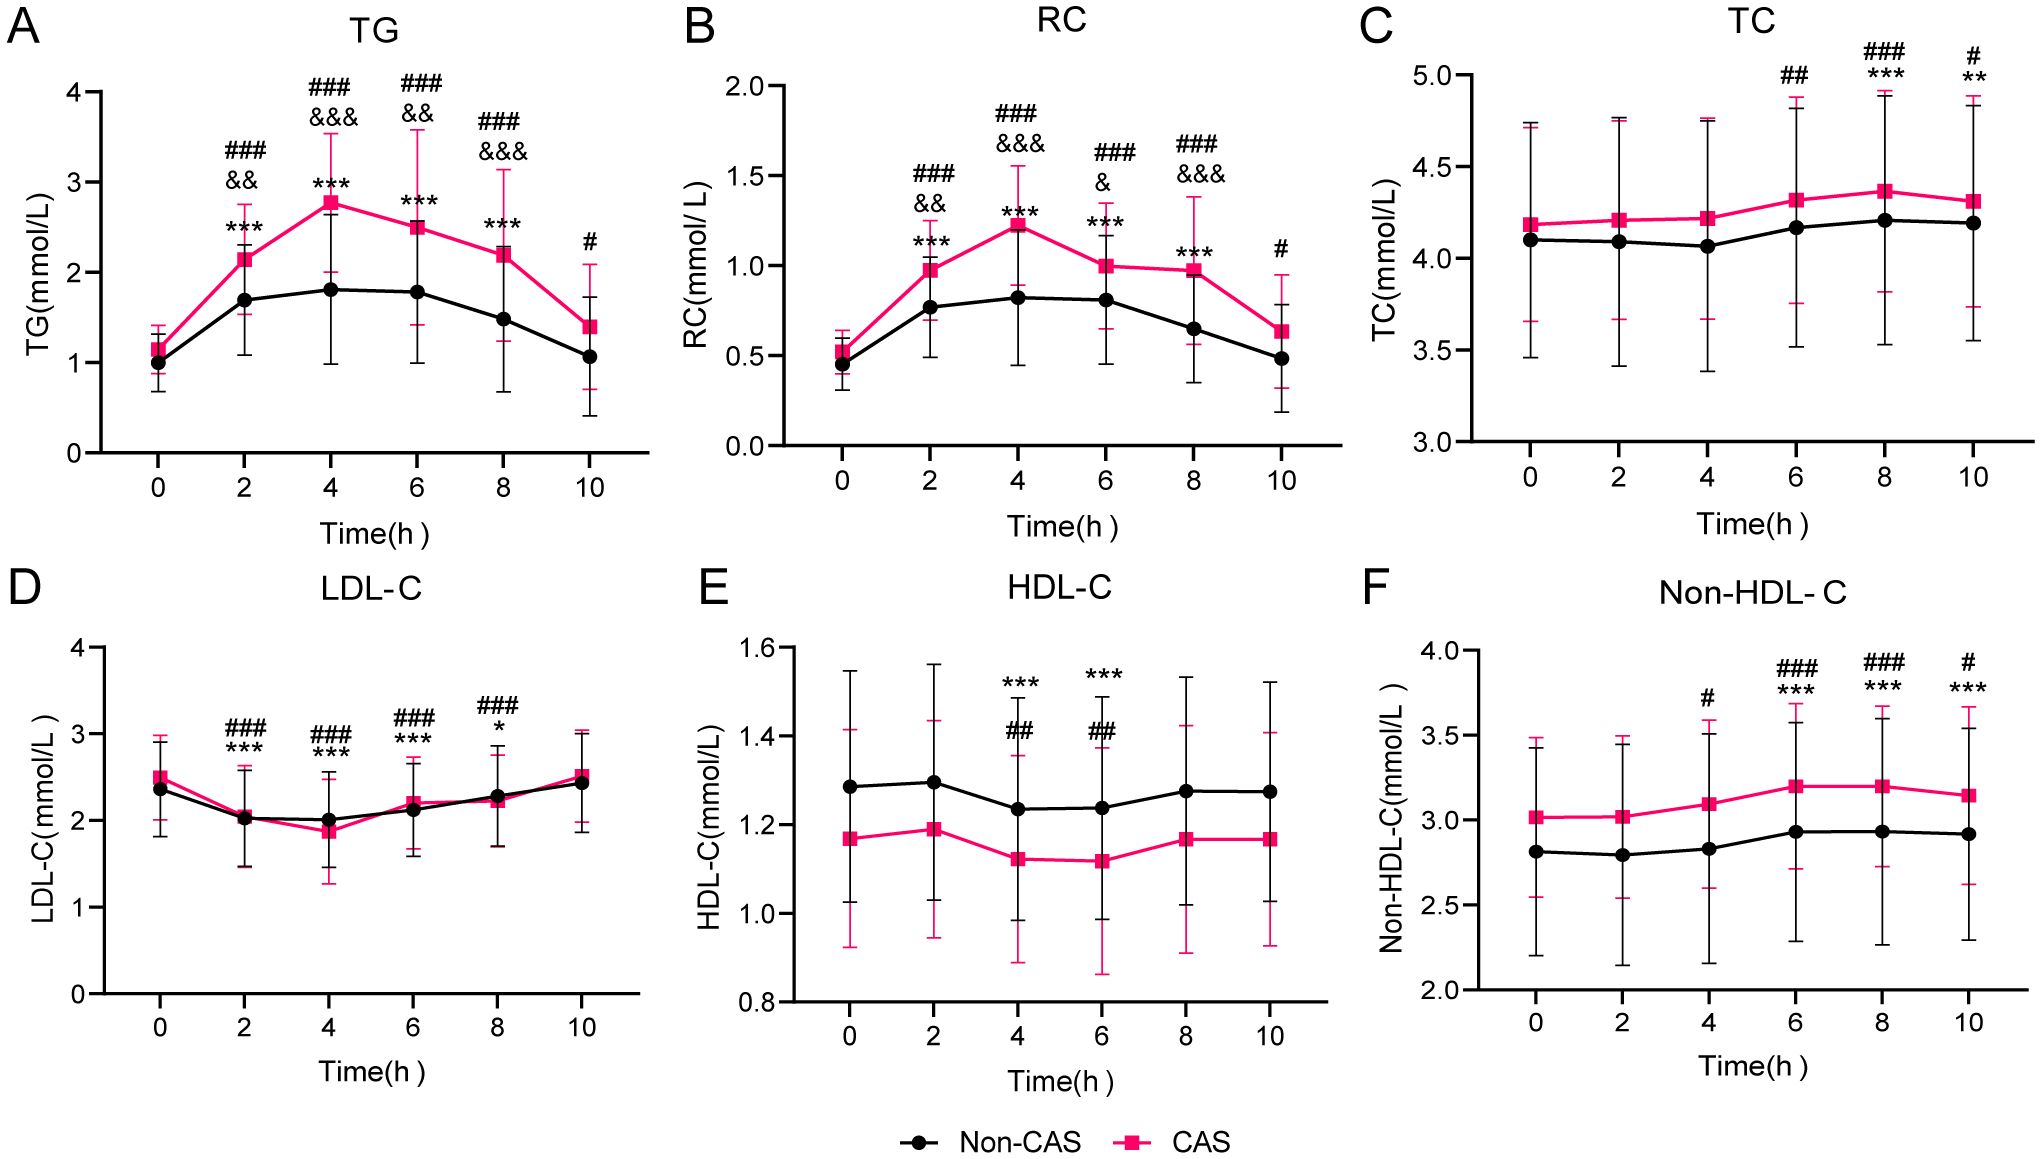
Figure 3. Lipid profile changes during oral fat tolerance tests among individuals stratified by carotid atherosclerosis (CAS) status. (A) Triglyceride (TG). (B) Remnant cholesterol (RC). (C) Total cholesterol (TC). (D) Low-density lipoprotein cholesterol (LDL-C). (E) High-density lipoprotein cholesterol (HDL-C). (F) Non-HDL-C. Statistical significance is indicated as follows: *P < 0.05, **P < 0.01, and ***P < 0.001 compared to the fasting level in the Non-CAS group, #P < 0.05, ##P < 0.01, and ###P < 0.001 compared to the fasting level in the CAS group, and &P < 0.05, &&P < 0.01, and &&&P < 0.001 compared to the corresponding time point in the Non-CAS group. Two-way repeated-measures analysis of variance was used to compare the effects of time and group on blood lipid levels during the oral fat tolerance tests, using the Šidák method for multiple comparisons.
As detailed in Table 3, postprandial TGmax and RCmax values were significantly higher in the CAS group than in the non-CAS group (P < 0.001). Additionally, the proportion of individuals with TGmax > 2.5 mmol/L was significantly greater in the CAS group (P < 0.001).
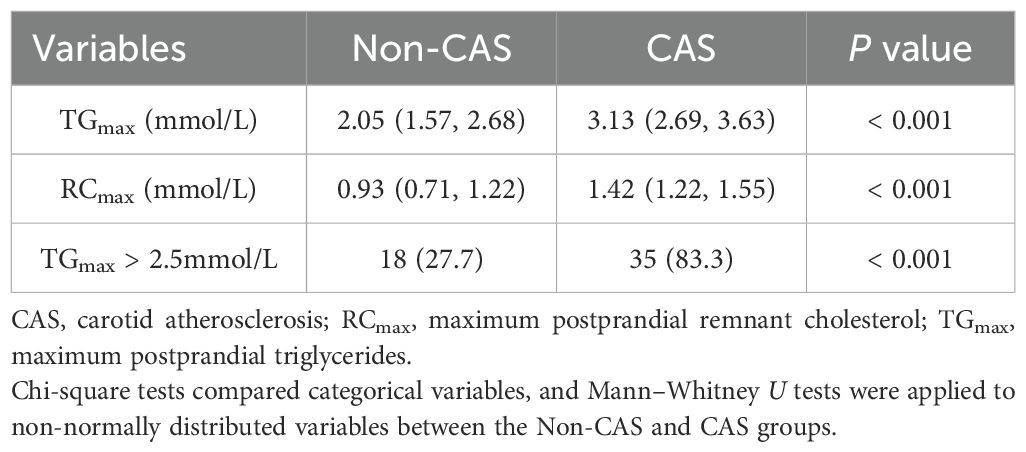
Table 3. Comparison of TGmax and RCmax at any time after meals grouped by CAS.
At baseline, there was no significant difference in the proportion of individuals with CAS across fasting TG groups (P = 0.120) (Figure 1B). However, at follow-up, the proportions of individuals with fasting TG levels ≥ 1.2 mmol/L were significantly higher in the CAS group than in the non-CAS group, compared with the proportions of those with fasting TG < 1.2 mmol/L (P < 0.001) (Figure 1C). Similarly, at both baseline and follow-up, the proportion of individuals with fasting TG levels ≥ 1.2 mmol/L was significantly greater in the PH group than in the PN group (P < 0.001) (Figures 1D, E).
This study found that the CAS group had significantly higher levels of Apo B, Apo C3, hs-CRP, and IL-6 at both fasting and 4 h postprandially compared with the non-CAS group (P < 0.05). Additionally, within each group, 4-h postprandial levels of Apo C3 and IL-6 were significantly higher than the fasting levels (P < 0.05). Details are shown in Table 4.
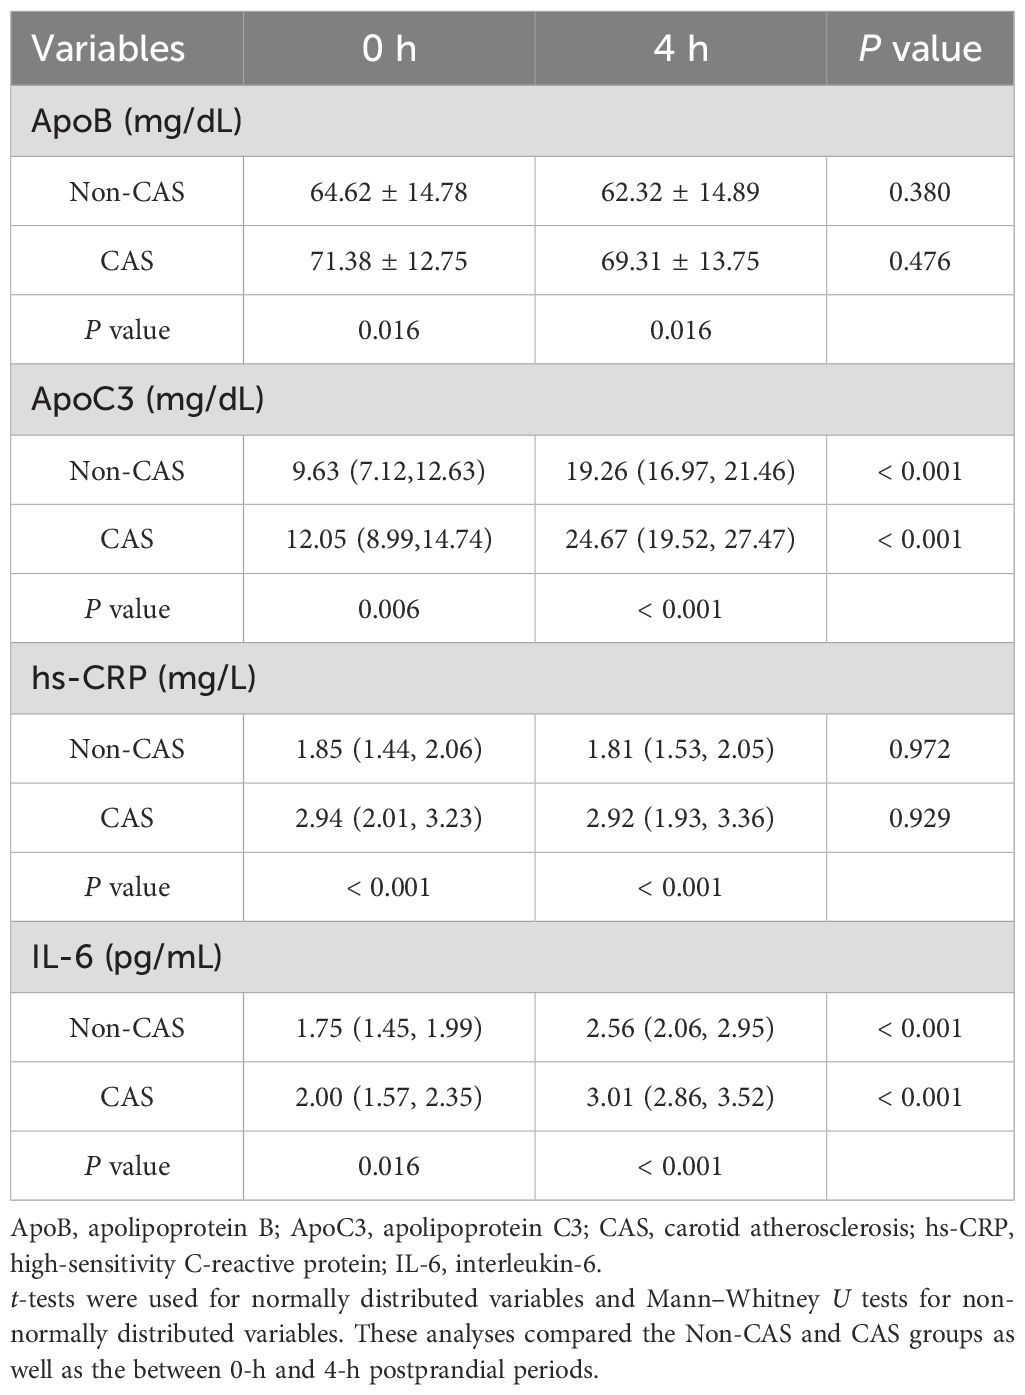
Table 4. Comparison of apolipoprotein and inflammatory marker levels at fasting and 4-h postprandial, grouped by CAS.
Univariate logistic regression models were performed with CAS presence as the dependent variable and various baseline measurements as independent variables. Age had a significant effect on CAS (OR [95% CI] = 1.07 [1.03, 1.12], P = 0.001). Baseline BMI and HDL-C levels also significantly influenced CAS (OR [95% CI] = 1.12 [1.00, 1.24], P = 0.046; OR [95% CI] = 0.14 [0.03, 0.80], P = 0.027, respectively). Significant effects were also observed for baseline ApoB and ApoC3 levels (OR [95% CI] = 1.04 [1.01, 1.07], P = 0.019; OR [95% CI] = 1.17 [1.05, 1.31], P = 0.004, respectively) and for baseline hs-CRP and IL-6 levels (OR [95% CI] = 4.76 [2.45, 9.24], P < 0.001; OR [95% CI] = 2.85 [1.15, 7.03], P = 0.023, respectively). No statistically for waist-to-hip ratio, SBP, DBP, FBG, HbA1c, TC, LDL-C, and non-HDL-C levels (P > 0.05). Details are shown in Table 5.
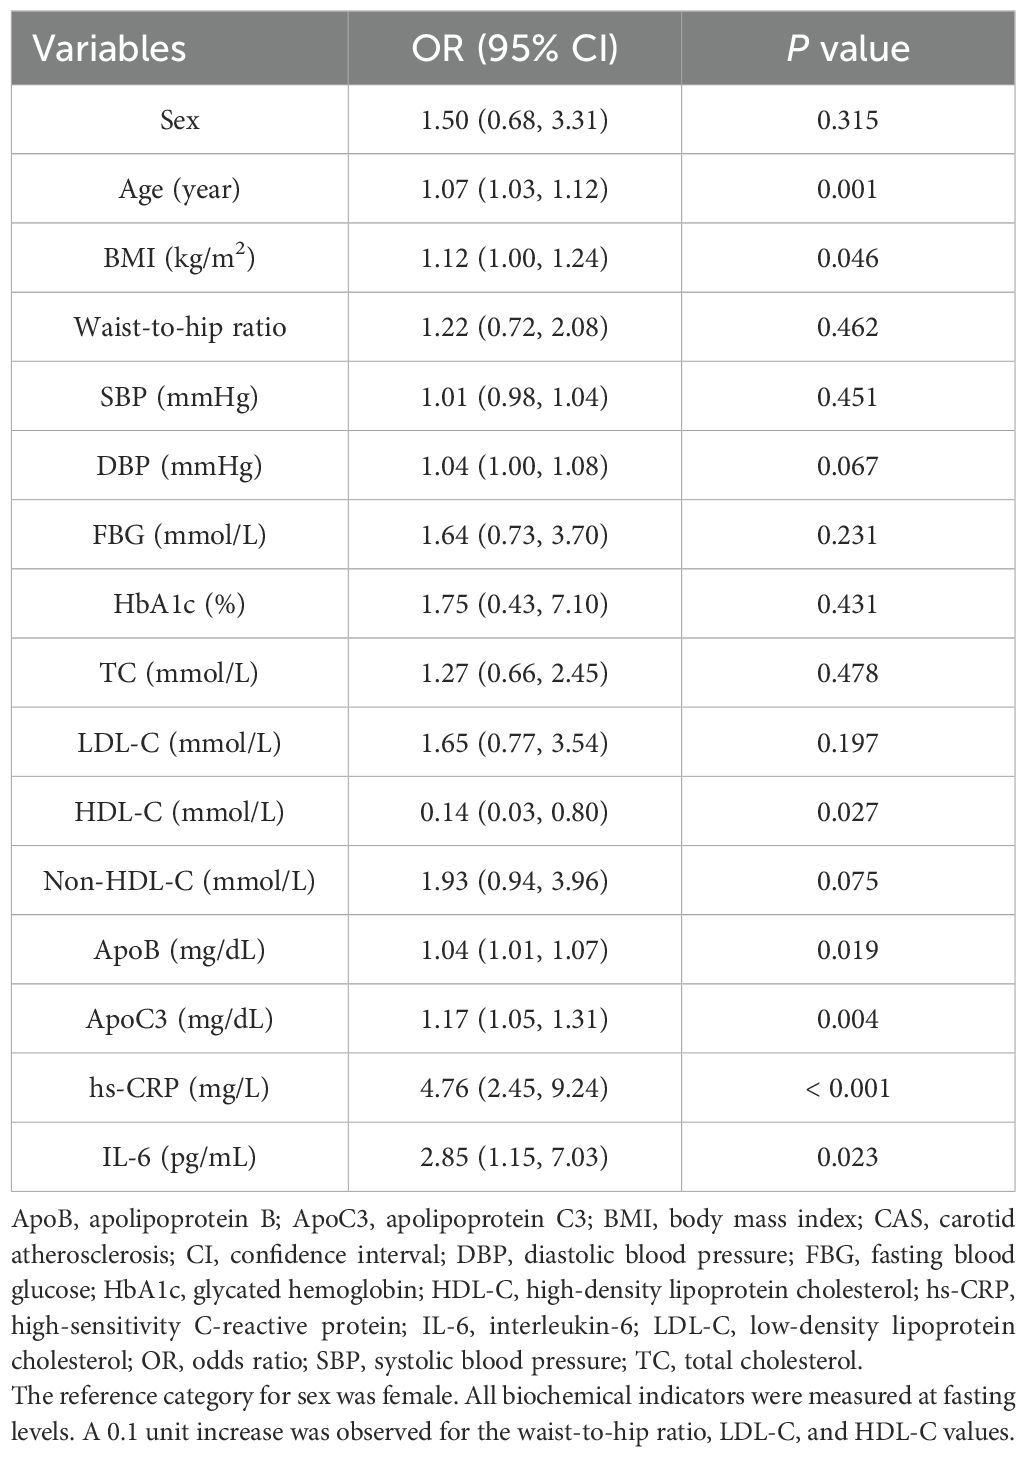
Table 5. Univariate logistic regression of clinical variables with CAS at baseline.
The logistic regression analysis of TG and RC levels in relation to CAS is presented in Table 6. In Model 1 (crude model), all variables (fasting TG, TG4h, TGmax, fasting RC, RC4h, and RCmax) were significantly associated with CAS (P < 0.05). Model 2, adjusted for baseline age and BMI, also showed significant associations for all variables (P < 0.05). In Model 3, further adjusted for fasting HDL-C, TG4h, TGmax, RC4h, and RCmax retained significant associations with CAS (P < 0.001); in contrast, fasting TG and RC did not (P = 0.061). In Model 4, which additionally adjusted for ApoB, ApoC3, hs-CRP, and IL-6 levels, TG4h, TGmax, RC4h, and RCmax remained significantly associated with CAS (P < 0.01); in contrast, fasting TG and RC did not (P = 0.200).
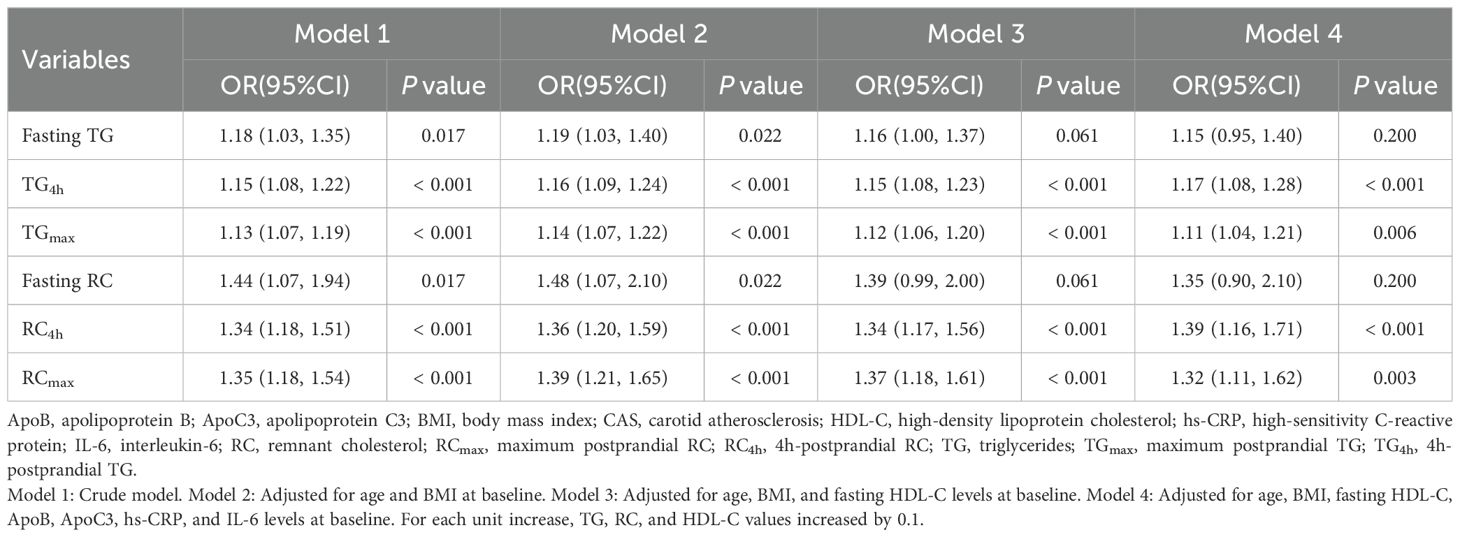
Table 6. Logistic regression of TG and RC levels with CAS.
Subgroup analyses (Table 7) were conducted by sex, age (< 47 and ≥ 47 years), and BMI (< 25 and ≥ 25 kg/m2), using fasting TG, TG4h, TGmax, fasting RC, RC4h, and RCmax as predictors in the regression equations. The results indicated that sex, age, and BMI did not significantly modify the relationships between these lipid parameters and CAS (P for interaction > 0.05).
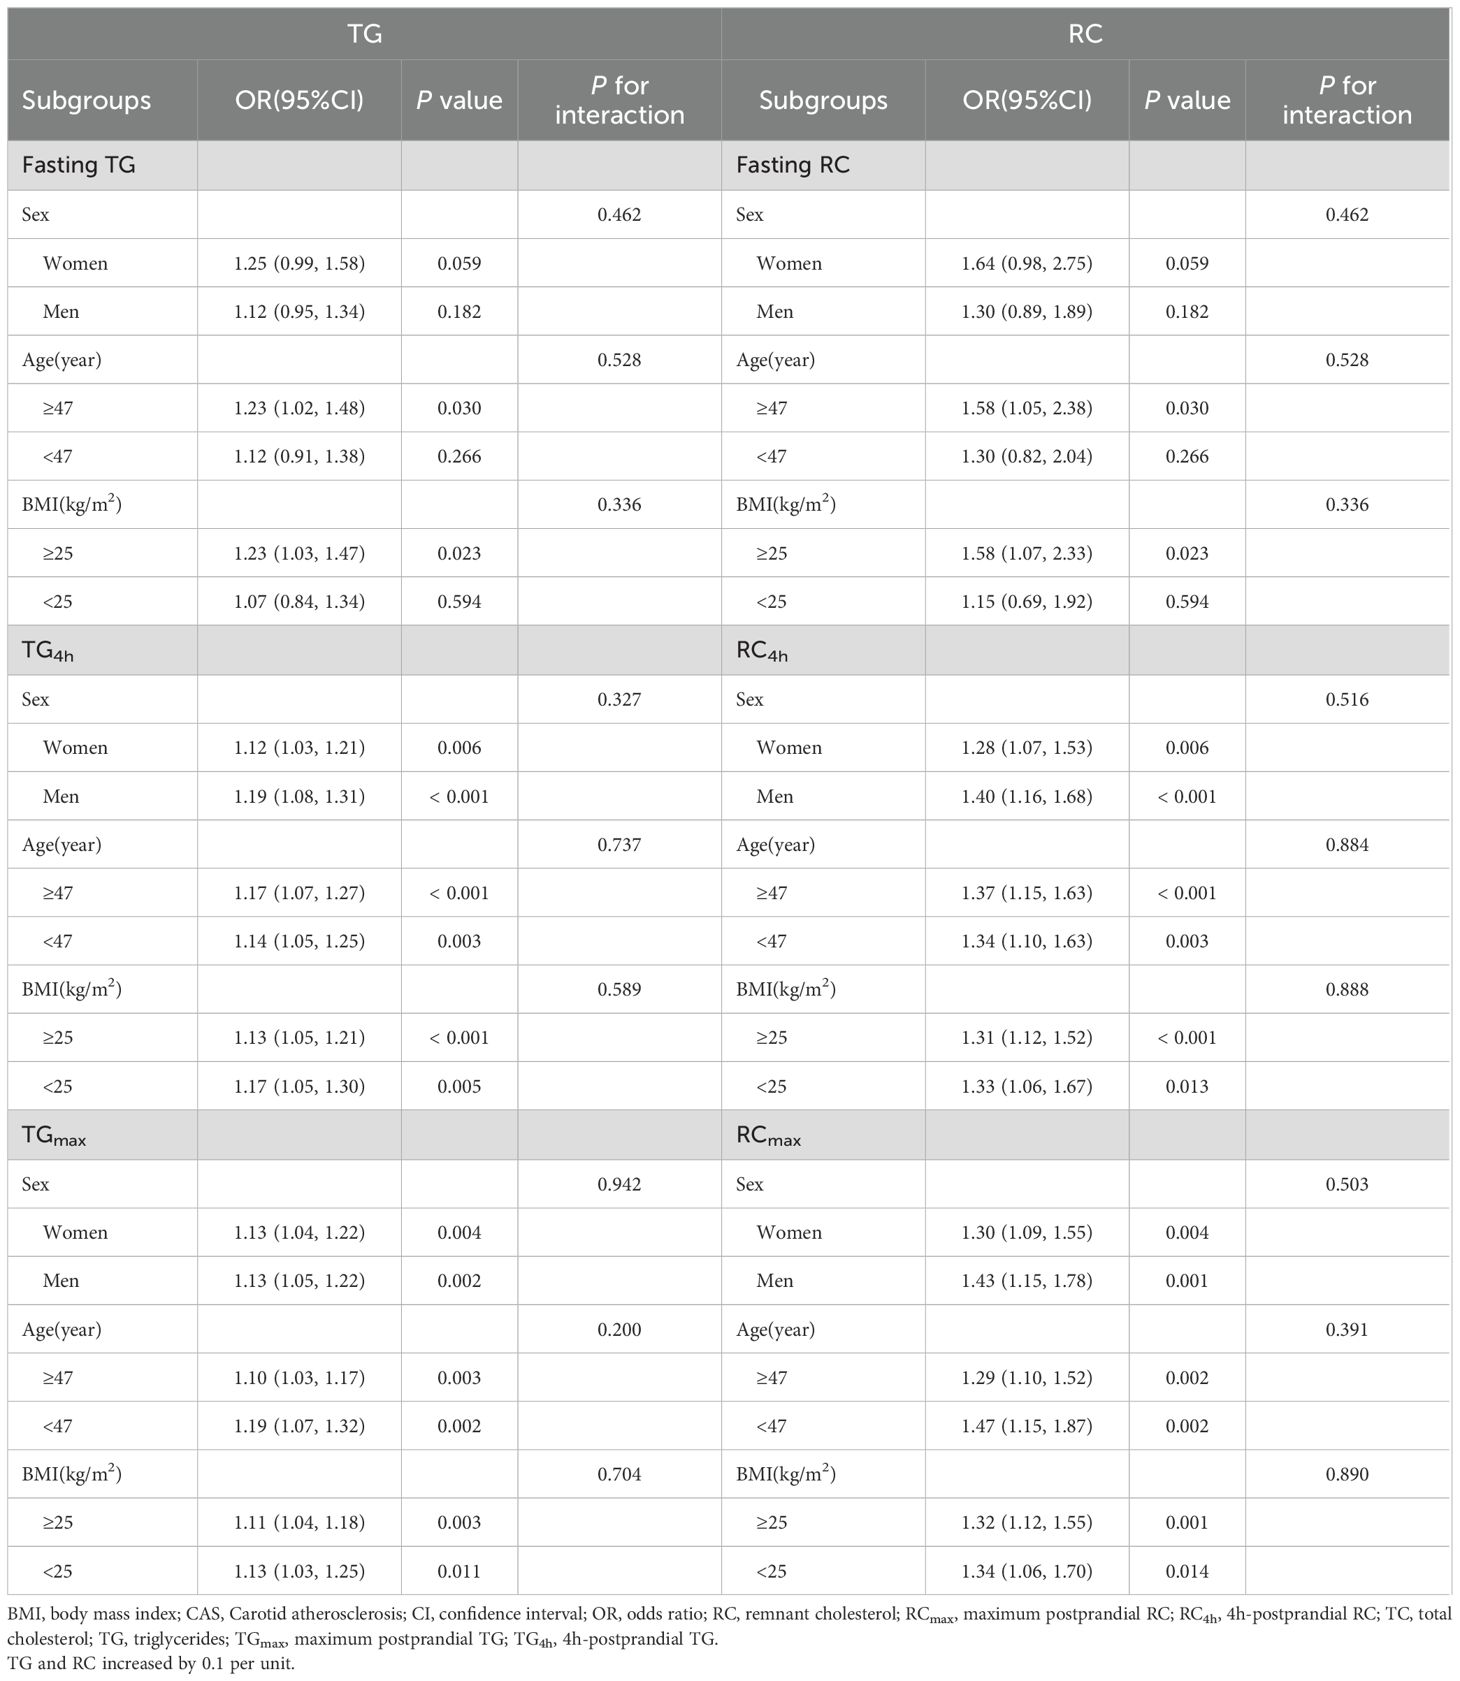
Table 7. Subgroup analysis of TG and RC levels with CAS.
This follow-up study included 107 participants with normal fasting lipid levels and no CAS at baseline. Participants were classified into PN and PH groups based on their postprandial TG levels during the OFTT. Compared to the PN group, the PH group exhibited significantly higher levels of TRL, including TG and RC, in both fasting and postprandial states. Over 6 years, the PH group demonstrated a significantly higher incidence of CAS. Although fasting lipid levels did not differ between the CAS and non-CAS groups, the CAS group showed considerably elevated postprandial TRL levels. A similar study in the Chinese population compared 60 patients with coronary atherosclerotic heart disease and 30 healthy controls. It found that TG and RC levels peaked 4 h after consuming a 50 g fat meal, with patients showing significantly higher fasting and postprandial TG and RC levels than controls (23). Unlike this study, which examined advanced disease, our research focused on early atherosclerosis. The findings revealed that postprandial lipid differences, detectable via the OFTT, may serve as early predictive markers, even when fasting lipid levels remain normal. A Japanese follow-up study involving 115 patients with type 2 diabetes similarly identified postprandial TG levels as an independent risk factor for CAS over 1 year (24). However, that study included participants with baseline lipid abnormalities, hypertension, and medication use; in contrast, our study rigorously excluded such confounding factors, enhancing the reliability of the results.
The 2021 European Atherosclerosis Society consensus identifies optimal fasting TG level as < 1.2 mmol/L and borderline levels as 1.2–1.7 mmol/L (6). Stratification by postprandial TG levels (>2.5 mmol/L) during the baseline OFTT showed a significant increase in the PH group among those with borderline fasting TG levels. This aligns with the consensus that TRL and remnants tend to accumulate in plasma when fasting TG levels exceed 1.2 mmol/L. Notably, there were no significant differences in CAS prevalence across fasting TG groups at baseline; however, CAS incidence was significantly higher in the borderline TG group at follow-up. These findings suggest that fasting TG levels alone are insufficient to predict CAS risk and highlight the utility of postprandial TG assessment via the OFTT. The OFTT provides valuable insights into the development of CAS. Studies show that approximately 75% of individuals with fasting TG levels between 1.0 and 1.7 mmol/L have postprandial TG levels exceeding 2.5 mmol/L, highlighting the utility of the OFTT in this population (25).
The present study identified elevated postprandial TG and RC levels as independent risk factors for CAS, with TGmax and RCmax values significantly higher in the CAS group than in the non-CAS group. These results indicate impaired TRL clearance and remnant metabolism in the CAS population. Consistent with Zilversmit’s 1979 hypothesis that atherosclerosis forms postprandially (26, 27), this study provides robust longitudinal evidence supporting this theory. The baseline OFTT in this study revealed that the primary lipid changes in the postprandial state occurred in TG and RC. When TG levels were < 4.0 mmol/L, RC, primarily calculated from TG levels, exhibited similar postprandial patterns as TG. In contrast, traditional atherogenic indicators such as TC, HDL-C, and non-HDL-C showed no significant changes postprandially, compared to the fasting levels. LDL-C, calculated using the Friedewald formula, displayed an opposite trend—initially decreasing and then increasing—due to the rise and subsequent fall of postprandial TRL.
Extensive cross-sectional research has linked postprandial TRL to CAS and ASCVD. These studies, influenced by diet and the timing of postprandial blood sample collection, can be broadly classified into two categories: OFTT studies using a standard high-fat meal (where fat provides ≥ 50% of total calories) and non-fasting studies conducted under normal dietary conditions. This latter approach is analogous to the oral 75-g glucose tolerance test or random blood sugar measurements used in diabetes diagnosis. Non-fasting blood lipid testing is widely used in large-scale epidemiological studies. The Copenhagen City Heart Study and the Copenhagen General Population Study linked non-fasting TG and RC levels to elevated risks of ischemic heart disease, myocardial infarction, and overall mortality (28–30). Similarly, the U.S. Women’s Health Study identified non-fasting TG as an independent cardiovascular risk factor (7). For patients with coronary artery disease, RC is positively correlated with the risks of all-cause and cardiovascular mortality, as well as major adverse cardiovascular events (31). In Chinese patients with coronary heart disease, both fasting and non-fasting lipid profiles are associated with long-term major adverse cardiovascular events. In addition to fasting LDL-C, low non-fasting HDL-C may also independently predict cardiovascular events (32). The rs662799 locus of apolipoprotein A5 is significantly linked to ASCVD and regulates TG levels, suggesting a causal relationship between the TG metabolic pathway and ASCVD (33). In hypertriglyceridemia, cholesteryl ester transfer protein is activated, promoting the exchange of TG and cholesteryl esters between very-low-density lipoproteins and LDL-C, leading to increased TG levels in LDL-C (34). Elevated TG levels in LDL-C are associated with a higher risk of ASCVD and its components (22).
In small-scale OFTT studies, elevated postprandial TG has been linked to early cardiovascular changes. For example, Grønholdt et al. (35) found that postprandial TRLs were associated with carotid plaque appearance in patients with carotid artery disease. Other studies have shown that TG4h values are a stronger predictor of early CAS than fasting TG or LDL-C levels (36–38). Postprandial lipemia is also associated with endothelial dysfunction, an early marker of atherosclerosis (39, 40). Delay in TG peaks, compared to normal glucose tolerance, are associated with impaired glucose tolerance and type 2 diabetes. Additionally, postprandial TG and ApoB concentrations are positively correlated with cIMT and inversely correlated with the ankle-brachial index (41). In a trial by Mena-Vazquez et al. (42), both rheumatoid arthritis and healthy control groups consumed a mixed meal containing 50 g of fat and 775 kcal. The study found that elevated levels of TG4h were positively correlated with the presence of carotid atherosclerotic plaques and increased inflammatory mediators in the rheumatoid arthritis group.
Inflammatory markers, such as IL-6, impair lipoprotein lipase activity, reducing TRL clearance and increasing plasma TG levels (43). This study found elevated fasting and postprandial levels of IL-6 and hs-CRP in the CAS group, suggesting a chronic inflammatory state (44, 45). Additionally, elevated ApoB and ApoC3 levels were observed in the CAS group, with ApoC3 levels higher postprandially than at fasting. These findings align with previous research linking ApoB and ApoC3 to increased ASCVD risk (26, 41). In this study, TG4h, TGmax, RC4h, and RCmax emerged as independent CAS predictors, even after adjusting for fasting lipid levels, ApoB, ApoC3, hs-CRP, and IL-6. These findings support the potential of postprandial TRL as early biomarkers of CAS.
This study has several strengths. First, strict inclusion criteria excluded confounding factors such as diabetes, hypertension, and baseline lipid abnormalities, ensuring robust results. Second, the standardized OFTT protocol enhanced the reliability of postprandial lipid measurements. Third, the longitudinal design allowed for the identification of metabolic disturbances preceding CAS onset.
However, the study also has some limitations. First, this study was conducted with a relatively small sample size and in a single center. This limitation may have affected the statistical power of subgroup analyses, potentially limiting the generalizability of the findings to other populations. Additionally, the absence of annual follow-ups prevented precise determination of CAS onset. Lifestyle factors during the follow-up period, such as diet and exercise, were not monitored, potentially introducing unmeasured confounders (46).
In conclusion, the OFTT demonstrated significant predictive value for CAS, with postprandial TRL, including TG and RC, serving as early markers in individuals with normal fasting lipid levels. These findings underscore the importance of postprandial lipid metabolism as a screening tool for early atherosclerotic changes. Further research is needed to validate these findings in larger, multicenter cohorts and to explore interventions targeting postprandial lipid disorders for ASCVD prevention.
The original contributions presented in the study are included in the article/Supplementary Material. Further inquiries can be directed to the corresponding author.
The studies involving humans were approved by Hebei General Hospital Ethics Committee. The studies were conducted in accordance with the local legislation and institutional requirements. The participants provided their written informed consent to participate in this study.
YH: Conceptualization, Data curation, Formal analysis, Investigation, Methodology, Software, Writing – original draft, Writing – review & editing. PT: Conceptualization, Formal analysis, Methodology, Writing – review & editing. GS: Conceptualization, Funding acquisition, Methodology, Supervision, Writing – review & editing. AS: Conceptualization, Methodology, Supervision, Writing – original draft. DL: Data curation, Writing – original draft. ZW: Data curation, Writing – original draft. YS: Data curation, Writing – original draft. YT: Data curation, Writing – original draft. XW: Data curation, Writing – original draft. LL: Data curation, Writing – original draft. LR: Supervision, Writing – review & editing.
The author(s) declare that financial support was received for the research, authorship, and/or publication of this article. This work was supported by the National Natural Science Foundation of China (82170878).
We would like to thank Editage (www.editage.cn) for English language editing.
The authors declare that the research was conducted in the absence of any commercial or financial relationships that could be construed as a potential conflict of interest.
The author(s) declare that no Generative AI was used in the creation of this manuscript.
All claims expressed in this article are solely those of the authors and do not necessarily represent those of their affiliated organizations, or those of the publisher, the editors and the reviewers. Any product that may be evaluated in this article, or claim that may be made by its manufacturer, is not guaranteed or endorsed by the publisher.
1. Jebari-Benslaiman S, Galicia-García U, Larrea-Sebal A, Olaetxea JR, Alloza I, Vandenbroeck K, et al. Pathophysiology of atherosclerosis. Int J Mol Sci. (2022) 23:346. doi: 10.3390/ijms23063346
2. Song P, Fang Z, Wang H, Cai Y, Rahimi K, Zhu Y, et al. Global and regional prevalence, burden, and risk factors for carotid atherosclerosis: A systematic review, meta-analysis, and modelling study. Lancet Glob Health. (2020) 8:e721–e9. doi: 10.1016/s2214-109x(20)30117-0
3. Fu J, Deng Y, Ma Y, Man S, Yang X, Yu C, et al. National and provincial-level prevalence and risk factors of carotid atherosclerosis in chinese adults. JAMA Netw Open. (2024) 7:e2351225. doi: 10.1001/jamanetworkopen.2023.51225
4. Stein JH, Korcarz CE, Hurst RT, Lonn E, Kendall CB, Mohler ER, et al. Use of carotid ultrasound to identify subclinical vascular disease and evaluate cardiovascular disease risk: A consensus statement from the american society of echocardiography carotid intima-media thickness task force. Endorsed by the society for vascular medicine. J Am Soc Echocardiogr. (2008) 21:93–111; quiz 89-90. doi: 10.1016/j.echo.2007.11.011
5. Heo JH, Jo SH. Triglyceride-rich lipoproteins and remnant cholesterol in cardiovascular disease. J Korean Med Sci. (2023) 38:e295. doi: 10.3346/jkms.2023.38.e295
6. Ginsberg HN, Packard CJ, Chapman MJ, Borén J, Aguilar-Salinas CA, Averna M, et al. Triglyceride-rich lipoproteins and their remnants: metabolic insights, role in atherosclerotic cardiovascular disease, and emerging therapeutic strategies-a consensus statement from the european atherosclerosis society. Eur Heart J. (2021) 42:4791–806. doi: 10.1093/eurheartj/ehab551
7. Bansal S, Buring JE, Rifai N, Mora S, Sacks FM, Ridker PM. Fasting compared with nonfasting triglycerides and risk of cardiovascular events in women. Jama. (2007) 298:309–16. doi: 10.1001/jama.298.3.309
8. Kolovou GD, Mikhailidis DP, Kovar J, Lairon D, Nordestgaard BG, Ooi TC, et al. Assessment and clinical relevance of non-fasting and postprandial triglycerides: an expert panel statement. Curr Vasc Pharmacol. (2011) 9:258–70. doi: 10.2174/157016111795495549
9. Kolovou GD, Watts GF, Mikhailidis DP, Pérez-Martínez P, Mora S, Bilianou H, et al. Postprandial hypertriglyceridaemia revisited in the era of non-fasting lipid profile testing: A 2019 expert panel statement, main text. Curr Vasc Pharmacol. (2019) 17:498–514. doi: 10.2174/1570161117666190507110519
10. Hou X, Guan Y, Tang Y, Song A, Zhao J, Ren L, et al. A correlation study of the relationships between nonalcoholic fatty liver disease and serum triglyceride concentration after an oral fat tolerance test. Lipids Health Dis. (2021) 20:54. doi: 10.1186/s12944-021-01483-z
11. Liu L, Hou X, Song A, Guan Y, Tian P, Wang C, et al. Oral fat tolerance testing identifies abnormal pancreatic B-cell function and insulin resistance in individuals with normal glucose tolerance. J Diabetes Investig. (2022) 13:1805–13. doi: 10.1111/jdi.13867
12. Li X, Zheng K, Gu W, Hou X, Guan Y, Liu L, et al. Serum fibroblast growth factor 21 level after an oral fat tolerance test is related to postprandial free fatty acid level. Diabetes Metab Syndr Obes. (2023) 16:1567–76. doi: 10.2147/dmso.S410457
13. Li X, Zheng K, Liu L, Zhang T, Gu W, Hou X, et al. Relationship of postprandial fibroblast growth factor 21 with lipids, inflammation and metabolic dysfunction-associated fatty liver disease during oral fat tolerance test. Front Endocrinol (Lausanne). (2024) 15:1343853. doi: 10.3389/fendo.2024.1343853
14. Guan Y, Hou X, Tian P, Ren L, Tang Y, Song A, et al. Elevated levels of apolipoprotein ciii increase the risk of postprandial hypertriglyceridemia. Front Endocrinol (Lausanne). (2021) 12:646185. doi: 10.3389/fendo.2021.646185
15. Yang L, Zhang Z, Zhen Y, Feng J, Chen J, Song G. Sirt3 rs11246020 polymorphism associated postprandial triglyceride dysmetabolism. Diabetes Metab Syndr Obes. (2024) 17:1279–88. doi: 10.2147/dmso.S450962
16. Zhang T, Hou Y, Liu M, Hou X, Tang Y, Ren L, et al. Correlation between the levels of angptl3, angptl4, angptl8 and postprandial triglyceride-rich lipoprotein (Trl). Diabetes Metab Syndr Obes. (2023) 16:3979–93. doi: 10.2147/dmso.S438757
17. Zheng K, Li X, Hou L, Gu W, Hou X, Wang C, et al. Association of serum nod-like receptor protein 3 levels with impaired fat tolerance and hypertriglyceridemia. Endocr J. (2023) 70:529–39. doi: 10.1507/endocrj.EJ22-0563
18. Zheng K, Li X, Rong Y, Wang X, Hou L, Gu W, et al. Serum gamma glutamyltransferase: A biomarker for identifying postprandial hypertriglyceridemia. Diabetes Metab Syndr Obes. (2024) 17:2273–81. doi: 10.2147/dmso.S461876
19. Zhang S, Hong F, Ma C, Yang S. Hepatic lipid metabolism disorder and atherosclerosis. Endocr Metab Immune Disord Drug Targets. (2022) 22:590–600. doi: 10.2174/1871530322666211220110810
20. Ferreira JP, Vasques-Nóvoa F, Neves JS, Zannad F, Leite-Moreira A. Comparison of interleukin-6 and high-sensitivity C-reactive protein for cardiovascular risk assessment: findings from the mesa study. Atherosclerosis. (2024) 390:117461. doi: 10.1016/j.atherosclerosis.2024.117461
21. Li JJ, Zhao SP, Zhao D, Lu GP, Peng DQ, Liu J, et al. 2023 chinese guideline for lipid management. Front Pharmacol. (2023) 14:1190934. doi: 10.3389/fphar.2023.1190934
22. Balling M, Afzal S, Davey Smith G, Varbo A, Langsted A, Kamstrup PR, et al. Elevated ldl triglycerides and atherosclerotic risk. J Am Coll Cardiol. (2023) 81:136–52. doi: 10.1016/j.jacc.2022.10.019
23. Xu J, Chen YQ, Zhao SP, Liu L. Determination of optimal cut-off points after a high-fat meal corresponding to fasting elevations of triglyceride and remnant cholesterol in chinese subjects. Lipids Health Dis. (2019) 18:206. doi: 10.1186/s12944-019-1146-9
24. Idei M, Hirayama S, Miyake N, Kon M, Horiuchi Y, Ueno T, et al. Mean postprandial triglyceride concentration is an independent risk factor for carotid atherosclerosis in patients with type 2 diabetes. Clin Chim Acta. (2014) 430:134–9. doi: 10.1016/j.cca.2013.12.022
25. Hou X, Song A, Guan Y, Tian P, Ren L, Tang Y, et al. Identification of the chinese population that can benefit most from postprandial lipid testing: validation of the use of oral fat tolerance testing in clinical practice. Front Endocrinol (Lausanne). (2022) 13:831435. doi: 10.3389/fendo.2022.831435
26. Gugliucci A. The chylomicron saga: time to focus on postprandial metabolism. Front Endocrinol (Lausanne). (2023) 14:1322869. doi: 10.3389/fendo.2023.1322869
27. Zilversmit DB. Atherogenesis: A postprandial phenomenon. Circulation. (1979) 60:473–85. doi: 10.1161/01.cir.60.3.473
28. Nordestgaard BG, Benn M, Schnohr P, Tybjaerg-Hansen A. Nonfasting triglycerides and risk of myocardial infarction, ischemic heart disease, and death in men and women. Jama. (2007) 298:299–308. doi: 10.1001/jama.298.3.299
29. Freiberg JJ, Tybjaerg-Hansen A, Jensen JS, Nordestgaard BG. Nonfasting triglycerides and risk of ischemic stroke in the general population. Jama. (2008) 300:2142–52. doi: 10.1001/jama.2008.621
30. Wadström BN, Pedersen KM, Wulff AB, Nordestgaard BG. Elevated remnant cholesterol, plasma triglycerides, and cardiovascular and non-cardiovascular mortality. Eur Heart J. (2023) 44:1432–45. doi: 10.1093/eurheartj/ehac822
31. Drexel H, Mader A, Larcher B, Festa A, Vonbank A, Fraunberger P, et al. Remnant cholesterol and long-term incidence of death in coronary artery disease patients. Atherosclerosis. (2024) 401:119048. doi: 10.1016/j.atherosclerosis.2024.119048
32. Zhang J, Tang Z, Jiang J, Huang S, Zeng H, Gu J, et al. Clinical and prognostic value of non-fasting lipoproteins and apolipoproteins in chinese patients with coronary heart disease. Rev Cardiovasc Med. (2023) 24:314. doi: 10.31083/j.rcm2411314
33. Sarwar N, Sandhu MS, Ricketts SL, Butterworth AS, Di Angelantonio E, Boekholdt SM, et al. Triglyceride-mediated pathways and coronary disease: collaborative analysis of 101 studies. Lancet. (2010) 375:1634–9. doi: 10.1016/s0140-6736(10)60545-4
34. Miller M. Low-density lipoprotein triglycerides: widening the atherogenic landscape in cvd risk assessment. J Am Coll Cardiol. (2018) 72:170–2. doi: 10.1016/j.jacc.2018.03.541
35. Grønholdt ML, Nordestgaard BG, Nielsen TG, Sillesen H. Echolucent carotid artery plaques are associated with elevated levels of fasting and postprandial triglyceride-rich lipoproteins. Stroke. (1996) 27:2166–72. doi: 10.1161/01.str.27.12.2166
36. Boquist S, Ruotolo G, Tang R, Björkegren J, Bond MG, de Faire U, et al. Alimentary lipemia, postprandial triglyceride-rich lipoproteins, and common carotid intima-media thickness in healthy, middle-aged men. Circulation. (1999) 100:723–8. doi: 10.1161/01.cir.100.7.723
37. Teno S, Uto Y, Nagashima H, Endoh Y, Iwamoto Y, Omori Y, et al. Association of postprandial hypertriglyceridemia and carotid intima-media thickness in patients with type 2 diabetes. Diabetes Care. (2000) 23:1401–6. doi: 10.2337/diacare.23.9.1401
38. Chen X, Tian H, Liu R. Association between fasting and postprandial triglyceride levels and carotid intima-media thickness in type 2 diabetes patients. Chin Med J (Engl). (2003) 116:1933–5.
39. Baynham R, Veldhuijzen van Zanten J, Rendeiro C. Cocoa Flavanols Rescue Stress-Induced Declines in Endothelial Function after a High-Fat Meal, but Do Not Affect Cerebral Oxygenation During Stress in Young, Healthy Adults. Food Funct. (2024) 15:11472–90. doi: 10.1039/d4fo03834g
40. Wilson ML, Lane KE, Fadel A, Dawson EA, Moore E, Mazidi M, et al. Effects of single low-carbohydrate, high-fat meal consumption on postprandial lipemia and markers of endothelial dysfunction: A systematic review of current evidence. Nutr Rev. (2024) 83:e1049–e1067. doi: 10.1093/nutrit/nuae103
41. Lim S, Kim YJ, Khang AR, Eckel RH. Postprandial dyslipidemia after a standardized high-fat meal in bmi-matched healthy individuals, and in subjects with prediabetes or type 2 diabetes. Clin Nutr. (2021) 40:5538–46. doi: 10.1016/j.clnu.2021.09.004
42. Mena-Vázquez N, Rojas-Gimenez M, Jimenez Nuñez FG, Manrique-Arija S, Rioja J, Ruiz-Limón P, et al. Postprandial apolipoprotein B48 is associated with subclinical atherosclerosis in patients with rheumatoid arthritis. J Clin Med. (2020) 9:2483. doi: 10.3390/jcm9082483
43. Bravo-Núñez Á, Valéro R, Reboul E. Evaluating the roles of food matrix, lipid micronutrients and bioactives in controlling postprandial hypertriglyceridaemia and inflammation. Nutr Res Rev. (2024), 1–14. doi: 10.1017/s0954422424000155
44. Hall WL, Alkoblan A, Gibson PS, D’Annibale M, Coekaerts A, Bauer M, et al. Postprandial lipid and vascular responses following consumption of a commercially-relevant interesterified palmitic acid-rich spread in comparison to functionally-equivalent non-interesterified spread and spreadable butter: A randomised controlled trial in healthy adults. Food Funct. (2024) 15:2733–50. doi: 10.1039/d3fo05324e
45. Donate-Correa J, Ferri CM, Martín-Núñez E, Pérez-Delgado N, González-Luis A, Mora-Fernández C, et al. Klotho as a biomarker of subclinical atherosclerosis in patients with moderate to severe chronic kidney disease. Sci Rep. (2021) 11:15877. doi: 10.1038/s41598-021-95488-4
Keywords: atherosclerotic cardiovascular disease, carotid atherosclerosis, remnant cholesterol, triglycerides, postprandial, oral fat tolerance test
Citation: Hou Y, Tian P, Song G, Song A, Liu D, Wang Z, Shi Y, Tang Y, Wang X, Li L and Ren L (2025) Postprandial triglyceride-rich lipoproteins as predictors of carotid atherosclerosis in individuals with normal fasting lipid profiles: a prospective follow-up study. Front. Endocrinol. 16:1502792. doi: 10.3389/fendo.2025.1502792
Received: 27 September 2024; Accepted: 07 February 2025;
Published: 25 February 2025.
Edited by:
Haibin Li, Capital Medical University, ChinaReviewed by:
Ming Liu, Tianjin Medical University General Hospital, ChinaCopyright © 2025 Hou, Tian, Song, Song, Liu, Wang, Shi, Tang, Wang, Li and Ren. This is an open-access article distributed under the terms of the Creative Commons Attribution License (CC BY). The use, distribution or reproduction in other forums is permitted, provided the original author(s) and the copyright owner(s) are credited and that the original publication in this journal is cited, in accordance with accepted academic practice. No use, distribution or reproduction is permitted which does not comply with these terms.
*Correspondence: Guangyao Song, c2d1YW5neWFvMkAxNjMuY29t; Luping Ren, cmVubHVwaW5nMTEyMkAxNjMuY29t
Disclaimer: All claims expressed in this article are solely those of the authors and do not necessarily represent those of their affiliated organizations, or those of the publisher, the editors and the reviewers. Any product that may be evaluated in this article or claim that may be made by its manufacturer is not guaranteed or endorsed by the publisher.
Research integrity at Frontiers
Learn more about the work of our research integrity team to safeguard the quality of each article we publish.