
94% of researchers rate our articles as excellent or good
Learn more about the work of our research integrity team to safeguard the quality of each article we publish.
Find out more
ORIGINAL RESEARCH article
Front. Endocrinol., 21 March 2025
Sec. Clinical Diabetes
Volume 16 - 2025 | https://doi.org/10.3389/fendo.2025.1500993
 Xin Huang1,2†
 Shiming He1,2†
 Chao Wang1,2†
 Guoan Jian1Kun Jiang1Zihao Lu1Wei Wang1*
 Guotai Sheng2*
 Yang Zou1*
Objective: Prediabetes is a chronic condition characterized by elevated blood glucose levels that are not yet high enough to be classified as diabetes. It is particularly prevalent among middle-aged and elderly populations. This study aims to investigate the association between a novel marker of insulin resistance-the estimated glucose disposal rate (eGDR)-and the reversion of prediabetes to normoglycaemia or progression to diabetes in a Chinese population.
Methods: This prospective cohort study utilized baseline data from the 2011 China Health and Retirement Longitudinal Study involving 2,600 prediabetic participants aged 45 years and older, along with follow-up data from 2015. The study’s endpoints were defined according to the American Diabetes Association criteria, including maintenance of the prediabetic state, reversion to normoglycaemia, or progression to diabetes. Multivariable Cox regression models and restricted cubic spline regression were used to assess the association between eGDR and the reversion or progression of prediabetes in middle-aged and elderly populations, followed by stratified analyses to explore potential population-specific dependencies.
Results: Over a median follow-up period of 4 years, 1,615 (62.1%) participants remained in the prediabetic state, 586 (22.5%) reverted to normoglycaemia, and 399 (15.3%) progressed to diabetes. In multivariable Cox regression analyses, our results indicated that eGDR was positively associated with the reversion of prediabetes to normoglycaemia [Hazard Ratio = 1.14, 95% Confidence Interval: 1.05, 1.23], and negatively associated with the progression of prediabetes to diabetes (HR = 0.81, 95% CI: 0.70, 0.93). Restricted cubic spline analysis revealed a nonlinear, L-shaped association between eGDR and the reversion of prediabetes to normoglycaemia, with segmented Cox regression identifying an eGDR threshold of 6.81 as the point of significant change in the likelihood of prediabetes reversion.
Conclusion: This prospective cohort study among middle-aged and elderly Chinese populations suggested that higher eGDR promoted the reversion of prediabetes and provided a protective effect against its progression to diabetes.
Diabetes is a metabolic disorder characterized by chronic hyperglycemia and is closely associated with increased mortality rates (1). According to data from the International Diabetes Federation, the global prevalence of diabetes was 10.5% in 2021, and it is projected to rise to 12.2% over the next 24 years (2). Given the large and growing number of individuals with diabetes, there is an urgent need to develop effective strategies for the prevention of this disease. Prediabetes is an intermediate stage between normoglycaemia and diabetes, and it is used to identify individuals at high risk for future diabetes (3). Studies have shown that prediabetes represents the optimal stage for intervention in the worsening trajectory of blood glucose levels (4). Several completed randomized controlled trials have demonstrated that lifestyle and pharmacological interventions can effectively control the progression of prediabetes, thereby reducing the incidence of diabetes and cardiovascular complications (5–7). Even a temporary reversion to normoglycaemia in individuals with prediabetes is significantly associated with a reduced incidence of diabetes (8). Therefore, early identification of modifiable factors influencing the reversion of prediabetes to normoglycaemia or its progression to diabetes is crucial for reducing the burden of diseases related to impaired glucose metabolism.
IR is a pathophysiological condition characterized by reduced responsiveness of target organs or tissues to insulin, leading to impaired glucose utilization. It is a significant risk factor for the development of diabetes and cardiovascular diseases (9). Early monitoring and control of IR are vital for the reversion or progression of prediabetes. The Hyperglycemic-Euglycemic Glucose Clamp (HEGC) technique is considered the gold standard for assessing IR, and evaluating insulin sensitivity by measuring the Glucose Disposal Rate (GDR) (10). However, HEGC is invasive, relatively complex, and time-consuming, making it impractical for routine clinical practice (10, 11). To address this limitation, researchers have derived an estimated GDR (eGDR) based on HEGC data, calculated as 21.158 − [0.09 × waist circumference (WC, cm)] − [3.407 × hypertension (yes = 1, no = 0)] − [0.551 × hemoglobin A1c (HbA1c, %)], which can be utilized for assessing insulin sensitivity (12). To date, eGDR as a measure of IR has been validated in numerous related studies across various ethnic groups (13–19). In summary, eGDR can serve as a surrogate marker for IR in assessing various study outcomes in both diabetic and non-diabetic patients. Compared to HEGC, eGDR holds greater potential as a tool for epidemiological studies and clinical practice applications. It should be noted that although a substantial body of research has provided evidence for the use of eGDR as a surrogate for IR in both diabetic and non-diabetic populations, it remains unclear whether eGDR can be utilized for risk assessment of diabetes as a study outcome. Additionally, we lack understanding of the role of eGDR in the transition from hyperglycemia to normoglycemia. Addressing these issues will facilitate a deeper understanding of the associative relationship between eGDR and glucose metabolism, which is crucial for enhancing the application and awareness of eGDR. To address this issue, this study aims to explore the association between eGDR and the reversion or progression of prediabetes using data from the large longitudinal China Health and Retirement Longitudinal Study (CHARLS) cohort in China.
CHARLS is a nationally representative longitudinal survey conducted in mainland China, primarily targeting middle-aged and elderly populations. The survey assesses demographic background, health status and function, social and economic conditions, and retirement information (20). The detailed study design is summarized in the online Supplementary Methods. In brief, the nationwide CHARLS survey was conducted from 2011-2012, employing geographic information system software and a multistage probability sampling method to construct the sample set. A total of 17,708 individuals were recruited from 28 provinces, 150 counties, and 450 villages/communities. Follow-up surveys have been conducted every 2-3 years, and to date, CHARLS has released five waves of longitudinal survey data. It should be noted that multistage probability sampling is a step-by-step sampling method particularly suited to large-scale surveys. Its core concept involves dividing the population into multiple stages, progressively narrowing the scope until the final sample is selected.
Specific information about the CHARLS cohort survey questionnaire has been described elsewhere (20). For this study, we utilized data from 2011-2012 (Wave 1) and 2015-2016 (Wave 3) CHARLS surveys (N=14,226) for statistical analysis, as these two waves included blood sample information necessary for evaluating glucose metabolism. Based on the study objectives, the following exclusion criteria were applied: participants with missing glucose or HbA1c data at baseline (N=4,338) were excluded first, followed by those with normoglycaemia or diagnosed diabetes at baseline (N=1,479). Additionally, we excluded participants with uncertain hypertension status (N=11), missing WC data (N=338), and those without glucose or HbA1c measurements at follow-up (N=999). Ultimately, 2,600 individuals were included in the current study. The detailed study flow is illustrated in Figure 1.
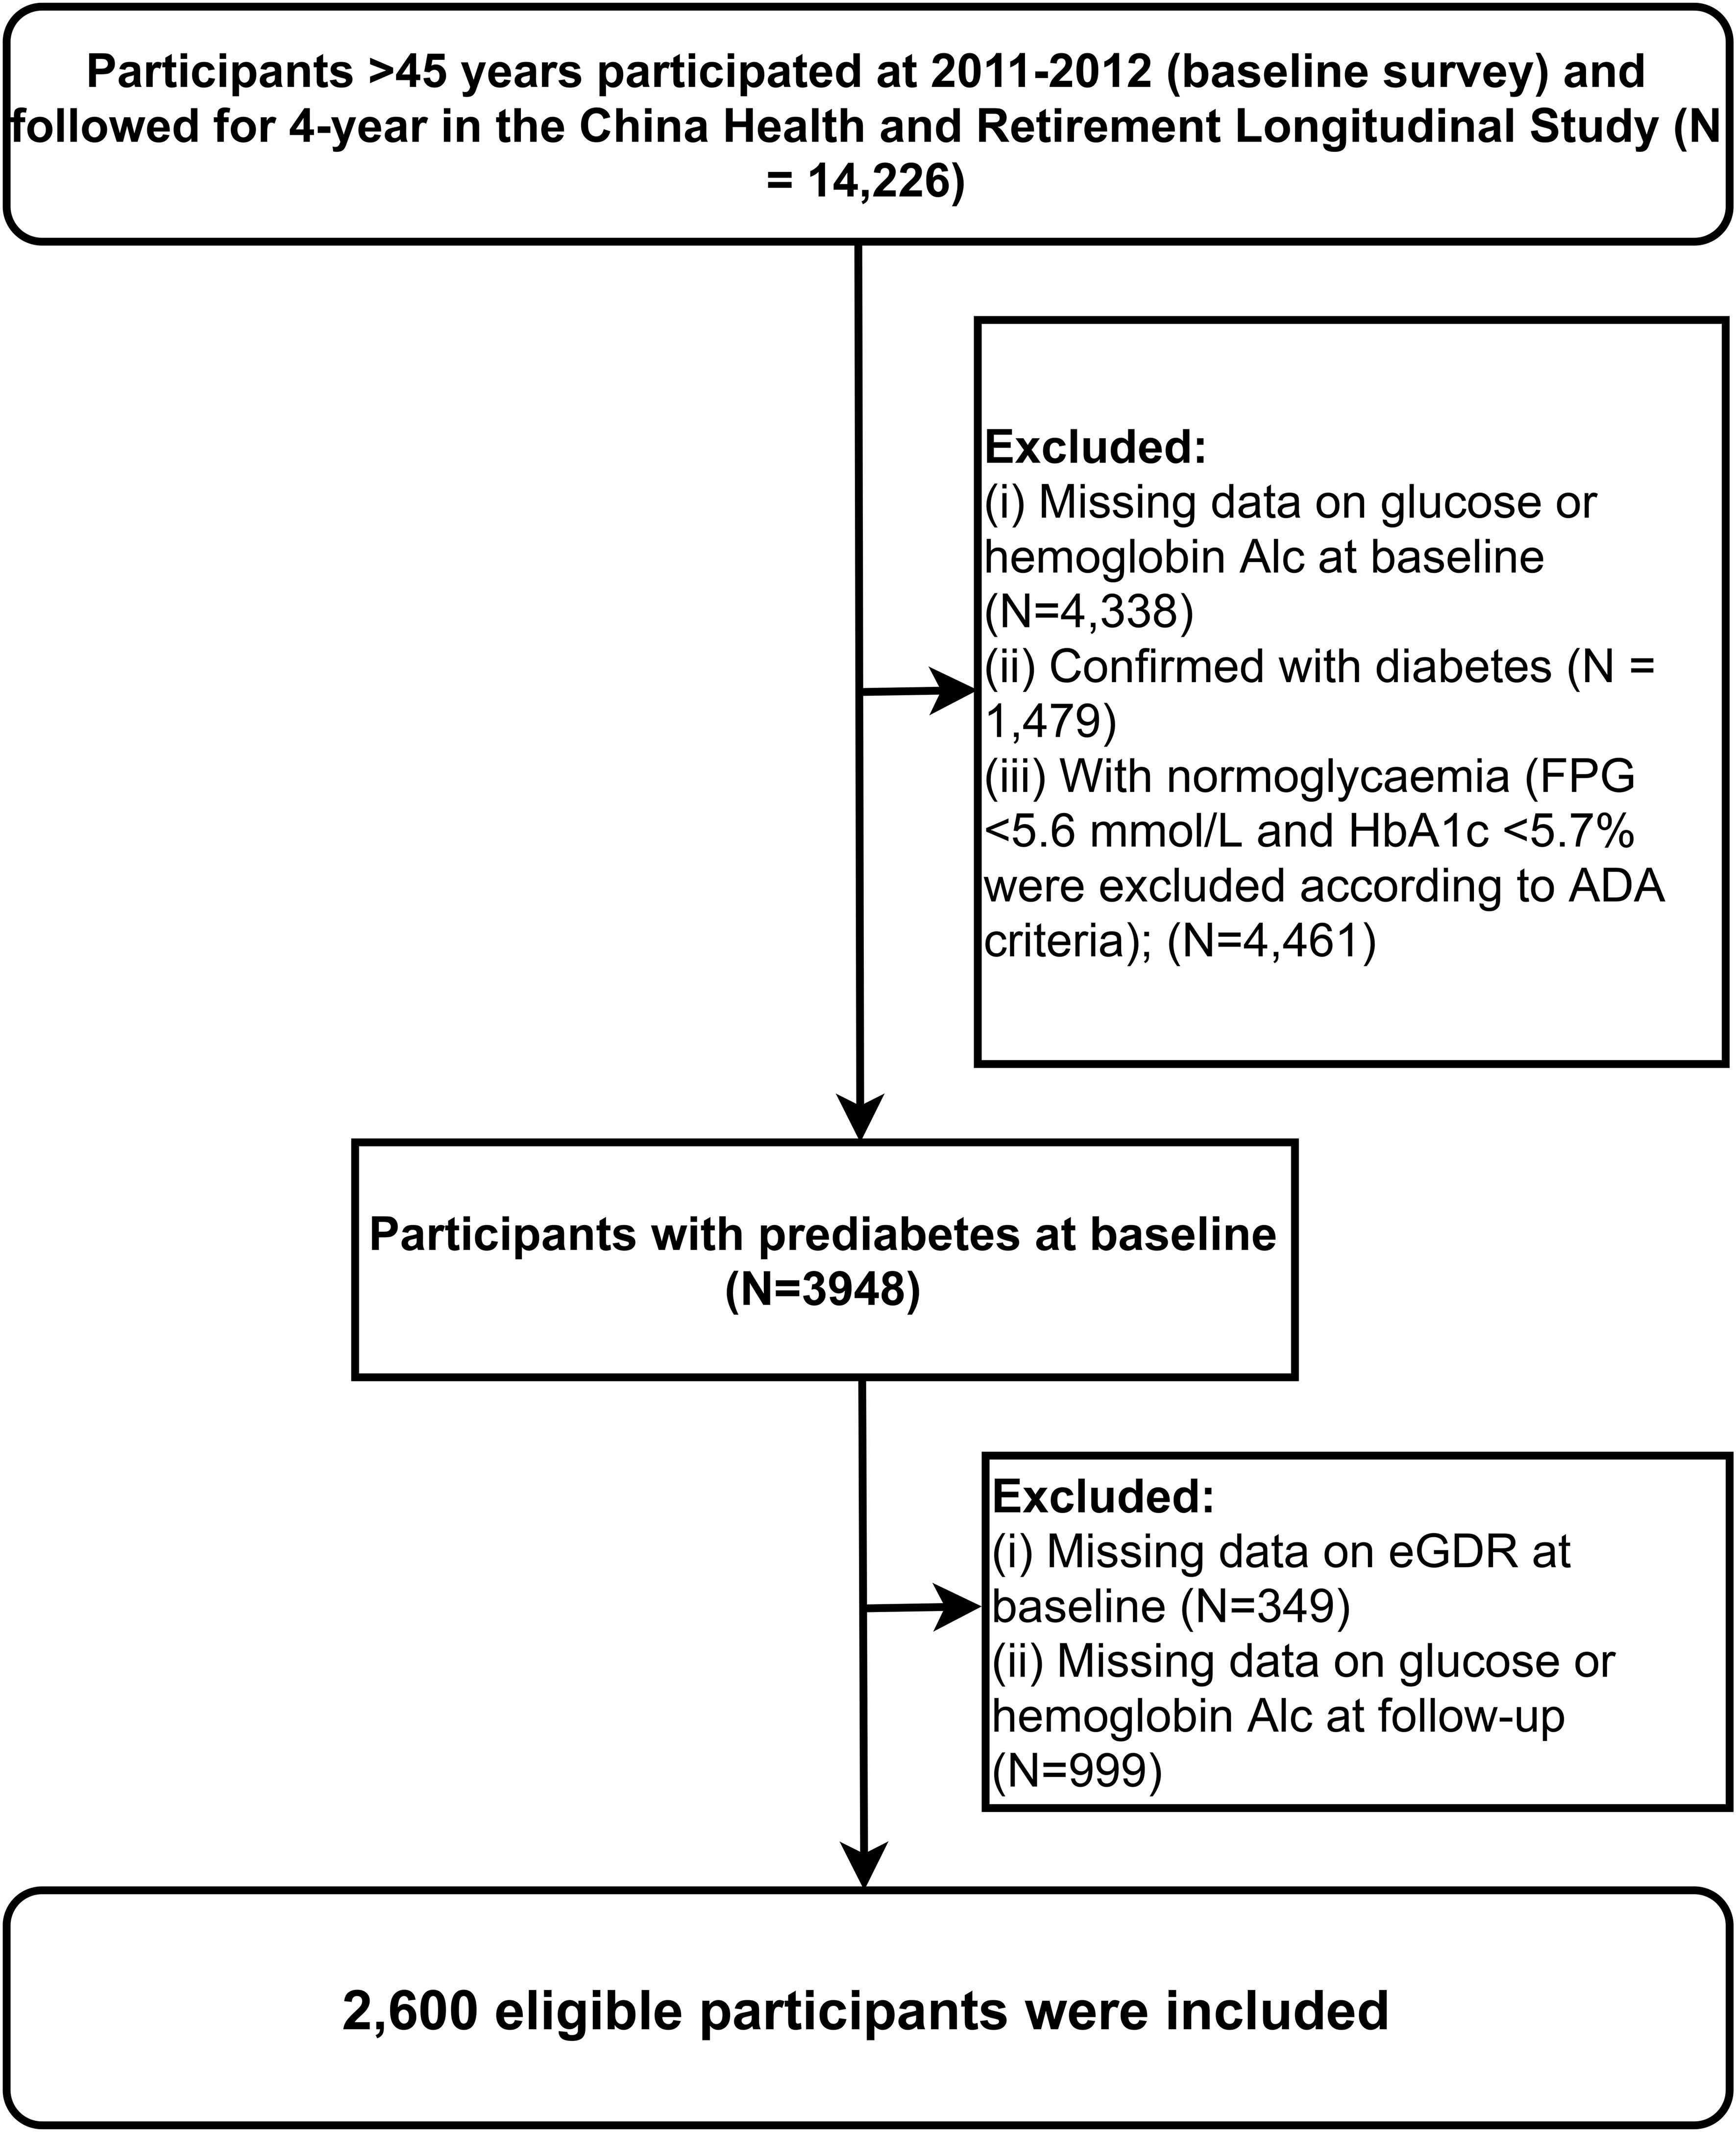
Figure 1. Flow chart of study participants.
This study was conducted in accordance with the Declaration of Helsinki and adhered to the STROBE reporting guidelines. The study protocol for the CHARLS project was approved by the Ethics Review Committee of Peking University (IRB00001052-11015). To ensure the protection of participants’ rights, all individuals involved in the CHARLS project were fully informed and provided written informed consent before the commencement of the study. Clinical trial number: not applicable.
Baseline information was collected by trained interviewers through face-to-face computer-assisted personal interviews, using structured questionnaires to gather data on sociodemographic status, health-related factors, comorbidities, and laboratory measurements. Sociodemographic variables included gender, age, education level (below primary, primary schools, middle school, high school and above), marital status (married, other), and residence (rural, urban). Health-related factors included height, weight, WC, body mass index (BMI), systolic blood pressure (SBP), diastolic blood pressure (DBP), and smoking/drinking status (never, current, quit). Comorbidities included hypertension, cardiovascular disease (CVD), and stroke, with detailed diagnostic information provided in the online Supplementary Methods. Laboratory measurements were taken after participants had fasted for at least 8 hours and included serum creatinine (Cr), uric acid (UA), total cholesterol (TC), triglycerides (TG), high-density lipoprotein cholesterol (HDL-C), low-density lipoprotein cholesterol (LDL-C), glucose, and HbA1c.
In the current study, we assessed glucose status based on the definition of impaired fasting glucose according to the American Diabetes Association criteria (21), which includes prediabetes, diabetes, and normoglycemia. Detailed information is presented in Table 1.
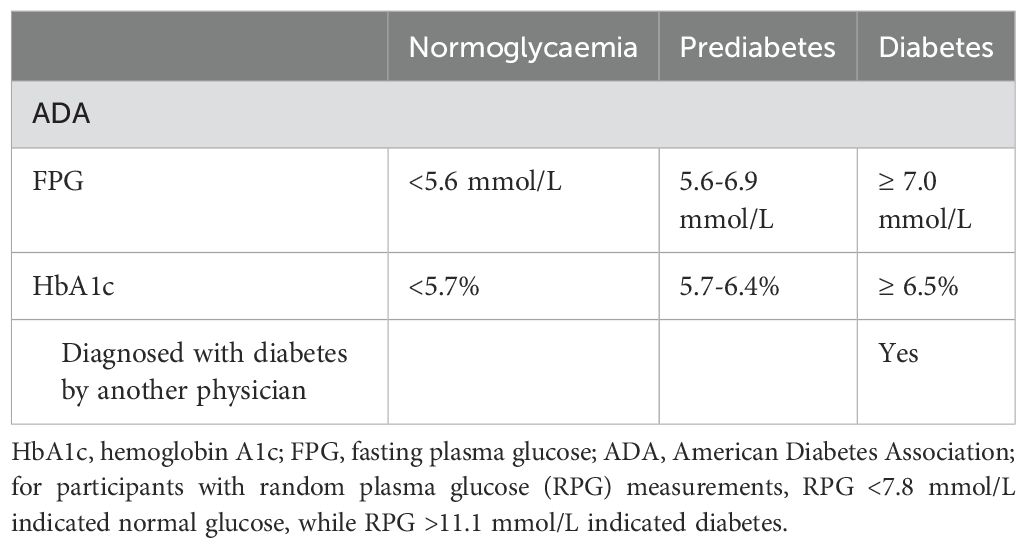
Table 1. Definition of diabetes, prediabetes and normoglycemia according to the American Diabetes Association criteria.
Initially, baseline data were described, with continuous variables presented as means (standard deviations) or median (interquartile interval), and categorical variables as frequencies and percentages. Next, participants were grouped according to eGDR quartiles (Q1-Q4), and differences in baseline characteristics were analyzed using one-way ANOVA, Kruskal-Wallis H test, and chi-square test.
Univariable and multivariable Cox regression models were used to calculate Hazard Ratios (HRs) and corresponding 95% Confidence Intervals (CIs) to quantify the impact of eGDR on the reversion or progression of prediabetes. Before constructing the model, we first calculated variance inflation factors for all covariates to ensure that there was no multicollinearity among the covariates in the multivariate model constructed subsequently (Supplementary Table S1) (22). Several stepwise adjustment models were built based on clinical experience, relevant literature, collinearity diagnostics and Strengthening the Reporting of Observational Studies in Epidemiology guidelines. The crude model was unadjusted; Model 1 serves as a base-adjusted model that takes into account simple demographic and measurement information, including age, gender, marital status, height, and BMI; Model 2 was further adjusted for lifestyle habits (drinking status, smoking status) comorbidities (CVD and stroke) education, SBP, and DBP based on model 1; Model 3 served as the final model and was further adjusted for blood glucose, lipids (TG, HDL-C, LDL-C), Cr, and UA based on model 2. The validity of the proportional hazards hypothesis was tested using Schoenfeld residuals, and the Cox regression models of all clinical outcomes met the proportional hazards hypothesis.
To explore the dose-response relationship (linear or nonlinear) between eGDR and the reversion of prediabetes to normoglycaemia or progression to diabetes, we performed restricted cubic spline (RCS) analysis. Following Harrell’s recommendations (23, 24), four knots were placed at the 5th, 35th, 65th, and 95th percentiles of the eGDR distribution to minimize the potential impact of outliers, and a likelihood ratio test was used for nonlinear analysis (comparing the model with only a linear term against the model with linear and cubic spline terms). If the relationship was nonlinear, a recursive algorithm was employed to determine the inflection point (k-value) that maximized the model likelihood. A two-segment Cox regression model was then used on either side of the k-value to examine the association between eGDR and the reversion or progression of prediabetes. The specific method is to first run 3 models with inflection point equals Q1 (25% percentile), Q2 (50% percentile) and Q3 (75% percentile) within the range of Kmin and Kmax respectively to find out which quartile point gives the model with highest likelihood among the three models. Then we narrow down the Kmin and Kmax to the range of +/- 25% of the corresponding quartile point. By doing so, we narrow down the range of Kmin and Kmax 50% recursively each time until the specific value of the independent variable was identified, that if used as inflection point will give the segmented regression model highest likelihood.
After establishing the association between eGDR and glycemic metabolic status, we conducted stratified analyses to assess the modifying effects of gender, age, BMI, drinking/smoking status, education, marital status, hypertension, CVD, and stroke on the relationship between eGDR and the reversion or progression of prediabetes. Age groups were classified according to the World Health Organization’s standards (25), and BMI was categorized based on the recommendations of the Working Group on Obesity in China (26).
Finally, several sensitivity analyses were conducted to verify the robustness of the study findings: (1) The association between eGDR and the reversion or progression of prediabetes was validated in 1,227 participants diagnosed with diabetes, prediabetes, or normoglycaemia according to the Chinese expert consensus on prediabetes (27); (2) Given the potential competing risk relationship between reversion to normoglycaemia and progression to diabetes during follow-up, we further validated the association between eGDR and the reversion/progression of prediabetes in a competing risk model; (3) Model 3 was additionally adjusted for the quadratic term of age; (4) To account for missing baseline data (32 subjects missing SBP/DBP, 9 subjects missing height, 5 subjects missing weight, 12 subjects missing BMI, 12 subjects missing stroke, and 22 subjects missing CVD data; see Supplementary Table S2), multiple imputation using fully conditional specification was performed, and the main analyses were conducted on the complete dataset.
For all tests, statistical significance was set at P < 0.05. All analyses were conducted using R language version 3.4.3 and Empower(R) version 2.0.
The current analysis included 2,600 middle-aged and elderly participants diagnosed with prediabetes, with an average age of 60 years. Among them, 1,197 were males, and 1,403 were females. The baseline characteristics of the study population were summarized according to eGDR quartiles (Q1-Q4). As shown in Table 2, participants with higher eGDR values (Q3, Q4) were more likely to be female, younger, and more educated, with lower height, weight, BMI, WC, UA, TC, TG, LDL-C, HbA1c, SBP, and DBP levels, and fewer comorbidities such as CVD and stroke, compared to those with lower eGDR values.
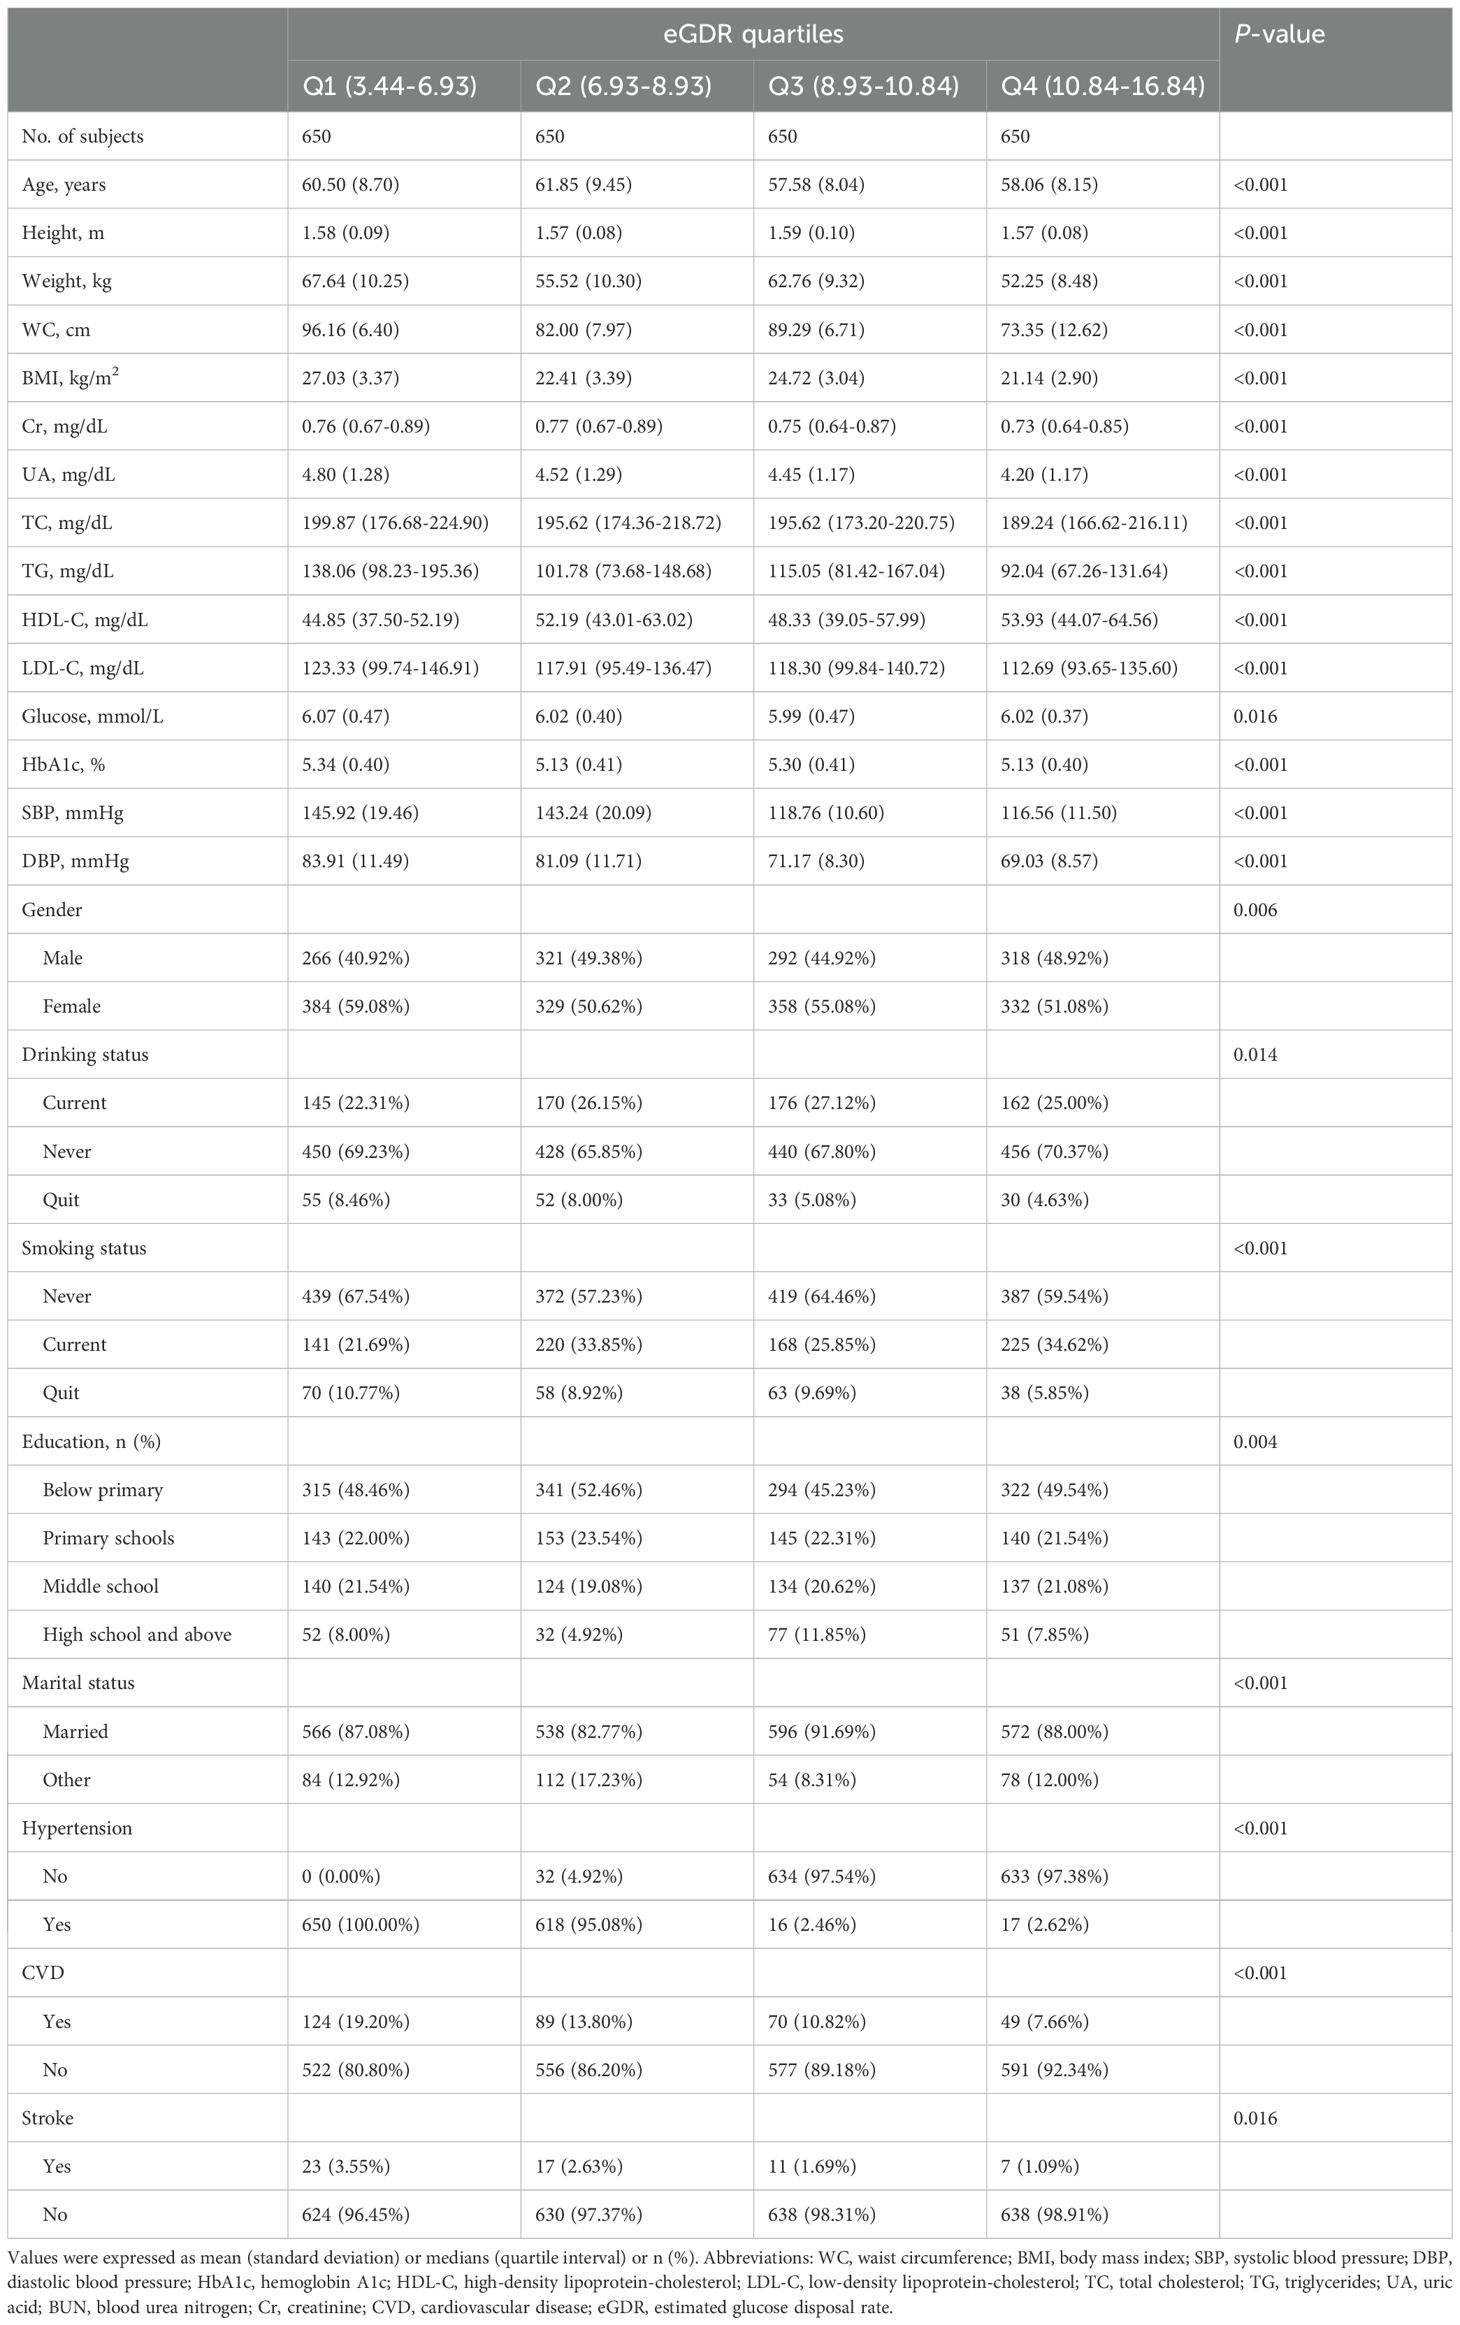
Table 2. Summary of baseline characteristics of the study population according to eGDR quartile group.
During the median follow-up period of 4 years, 399 participants progressed to diabetes, 586 reverted to normoglycaemia, and 1,615 remained in the prediabetic state. As summarized in Table 3, participants who progressed to diabetes were generally older, less educated, more likely to be female, and had higher comorbid hypertension, higher levels of weight, WC, BMI, UA, TC, TG, glucose, HbA1c, SBP, and DBP, as well as lower levels of height, Cr, HDL-C, and eGDR (Figure 2). Participants who reverted to normoglycaemia showed opposite characteristics.
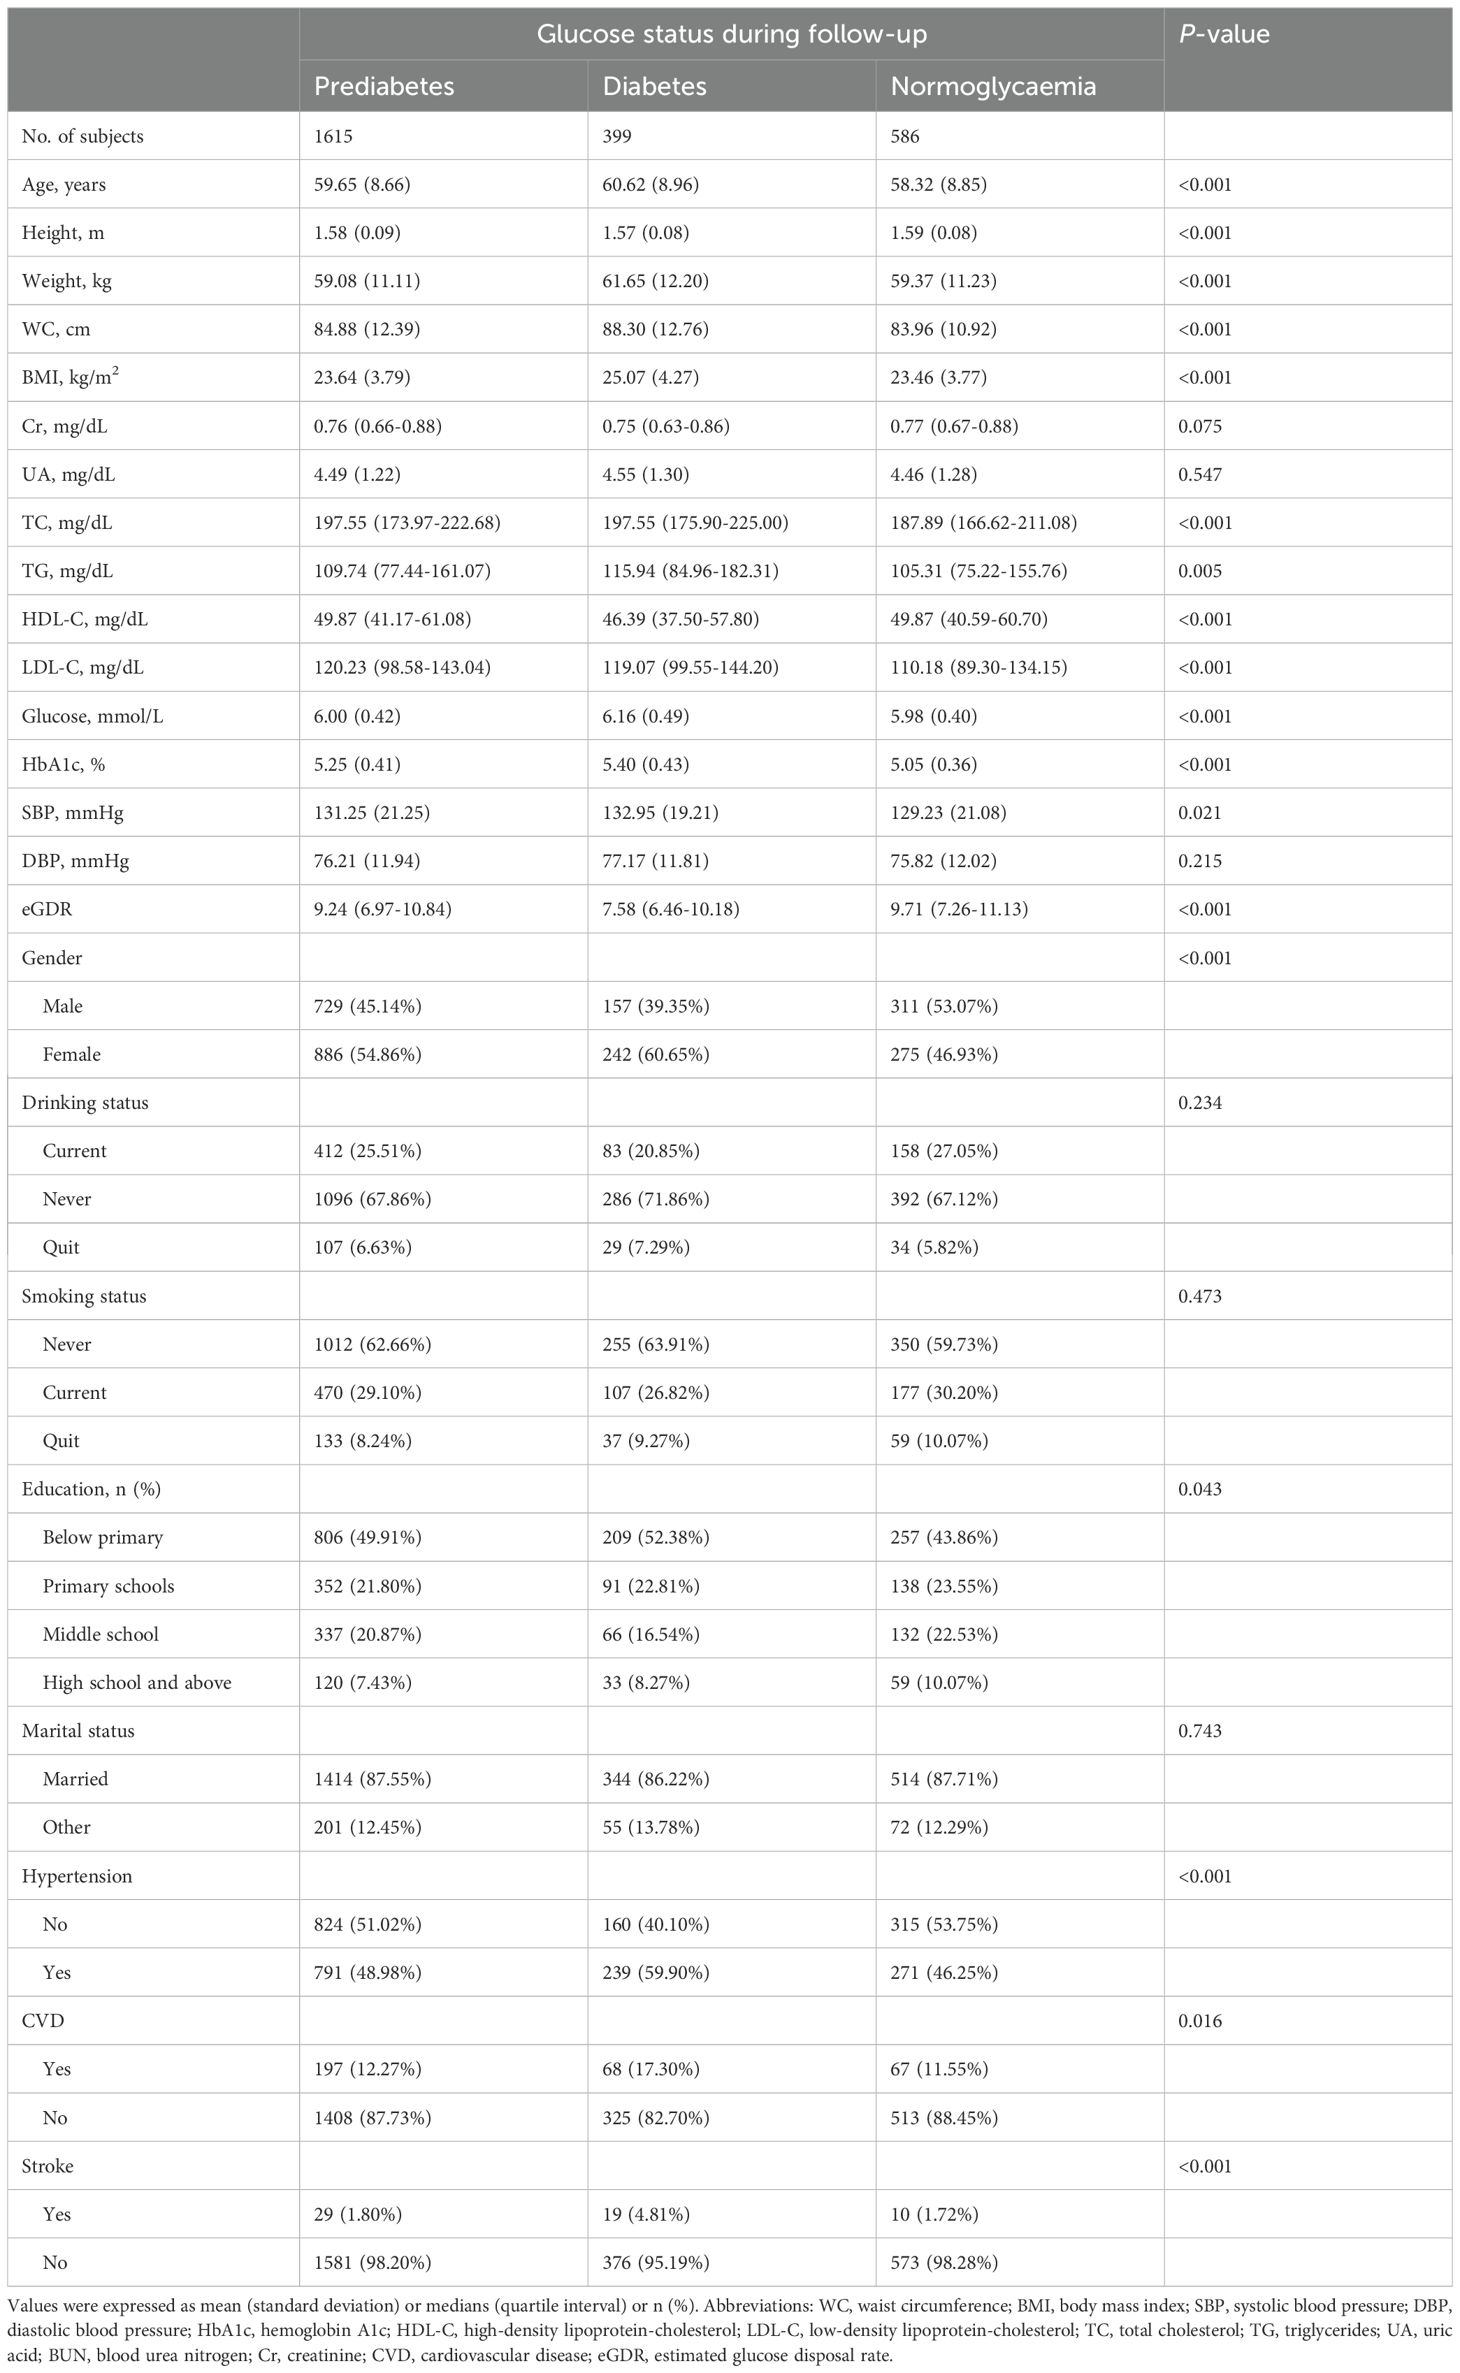
Table 3. Baseline characteristics summarized according to subjects’ glycemic status during follow-up.
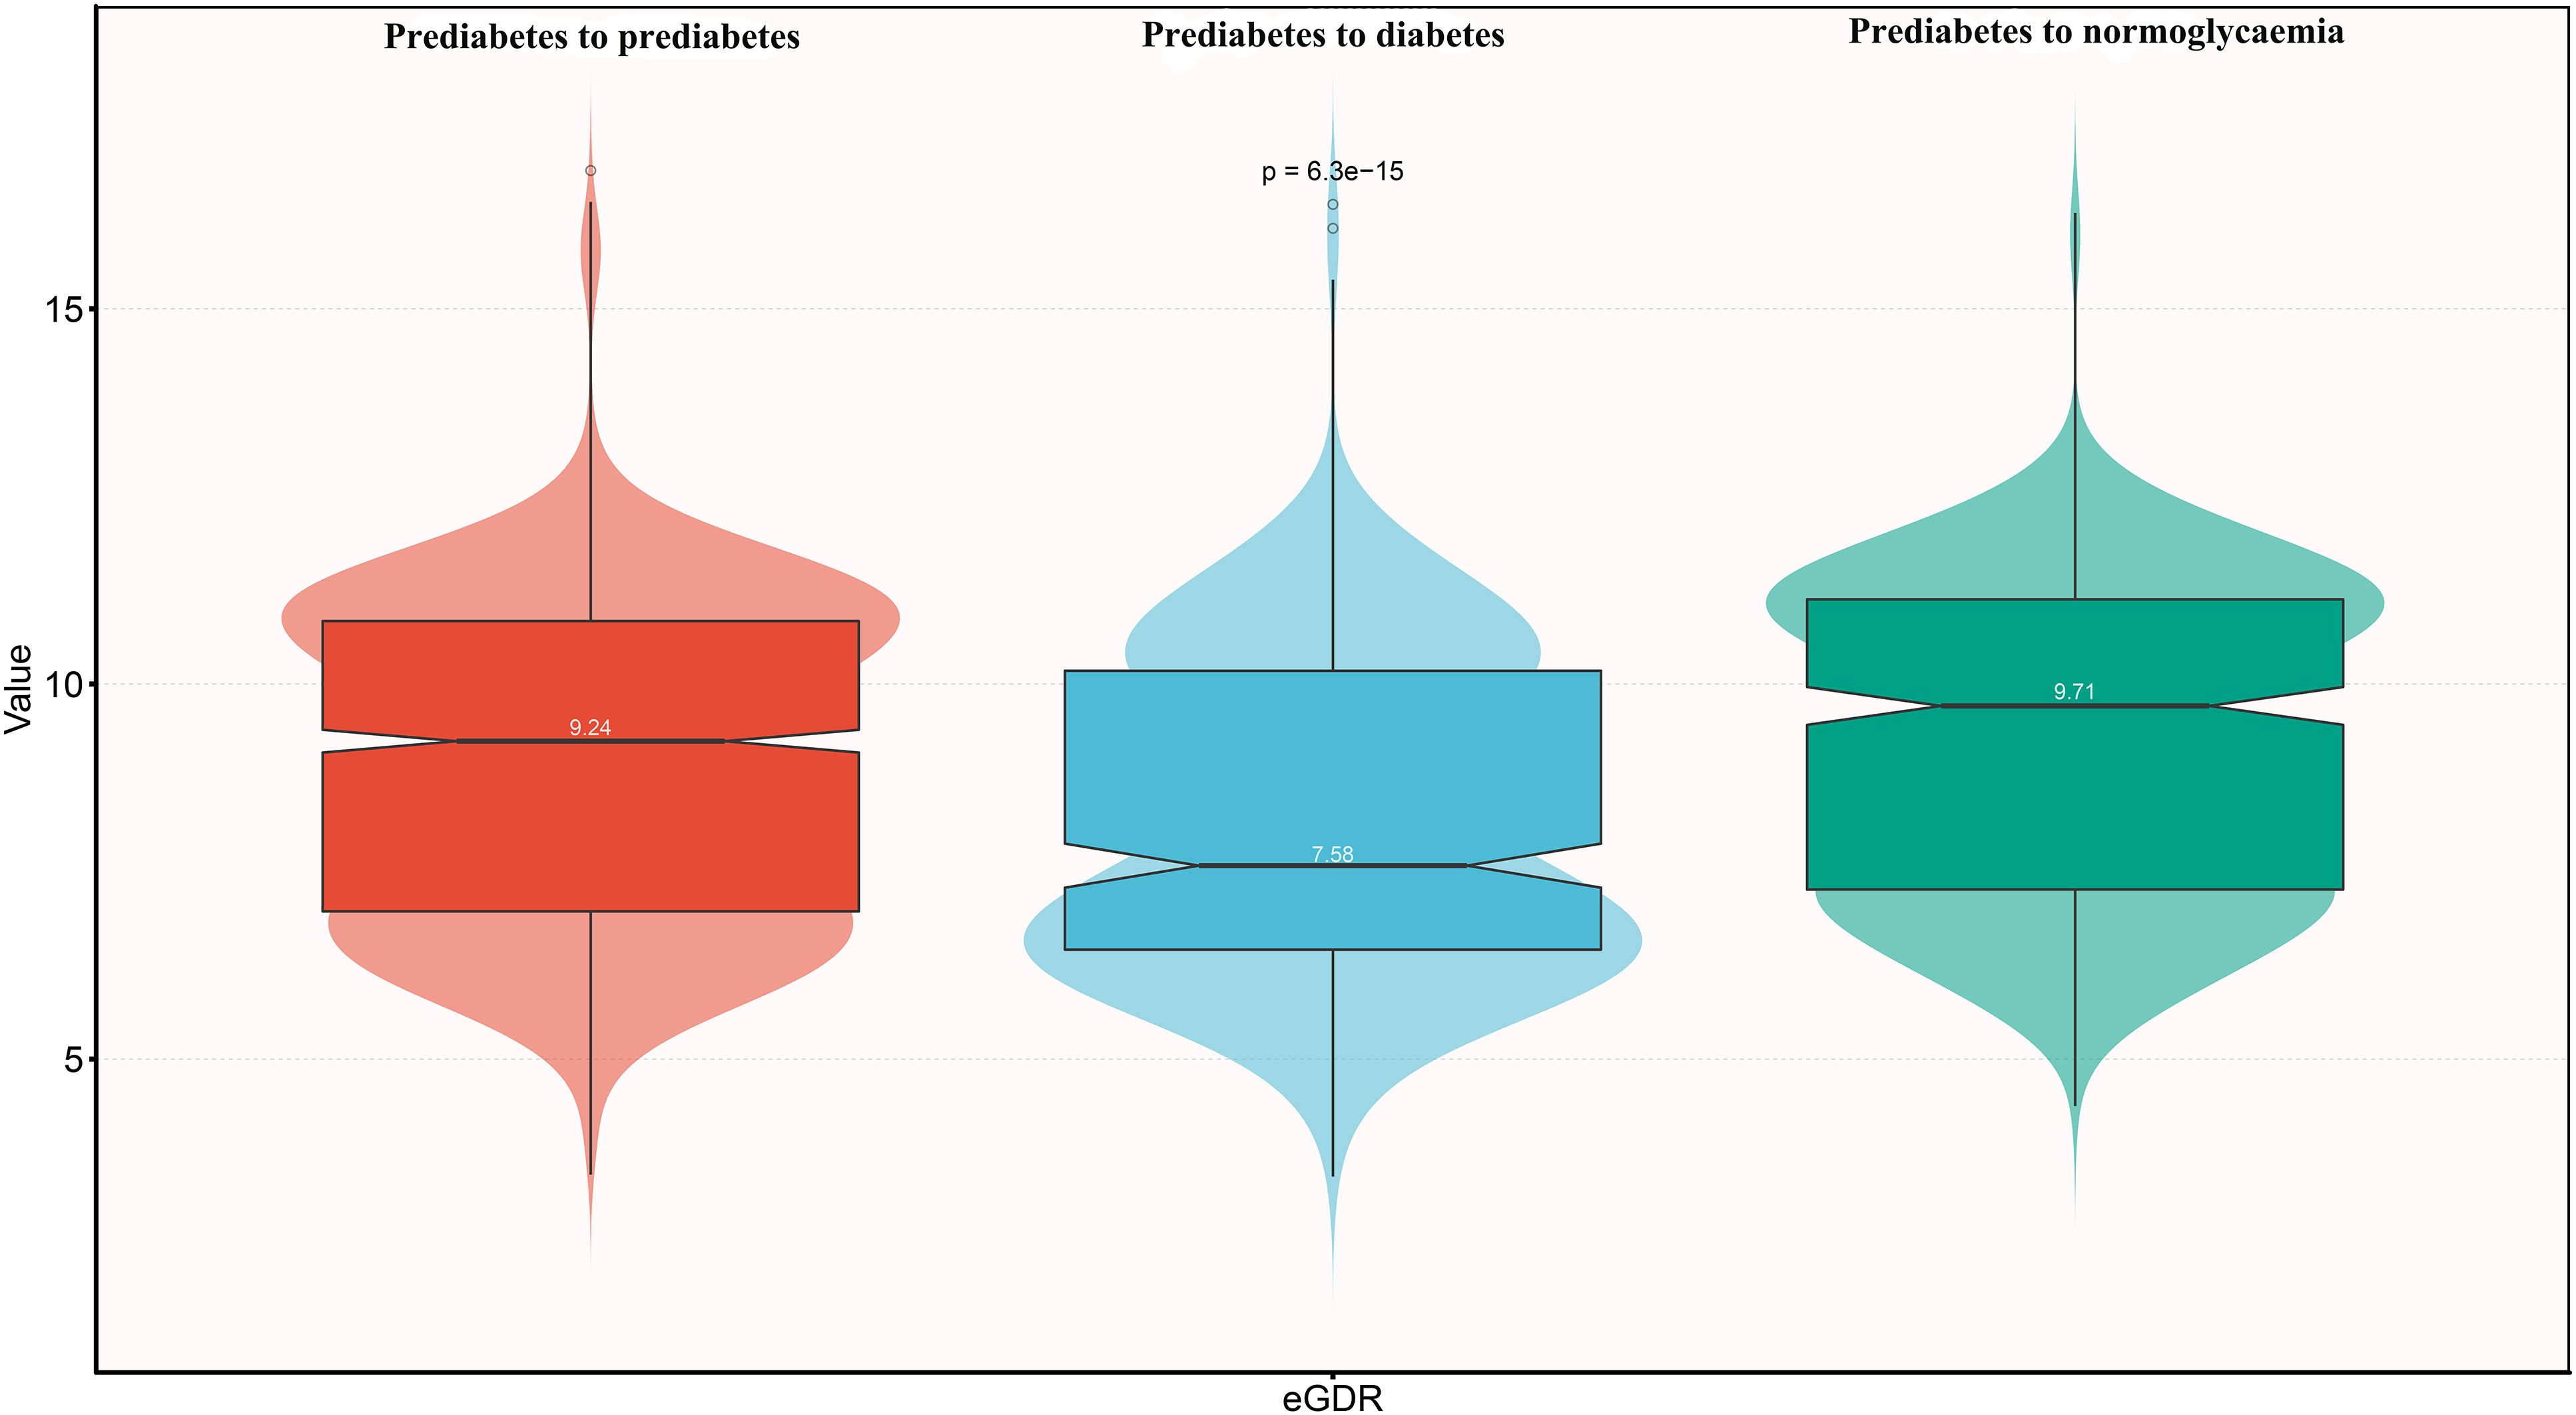
Figure 2. Violin chart showing baseline characteristics of eGDR according to glucose status during follow-up. eGDR, estimated glucose disposal rate.
As shown in Table 4, both before and after adjusting for covariates, eGDR remained negatively associated with the progression of prediabetes to diabetes and positively associated with the reversion of prediabetes to normoglycaemia. In the crude model, each unit increase in eGDR was associated with a 14% reduction in the likelihood of progressing to diabetes (HR=0.86, 95% CI: 0.82, 0.90) and a 7% increase in the likelihood of reverting to normoglycaemia (HR=1.07, 95% CI: 1.03, 1.11). According to the results of Model III, each unit increase in eGDR was associated with a 19% reduction in the likelihood of progressing to diabetes (HR=0.81, 95% CI: 0.70, 0.93) and a 14% increase in the likelihood of reverting to normoglycaemia (HR=1.14, 95% CI: 1.05, 1.23). Additionally, when eGDR was converted from a continuous variable to a categorical variable and included in the Cox regression model, similar results were observed, with higher eGDR being negatively associated with the progression of prediabetes and positively associated with its reversion.
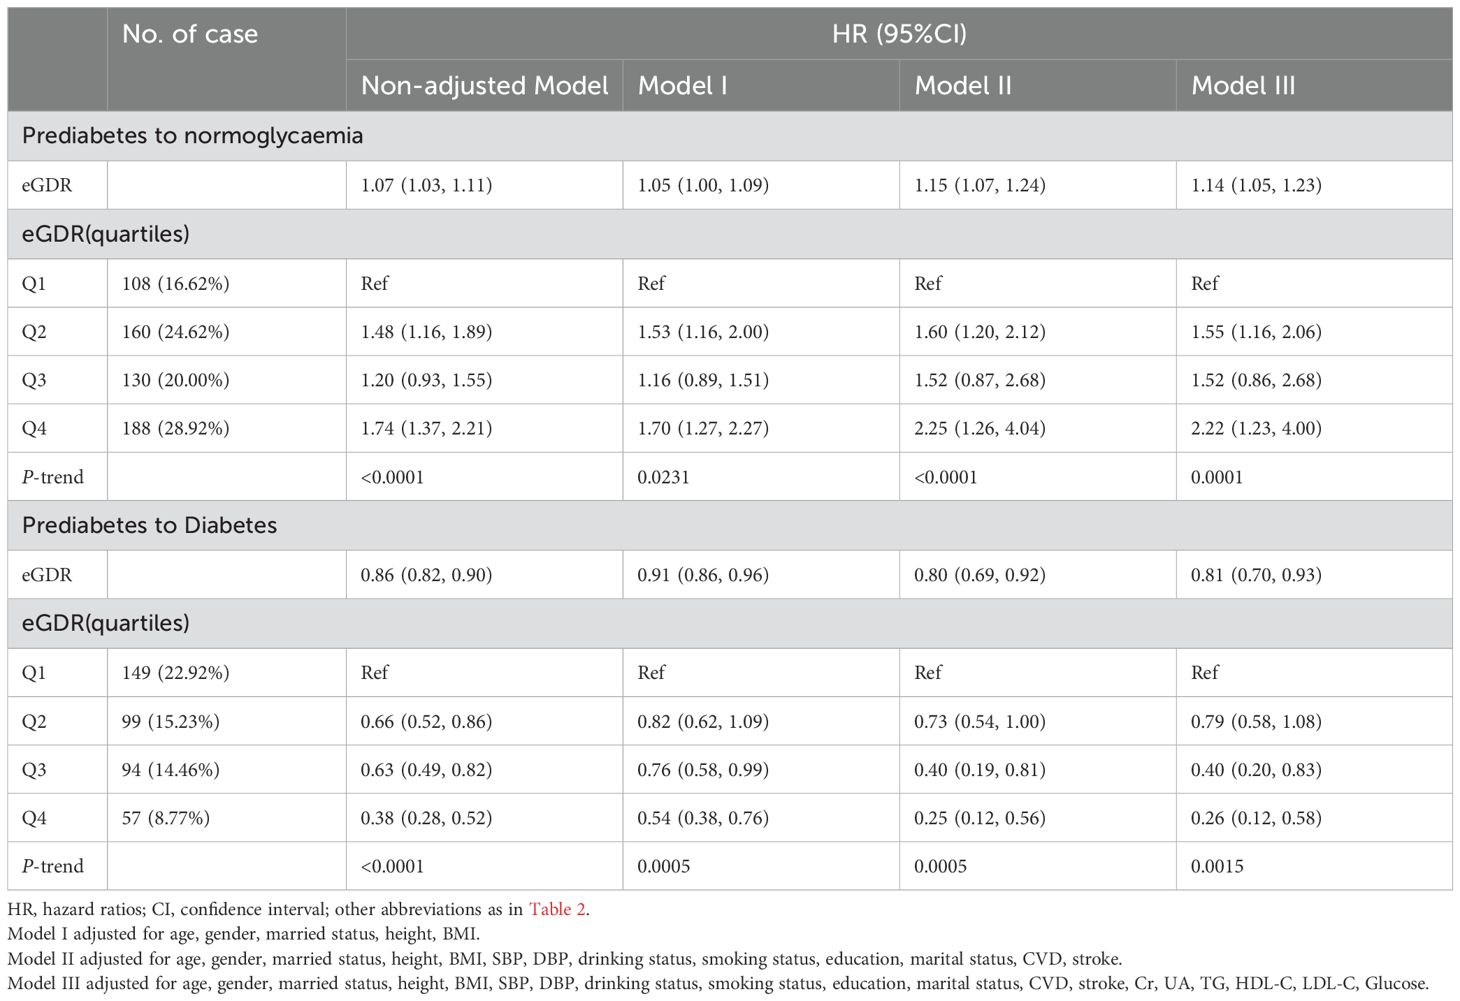
Table 4. Multivariate Cox regression analysis of the role of eGDR in assessing changes in glycemic status in patients with prediabetes.
Based on Model III, we further used RCS to fit the dose-response relationship between eGDR and the progression or reversion of prediabetes. As shown in Figure 3, the relationship between eGDR and the risk of progression from prediabetes to diabetes was linear (P for non-linearity > 0.05), with a decreasing risk of progression as eGDR increased. In contrast, as shown in Figure 4, the relationship between eGDR and the reversion of prediabetes to normoglycaemia was nonlinear, resembling an L-shape (P for non-linearity < 0.05), with a potential threshold effect. Specifically, before the inflection point, the rate of reversion to normoglycaemia increased more rapidly with higher eGDR, whereas after the inflection point, the rate of reversion increased at a slower pace. Using a recursive algorithm, we calculated the inflection point value associated with reversion to normoglycaemia as 6.81 (Table 5). When the eGDR value was below 6.81, the rate of reversion to normoglycaemia was faster (HR: 1.98, 95% CI: 1.38, 2.84, P for log-likelihood ratio test = 0.0002), consistent with the RCS results.
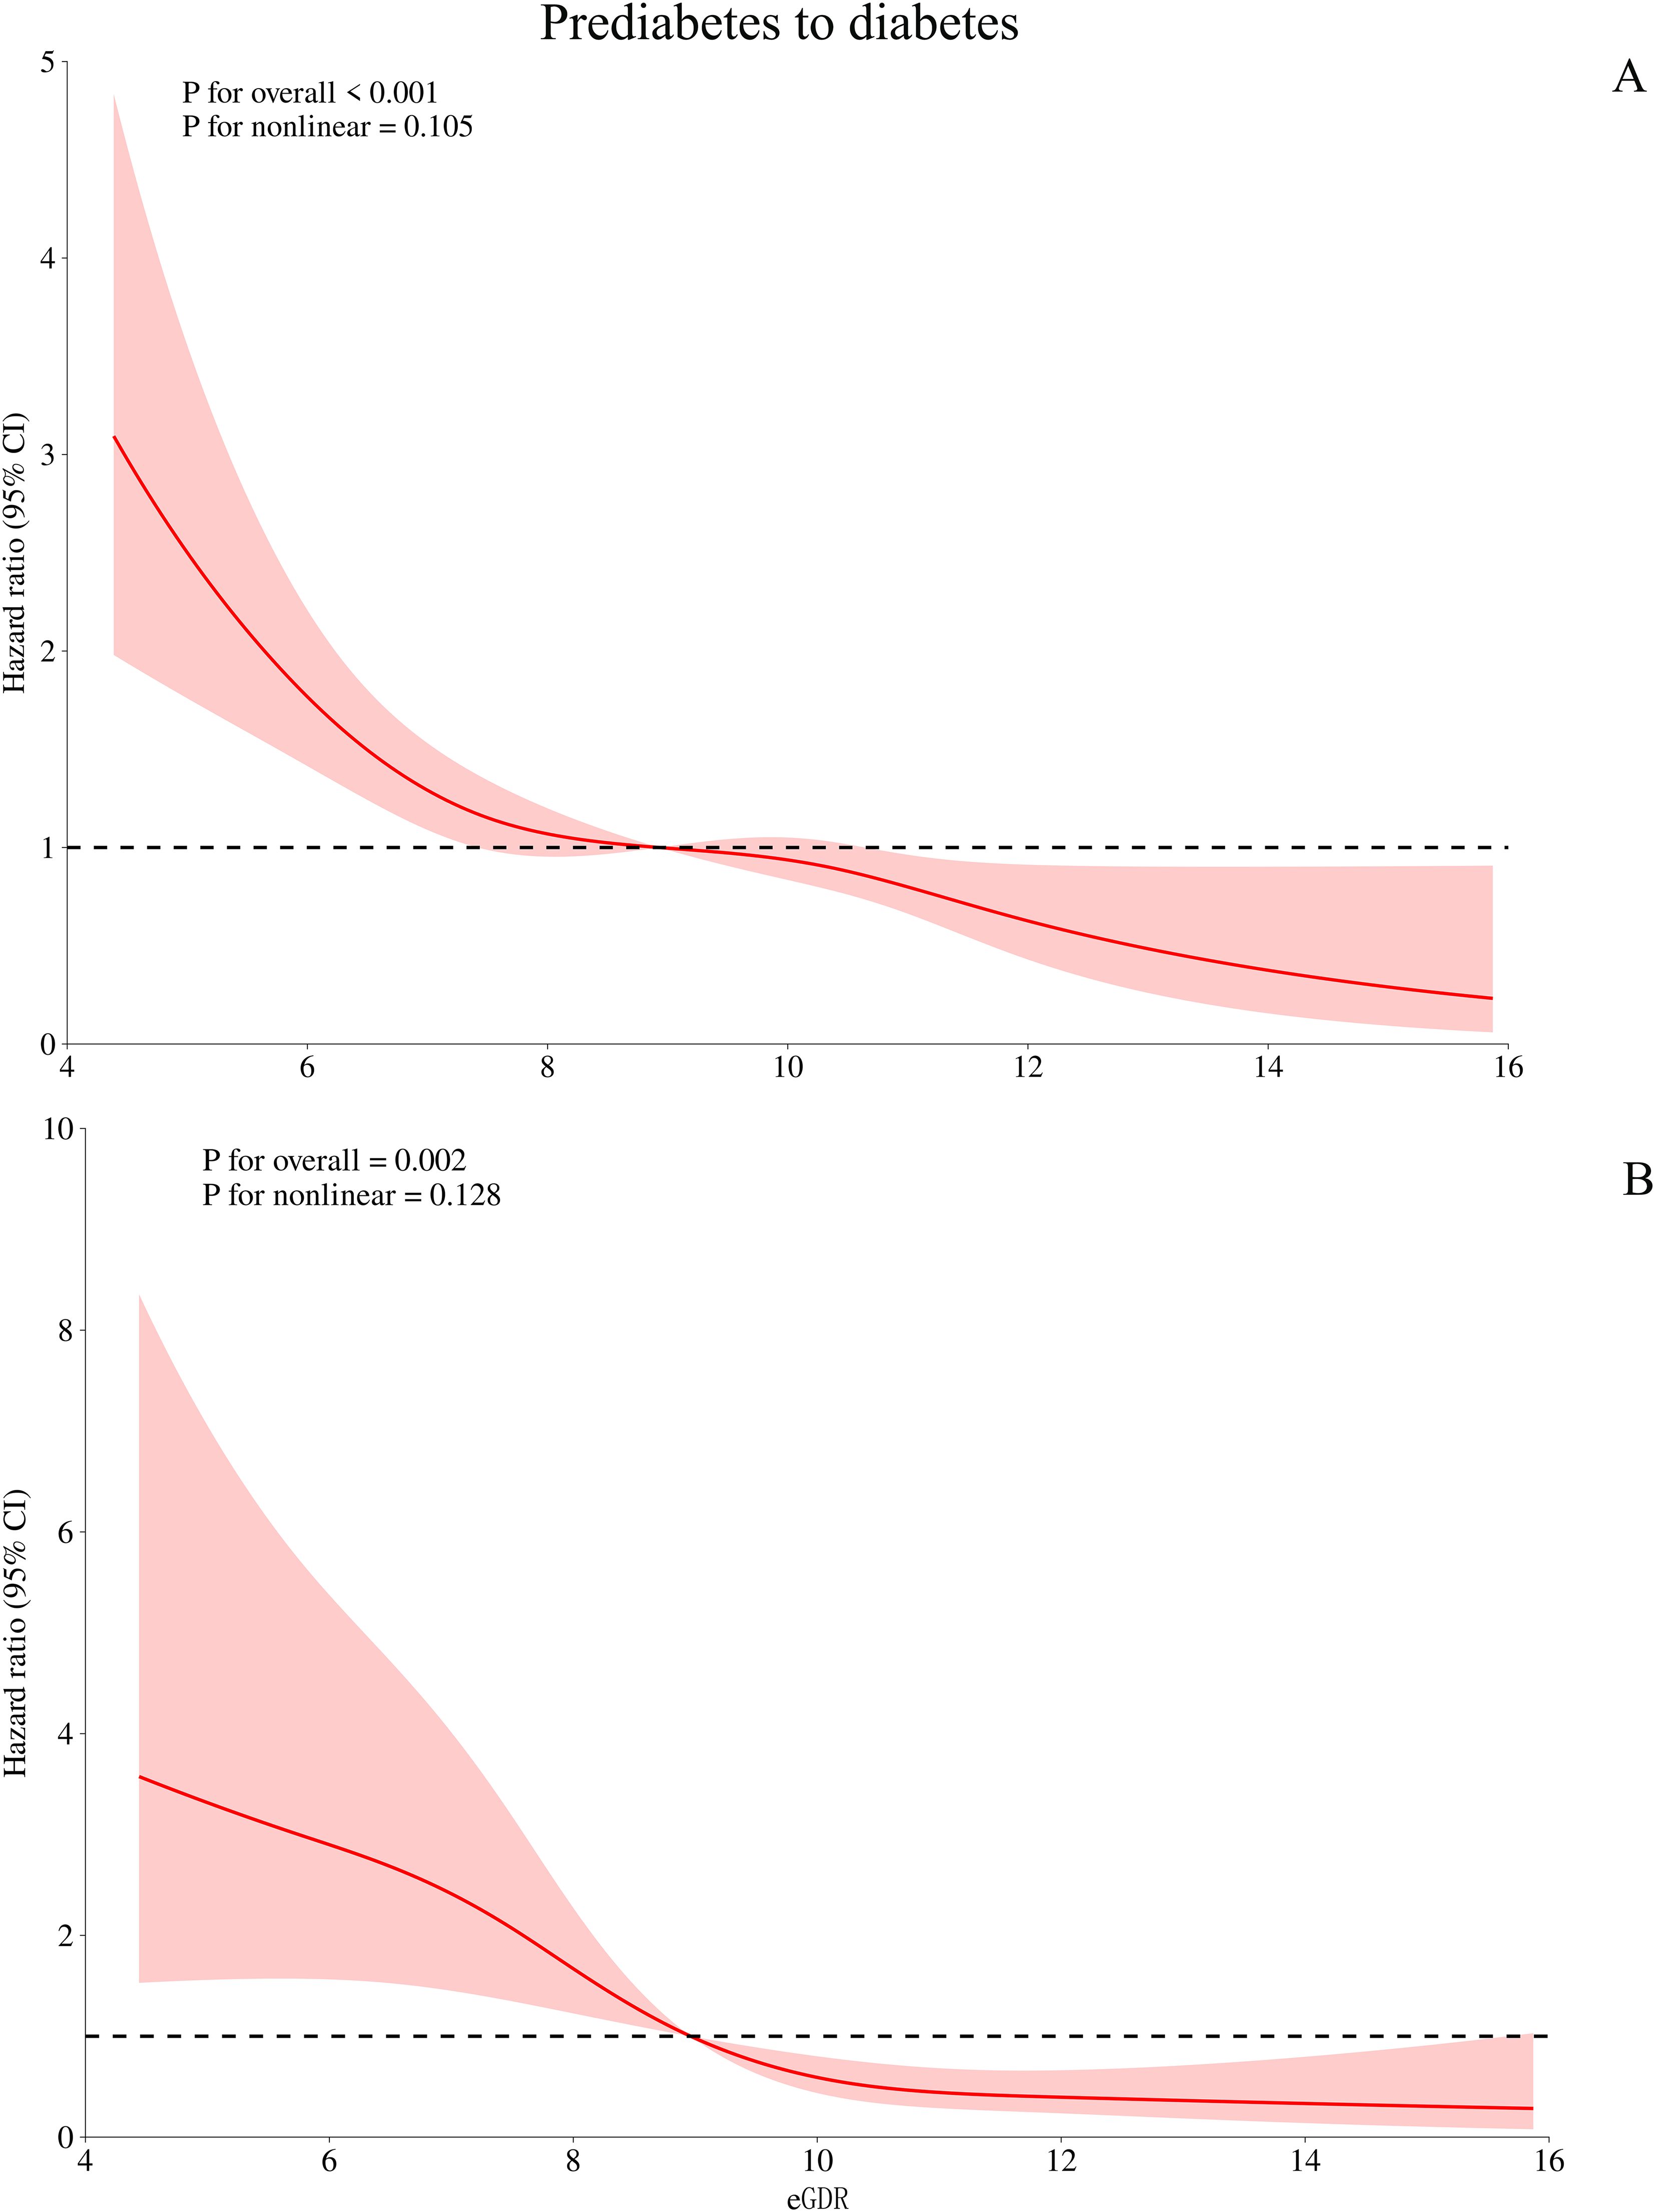
Figure 3. Visualizing the relationship between eGDR and progression from prediabetes to diabetes using 4-knots RCS (A: unadjusted; B: adjusted). eGDR, estimated glucose disposal rate.
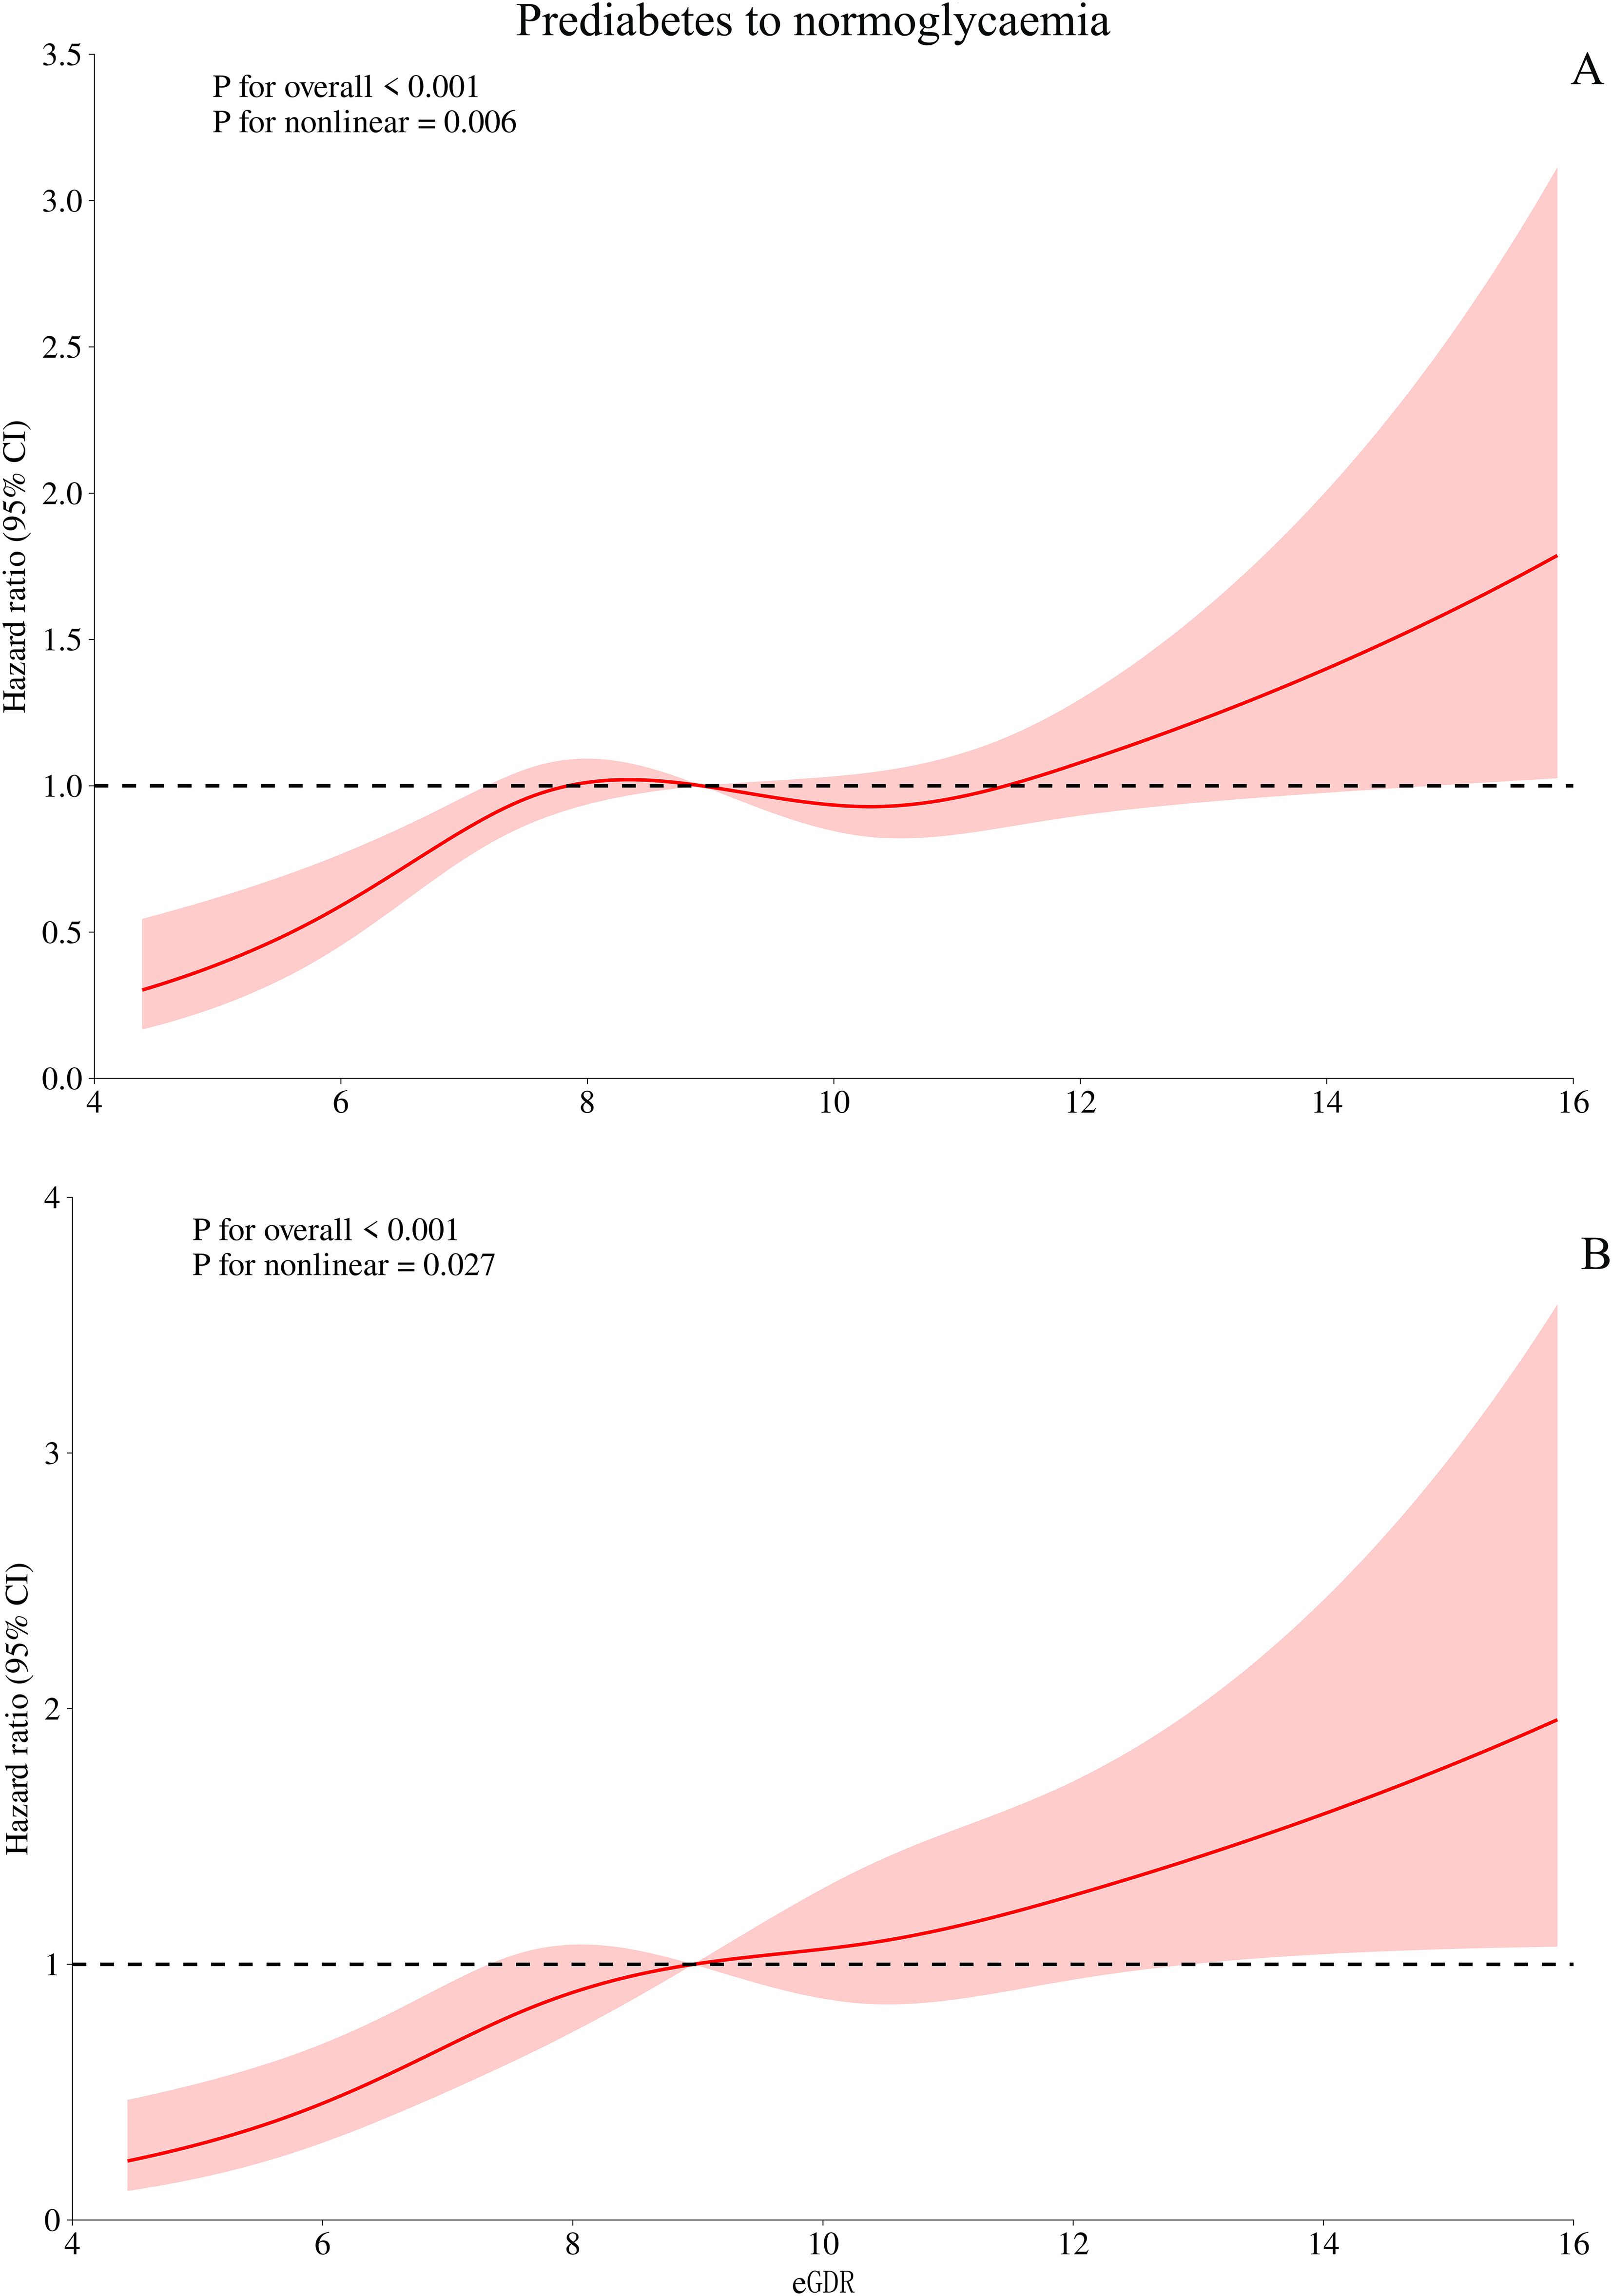
Figure 4. Visualizing the relationship between eGDR and regression of prediabetes to normoglycaemia using 4-knots RCS (A: unadjusted; B: adjusted). eGDR, estimated glucose disposal rate.
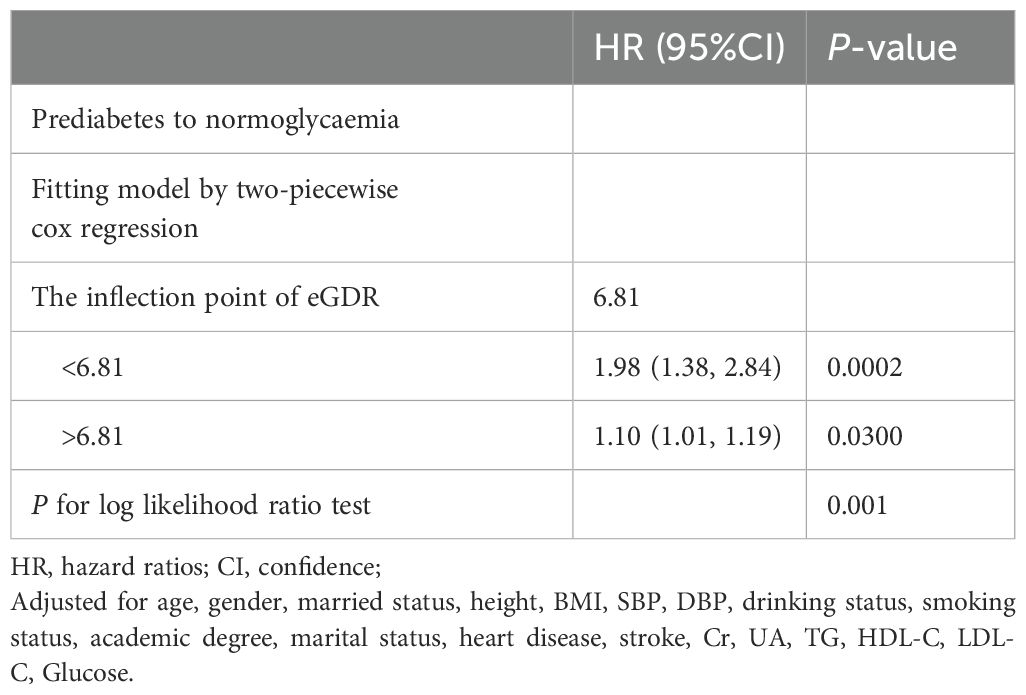
Table 5. The result of the two-piecewise Cox regression model.
To further validate whether the study results were population-dependent, we conducted stratified analyses by gender, age, BMI, drinking/smoking status, education, marital status, hypertension, CVD, and stroke. The results showed no significant differences across all subgroups (all P-interactions > 0.05) (Figure 5). These findings suggested that the association between eGDR and the progression or reversion of prediabetes is relatively robust.
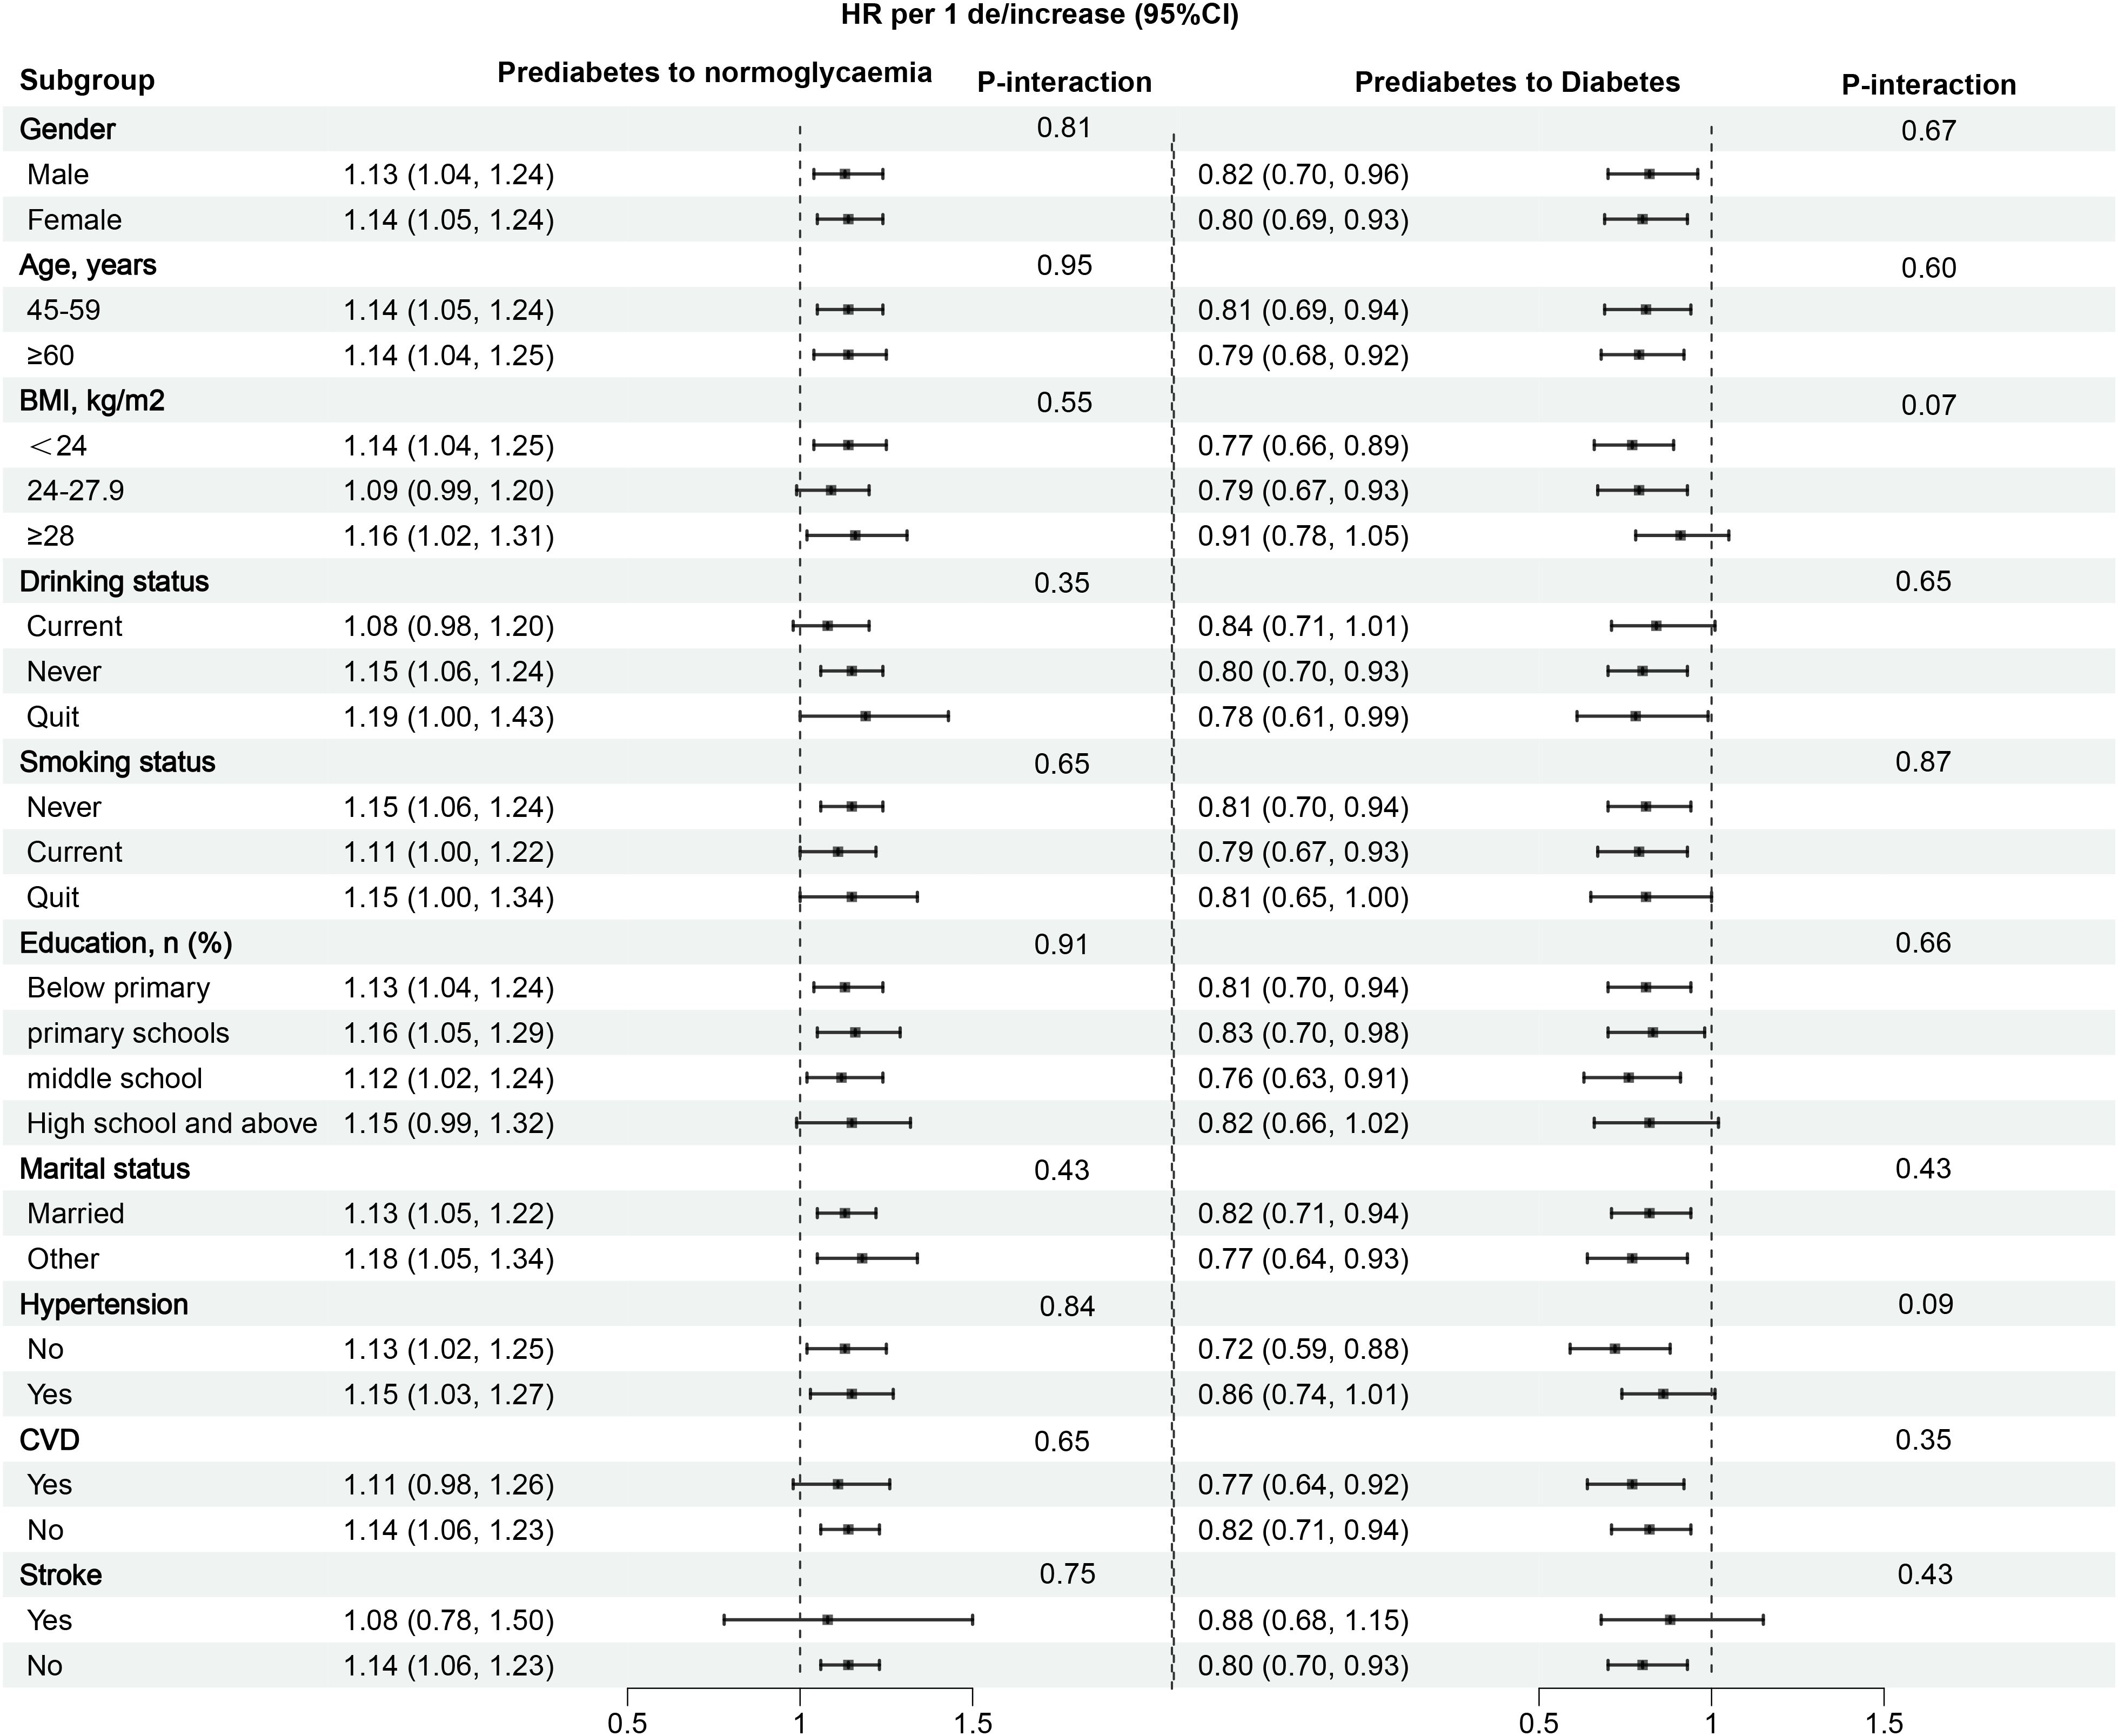
Figure 5. Subgroup analysis of the role and differences of eGDR in assessing changes in glycemic status in prediabetes patients. eGDR, estimated glucose disposal rate. BMI, body mass index; CVD, cardiovascular disease.
In several sensitivity analyses, the results showed no significant changes (Supplementary Table S3). First, the main analysis was repeated after changing the inclusion criteria based on the Chinese population’s diagnostic standards, and no significant changes were observed. Next, using the Fine-Gray method to account for competing risks, we repeated the same analysis steps, and the results did not change substantially. Additionally, the main analysis was conducted after adjusting for the quadratic term of age, with no significant changes in the results. Finally, after imputing missing data, the results remained unchanged.
This nationwide prospective study investigated the association between a surrogate marker of insulin resistance (IR)-eGDR-and the reversion or progression of prediabetes among middle-aged and elderly individuals in China. The findings suggest that higher eGDR is positively associated with the reversion of prediabetes to normoglycaemia and negatively associated with the progression to diabetes. Additionally, the study identified a potential threshold effect point in the dose-response curve between eGDR and the reversion of prediabetes to normoglycaemia, with a HR of 1.98 associated with eGDR values less than 6.81.
The natural course of prediabetes includes maintaining the prediabetic state, progressing to diabetes, or reverting to normoglycaemia (28). A significant body of literature has previously reported a close association between poor glycemic metabolism and adverse outcomes (1, 29–31). Therefore, early identification of factors influencing the progression and reversion of diabetes is crucial for disease prevention and prognosis. IR plays a critical role in the progression of diabetes and is also a key factor in the reversion of prediabetes (12, 13, 32, 33). Previous studies have described associations between certain IR surrogates and the reversion of prediabetes, such as the triglyceride glucose index, triglycerides glucose and body mass index, and the metabolic score for IR (34–36). These findings further confirm the important application value of surrogate biomarkers of IR in glucose metabolism disorders. However, it is important to note that most of these previous IR surrogates primarily considered lipid and glucose factors, overlooking other metabolic factors. eGDR is a novel IR assessment indicator that integrates evaluations of obesity, glucose, and blood pressure factors. Previous studies have shown that eGDR has similar accuracy to the HEGC in assessing IR status (14). Recent studies further validate the significant role of eGDR in evaluating disease prognosis and outcomes. However, most eGDR-related studies to date have focused on analyzing complications or severe adverse outcomes in diabetic patients (15–18, 37, 38). Currently, there is limited understanding of the relationship between eGDR and prediabetes, a stage where glucose levels are still modifiable, and the association of eGDR with the reversion of prediabetes to normoglycaemia remains unclear. To address this issue, the current study analyzed data from the Chinese CHARLS cohort, revealing that higher eGDR promotes the reversion of prediabetes to normoglycaemia. After fully adjusting for confounding factors, the probability of reversion to normoglycaemia in the high eGDR group (Q4) was 2.22 times higher than in the low eGDR group (Q1). This finding underscores the important evaluative value of eGDR in the regression of prediabetes and suggests that monitoring eGDR during glucose control or intervention in prediabetes may be significantly beneficial.
The relationship between IR and its surrogates with diabetes onset has been well documented in numerous previous studies (9–11, 39–41). However, the association between the new IR surrogate eGDR and diabetes was unclear. To clarify this relationship, the current study further analyzed the association between eGDR and diabetes onset in prediabetic patients. After a median follow-up of 4 years, 399 participants (15.3%) in our study cohort progressed to diabetes. The association analysis results showed that after controlling for confounding factors, eGDR was significantly negatively associated with the progression of prediabetes to diabetes. Further analysis based on eGDR quartiles revealed that the risk of progressing to diabetes in the high eGDR group (Q4) was 74% lower than in the low eGDR group (Q1). Contrary to the findings of previous studies on IR (9–11, 39–41), where IR is typically positively associated with diabetes, eGDR in this study was negatively associated with diabetes. This finding suggests that high eGDR inhibits the progression of prediabetes. Notably, the negative association between eGDR and disease has also been reported in recent observational studies, including those on vascular-related diseases (17–19, 37), heart failure (42), atherosclerosis (43, 44), and various chronic complications of diabetes (37, 38, 45, 46). Furthermore, high eGDR has been identified as a protective factor against adverse outcomes such as atrial fibrillation recurrence and mortality (15–17, 40, 44, 47). These findings collectively indicate that maintaining low eGDR has detrimental effects on health, and early intervention is recommended for individuals with low eGDR. Although there are no studies yet on the mechanism by which low eGDR leads to the progression of prediabetes to diabetes, the pathophysiology of IR suggests that increased IR during the transition from normoglycaemia to prediabetes leads to β-cell dysfunction; when β-cell function cannot overcome IR, progression from prediabetes to diabetes occurs (32, 33, 48). As eGDR increases, representing a reduction in IR, the progression of prediabetes is suppressed (14). Considering the current study’s context and findings, we recommend dynamic monitoring of eGDR in prediabetic patients and maintaining this value at a high level whenever possible.
In the RCS analysis, we observed an intriguing finding: a nonlinear, L-shaped relationship between eGDR and the reversion of prediabetes to normoglycaemia. Further analysis calculated the eGDR threshold associated with reversion to normoglycaemia as 6.81. Specifically, when the eGDR level was below 6.81, each unit increase in eGDR was associated with a 98% increase in the likelihood of prediabetes reversion (HR: 1.98, 95% CI: 1.38-2.84, P = 0.0002); when the eGDR level was above 6.81, the likelihood of prediabetes reversion significantly decreased and stabilized (HR: 1.10, 95% CI: 1.01-1.19, P = 0.03). Similar L-shaped associations have also been reported in recent studies. In a recent study of non-alcoholic fatty liver disease (NAFLD) patients, Song et al. identified an eGDR threshold of 5.95 as a potential cutoff point for NAFLD patients at risk of developing atherosclerosis. When eGDR was below 5.95, the probability of atherosclerosis accelerated in NAFLD patients (43). Additionally, a study from Switzerland on mortality reported similar results; Nyström et al. found an L-shaped relationship between eGDR and all-cause mortality in patients with type 1 diabetes, with a threshold between 8-10, where the risk of all-cause mortality stabilized when eGDR exceeded the threshold (16). Based on these findings and the current study results, we believe that attention should be paid to evaluating the nonlinear relationship of eGDR in metabolic-related diseases.
“Treating pre-disease” is an important concept in Traditional Chinese Medicine (49, 50), where “pre-disease” refers to a transitional state before the onset of illness. Prediabetes is an early stage of diabetes as well as multiple chronic complications. From both public health and clinical perspectives, identifying and recognizing this intermediate-risk group is essential, as early intervention in the prediabetic phase is most effective in preventing diabetes, cardiovascular diseases, and various chronic complications (3–8). Therefore, timely diagnosis of the prediabetic population and effective management of key modifiable factors are crucial for preventing chronic complications. Against this backdrop, the findings of the current study hold significant implications for clinical practice: (1) As a non-invasive and simple surrogate for IR, eGDR offers notable advantages over the HEGC in clinical practice, substantially reducing both the economic and time costs for patients. (2) According to the findings of the current study, eGDR provides significant assistance in assessing the transition of glucose status; in summary, a low eGDR is detrimental to the restoration of normal glucose levels in prediabetes and may also accelerate the progression to diabetes. Clinicians can utilize eGDR to evaluate the trends and potential for glucose progression and reversal in patients with prediabetes. (3) Although the mechanism underlying the relationship between eGDR and glycemic metabolic transitions remains unclear, analyzing the development background and constituent components of eGDR suggests that preventing hypertension and obesity can be of significant assistance in promoting glycemic control in prediabetes. (4) The findings of the current study can also provide references for the construction of future prediction models for the progression or regression of prediabetes. Incorporating eGDR may further enhance the predictive performance of these models.
Strengths: (1) This study is the first to describe the association between eGDR and the natural course of prediabetes, with novel findings related to both progression to diabetes and reversion to normoglycemia. (2) The study includes a large, nationally representative cohort and validates its findings across different standards and through sensitivity analyses.
Limitations: (1) Although the study controlled for a large number of confounding factors in the analysis, it cannot eliminate the potential bias from unmeasured or residual confounders (51). (2) The data collected in this study partly relied on self-reporting, supported by a review of existing medical records, but did not include systematic adjudication of clinical outcomes, which may introduce some recall bias (52). (3) The results of this study are based on a middle-aged and elderly Chinese population, which may differ in genetic background compared to younger populations and Western adults. In the future, results verification will be required in young people and other races. (4) The study’s broad geographic follow-up led to some loss of follow-up, resulting in missing data. (5) Due to the lack of oral glucose tolerance test data in the CHARLS cohort, in the current study, we primarily relied on the definition of impaired fasting glucose in the American Diabetes Association standards to diagnose prediabetes. This may have resulted in an underestimation of the incidence rates of prediabetes and diabetes, as well as the regression rate of normoglycemia in the study; additionally, the missing data on impaired glucose tolerance prevented further exploration of the differences in the association between eGDR and glycemic metabolism. Future research needs to further differentiate between subtypes of prediabetes to provide more accurate evidence. (6) In the current study, the specific diagnosis time of prediabetes in the study population could not be determined, making it impossible to ascertain the duration of prediabetes in the patients. This may have a certain impact on the assessment of glycemic transition. Future studies are recommended to further analyze the influence of the duration of prediabetes on subsequent glycemic transition. (7) The follow-up period of this study remains relatively short, making it uncertain whether the association between eGDR and glycemic transition in prediabetes remains stable over a longer follow-up duration. It is recommended to conduct further studies with a longer follow-up period and to explore the impact of changes in eGDR during follow-up on glycemic transition. (8) The current study has only established the association between the IR surrogate eGDR and glycemic transition; Considering that multiple non-invasive IR surrogates have already been developed (34–36), it is necessary to conduct comparative studies in the future to further determine which IR surrogate is most suitable for the assessment of glycemic transition.
In this prospective cohort study of middle-aged and elderly Chinese individuals, our results support a close association between higher eGDR and an increased likelihood of prediabetes reversion to normoglycaemia, as well as a decreased likelihood of progression to diabetes.
The raw data supporting the conclusions of this article will be made available by the authors, without undue reservation.
The studies involving humans were approved by the Ethics Review Committee of Peking University. The studies were conducted in accordance with the local legislation and institutional requirements. The participants provided their written informed consent to participate in this study.
XH: Formal analysis, Investigation, Software, Writing – original draft. SH: Investigation, Writing – original draft. CW: Investigation, Writing – original draft. GJ: Investigation, Writing – review & editing. KJ: Investigation, Writing – review & editing. ZL: Investigation, Writing – review & editing. WW: Funding acquisition, Project administration, Software, Supervision, Writing – review & editing. GS: Conceptualization, Investigation, Methodology, Project administration, Supervision, Writing – review & editing. YZ: Conceptualization, Data curation, Formal analysis, Funding acquisition, Investigation, Methodology, Project administration, Software, Supervision, Validation, Writing – review & editing.
The author(s) declare that financial support was received for the research and/or publication of this article. This work was supported by the National Natural Science Foundation of China [81670370 and 82360073]; the Natural Science Foundation of Jiangxi Province [20232BAB216004 and 20224ACB206004], Jiangxi Provincial Health Commission Science and Technology Plan Project (202510148), and the Jiangxi Provincial Cardiovascular Hospital Discipline Construction Project.
We would like to thank the CHARLS project team for their great efforts throughout the project.
The authors declare that the research was conducted in the absence of any commercial or financial relationships that could be construed as a potential conflict of interest.
All claims expressed in this article are solely those of the authors and do not necessarily represent those of their affiliated organizations, or those of the publisher, the editors and the reviewers. Any product that may be evaluated in this article, or claim that may be made by its manufacturer, is not guaranteed or endorsed by the publisher.
The Supplementary Material for this article can be found online at: https://www.frontiersin.org/articles/10.3389/fendo.2025.1500993/full#supplementary-material
1. Bragg F, Holmes MV, Iona A, Guo Y, Du H, Chen Y, et al. Association between diabetes and cause-specific mortality in rural and urban areas of China. JAMA. (2017) 317:280–9. doi: 10.1001/jama.2016.19720
2. Sun H, Saeedi P, Karuranga S, Pinkepank M, Ogurtsova K, Duncan BB, et al. IDF Diabetes Atlas: Global, regional and country-level diabetes prevalence estimates for 2021 and projections for 2045. Diabetes Res Clin Pract. (2022) 183:109119. doi: 10.1016/j.diabres.2021.109119
3. Chen Y, Xu L, Cheng Z, Zhang D, Yang J, Yin C, et al. Progression from different blood glucose states to cardiovascular diseases: a prospective study based on multi-state model. Eur J Prev Cardiol. (2023) 30:1482–91. doi: 10.1093/eurjpc/zwad196
4. Knowler WC, Barrett-Connor E, Fowler SE, Hamman RF, Lachin JM, Walker EA, et al. Reduction in the incidence of type 2 diabetes with lifestyle intervention or metformin. N Engl J Med. (2002) 346:393–403. doi: 10.1056/NEJMoa012512
5. Chen Y, Zhang P, Wang J, Gong Q, An Y, Qian X, et al. Associations of progression to diabetes and regression to normal glucose tolerance with development of cardiovascular and microvascular disease among people with impaired glucose tolerance: a secondary analysis of the 30 year Da Qing Diabetes Prevention Outcome Study. Diabetologia. (2021) 64:1279–87. doi: 10.1007/s00125-021-05401-x
6. Pratte KA, Johnson A, Beals J, Bullock A, Manson SM, Jiang L, et al. Regression to normal glucose regulation in american Indians and alaska natives of a diabetes prevention program. Diabetes Care. (2019) 42:1209–16. doi: 10.2337/dc18-1964
7. Perreault L, Pan Q, Mather KJ, Watson KE, Hamman RF, Kahn SE, et al. Effect of regression from prediabetes to normal glucose regulation on long-term reduction in diabetes risk: results from the Diabetes Prevention Program Outcomes Study. Lancet. (2012) 379:2243–51. doi: 10.1016/S0140-6736(12)60525-X
8. Bornfeldt KE, Tabas I. Insulin resistance, hyperglycemia, and atherosclerosis. Cell Metab. (2011) 14:575–85. doi: 10.1016/j.cmet.2011.07.015
9. Roden M, Shulman GI. The integrative biology of type 2 diabetes. Nature. (2019) 576:51–60. doi: 10.1038/s41586-019-1797-8
10. Cutruzzolà A, Parise M, Scavelli FB, Fiorentino R, Lucà S, Di Molfetta S, et al. The potential of glucose management indicator for the estimation of glucose disposal rate in people with type 1 diabetes. Nutr Metab Cardiovasc Dis. (2024) 34:2344–52. doi: 10.1016/j.numecd.2024.06.013
11. Tam CS, Xie W, Johnson WD, Cefalu WT, Redman LM, Ravussin E. Defining insulin resistance from hyperinsulinemic-euglycemic clamps. Diabetes Care. (2012) 35:1605–10. doi: 10.2337/dc11-2339
12. Williams KV, Erbey JR, Becker D, Arslanian S, Orchard TJ. Can clinical factors estimate insulin resistance in type 1 diabetes? Diabetes. (2000) 49:626–32. doi: 10.2337/diabetes.49.4.626
13. Epstein EJ, Osman JL, Cohen HW, Rajpathak SN, Lewis O, Crandall JP. Use of the estimated glucose disposal rate as a measure of insulin resistance in an urban multiethnic population with type 1 diabetes. Diabetes Care. (2013) 36:2280–5. doi: 10.2337/dc12-1693
14. He HM, Xie YY, Chen Q, Li YK, Li XX, Mu YK, et al. The additive effect of the triglyceride-glucose index and estimated glucose disposal rate on long-term mortality among individuals with and without diabetes: a population-based study. Cardiovasc Diabetol. (2024) 23:307. doi: 10.1186/s12933-024-02396-8
15. Helmink MAG, de Vries M, Visseren FLJ, de Ranitz WL, de Valk HW, Westerink J. Insulin resistance and risk of vascular events, interventions and mortality in type 1 diabetes. Eur J Endocrinol. (2021) 185:831–40. doi: 10.1530/EJE-21-0636
16. Nyström T, Holzmann MJ, Eliasson B, Svensson AM, Sartipy U. Estimated glucose disposal rate predicts mortality in adults with type 1 diabetes. Diabetes Obes Metab. (2018) 20:556–63. doi: 10.1111/dom.13110
17. Zabala A, Darsalia V, Lind M, Svensson AM, Franzén S, Eliasson B, et al. Estimated glucose disposal rate and risk of stroke and mortality in type 2 diabetes: a nationwide cohort study. Cardiovasc Diabetol. (2021) 20:202. doi: 10.1186/s12933-021-01394-4
18. Olson JC, Erbey JR, Forrest KY, Williams K, Becker DJ, Orchard TJ. Glycemia (or, in women, estimated glucose disposal rate) predict lower extremity arterial disease events in type 1 diabetes. Metabolism. (2002) 51:248–54. doi: 10.1053/meta.2002.30021
19. Ren X, Jiang M, Han L, Zheng X. Estimated glucose disposal rate and risk of cardiovascular disease: evidence from the China Health and Retirement Longitudinal Study. BMC Geriatr. (2022) 22:968. doi: 10.1186/s12877-022-03689-x
20. Zhao Y, Hu Y, Smith JP, Strauss J, Yang G. Cohort profile: the China health and retirement longitudinal study (CHARLS). Int J Epidemiol. (2014) 43:61–8. doi: 10.1093/ije/dys203
21. American Diabetes Association. Classification and diagnosis of diabetes: standards of medical care in diabetes-2021. Diabetes Care. (2021) 44:S15–33. doi: 10.2337/dc21-S002
22. Kim JH. Multicollinearity and misleading statistical results. Korean J Anesthesiol. (2019) 72:558–69. doi: 10.4097/kja.19087
23. Harrell FE Jr, Lee KL, Pollock BG. Regression models in clinical studies: determining relationships between predictors and response. J Natl Cancer Inst. (1988) 80:1198–202. doi: 10.1093/jnci/80.15.1198
24. Ananth CV, Kleinbaum DG. Regression models for ordinal responses: a review of methods and applications. Int J Epidemiol. (1997) 26:1323–33. doi: 10.1093/ije/26.6.1323
26. Zhou BF, Cooperative Meta-Analysis Group of the Working Group on Obesity in China. Predictive values of body mass index and waist circumference for risk factors of certain related diseases in Chinese adults–study on optimal cut-off points of body mass index and waist circumference in Chinese adults. BioMed Environ Sci. (2002) 15:83–96.
27. Chinese Society of Endocrinology, Chinese Diabetes Society, Chinese Association of Endocrinologists. Expert consensus on the intervention of prediabetes in chinese adults (2023 edition). Chin J Diabetes. (2023) 15:484–94. doi: 10.3760/cma.j.cn115791-20230509-00188
28. Sallar A, Dagogo-Jack S. Regression from prediabetes to normal glucose regulation: State of the science. Exp Biol Med (Maywood). (2020) 245:889–96. doi: 10.1177/1535370220915644
29. Beulens J, Rutters F, Rydén L, Schnell O, Mellbin L, Hart HE, et al. Risk and management of pre-diabetes. Eur J Prev Cardiol. (2019) 26:47–54. doi: 10.1177/2047487319880041
30. Cai X, Zhang Y, Li M, Wu JH, Mai L, Li J, et al. Association between prediabetes and risk of all cause mortality and cardiovascular disease: updated meta-analysis. BMJ. (2020) 370:m2297. doi: 10.1136/bmj.m2297
31. Schlesinger S, Neuenschwander M, Barbaresko J, Lang A, Maalmi H, Rathmann W, et al. Prediabetes and risk of mortality, diabetes-related complications and comorbidities: umbrella review of meta-analyses of prospective studies. Diabetologia. (2022) 65:275–85. doi: 10.1007/s00125-021-05592-3
32. Weyer C, Bogardus C, Mott DM, Pratley RE. The natural history of insulin secretory dysfunction and insulin resistance in the pathogenesis of type 2 diabetes mellitus. J Clin Invest. (1999) 104:787–94. doi: 10.1172/JCI7231
33. Salunkhe VA, Veluthakal R, Kahn SE, Thurmond DC. Novel approaches to restore beta cell function in prediabetes and type 2 diabetes. Diabetologia. (2018) 61:1895–901. doi: 10.1007/s00125-018-4658-3
34. Huang Z, Han Y, Hu H, Cao C, Liu D, Wang Z. Triglyceride to high-density lipoprotein cholesterol ratio is associated with regression to normoglycemia from prediabetes in adults: a 5-year cohort study in China. J Transl Med. (2023) 21:868. doi: 10.1186/s12967-023-04752-w
35. Chen X, Liu D, He W, Hu H, Wang W. Predictive performance of triglyceride glucose index (TyG index) to identify glucose status conversion: a 5-year longitudinal cohort study in Chinese pre-diabetes people. J Transl Med. (2023) 21:624. doi: 10.1186/s12967-023-04402-1
36. Wang X, Liu J, Cheng Z, Zhong Y, Chen X, Song W. Triglyceride glucose-body mass index and the risk of diabetes: a general population-based cohort study. Lipids Health Dis. (2021) 20:99. doi: 10.1186/s12944-021-01532-7
37. Girgis CM, Scalley BD, Park KE. Utility of the estimated glucose disposal rate as a marker of microvascular complications in young adults with type 1 diabetes. Diabetes Res Clin Pract. (2012) 96:e70–2. doi: 10.1016/j.diabres.2012.02.004
38. Linn W, Persson M, Rathsman B, Ludvigsson J, Lind M, Andersson Franko M, et al. Estimated glucose disposal rate is associated with retinopathy and kidney disease in young people with type 1 diabetes: a nationwide observational study. Cardiovasc Diabetol. (2023) 22:61. doi: 10.1186/s12933-023-01791-x
39. Shangguan Q, Liu Q, Yang R, Zhang S, Sheng G, Kuang M, et al. Predictive value of insulin resistance surrogates for the development of diabetes in individuals with baseline normoglycemia: findings from two independent cohort studies in China and Japan. Diabetol Metab Syndr. (2024) 16:68. doi: 10.1186/s13098-024-01307-x
40. Kuang M, Yang R, Huang X, Wang C, Sheng G, Xie G, et al. Assessing temporal differences in the predictive power of baseline TyG-related parameters for future diabetes: an analysis using time-dependent receiver operating characteristics. J Transl Med. (2023) 21:299. doi: 10.1186/s12967-023-04159-7
41. Yang H, Kuang M, Qiu J, He S, Yu C, Sheng G, et al. Relative importance of triglyceride glucose index combined with body mass index in predicting recovery from prediabetic state to normal fasting glucose: a cohort analysis based on a Chinese physical examination population. Lipids Health Dis. (2024) 23:71. doi: 10.1186/s12944-024-02060-w
42. Zhang D, Shi W, An T, Li C, Ding Z, Zhang J. Usefulness of estimated glucose disposal rate in detecting heart failure: results from national health and nutrition examination survey 1999-2018. Diabetol Metab Syndr. (2024) 16:189. doi: 10.1186/s13098-024-01402-z
43. Song J, Ma R, Yin L. Associations between estimated glucose disposal rate and arterial stiffness and mortality among US adults with non-alcoholic fatty liver disease. Front Endocrinol (Lausanne). (2024) 15:1398265. doi: 10.3389/fendo.2024.1398265
44. Sun J, Wang N, Li S, Li M, Zhang A, Qin B, et al. Estimated glucose disposal rate and risk of arterial stiffness and long-term all-acuse mortality: a 10-year prospective study. J Epidemiol Community Health. (2023) 78. doi: 10.1136/jech-2023-220664
45. Zhang Y, Sun W, Zhang Q, Bai Y, Ji L, Zheng H, et al. Estimated glucose disposal rate predicts the risk of diabetic peripheral neuropathy in type 2 diabetes: A 5-year follow-up study. J Diabetes. (2024) 16:e13482. doi: 10.1111/1753-0407.13482
46. Peng J, Li A, Yin L, Yang Q, Pan J, Yi B. Estimated glucose disposal rate predicts renal progression in type 2 diabetes mellitus: A retrospective cohort study. J Endocr Soc. (2023) 7:bvad069. doi: 10.1210/jendso/bvad069
47. Li X, Zhou Z, Xia Z, Dong Y, Chen S, Zhan F, et al. Association between estimated glucose disposal rate and atrial fibrillation recurrence in patients undergoing radiofrequency catheter ablation: a retrospective study. Eur J Med Res. (2024) 29:325. doi: 10.1186/s40001-024-01911-7
48. Fonseca VA. Defining and characterizing the progression of type 2 diabetes. Diabetes Care. (2009) 32 Suppl 2:S151–6. doi: 10.2337/dc09-S301
49. Yan Y, Sun Y, Wang X, Zhu L, Chen Y, Liu Z. Acupuncture for impaired glucose tolerance in people with obesity: A protocol for a multicenter randomized controlled trial. Front Med (Lausanne). (2022) 9:932102. doi: 10.3389/fmed.2022.932102
50. Du Y, Liu R, Sun G, Meng P, Song J. Pre-moxibustion and moxibustion prevent Alzheimer’s disease. Neural Regener Res. (2013) 8:2811–9. doi: 10.3969/j.issn.1673-5374.2013.30.003
51. Black N. Why we need observational studies to evaluate the effectiveness of health care. BMJ. (1996) 312:1215–8. doi: 10.1136/bmj.312.7040.1215
Keywords: estimated glucose disposal rate, prediabetes to normoglycaemia, diabetes, cohort study, Chinese
Citation: Huang X, He S, Wang C, Jian G, Jiang K, Lu Z, Wang W, Sheng G and Zou Y (2025) Association between estimated glucose disposal rate and prediabetes reversion and progression: a nationwide cohort study of middle-aged and elderly people in China. Front. Endocrinol. 16:1500993. doi: 10.3389/fendo.2025.1500993
Received: 24 September 2024; Accepted: 24 February 2025;
Published: 21 March 2025.
Edited by:
Xilin Yang, Tianjin Medical University, ChinaReviewed by:
Ljiljana Lukic, University of Belgrade, SerbiaCopyright © 2025 Huang, He, Wang, Jian, Jiang, Lu, Wang, Sheng and Zou. This is an open-access article distributed under the terms of the Creative Commons Attribution License (CC BY). The use, distribution or reproduction in other forums is permitted, provided the original author(s) and the copyright owner(s) are credited and that the original publication in this journal is cited, in accordance with accepted academic practice. No use, distribution or reproduction is permitted which does not comply with these terms.
*Correspondence: Wei Wang, d3dhbmdjdnJpQDE2My5jb20=; Guotai Sheng, dGdzMjAwNTA5QDE2My5jb20=; Yang Zou, anh5eHl6eUAxNjMuY29t
†These authors have contributed equally to this work and share first authorship
Disclaimer: All claims expressed in this article are solely those of the authors and do not necessarily represent those of their affiliated organizations, or those of the publisher, the editors and the reviewers. Any product that may be evaluated in this article or claim that may be made by its manufacturer is not guaranteed or endorsed by the publisher.
Research integrity at Frontiers
Learn more about the work of our research integrity team to safeguard the quality of each article we publish.