 Liping Xue
 Yi Zhang
 Qiu Zhang
- Department of Endocrinology, First Affiliated Hospital of Anhui Medical University, Hefei, China
Background: In this cross-sectional study, we aim to investigate the value of non-invasive advanced glycation end products (AGEs) detection in the early screening of diabetic nephropathy(DN) among individuals with type 2 diabetes mellitus and assess whether metabolic parameters and glycated hemoglobin A1c (HbA1c) can moderate this relationship.
Methods: A total of 912 T2DM patients were enrolled. The urinary albumin-to-creatinine ratio (UACR) was measured in morning urine samples to assess DN. AGEs were non-invasively measured through skin autofluorescence. Recognizing the role of age in both AGEs and DN, AGEage was calculated as AGEs × age/100 for related analyses.
Results: The overall prevalence of DN in the present study was 37.2%. Elevated AGEage(χ2 = 61.06) was associated with a higher prevalence of DN. Multivariable linear regression demonstrated that AGEage was positively associated with UACR levels(β = 0.154, 95% CI: 0.126, 0.306, P<0.001). In the moderation analysis, glycated hemoglobin A1c (HbA1c) affected the correlation between AGEage and UACR. Body mass index (BMI) and triglyceride glucose-body mass index (TyG-BMI) also affect the correlation between AGEage and UACR, there were significant interactions between AGEage, HbA1c, BMI, TyG-BMI, and UACR.
Conclusions: Complex associations and interactions were observed between AGEs, metabolic metrics, HbA1c, and DN. Implementing comprehensive interventions can potentially benefit the prevention of DN in T2DM patients.
1 Introduction
Type 2 diabetes mellitus (T2DM) has escalated into a global health crisis, which stands as the 11th leading cause of death worldwide due to chronic complications (1). Among the myriad microvascular complications associated with T2DM, diabetic nephropathy (DN) emerges as one of the most prevalent and severe, often culminating in end-stage kidney disease (ESKD). Current evidence suggests that DN is detected in approximately 33.6% of diabetic patients (2). It is generally characterized by an initial elevation in microalbuminuria excretion, a substantial increase in albuminuria, and a decline in glomerular filtration rate (GFR) (3). Research has underscored that diabetic patients exhibiting albuminuria are at a heightened risk of cardiovascular disease, mortality, and renal deterioration (4). Therefore, albuminuria serves as an early indicator of DN. Once DN manifests, its progression is challenging to reverse. Importantly, identifying diabetic patients prone to developing albuminuria could significantly aid in preventing the onset of DN.
Advanced glycation end products (AGEs) arise from the nonenzymatic glycosylation of proteins and lipids (5). This glycosylation process is intricate and slow. However, in a prolonged state of elevated glucose levels, glycosylation rates significantly accelerate, increasing AGEs. Studies have demonstrated a clear correlation between AGE accumulation in tissues and blood glucose levels (6). Furthermore, even after correcting hyperglycemia, AGE levels in diabetic tissues often fail to return to normal, leading to the concept of “metabolic memory” (7). Unlike HbA1c, AGEs are not merely byproducts of hyperglycemia but are also implicated in the development of diabetes (8). It is now understood that AGEs can crosslink with proteins, altering their structure, interfering with their functional properties, and binding to the receptor for advanced glycation end products (RAGE), thereby activating proinflammatory signaling pathways (9). These processes are also thought to contribute to the development of diabetic microvascular complications (10). Therefore, AGEs are gaining increasing attention, especially concerning their potential role as markers of DN. However, current methods for measuring AGEs are often complex and costly, making the need for cost-effective, portable, and stable measurement methods paramount. The non-invasive diabetes detector (DM scan), developed using optical detection technology for AGEs, offers the advantage of rapid, non-invasive measurements without the risk of cross-infection. Nevertheless, few studies have explored the relationship between DN and AGEs measured by skin autofluorescence.
While the significance of glycemic control in DN management has been established, it is imperative to consider other metabolism-associated risk factors. Obesity, a burgeoning global public health concern (11), has also been linked to kidney disease (12), with body mass index (BMI) serving as a common measure of obesity. A study in the UK revealed a positive correlation between higher BMI and an increased incidence of microalbuminuria, with this association particularly pronounced among individuals with higher BMI (13). Beyond BMI, various metabolic metrics are employed to assess their relationship with kidney disease. One such metric, the triglyceride-glucose-BMI (TyG-BMI) index, is a product of fasting blood glucose and triglyceride levels combined with BMI. It is currently used to evaluate the association with diabetes (14) and is considered an alternative surrogate marker for insulin resistance (IR), which itself is linked to kidney disease (15). However, few studies have investigated the association between TyG-BMI and DN.
As the prevalence of diabetes continues to surge, the burden of diabetes-associated nephropathy is also poised to increase. Accordingly, there is a pressing need for enhanced clinical prevention strategies to mitigate modifiable DN risk factors. Most existing studies have predominantly focused on the relationship between individual risk factors and DN, with few examining potential synergistic effects among these risk factors. Acknowledging the influence of glycemic management on DN, this study incorporates HbA1c into the model. Accordingly, we put forth the following hypotheses: 1) AGEs are associated with DN, 2) Obesity can modulate this relationship, and 3) An interaction exists between AGEs, obesity, HbA1c, and DN. The outcomes of this study are anticipated to provide vital insights for healthcare providers and decision-makers, facilitating informed clinical decisions in the realm of healthcare.
2 Materials and methods
2.1 Study design and participants
Given the complexity of DN and the absence of a genetic or proteomic marker for accurate DN prediction, we opted to assess the modifiable risk factors for DN, thereby enabling more practical approaches to DN prevention and risk management. Most DN prediction models include non-modifiable factors such as age and disease duration (16, 17). While these factors influence DN, they are beyond our control. Therefore, we focused on intervenable and manageable risk factors in this study.
This cross-sectional study employed comprehensive survey procedures to investigate the impact of metabolic factors on albuminuria. We collected data from inpatients diagnosed with T2DM admitted to the Department of Endocrinology at First Affiliated Hospital of Anhui Medical University from September 1, 2019 to September 30, 2020. Through the patient’s hospitalization number, we were still able to identify individual participant information during or after data collection. The diagnosis of T2DM was based on the 1999 World Health Organization (WHO) criteria (18). The study received approval from the Ethics Committee of the First Affiliated Hospital of Anhui Medical University, and written informed consent was obtained from all participants (Ethics Committee approval number PJ2023-11-43).
2.2 Sample size estimation
Based on previous research indicating a 33.6% incidence of DN among diabetic patients (2) and the desired level of relative precision of 0.15(ϵ), α=0.05, Z1-α/2 = 1.96, the minimum sample size was determined to be 172 using the following formula. Considering the design of diabetic nephropathy staging, ensuring that each group had a certain sample size for stratified analysis, we investigated 940 patients.
2.3 Inclusion and exclusion criteria
We included patients with T2DM between 18 and 80 years of age. Exclusion criteria encompassed: (1) acute illnesses; (2) known genetic renal diseases; and (3) acute renal failure attributed to factors such as drug use or contrast agents. Of the 940 patients initially considered, 28 were excluded due to missing potential confounding factors, ultimately leaving us with a total of 912 T2DM patients included in the study.
2.4 Exposure
All participants underwent a comprehensive medical history assessment and physical examination, including age, diabetes duration, current hypoglycemic regimen, past medical history, height, weight, and blood pressure. Body Mass Index (BMI) was calculated as weight (kg)/height2(m2). Fasting venous blood samples were collected for laboratory assays, including fasting plasma glucose (FPG), HbA1c, total cholesterol (TC), triglycerides (TG), creatinine (Cr), and uric acid (UA).
Hypertension was defined as SBP ≥ 140 mmHg or DBP ≥ 90 mmHg or current use of antihypertensive medication (19). Hyperlipidemia was defined as TC>5.69 mmol/L or TG>1.68 mmol/L or current lipid-lowering medication use. According to Chinese criteria, overweight was defined as BMI ≥ 24 kg/m² and < 28 kg/m2, while obesity was defined as BMI ≥28 kg/m2 (20). HbA1c levels exceeding 7.0% were considered elevated (21). The age limit was set at 65 years based on the literature (22). The maximum diabetes duration was 10 years (22). The study utilized two surrogate markers of IR: TyG (23) and TyG-BMI (24). The estimation of the glomerular filtration rate (eGFR) was conducted through calculation using the Chronic Kidney Disease Epidemiology Collaboration (CKD-EPI) equation (25).
2.5 Outcome
Morning urine samples were collected to measure urinary albumin-to-creatinine ratio (UACR) levels. Albuminuria was categorized as nonalbuminuria (<30 mg/g), microalbuminuria (30 to 300 mg/g), or macroalbuminuria (>300 mg/g) (26).
2.6 Assessment of AGEs
Skin AGEs were assessed using the DM Scan detection device (Anhui Yikangda Optoelectronics Technology Co., Ltd., Hefei, China). The device employed an excitation light source with a peak wavelength of 370 nm to illuminate approximately 0.1 cm² of skin, measuring emitted light with a spectrometer within the range of 420 - 600 nm. Skin autofluorescence was calculated from the ratio of emitted light to reflected light using DM Scan software version 1.02. All measurements were conducted by trained nurses in semi-dark, room-temperature settings. Emphasis was placed on taking measurements from normal skin sites devoid of visible vessels, scars, lichenization, or other skin irregularities. Each subject’s skin AGEs were measured three times, and the mean was recorded. AGEage was calculated as AGEs × age/100.
2.7 Sensitivity analysis
To assess the robustness of the model, we employed UACR as a categorical variable in the moderation analysis.
2.8 Statistical analysis
All data were subjected to statistical analysis using SPSS 23.0. Demographic and clinical characteristics of the participants were presented as either means with standard deviations or interquartile ranges (IQRs) for skewed data. Missing values were not filled in and were normally processed for analysis. The analysis proceeded through four distinct steps. Step 1 entailed the descriptive statistics, providing an overview of the general situation within the three albuminuria groups. Step 2 involved calculating Spearman’s correlation coefficients to assess the relationships between UACR and other biomarkers. Moving to Step 3, we conducted a multivariable logistic regression analysis to unveil the associations between metabolic indicators and UACR. Finally, in Step 4, we undertook a moderating analysis using the PROCESS method to elucidate the intricate relationships between metabolic indicators and UACR. To establish the presence of a moderating effect, the following criteria needed to be met: (a) a significant direct effect of AGEage on UACR, (b) a significant direct effect of the moderator (metabolic metrics) on UACR, and (c) a significant direct interaction effect (AGEage × HbA1c × metabolic metrics) on UACR. Within SPSS software, the interactive effect was automatically computed, and it also provided the proportion of variance explained by the moderating effect of BMI (indicated by an increase in R2). A significant moderating effect was considered when the 95% confidence interval (CI) did not include zero.
3 Results
3.1 Characteristics of the study population
A total of 940 patients diagnosed with type 2 diabetes were initially enrolled in this study. After excluding those with missing data, the final analysis included 912 patients with T2DM (470 men and 442 women). The clinical characteristics of the participants, categorized based on the degree of albuminuria, are presented in Table 1. Notably, 339 participants exhibited higher levels of UACR, resulting in an overall prevalence of 37.2%. Among the various factors analyzed, older age (χ2 = 8.305), longer duration of diabetes (χ² = 35.284), higher systolic blood pressure (SBP) (χ2 = 60.268), diastolic blood pressure (DBP) (χ2 = 6.55),increased accumulation of AGEs (χ2 = 31.66), higher AGEage (χ2 = 61.06), higher triglyceride (TG) levels (χ² = 8.716), higher total cholesterol (TC) levels (χ² = 14.362), Female gender (χ2 = 23.135), higher TyG (χ2 = 21.351), higher TyG-BMI (χ2 = 18.62), and lower eGFR (χ2 = 225.7) were significantly associated with a higher prevalence of albuminuria. Conversely, factors such as BMI(χ2 = 3.164), HbA1c (χ2 = 2.484),did not exhibit significant correlations across the three groups.
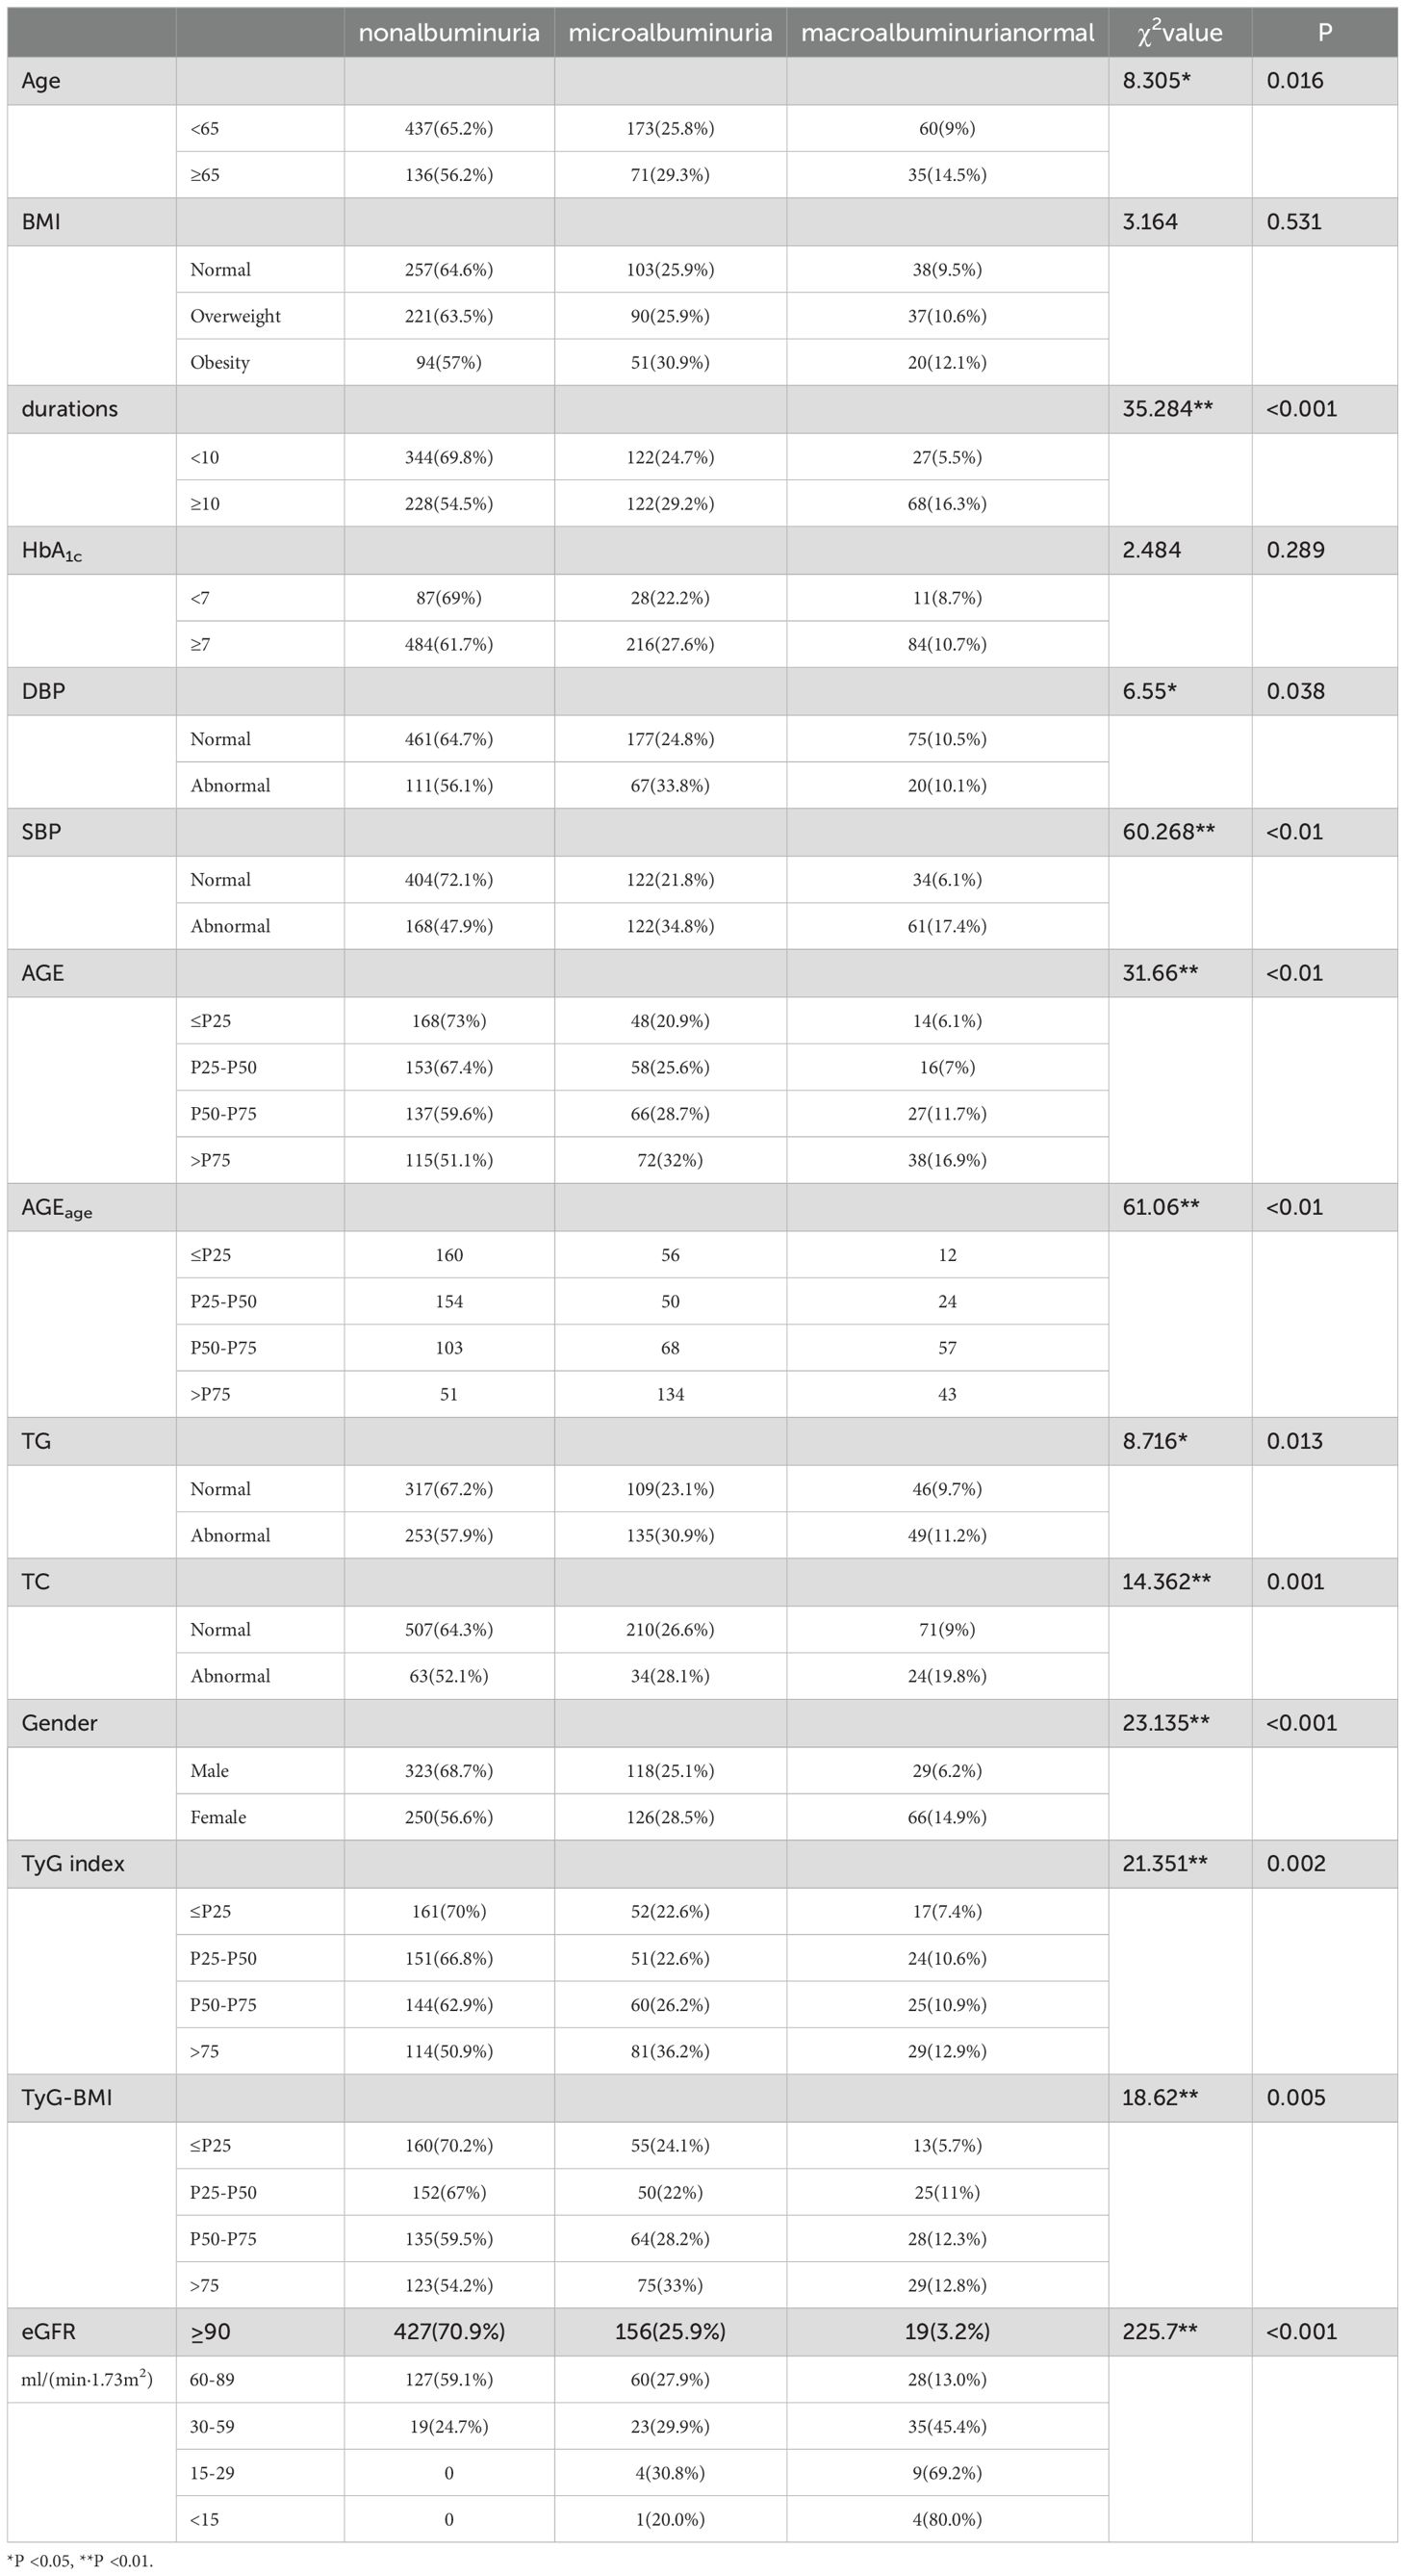
Table 1. The prevalence characteristics of three groups of albuminuria.
3.2 Spearman correlation analysis between the risk factors and UACR
Next, spearman correlation analysis was utilized to assess the relationships between AGEage, BMI, TyG-BMI, HbA1c, and UACR. The results indicated that AGEage exhibited a significant association with BMI (rs=-0.218, P<0.01), TyG-BMI (rs=-0.27, P<0.01), HbA1c (rs=-0.103, P<0.01), and UACR (rs = 0.157, P<0.01). Additionally, BMI showed a significant correlation with TyG-BMI (rs=0.904, P<0.01) but did not exhibit statistically significant correlations with HbA1c (rs = -0.03, P > 0.05) or UACR (rs=0.056, P>0.05). TyG-BMI demonstrated significant correlations with HbA1c (rs=0.078, P<0.05) and UACR (rs=0.137, P < 0.01), while HbA1c displayed a significant correlation with UACR (rs=0.094, P<0.01). The results are summarized in Table 2.
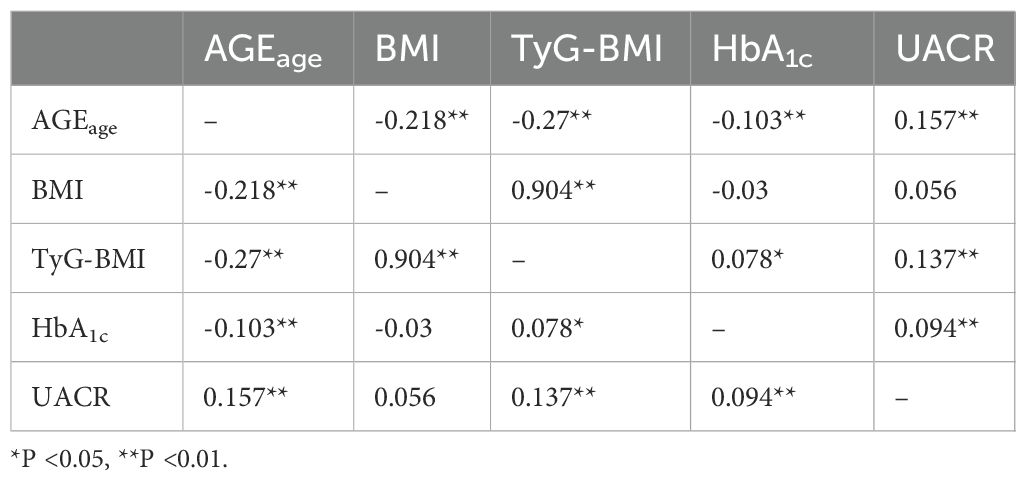
Table 2. The Spearman correlation matrices for AGEage, HbA1c, BMI, TyG-BMI, and UACR.
3.3 Multilevel linear regression between UACR and independent variables
In Table 3, the data indicated a dose-response relationship between AGEage and UACR (β=0.154), There was a borderline dose-response relationship between HbA1c and UACR (β=0.064). However, no dose-response relationship was observed between BMI, TyG-BMI, and UACR. After adjusting for gender and age, the relationship between AGEage, HbA1c and UACR remained statistically significant. Notably, there was a dose-response relationship between BMI, TyG-BMI, and UACR (BMI: β=0.05, TyG-BMI: β=0.086).
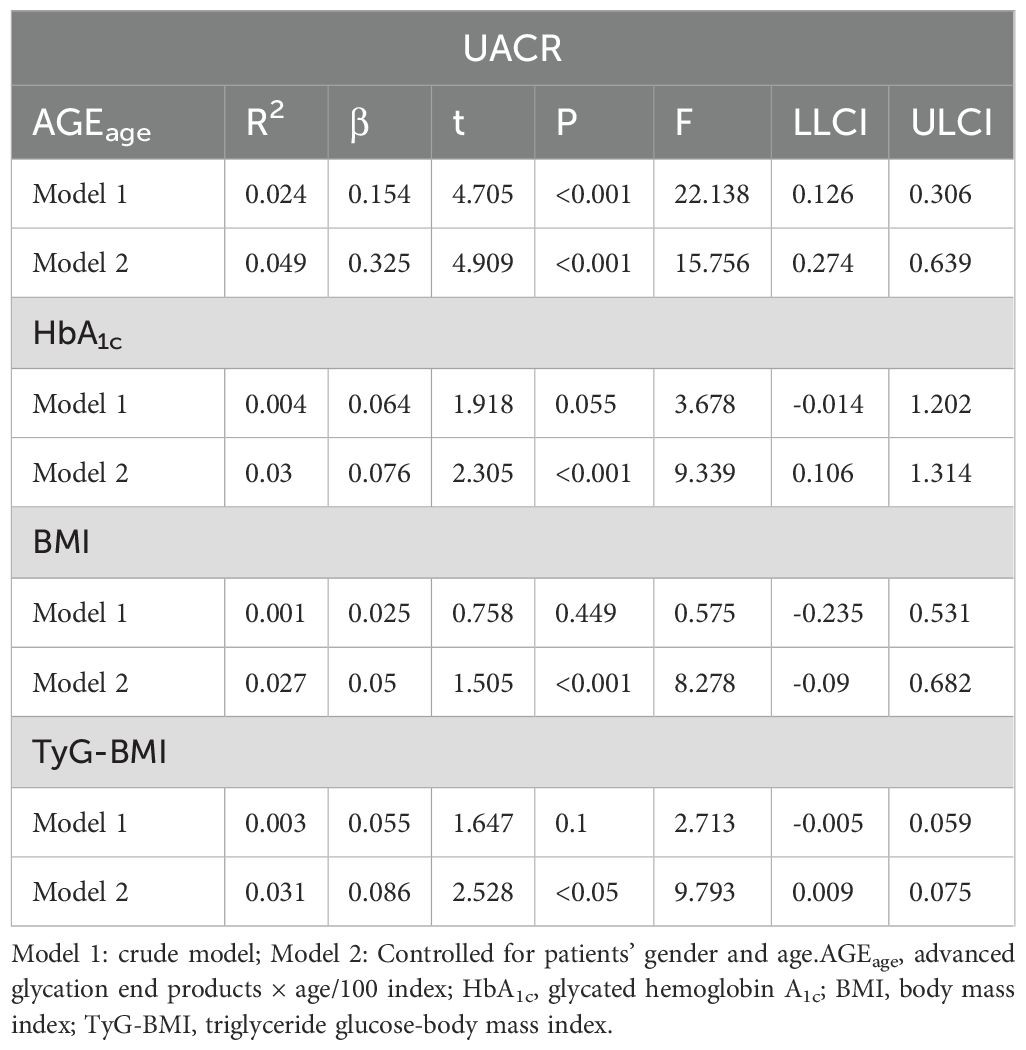
Table 3. The multilevel linear regression between independent variables and UACR.
3.4 Moderation analysis
Moderation analyses were performed for AGEage, HbA1c, BMI, and UACR, as shown in Table 4. First, AGEage significantly predicted the severity of UACR (P < 0.05). However, HbA1c was not associated with UACR (P > 0.05), and BMI exhibited no significant correlation with UACR (P > 0.05). Second, the moderation analysis revealed that HbA1c moderated the effect of AGEage on UACR (P < 0.01). Similarly, BMI moderated the effect of AGEage on UACR (P < 0.05), indicating that higher levels of both HbA1c and BMI were associated with increased AGEage and, subsequently, higher UACR levels. BMI did not moderate the effect of HbA1c on UACR (P > 0.05). Finally, a significant three-way interaction among AGEage, BMI, and HbA1c was observed for UACR levels in the overall sample (P < 0.01).
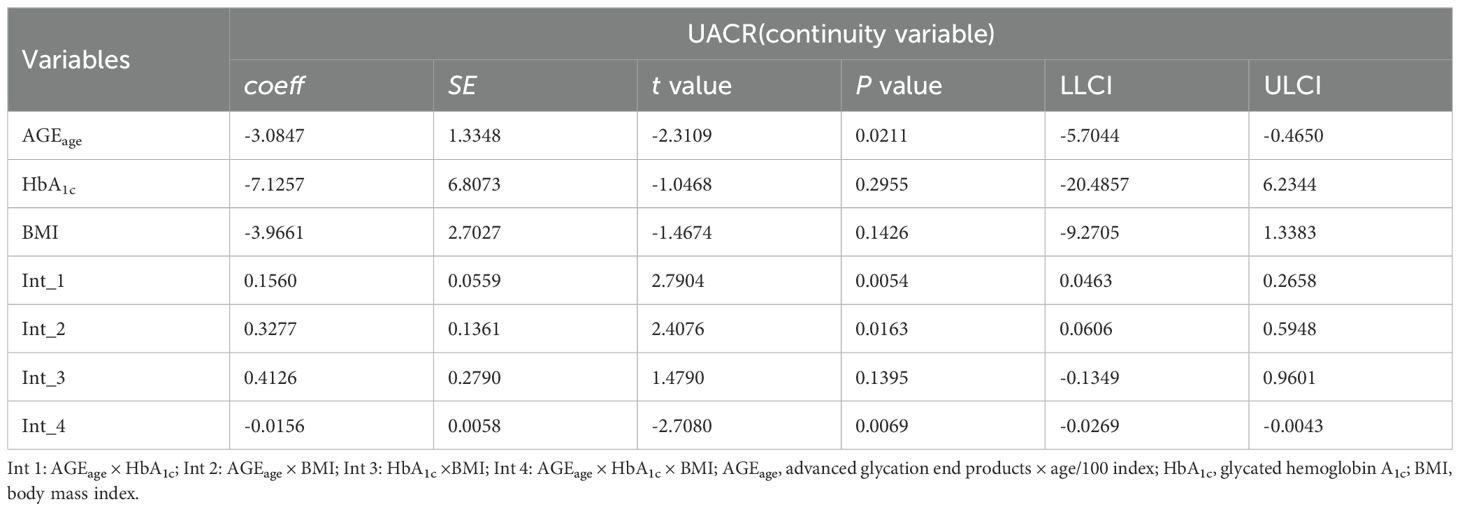
Table 4. Association between AGEage and HbA1c, BMI and UACR.
Additional moderation analyses were conducted for AGEage, HbA1c, TyG-BMI, and UACR, as detailed in Table 5. The results revealed no significant correlation between UACR and AGEage (P > 0.05), HbA1c (P > 0.05), or TyG-BMI (P > 0.05). However, moderation analysis indicated that both HbA1c and TyG-BMI moderated UACR as a result of AGEage (P < 0.05), suggesting that elevated levels of HbA1c and TyG-BMI were associated with increased AGEage and subsequent elevations in UACR. Notably, TyG-BMI did not moderate the effect of HbA1c on UACR (P > 0.05). Moreover, a significant three-way interaction among AGEage, TyG-BMI, and HbA1c was observed for UACR levels in the overall sample (P < 0.05).
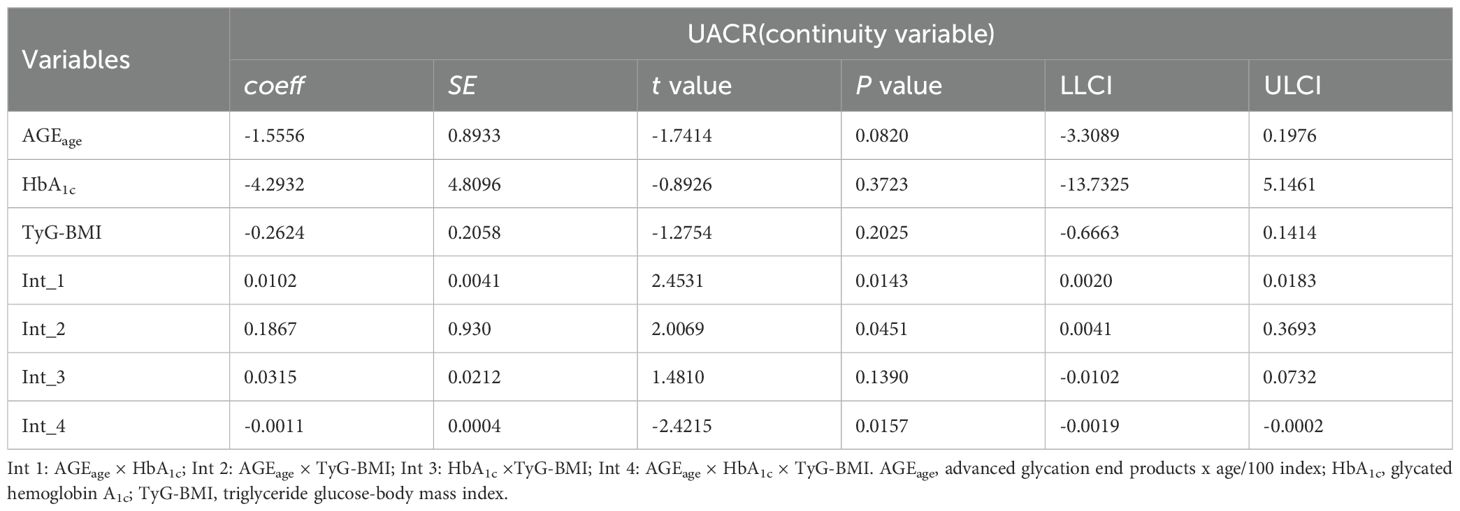
Table 5. Association between AGEage and HbA1c, TyG-BMI and UACR.
3.5 Sensitivity analyses
An analysis using UACR as a three-level categorical variable was performed to further examine the interactions. The results, presented in Table 6 and Table 7, indicated a significant three-way interaction among AGEage, BMI, and HbA1c for UACR in the overall sample (P = 0.0563), along with a significant three-way interaction among AGEage, TyG-BMI, and HbA1c for UACR (P < 0.05).
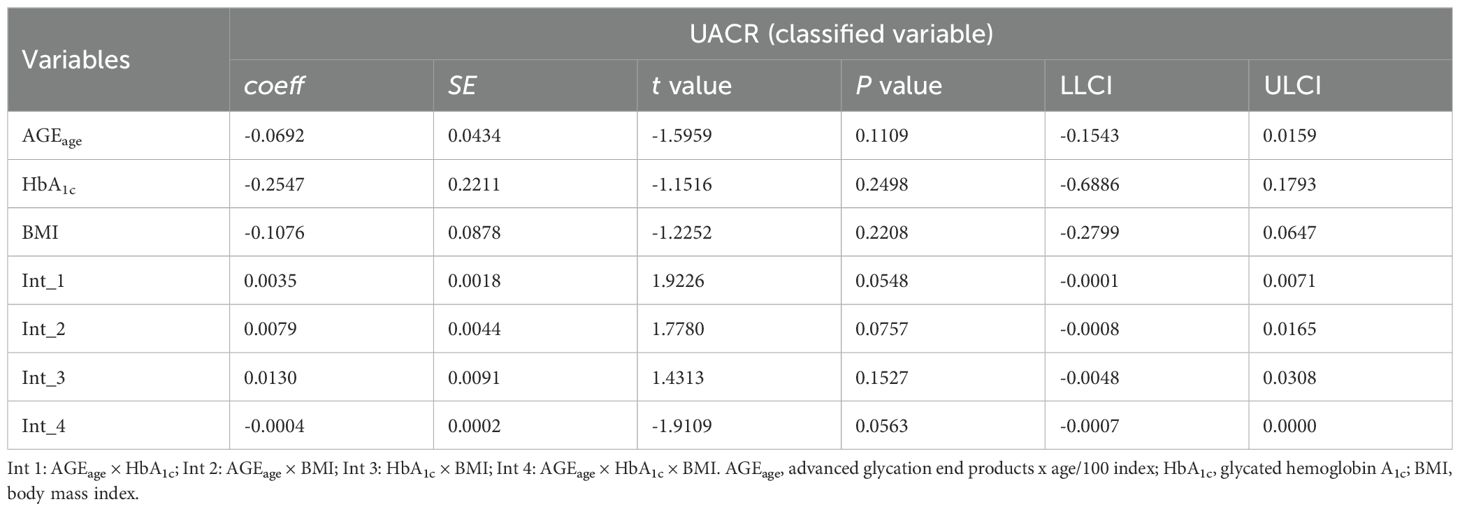
Table 6. Association between AGEage and HbA1c, BMI among three groups of albuminuria.

Table 7. Association between AGEage and HbA1c, TyG-BMI among three groups of albuminuria.
4 Discussion
In this retrospective cross-sectional study, several key findings emerged. First, we observed a DN incidence of 37.2% among hospitalized T2DM patients, slightly higher than the rates reported in previous studies (2). Notably, among these DN patients, 58.4% had a BMI exceeding 24 kg/m², and only 11.5% had HbA1c levels below 7%. This finding highlights the inadequacy of comprehensive T2DM management among this population. Second, our study revealed a significant correlation between AGEs and DN, with higher AGE levels indicating an increased risk of DN. Considering the influence of age on both AGEs and DN, we introduced the AGEage index, which integrates AGEs and age. Lastly, we identified a three-way interaction among obesity, AGEs, and DN with HbA1c in this regulatory relationship. These findings were supported by the results of sensitivity analyses, emphasizing their robustness.
Unlike diabetic macroangiopathy, diabetic microangiopathy is more closely associated with blood glucose, as evidenced in numerous large clinical studies (27, 28). Chronic hyperglycemia leads to increased oxidative stress, initiating the accumulation of AGEs in cells via activation through pathways such as the hexose pathway, polyol pathway, and protein kinase C, resulting in overexpression of RAGE and subsequent activation of various inflammatory cytokines (29). Studies on animals have indicated that inhibiting carboxymethyllysine (CML) may protect against DN progression (30), while young diabetic rats treated with AGEs precursors exhibit renal lesions similar to those seen in aged diabetic rats (31). AGEs are, therefore, crucial in DN development, and AGEs-generated markers can be harnessed to assess DN risk.
Recent studies have shown that non-invasive devices measuring skin AGE fluorescence can be used for diabetes screening, offering a simple and rapid approach (32). However, previous research on the association between non-invasive skin AGEs and diabetic complications has primarily focused on Caucasian populations, showing significant positive correlations between AGEs and diabetic vascular complications (33). Given the impact of skin tone on skin AGE levels, research on the relationship between AGEs and DN in Chinese diabetic populations remains limited. In this study, we employed UACR as a marker for DN to investigate the AGE-DN relationship. Given the significance of age in both AGEs and DN, we introduced the AGEage index. We found that AGEage levels were significantly elevated in DN, and after adjusting for factors including age, sex, and HbA1c, AGEage remained positively correlated with UACR levels. This finding indicates that AGEage influences UACR independently of HbA1c, underlining its value in assessing DN.
One of the management strategies for T2DM is lifestyle modification, including weight loss. A longitudinal study involving 369,362 participants aged 2-15 years indicated that a high percentage of T2DM patients were obese (47.1%), with only 4.33% having a normal BMI (34). This underscores the strong link between obesity and diabetes. Moreover, studies have independently identified BMI as a risk factor for DN (16). Large population-based investigations have corroborated the increased risk of nephropathy in individuals with both diabetes and obesity, and this risk remains elevated even after stringent glycemic control (35). This highlights the role of obesity in DN development, independently of blood glucose control. Overall, our study findings confirm the association of BMI with DN, emphasizing the importance of BMI control in T2DM management.
The interaction between BMI and AGEs has become a research hotspot. AGEs typically accumulate slowly through glycation processes, with hyperglycemia and hyperlipidemia accelerating AGE accumulation in vivo (36). Given that both hyperglycemia and hyperlipidemia are prevalent in obese individuals, it is reasonable to speculate that AGE levels are higher in obese patients, as supported by previous research (37). Our study consistently validated the association between BMI and AGEage. In vitro and animal experiments further supported this relationship, demonstrating that RAGE overexpression induces adipocyte hypertrophy (38) and that mice fed a high-fat high-AGE diet exhibit greater weight gain and more visceral fat compared with mice fed a high-fat low AGE diet for 6 weeks (39). Additionally, obese individuals often have less healthy dietary habits, consuming highly processed Western-style foods rich in exogenous AGEs, which can be absorbed into the bloodstream and accumulate in the body (40). Considering this interaction, we propose that AGEs interact with BMI to facilitate DN development. Our study validated this hypothesis, with moderating analysis showing that AGEage interacts with BMI to increase the UACR. In contrast, HbA1c and BMI did not exhibit a synergistic effect on DN risk, underscoring the greater importance of AGEage in DN, with BMI exacerbating the condition. Although HbA1c did not exert a moderating effect on BMI, we identified a three-way interaction between AGEage, HbA1c, BMI, and UACR, suggesting that patients with T2DM, especially those with higher AGEs, obesity, and HbA1c levels, are at a heightened risk of urinary proteinuria. Effective management of HbA1c and weight reduction can mitigate the impact of AGEs on UACR, emphasizing the importance of a comprehensive approach. On one hand, it involves strict blood glucose control to reduce HbA1c levels and minimize endogenous AGE production. On the other hand, it necessitates dietary control to reduce the consumption of high-AGE foods, thereby decreasing the absorption of exogenous AGEs and lowering the risk of obesity.
While obesity is primarily linked to dietary factors, there are additional contributors to obesity, including IR. The development of IR is closely associated with obesity in a complex relationship, both being integral components of the metabolic syndrome. IR is a well-established risk factor for cardiovascular and cerebrovascular diseases and plays a significant role in DN. Animal studies have shown that mice fed a high-fat diet, resulting in obesity and IR, exhibit increased UACR levels and altered renal outcomes, indicating tubular dilation and interstitial vacuolation (41). Therefore, we examined another metabolic indicator, TyG-BMI, to represent IR. TyG-BMI, derived from the product of the TyG index and BMI, effectively reflects various metabolic processes in the body. Studies have previously established that elevated levels of TyG-BMI can heighten the risk of prediabetes, especially among non-obese individuals (42). Causality between TyG-BMI and the incidence of diabetes has been reported, particularly in non-obese populations (14). Nevertheless, the relationship between TyG-BMI and DN has received less attention. Our study provided hitherto undocumented evidence of a significant positive relationship between TyG-BMI and UACR, indicating that TyG-BMI is a potential risk factor for DN, possibly surpassing BMI’s significance. As a moderating variable, TyG-BMI exerts a distinct influence on the relationship between AGEs and UACR levels. Concurrently, in vitro and animal experiments suggest that AGEs can influence cellular insulin sensitivity and insulin secretion capacity (43, 44). This implies that non-obese type 2 diabetes patients, despite seemingly meeting BMI standards, should consider other metabolic factors since BMI fails to capture fat distribution, and abdominal obesity is more strongly associated with IR.
Herein, we established a retrospective model to assess the correlation between these metabolic indicators and DN. We unveiled the intricate interaction among AGEs, obesity-related metabolic metrics, and HbA1c, all associated with UACR levels. This underscores the significance of comprehensive diabetes management. Given that albuminuria in diabetic patients is largely preventable, effective management and treatment strategies should persist even after the onset of DN, aiming to retard disease progression. Comprehensive management awareness is imperative for diabetic patients, and early, timely interventions can substantially reduce the incidence of DN.
This study boasts several strengths, including its multilevel design and the inclusion of a substantial sample size. Furthermore, our study uniquely investigates DN by exploring the relationship between obesity and non-invasive AGEs, offering compelling insights into preventing proteinuria in type 2 diabetes mellitus. However, certain limitations should be acknowledged. First, in recent years, a subtype of DN has been proposed with low estimated glomerular filtration rate but without albuminuria, accounting for about 10.1% of diabetes patients (45), thus this subtype therefore needs to be studied to adjust the management strategy. Second, the cross-sectional nature of this study makes it challenging to establish causal relationships or confirm long-term clinical outcomes.
In conclusion, our study highlights the higher incidence of DN within the hospitalized T2DM population. We propose multifaceted management strategies to prevent DN in T2DM patients. Additionally, we introduce AGEage, a non-invasive measure of accumulated AGEs adjusted for age, as a promising approach for identifying patients at high risk of developing DN.
Data availability statement
The raw data supporting the conclusions of this article will be made available from the corresponding author on reasonable use.
Ethics statement
The studies involving humans were approved by The First Affiliated Hospital of Anhui Medical University. The studies were conducted in accordance with the local legislation and institutional requirements. The participants provided their written informed consent to participate in this study.
Author contributions
LX: Formal Analysis, Investigation, Methodology, Writing – original draft, Writing – review & editing. YZ: Data curation, Formal Analysis, Resources, Supervision, Writing – review & editing. QZ: Conceptualization, Formal Analysis, Funding acquisition, Project administration, Supervision, Writing – review & editing.
Funding
The author(s) declare financial support was received for the research, authorship, and/or publication of this article. This work was supported by the National Natural Science Foundation of China under Grant (number 82370836).
Acknowledgments
We would like to acknowledge our cooperators for assistance in data collection.
Conflict of interest
The authors declare that the research was conducted in the absence of any commercial or financial relationships that could be construed as a potential conflict of interest.
Publisher’s note
All claims expressed in this article are solely those of the authors and do not necessarily represent those of their affiliated organizations, or those of the publisher, the editors and the reviewers. Any product that may be evaluated in this article, or claim that may be made by its manufacturer, is not guaranteed or endorsed by the publisher.
Abbreviation
AGEs, Advanced glycation end products; DN, diabetic nephropathy; T2DM, type 2 diabetes mellitus; HbA1c, glycated hemoglobin A1c; UACR, urinary albumin-to-creatinine ratio; BMI, body mass index; TyG-BMI, triglyceride glucose-body mass index; SBP, higher systolic blood pressure; DBP, diastolic blood pressure; TG, triglyceride; TC, total cholesterol; ESKD, end-stage kidney disease; GFR, glomerular filtration rate; IR, insulin resistance; WHO, World Health Organization; FPG, fasting plasma glucose; Cr, creatinine; UA, uric acid; IQRs, interquartile ranges; CI, confidence interval; CML, carboxymethyllysine.
References
1. Nicholas JK, Arora M, Ryan MB, Zulfiqar AB, Brown J, Carter A, et al. Global, regional, and national disability-adjusted life-years (DALYs) for 315 diseases and injuries and healthy life expectancy (HALE), 1990-2015: a systematic analysis for the Global Burden of Disease Study 2015. Lancet. (2016) 388:1603–58. doi: 10.1016/S0140-6736(16)31460-X
2. Ma RCW. Correction to: Epidemiology of diabetes and diabetic complications in China. Diabetologia. (2018) 61:1491. doi: 10.1007/s00125-018-4616-0
3. Mogensen CE. Diabetic renal disease in patients with type 2 diabetes mellitus: new strategies for prevention and treatment. Treat Endocrinol. (2002) 1:3–11. doi: 10.2165/00024677-200201010-00001
4. Niu J, Zhang X, Li M, Wu S, Zheng R, Chen L, et al. Risk of cardiovascular disease, death, and renal progression in diabetes according to albuminuria and estimated glomerular filtration rate. Diabetes Metab. (2023) 49:101420. doi: 10.1016/j.diabet.2023.101420
5. Shamsi A, Shahwan M, Husain FM, Khan MS. Characterization of methylglyoxal induced advanced glycation end products and aggregates of human transferrin: Biophysical and microscopic insight. Int J Biol Macromol. (2019) 138:718–24. doi: 10.1016/j.ijbiomac.2019.07.140
6. Li Q, Wen Y, Wang L, Chen B, Chen J, Wang H, et al. Hyperglycemia-induced accumulation of advanced glycosylation end products in fibroblast-like synoviocytes promotes knee osteoarthritis. Exp Mol Med. (2021) 53:1735–47. doi: 10.1038/s12276-021-00697-6
7. Rajaobelina K, Cougnard-Gregoire A, Delcourt C, Gin H, Barberger-Gateau P, Rigalleau V. Autofluorescence of skin advanced glycation end products: marker of metabolic memory in elderly population. J Gerontol A Biol Sci Med Sci. (2015) 70:841–6. doi: 10.1093/gerona/glu243
8. Khalid M, Petroianu G, Adem A. Advanced glycation end products and diabetes mellitus: mechanisms and perspectives. Biomolecules. (2022) 12:542. doi: 10.3390/biom12040542
9. Nowotny K, Jung T, Höhn A, Weber D, Grune T. Advanced glycation end products and oxidative stress in type 2 diabetes mellitus. Biomolecules. (2015) 5:194–222. doi: 10.3390/biom5010194
10. Mengstie MA, Chekol Abebe E, Behaile Teklemariam A, Tilahun Mulu A, Agidew MM, Teshome Azezew M, et al. Endogenous advanced glycation end products in the pathogenesis of chronic diabetic complications. Front Mol Biosci. (2022) 9:1002710. doi: 10.3389/fmolb.2022.1002710
11. Perdomo CM, Cohen RV, Sumithran P, Clément K, Frühbeck G. Contemporary medical, device, and surgical therapies for obesity in adults. Lancet. (2023) 401:1116–30. doi: 10.1016/S0140-6736(22)02403-5
12. Kjaergaard AD, Teumer A, Witte DR, Stanzick KJ, Winkler TW, Burgess S, et al. Obesity and kidney function: A two-sample mendelian randomization study. Clin Chem. (2022) 68:461–72. doi: 10.1093/clinchem/hvab249
13. Kawar B, Bello AK, El Nahas AM. High prevalence of microalbuminuria in the overweight and obese population: data from a UK population screening programme. Nephron Clin Pract. (2009) 112:c205–12. doi: 10.1159/000218365
14. Wang X, Liu J, Cheng Z, Zhong Y, Chen X, Song W. Triglyceride glucose-body mass index and the risk of diabetes: a general population-based cohort study. Lipids Health Dis. (2021) 20:99. doi: 10.1186/s12944-021-01532-7
15. Parvathareddy VP, Wu J, Thomas SS. Insulin resistance and insulin handling in chronic kidney disease. Compr Physiol. (2023) 13:5069–76. doi: 10.1002/cphy.c220019
16. Jiang W, Wang J, Shen X, Lu W, Wang Y, Li W, et al. Establishment and validation of a risk prediction model for early diabetic kidney disease based on a systematic review and meta-analysis of 20 cohorts. Diabetes Care. (2020) 43:925–33. doi: 10.2337/dc19-1897
17. Ravizza S, Huschto T, Adamov A, Böhm L, Büsser A, Flöther FF, et al. Predicting the early risk of chronic kidney disease in patients with diabetes using real-world data. Nat Med. (2019) 25:57–9. doi: 10.1038/s41591-018-0239-8
18. Alberti KG, Zimmet PZ. Definition, diagnosis and classification of diabetes mellitus and its complications. Part 1: diagnosis and classification of diabetes mellitus provisional report of a WHO consultation. Diabetes Med. (1998) 15:539–53. doi: 10.1002/(SICI)1096-9136(199807)15:7<539::AID-DIA668>3.0.CO;2-S
19. Chalmers J, MacMahon S, Mancia G, Whitworth J, Beilin L, Hansson L, et al. 1999 World Health Organization-International Society of Hypertension Guidelines for the management of hypertension. Guidelines sub-committee of the World Health Organization. Clin Exp Hypertens. (1999) 21:1009–60. doi: 10.3109/10641969909061028
20. Chen K, Shen Z, Gu W, Lyu Z, Qi X, Mu Y, et al. Prevalence of obesity and associated complications in China: A cross-sectional, real-world study in 15.8 million adults. Diabetes Obes Metab. (2023) 25:3390–9. doi: 10.1111/dom.v25.11
21. Wang J, Zhang L, Bai Y, Wang X, Wang W, Li J, et al. The influence of shorter red blood cell lifespan on the rate of HbA1c target achieved in type 2 diabetes patients with a HbA1c detection value lower than 7. J Diabetes. (2023) 15:7–14. doi: 10.1111/1753-0407.13345
22. Kim KS, Park SW, Cho YW, Kim SK. Higher prevalence and progression rate of chronic kidney disease in elderly patients with type 2 diabetes mellitus. Diabetes Metab J. (2018) 42:224–32. doi: 10.4093/dmj.2017.0065
23. Zhang T, Liu Y, Ge Z, Tian D, Lin L, Zhao Z, et al. Predictive value of triglyceride-glucose index fo2021r in-hospital mortality in patients with severe fever with thrombocytopenia syndrome: A multi-center observational study. Front Med (Lausanne). (2021) 8:768101. doi: 10.3389/fmed.2021.768101
24. Song B, Zhao X, Yao T, Lu W, Zhang H, Liu T, et al. Triglyceride glucose-body mass index and risk of incident type 2 diabetes mellitus in Japanese people with normal glycemic level: A population-based longitudinal cohort study. Front Endocrinol (Lausanne). (2022) 13:907973. doi: 10.3389/fendo.2022.907973
25. Levey AS, Stevens LA, Schmid CH, Zhang LYP, Castro AF, Feldman HI, et al. A new equation to estimate glomerular filtration rate. Ann Intern Med. (2009) 150:604–12. doi: 10.7326/0003-4819-150-9-200905050-00006
26. Stevens PE, Levin A. Evaluation and management of chronic kidney disease: synopsis of the kidney disease: improving global outcomes 2012 clinical practice guideline. Ann Intern Med. (2013) 158:825–30. doi: 10.7326/0003-4819-158-11-201306040-00007
27. Diabetes control and complications trial (DCCT). Update. DCCT research group. Diabetes Care. (1990) 13:427–33. doi: 10.2337/diacare.13.4.427
28. Intensive blood-glucose control with sulphonylureas or insulin compared with conventional treatment and risk of complications in patients with type 2 diabetes (UKPDS 33). UK Prospective Diabetes Study (UKPDS) Group. Lancet. (1998) 352:837–53. doi: 10.1016/S0140-6736(98)07019-6
29. Peterson SB, Hart GW. New insights: A role for O-GlcNAcylation in diabetic complications. Crit Rev Biochem Mol Biol. (2016) 51:150–61. doi: 10.3109/10409238.2015.1135102
30. Yuan Y, Sun H, Sun Z. Advanced glycation end products (AGEs) increase renal lipid accumulation: a pathogenic factor of diabetic nephropathy (DN). Lipids Health Dis. (2017) 16:126. doi: 10.1186/s12944-017-0522-6
31. Rodrigues L, Matafome P, Crisóstomo J, Santos-Silva D, Sena C, Pereira P, et al. Advanced glycation end products and diabetic nephropathy: a comparative study using diabetic and normal rats with methylglyoxal-induced glycation. J Physiol Biochem. (2014) 70:173–84. doi: 10.1007/s13105-013-0291-2
32. Atzeni IM, van de Zande SC, Westra J, Zwerver J, Smit AJ, Mulder DJ. The AGE Reader: A non-invasive method to assess long-term tissue damage. Methods. (2022) 203:533–41. doi: 10.1016/j.ymeth.2021.02.016
33. Yozgatli K, Lefrandt JD, Noordzij MJ, Oomen PHN, Brouwer T, Jager J, et al. Accumulation of advanced glycation end products is associated with macrovascular events and glycaemic control with microvascular complications in Type 2 diabetes mellitus. Diabetes Med. (2018). doi: 10.1111/dme.2018.35.issue-9
34. Abbasi A, Juszczyk D, van Jaarsveld CHM, Gulliford MC. Body mass index and incident type 1 and type 2 diabetes in children and young adults: A retrospective cohort study. J Endocr Soc. (2017) 1:524–37. doi: 10.1210/js.2017-00044
35. Ejerblad E, Fored CM, Lindblad P, Fryzek J, McLaughlin JK, Nyrén O. Obesity and risk for chronic renal failure. J Am Soc Nephrol. (2006) 17:1695–702. doi: 10.1681/ASN.2005060638
36. Kajikawa M, Nakashima A, Fujimura N, Maruhashi T, Iwamoto Y, Iwamoto A, et al. Ratio of serum levels of AGEs to soluble form of RAGE is a predictor of endothelial function. Diabetes Care. (2015) 38:119–25. doi: 10.2337/dc14-1435
37. Uribarri J, Cai W, Woodward M, Tripp E, Goldberg L, Pyzik R, et al. Elevated serum advanced glycation endproducts in obese indicate risk for the metabolic syndrome: a link between healthy and unhealthy obesity? J Clin Endocrinol Metab. (2015) 100:1957–66. doi: 10.1210/jc.2014-3925
38. Monden M, Koyama H, Otsuka Y, Morioka T, Mori K, Shoji T, et al. Receptor for advanced glycation end products regulates adipocyte hypertrophy and insulin sensitivity in mice: involvement of Toll-like receptor 2. Diabetes. (2013) 62:478–89. doi: 10.2337/db11-1116
39. Sayej WN, Knight Iii PR, Guo WA, Mullan B, Ohtake PJ, Davidson BA, et al. Advanced glycation end products induce obesity and hepatosteatosis in CD-1 wild-type mice. BioMed Res Int 2016. (2016), 7867852. doi: 10.1155/2016/7867852
40. Uribarri J, Woodruff S, Goodman S, Cai W, Chen X, Pyzik R, et al. Advanced glycation end products in foods and a practical guide to their reduction in the diet. J Am Diet Assoc. (2010) 110:911–16.e12. doi: 10.1016/j.jada.2010.03.018
41. Glastras SJ, Chen H, Teh R, McGrath RT, Chen J, Pollock CA, et al. Mouse models of diabetes, obesity and related kidney disease. PloS One. (2016) 11:e0162131. doi: 10.1371/journal.pone.0162131
42. Jiang C, Yang R, Kuang M, Yu M, Zhong M, Zou Y. Triglyceride glucose-body mass index in identifying high-risk groups of pre-diabetes. Lipids Health Dis. (2021) 20:161. doi: 10.1186/s12944-021-01594-7
43. Riboulet-Chavey A, Pierron A, Durand I, Murdaca J, Giudicelli J, Van Obberghen E. Methylglyoxal impairs the insulin signaling pathways independently of the formation of intracellular reactive oxygen species. Diabetes. (2006) 55:1289–99. doi: 10.2337/db05-0857
44. Fiory F, Lombardi A, Miele C, Giudicelli J, Beguinot F, Van Obberghen E. Methylglyoxal impairs insulin signalling and insulin action on glucose-induced insulin secretion in the pancreatic beta cell line INS-1E. Diabetologia. (2011) 54:2941–52. doi: 10.1007/s00125-011-2280-8
Keywords: advanced glycation end products, BMI, diabetes, UACR, obesity, TyG-BMI
Citation: Xue L, Zhang Y and Zhang Q (2025) The relationship between advanced glycation end products, metabolic metrics, HbA1c, and diabetic nephropathy. Front. Endocrinol. 16:1468737. doi: 10.3389/fendo.2025.1468737
Received: 22 July 2024; Accepted: 21 January 2025;
Published: 07 March 2025.
Edited by:
Robert Kiss, McGill University, CanadaReviewed by:
Durai Sellegounder, Buck Institute for Research on Aging, United StatesKirti Parwani, Charotar University of Science and Technology, India
Copyright © 2025 Xue, Zhang and Zhang. This is an open-access article distributed under the terms of the Creative Commons Attribution License (CC BY). The use, distribution or reproduction in other forums is permitted, provided the original author(s) and the copyright owner(s) are credited and that the original publication in this journal is cited, in accordance with accepted academic practice. No use, distribution or reproduction is permitted which does not comply with these terms.
*Correspondence: Yi Zhang, enkxODM1NjA1NjUwNkAxNjMuY29t; Qiu Zhang, emhhbmdxaXVAYWhtdS5lZHUuY24=