 Ejigayehu G. Abate
 Amanda McKenna1
94% of researchers rate our articles as excellent or good
Learn more about the work of our research integrity team to safeguard the quality of each article we publish.
Find out more
ORIGINAL RESEARCH article
Front. Endocrinol., 20 February 2025
Sec. Bone Research
Volume 16 - 2025 | https://doi.org/10.3389/fendo.2025.1467825
This article is part of the Research TopicImaging-Based Methods for Fracture Risk AssessmentView all 9 articles
Introduction: Liver transplant (LT) recipients have a substantial risk of bone loss and fracture. An individual’s risk is highest before and within the first year after transplantation and returns to baseline in some patients but not all. We aim to identify risk factors for bone loss and fracture beyond the first year LT and to create a risk-scoring tool to aid clinicians in identifying those at high risk for bone loss and fracture.
Methods: We conducted a retrospective review of 264 liver transplant recipients between 2011 and 2014, who were followed in our transplant clinic for an additional five years. Clinical records were evaluated at the one-year post-LT visit and subsequently on an annual basis for up to five years.
Results: Over a median follow-up of 3.6 years post-liver transplantation, 40 out of 264 patients experienced disease progression, defined as worsening bone mineral density (BMD), initiation of osteoporosis treatment, or a new fracture. Factors associated with BMD progression included female sex, Caucasian race, new fractures, number of acute rejection events requiring treatment, and lower dual energy X-ray absorptiometry (DXA) scores after the first year post-LT. A risk model was developed using multivariable analysis, with a risk score based on BMD categories. The concordance index was 0.771, indicating good discrimination between those who progressed and those who did not. Risk categories were defined as low (0-4 points), medium (5 points), and high (6-9 points) based on model coefficients. The probability of progression-free survival at two years post-LT was 96.7% for low-risk, 83.1% for medium-risk, and 59.1% for high-risk groups.
Conclusion: We developed a simple, clinically applicable risk score that predicts bone disease progression beyond the first year after LT. This tool may help guide appropriate bone health follow-up, although prospective validation is necessary.
Liver transplantation has been an accepted treatment for end-stage liver disease for over 40 years. Advancements in pre-transplant liver disease management, operative techniques, and reduction in dose and duration of glucocorticoid therapy in most patients after LT have improved longevity. With this improvement in survival, there is a need to understand and manage the longer term consequences of LT to enhance quality of life. Over the past two decades, 40-60% of liver transplant recipients have experienced transplant-related bone disorders, a prevalence that has remained unchanged despite advances in transplant care (1–4).
Significant bone loss and fracture, occurring in 13-56% f cases, are predominantly observed in the period before liver transplantation (pre-LT) and within the first-year post-transplant post-LT, with prevalence rates of 13-56% and 14-60% respectively (3–5). The cause is multifactorial, including excess alcohol use, malnutrition, sarcopenia, cholestatic liver disease, hyperbilirubinemia, hyponatremia, vitamin D deficiency, and hypogonadism which tend to improve after transplantation. Additional variables affecting post-LT bone loss include exposure to high-dose glucocorticoid (GC) within the first few months of transplant for immunosuppression, and reduced mobility due to the impact of GC on muscle and bone, to mention a few (6–8). For this reason, Liver Society practice guidelines, American association for study of Liver diseases and American Society for transplantation, and the European clinical practice guidelines include bone densitometry in all patients undergoing LT evaluation (9, 10).
The long-term impact of liver transplantation on bone health remains inadequately understood. While some studies suggest that bone density may stabilize or improve after the first-year post-transplant in most individuals, this recovery is inconsistent (8–10). A subset of patients continues to experience persistent bone loss and an increased risk of fractures. Bone loss progression is commonly assessed through dual-energy X-ray absorptiometry (DXA), while fracture risk is evaluated using radiographic imaging and clinical diagnosis. However, the mechanisms driving these varied outcomes are unclear and require further investigation to enhance our understanding and management of bone health in LT patients beyond the first year post-LT.
Bone histomorphometry, a technique for assessing bone micro-architecture, demonstrates uncoupling of bone remodeling both before and shortly after liver transplantation, marked by decreased bone formation and increased bone resorption (11, 12). Additional studies suggest that bisphosphonates, which reduce bone resorption, can mitigate early post-transplant bone loss. However, while short-term benefits are evident, long-term data remain limited (13, 14). Although bone remodeling often normalizes within four months, some patients continue to face elevated fracture risk, and no clear guidelines exist for monitoring beyond the first year. Furthermore, current fracture assessment tools, including DXA, have limitations in this population (2–4). Our study aims to identify clinical characteristics and BMD values at one-year post-LT that predict progression of bone disease in five years. Based on our findings, we developed a scoring system to identify patients requiring closer monitoring through clinical screening and bone density assessments.
The study was approved by the institution review board. The cohort included all adult LT recipients from January 2011 through June 2014 who had bone mineral density performed at 1 year post transplant visit. Exclusion criteria were a prior transplant, multiorgan transplant, lack of BMD test results within 1-year post-LT, death within 1 year post transplant, or receiving medication for osteoporosis (Figure 1).
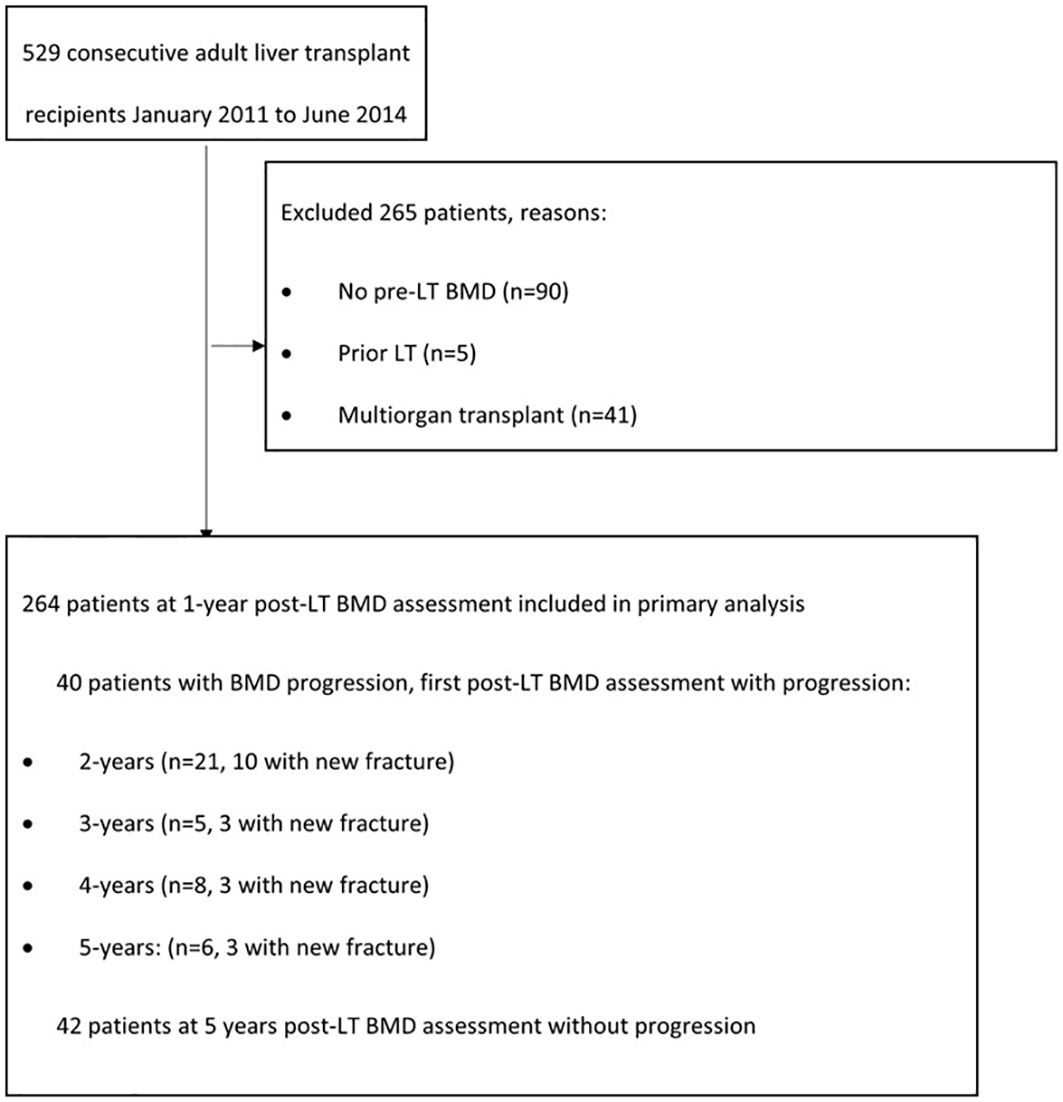
Figure 1. Patient flow diagram.
Data on biochemistry, the model of end stage liver disease (MELD), bone mineral density (BMD) as measured by DXA result, demography, and clinical endpoints were extracted from participants’ medical records. BMD measured by dual energy x-ray absorptiometry (DXA-GE) are routinely performed at lumbar spine, total hip and femoral neck. Our primary outcome was progression of skeletal fragility after the first-year post LT, defined as transitioning to the subsequent worse BMD diagnosis (osteopenia or osteoporosis), receiving treatment for osteoporosis, or having a new fracture.
All patients had DXA scans performed at our facility, and serial comparisons were available. All patients had BMD of the lumbar spine, total hip, and femoral neck measured by DXA using a GE Lunar iDXA (General ElectricCross-calibration of the multiple scanners is routinely performed with a phantom; to provide accurate longitudinal assessment of BMD. BMD results were classified using the World Health Organization diagnostic criteria, defined as osteoporosis if T score is -2.5 or lower, osteopenia if T score is between -1 to -2.4, and normal if T score -1 or higher. Review of electronic medical record documentation including clinical notes and imaging was performed for subjects at one year post LT. Fractures were considered fragility related if occurred from a fall of standing height or from low energy injury reported confirmed in the clinical history. If the cause of the fracture was uncertain, the patient was reported not to have a fracture. We obtained the number of any rejections occurring within the first year of post-LT by review of transplant follow-up notes. Most patients did not have rejection. Bone loss progression was defined as having one or more of the following: Transitioned from normal BMD at 1-year post-LT to osteopenia or osteoporosis, transitioned from osteopenia at 1-year post-LT to osteoporosis, received treatment for osteoporosis after 1-year post-LT, or had a new fracture after 1-year post-LT. BMD classification was based on the lowest BMD T score available for the corresponding clinical visit (Table 1).
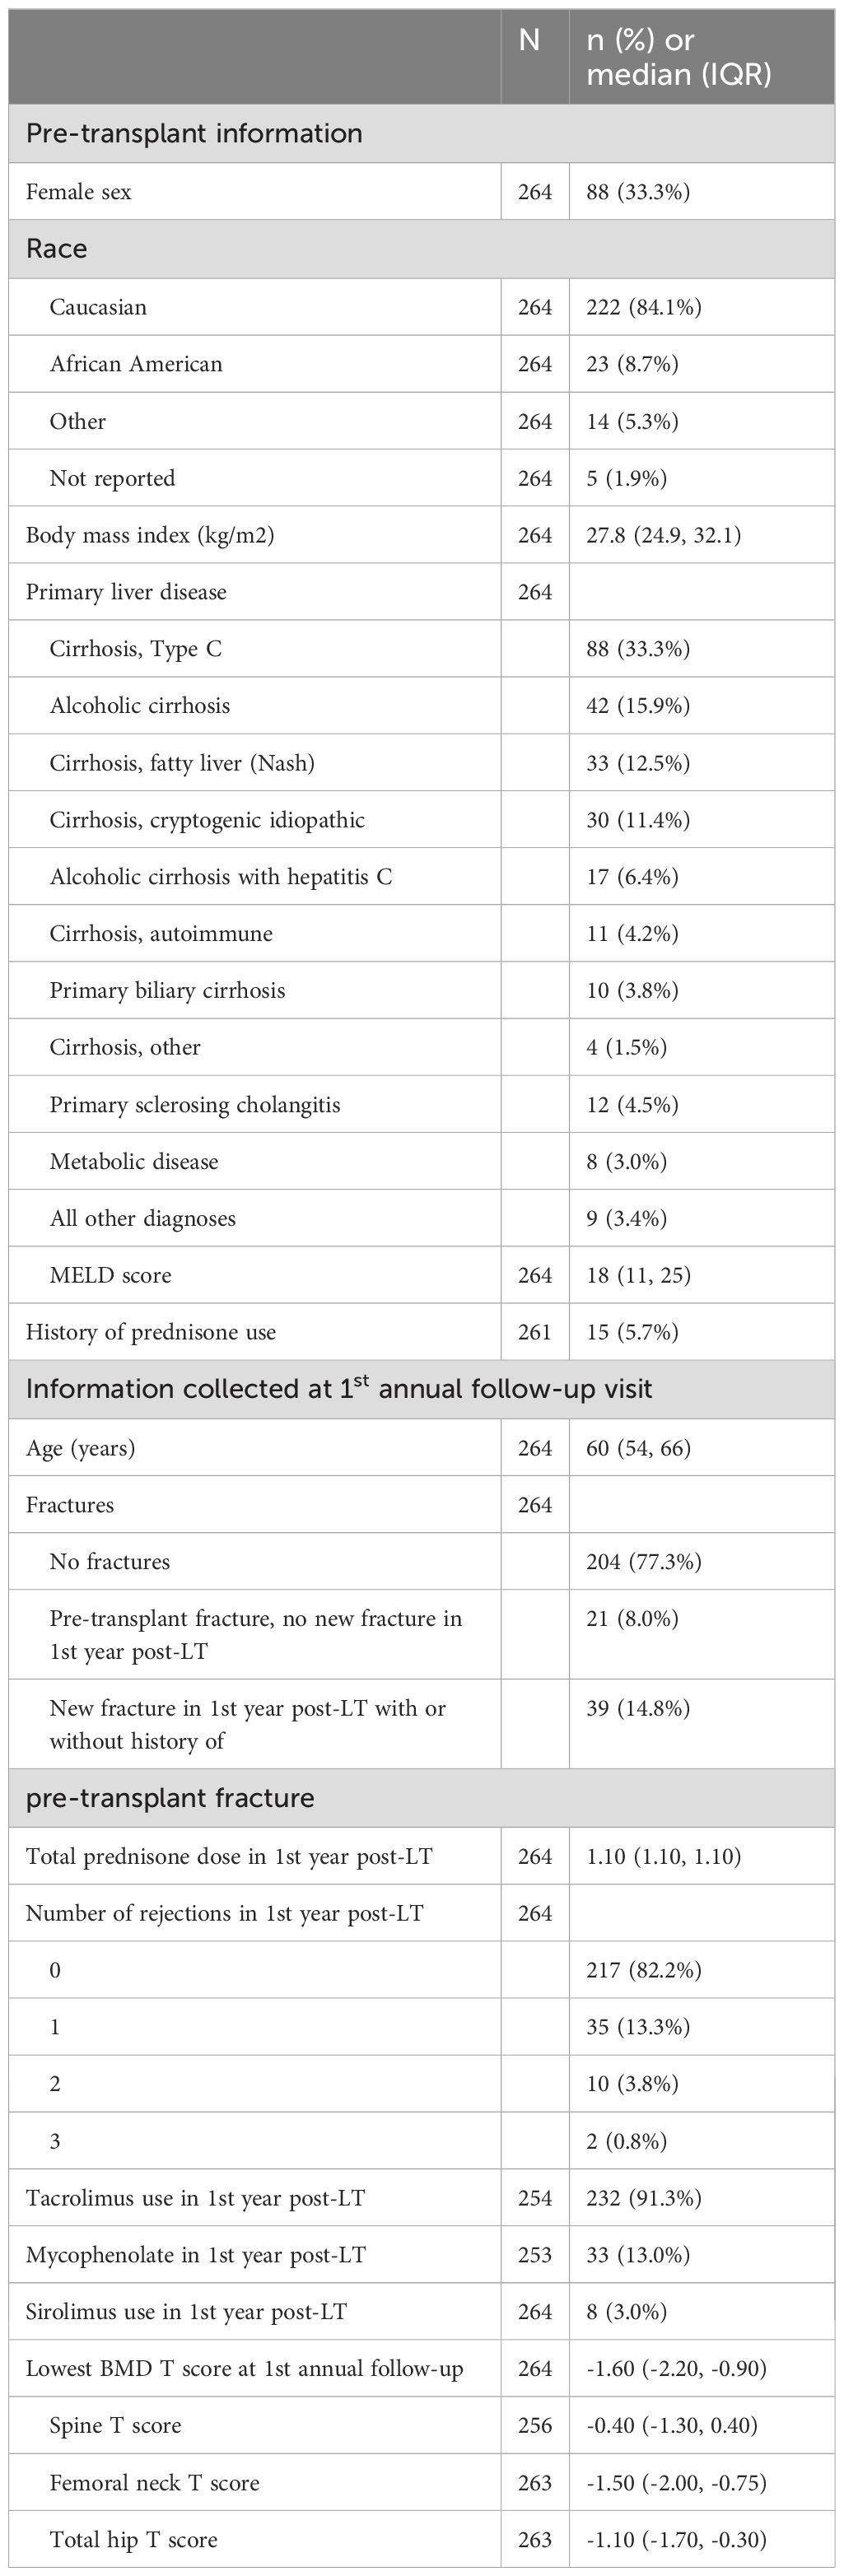
Table 1. Patient characteristics.
The immunosuppressive regimen protocol following LT is mycophenolate mofetil (CellCept) (for 2 months), prednisone (taper completed by 4 months), and tacrolimus indefinitely. If the patient has high-risk hepatocellular carcinoma, mycophenolate mofetil will be stopped as early as day 21 post LT, and the patient will remain only on tacrolimus. If the patient has renal insufficiency, mycophenolate is continued as maintenance therapy along with tacrolimus to reduce tacrolimus levels to avoid further decline in kidney function. Patients with moderate to severe acute cellular rejection receives intravenous (IV) methylprednisolone 1 gram every other day for a total of 3 doses. Patients then undergo repeat liver biopsy, and if the biopsy indicates persistent moderate rejection, treatment with another cycle of IV methylprednisolone is given. Patients receive thymoglobulin if organ rejection persists. Patients receive a higher dose of tacrolimus maintenance therapy for mild acute cellular rejection. The protocol of immunosuppression did not change during the study period.
Associations of patient characteristics with bone loss progression after the 1-year post LT visit were evaluated using Cox proportional hazards regression models, where hazard ratios (HRs) and 95% confidence intervals (CIs) were estimated. Patients without bone loss progression were censored at the last available BMD assessment prior to any graft failure. To create a scoring algorithm that classifies patients based on their risk of bone loss progression after their first annual post-LT BMD assessment, a multivariable Cox proportional hazards regression model was developed using a backward selection approach, with a focus on reduction in the Akaike Information Criterion (AIC). The multivariable Cox proportional hazards regression model was developed by including variables with p ≤ 0.20 from the univariable analysis. Variables were removed one at a time, based on the largest p-value, until no further reduction in the Akaike Information Criterion (AIC) was observed (Table 2). The BMD measurement at 1 year post-LT was selected over pre-LT BMD to identify predictors associated with the 1-year post-LT DXA assessment, independent of pre-transplant values, and the closer proximity of the BMD at 1 year Post-LT visit.
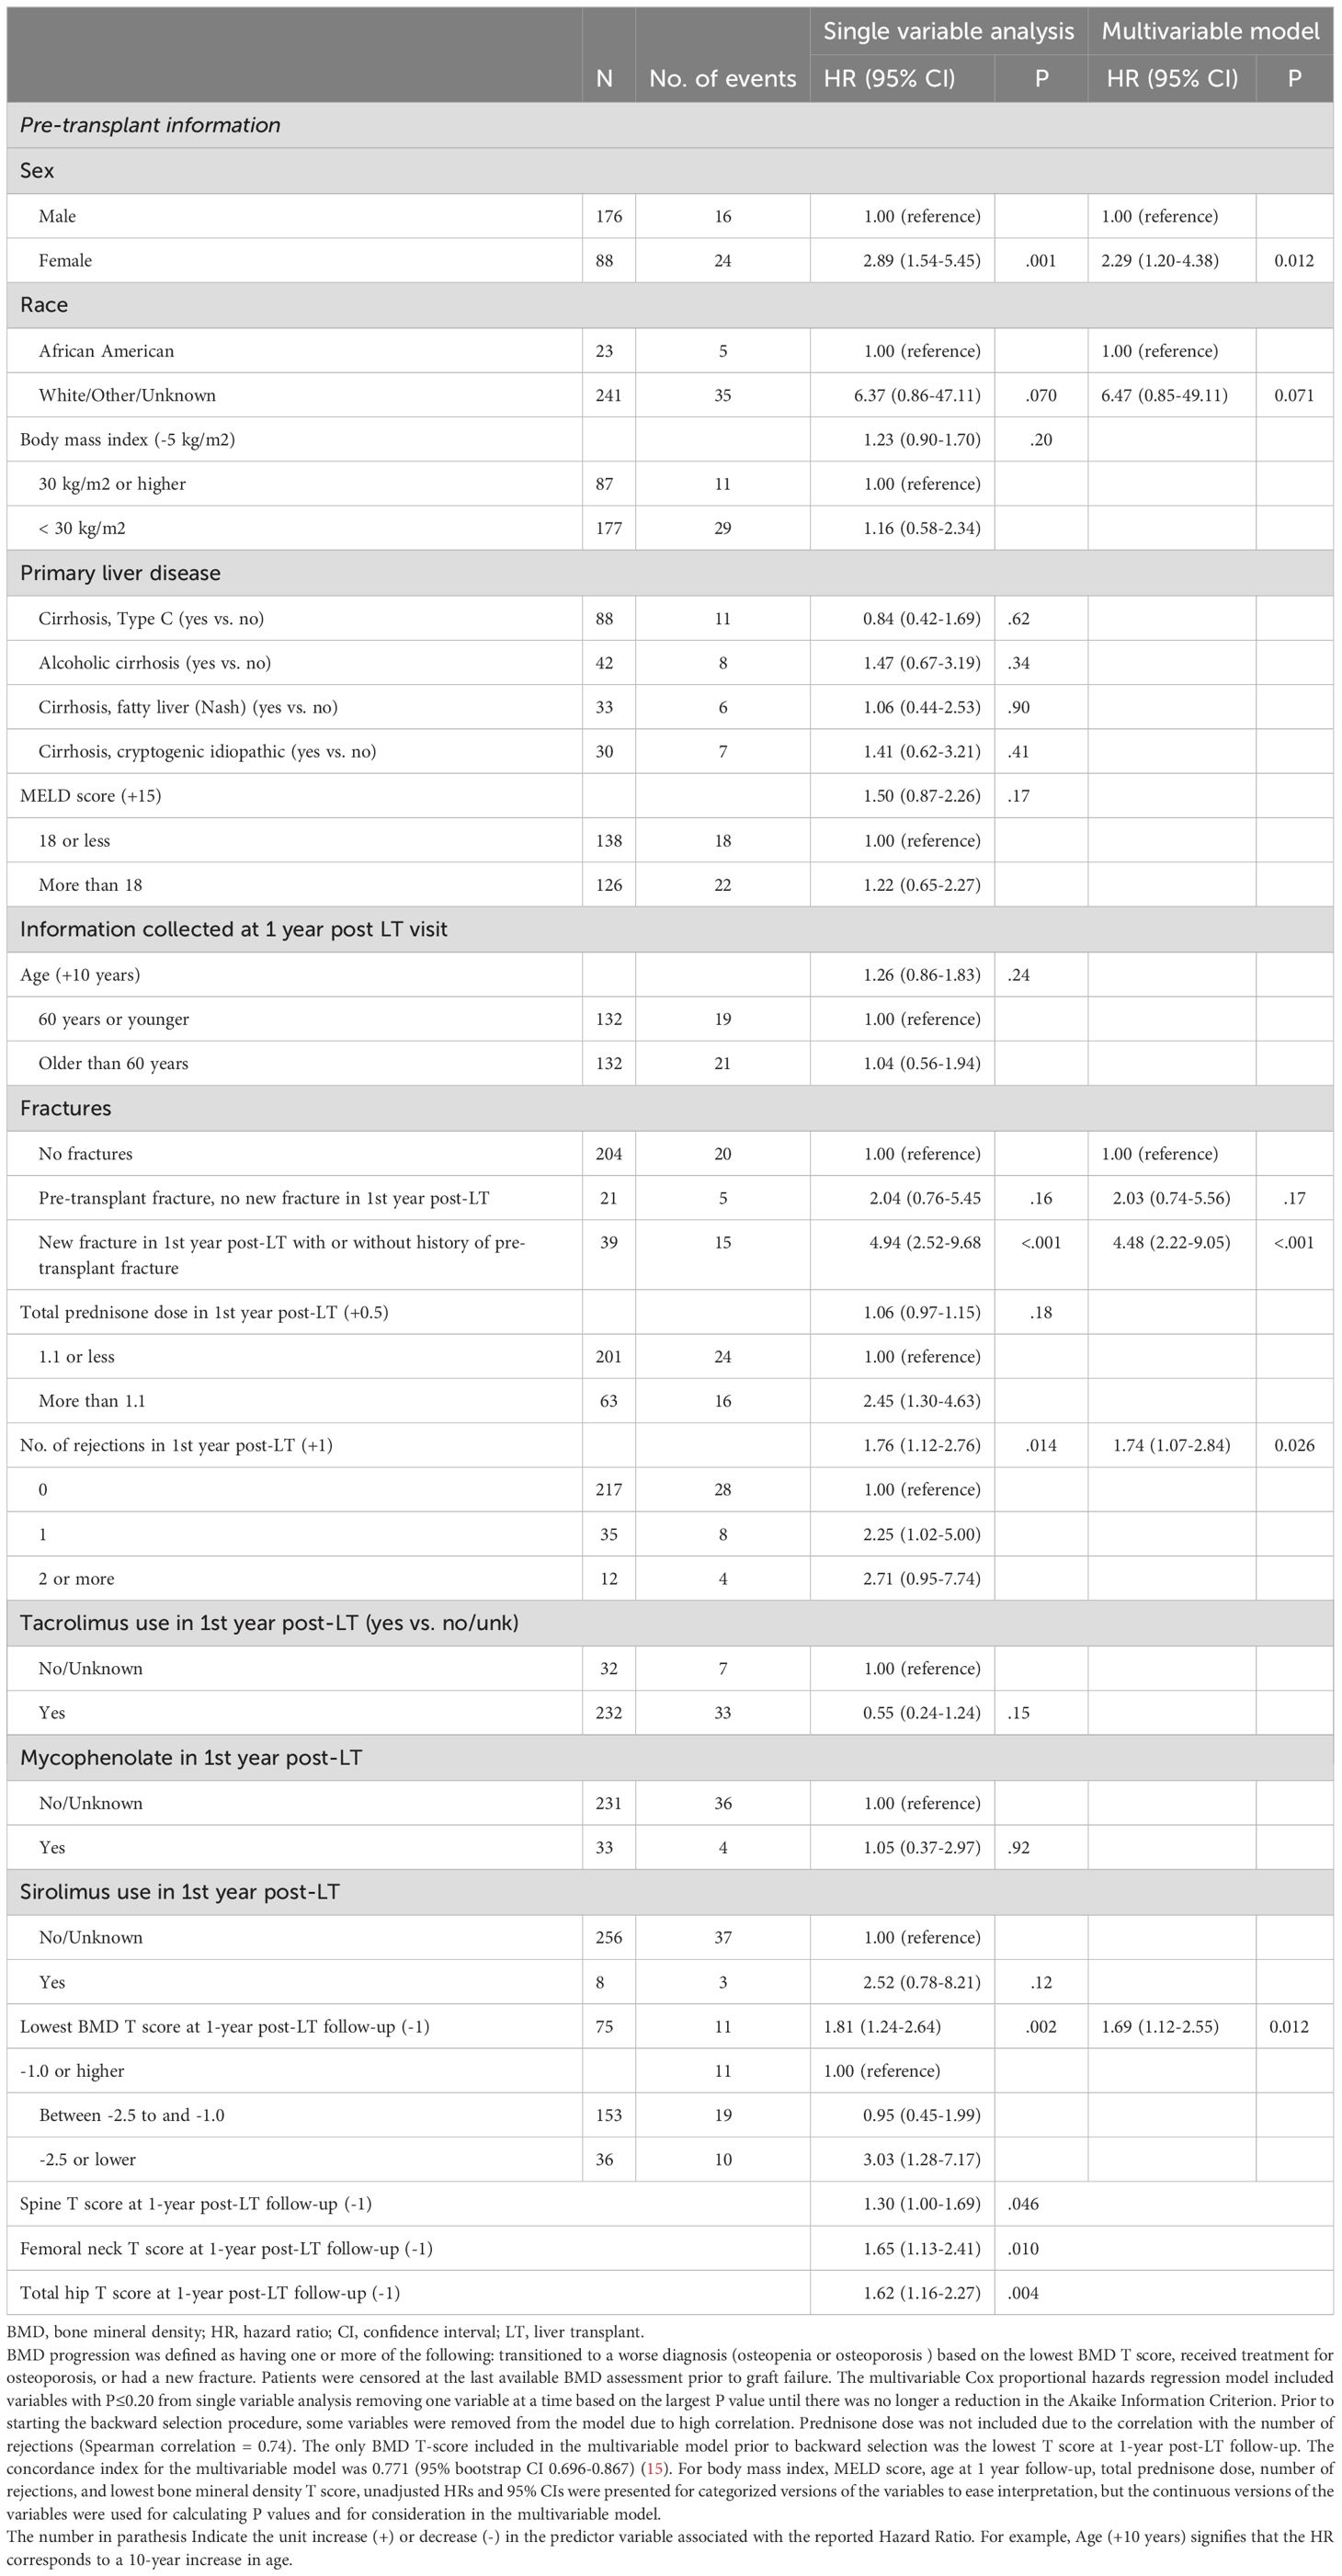
Table 2. Associations with BMD progression after 1 year post-liver transplant visit.
The risk score model was constructed using factors known at one-year post-LT, with points assigned based on variables with p ≤ 0.20. The scoring system included the following: sex (+1 point if female), race (+2 points if not African American), fracture history (+2 points for new fractures post-transplant or +1 point for pre-transplant fractures), number of rejections (+2 points for ≥2 rejections or +1 point for 1 rejection), and lowest BMD T-score (+2 points if T ≤ -2.5 or +1 point if T > -2.4 and < -1.0) (Table 3). The point values for the risk score were determined by rounding each model coefficient to the nearest integer (e.g., female sex had a coefficient of 0.828, rounded to 1; non-African American race had a coefficient of 1.870, rounded to 2). This simplification was done to create an easy-to-use risk scoring system (Supplementary Table 1).
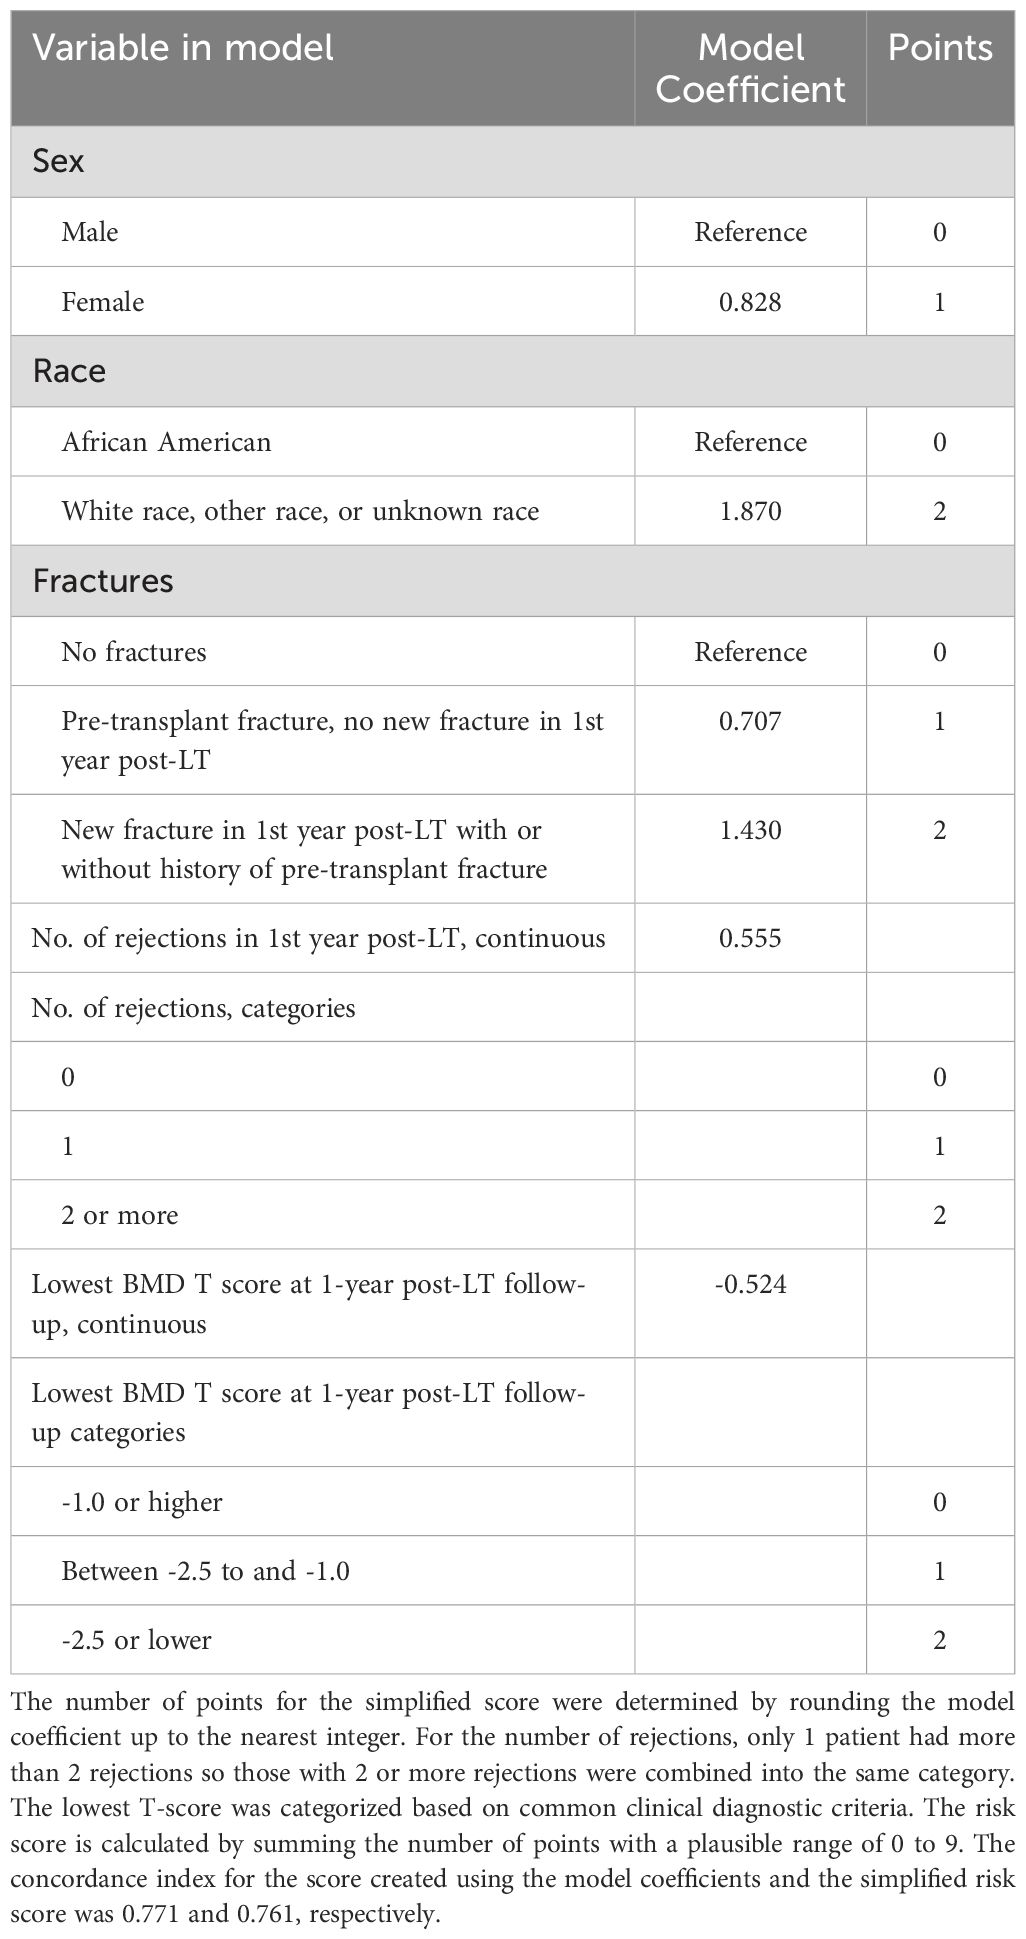
Table 3. Risk score development for predicting BMD progression after 1 year post liver transplant visit.
The risk score was calculated by summing the points for the included variables, resulting in a plausible score range of 0-9. To evaluate the discriminatory ability of the risk score in predicting bone loss progression, we estimated the concordance index and corresponding 95% confidence intervals (CIs) using bootstrap methods (Table 2). Concordance index is a measure of the model’s ability to discriminate between those who progressed and those who didn’t with consideration of the time-to-event and censoring. The concordance index was 0.76 in our cohort. The risk score was categorized into three groups: low (0-4 points), medium (5 points), and high (6-9 points) risk of skeletal fragility progression.
We assessed the performance of the risk score by plotting Kaplan-Meier estimates of progression-free survival according to risk score categories. Median follow-up time was calculated using the reverse Kaplan-Meier method, with patients who experienced progression censored at the time of progression (Figure 2, Table 4). All analyses were conducted using R version 4.0.3 (R Foundation for Statistical Computing, Vienna, Austria).
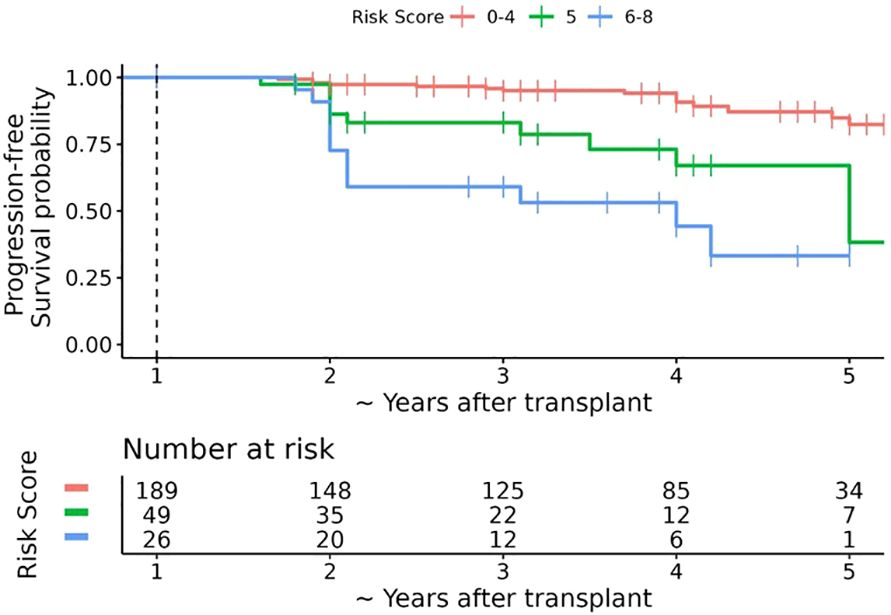
Figure 2. Kaplan-Meier estimates of progression-free survival after 1 year post-transplant bone mineral density (BMD) assessment according to simplified risk score. The dashed vertical line represents the date of the first annual BMD assessment (baseline timepoint). The horizontal axis represents the number of years after the first annual BMD assessment plus 1 year; for ease of interpretation the horizontal axis is labelled as the approximate number of years after transplant. Over a median follow-up of ~ 3.6 years post-transplant (interquartile range ~3 to ~ 5 years post-transplant), 40 patients experienced bone loss progression, 20 of which occurred within 18 months after 1 year post-LT BMD assessment. The overall probability of progression-free survival at ~2.5, ~3.5, and ~4.5 years post-transplant was 90.3% (95% CI 86.3% to 94.4%), 87.1% (95% CI 82.4% to 92.0%), and 78.1% (95% CI 60.0% to 79.6%), respectively.
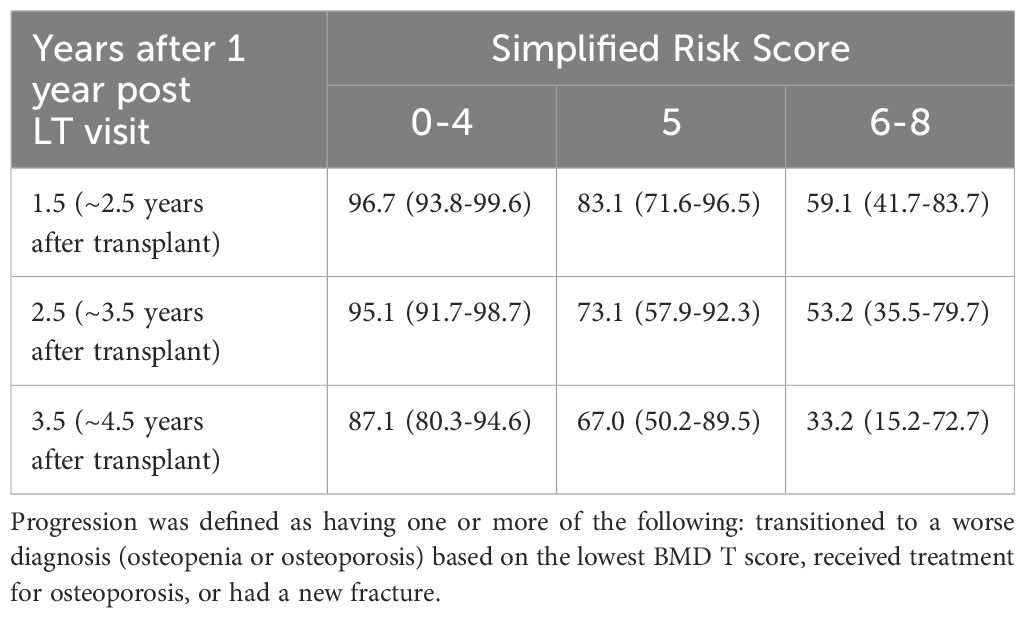
Table 4. Kaplan-meier estimates of the probability (%) of progression-free survival after the 1 year post liver transplant visit.
Our cohort included 264 patients who underwent LT at our institution, with bone mineral density testing available at their 1-year post LT visit met the criteria for analysis. Table 1 describes the characteristics of the cohort including bone mineral density results extracted from their medical records. At one year post LT, the median age was 60 years (IQR 54 to 66 years), 88 (33.3%) were female, 47 (17.8%) had one or more rejections within the first year after LT. The cohort consisted of diverse liver disease as the cause for transplant. 39 (14.8%) had a fracture in the first year after LT, and median lowest BMD T score from the spine, femoral neck, or total hip was -1.60 (IQR -2.20 to -0.90). Fractures were predominantly in the spine (thoracic and vertebral spine).
After 1 year LT visit, 40/264 patients experienced bone loss progression over a median follow-up period of 3.6 years post-LT bone density (IQR 1.0 to 3.6 years), with 21 patients progressing by year 2 post LT visit (Figure 1). There were 42 patients who completed 5-year post LT follow-up visits without progression. The remaining 182 patients either had graft failure requiring a second liver transplant (N=24) or were lost to follow-up prior to the 5-year post LT visit. Among those who progressed, the majority were within 2 years of LT (n=21) and 10/21 had new fractures which was not evident in the pre or immediate post-transplant period (Figure 1). Eight out of the 10 patients had multiple fractures predominantly in the spine. Clinical characteristics of those who progress include female sex which were 2.89 times more likely to progress than male counterparts, Caucasians or those who identified as others were 6 times more likely to progress than African Americans, those with new fracture at 1 year post LT regardless of history of pre transplant fracture were 5 times more likely to progress than those who did not have reported fracture, patients with one or more episodes of organ rejection were over 2 times likely to progress than those who did not have rejection and low hip DXA scan were also likely to progress. Based on this significant data, we identified female sex, Caucasian race, history of fracture before transplant and within 12 months post LT, organ rejection of 2 or more episodes, and low BMD in osteoporosis range as a significant variable to play a role in progression of bone loss.
Due to the limited number of patients who developed bone loss progression and the strong correlations between some of the factors, the use of multivariable analysis to predict bone loss progression was challenging. We considered any variable with a P ≤ 0.20 from single variable analysis in our model, excluding prednisone dose due to its correlation with the number of rejections. The lowest BMD T score at 1-year post-LT was the only BMD measurement considered in the model. The remaining factors under consideration were included in a multivariable Cox proportional hazards regressions model. Using a backward elimination approach, one variable at a time was removed from the model based on the highest P value until there was no longer a reduction in the AIC. The final multivariable model included 5 factors, sex, race, fracture history, number of rejections within one-year post-LT, and the lowest BMD T score at 1-year post-LT (concordance index = 0.771, 95% CI 0.696-0.867).
To create the risk score, each model coefficient was rounded up to the nearest integer and these individual scores were summed to create a score that ranges from 0 to 9 (Table 3). After reviewing the observed proportion of patients who developed bone loss progression by the 2-year post LT visit according to the risk score (Supplementary Table 1), we combined the risk scores into 3 risk categories: low risk 0-4, medium risk 5, and high risk 6-9. The probability of progression-free survival by the 2-year post LT visit was 96.7% (93.8% to 99.6%), 83.1% (71.6% to 96.5%), and 59.1% (41.7% to 83.7%) for the low, medium, and high-risk categories, respectively (Table 4, Figure 2).
Our findings shows that certain characteristics identified as risk factors for osteoporosis and fractures in the non-transplant population are also significant for bone health changes in post LT patients. Specifically, female gender, Caucasian race/ethnicity, and a history of previous fractures were identified as important risk factors (14, 16). Refinement in risk assessment for this population comes from our identification of liver transplant (LT)-related factors associated with skeletal health deterioration. Specifically, a higher number of rejection episodes and low bone density in the hip were significant factors.
Our study agrees with previous work that most fractures occur early, before transplant or within the first 1-2 years of transplant (13, 14). In contrast to prior studies, we did not observe any association between the type of liver disease (alcohol, Non-alcoholic liver disease, hepatitis c) and progression of bone disease (14, 17). However, we did not look at those with cholestatic liver disease separately due to our small number of patients in the cohort.
In contrast to prior studies, our study highlights the importance of recognizing the risk factors for bone loss and fracture after the first year of transplant unique to liver transplant recipients. More specifically, similar to the non-transplant population, females at any time were more likely to progress than their male counterparts. Women have lower bone mass at any point compared to men, so it was not surprising to discover that the most significant effect of liver disease on the bone was higher in women than men. Prior studies have questioned the validity of BMD in predicting bone disease in those receiving liver transplants (2). In this study, we found that BMD is essential in the risk stratification of patients at high risk for progression in conjunction with other clinical factors identified in this study. BMD at 1-year post LT was also helpful in predicting those who are likely to progress. We noted that patients with BMD at any site (spine, femoral neck, or total hip) in the osteoporosis range at 1-year post LT were three times more likely to progress compared to those with normal BMD (T score >-1) at any site. In addition, a one standard deviation (SD) decrease in the total hip BMD at 1-year post LT was strongly associated with BMD progress after the first annual post-LT follow-up. A change in BMD by one standard deviation change in the femoral neck and spine was also trending towards a positive prediction of progression, although not significant (Table 2).
Furthermore, ethnic variation in peak bone mass is likely to explain the race differences noted in our study rather than the mere impact of transplant alone. African Americans generally have been shown to have a higher bone mineral density at baseline than white Americans, and fracture rate also appears to be lower in AA at any skeletal sites compared to whites in nontransplant patients (16). We are not aware of any known differences in the mechanism of bone loss between AA and Caucasians other than the fact that AA may have higher bone mass at baseline than Caucasians but whether the rate of loss is different between the two groups is unknown. Unique to our transplant cohort, we noticed that although Caucasians had a higher risk for progression than African Americans, a higher proportion in the AA group 5/23 (22%) progressed versus 35/241(14%) Caucasians. The number of African American LT population was low but carried a concerning trend of disease progression raising the possibility that perhaps the rate of bone loss can be higher in AA population and may need close follow-up. Future studies may help understand potential race differences in how organ failure and transplantation affect different ethnic groups.
Glucocorticoid use, mycophenolate, and Tacrolimus use were not associated with progression risk, in keeping with the concept that bone disease in transplant patients is a unique entity caused by multifactorial pathways rather than explained by immunosuppression alone. High glucocorticoid (GC) use is typically limited to the first 4-6 months post-LT and discontinued in most individuals. GC is known to affect the bone by uncoupling bone resorption and bone formation, resulting in increased bone resorption by inhibiting gonadal steroids, increased urinary calcium excretion by inhibiting intestinal and renal calcium reabsorption, and secondary hyperparathyroidism and reduced bone formation by inhibiting type I collagen, osteocalcin, insulin-like growth factors, and bone matrix proteins, receptor activator for nuclear factor kappa B ligand (RANK-L (18, 19). The effect of GC on the bone goes well beyond the withdrawal of GC, and the GC effect on the bone is apparent even in lower doses (19, 20).
Our study shows that frequent organ rejection (>2) episodes rather than GC use may be an important clinical tool that can differentiate those with long-term effects on the bone from those with low rejection episodes. Our study noted that a higher number of rejections (>2 episodes) was associated with a significantly high risk of bone progression. Those with a higher rejection frequency in the first year of transplant may have received a higher dose of steroid than those with less frequent rejection events and are overall sicker. In addition, the finding may be in part explained by the GC effect on various organs, and GC-sparing therapies such as calcineurin inhibitor (Tacrolimus) may have a favorable effect on bone health GC asserts a direct effect on reducing osteoblast replication, differentiation, and lifespan resulting in a decline in bone formation. 33/232 (14%) of patients using Tacrolimus in first-year post-LT progressed, whereas only 4/33 (12%) patients using mycophenolate progressed. Though the findings were insignificant, the trend was that those on Tacrolimus had half the probability of progressing HR 0.55 (0.24-1.24) compared to those not on Tacrolimus. Prior studies have shown that early glucocorticoid withdrawal improves bone mass recovery (21–24). Calcineurin inhibitors (cyclosporine A (CsA) and Tacrolimus) are GC-sparing immunosuppressants that have been instrumental in reducing GC use. The effects of cyclosporine A (CsA) on bone health are unclear, though it generally appears to increase bone resorption and lead to bone loss. In contrast, tacrolimus is associated with less bone loss, likely due to reduced glucocorticoid (GC) use rather than direct effects on bone cells (13, 22). Glucocorticoids, mycophenolate, tacrolimus, and liver disease type were not significantly linked to increased bone disease progression, suggesting that bone disease in transplant patients has unique, multifactorial causes. Pre-transplant fracture notably was associated with BMD progression, with 38% (15 of 39) of patients with pre-transplant fractures experiencing progression—five times higher than those without fractures. Even without new post-transplant fractures, these patients had twice the risk of BMD progression, observed in 5 of 21 patients, emphasizing pre-transplant fractures as a key factor in post-transplant bone disease.
Long-term follow-up of LT patients beyond the first year should include fracture risk assessment through a comprehensive clinical history of known fracture risk factors. Particular attention should be given to patients who have received high doses of glucocorticoids for frequent rejections in the early post-transplant years. Clinicians should make every effort to obtain adequate clinical history and, when in doubt, obtain spine imaging to evaluate for asymptomatic fracture.
Prior studies have shown that the risk of asymptomatic vertebral fracture in pre-LT recipients was as high as 56% (2, 25). The study underscores the importance of pre- or within one year of LT fracture assessment by spine imaging to evaluate for radiographic evidence of fracture or clinical history suggestive of fractures such as height loss and kyphosis.
Currently, there are no standardized guidelines for the optimal interval between bone mineral density (BMD) testing or for the management of patients with liver transplant (LT)-related bone disease. Based on our findings, we propose that patients with a clinical risk score greater than five should be considered for additional spine imaging, such as plain radiographs of thoracic and lumbar spine, to evaluate for asymptomatic fractures, or should be considered for early treatment intervention. Prospective studies are needed to further validate the efficacy of this risk tool in guiding patient selection for treatment.
This study has several limitations, largely due to its retrospective design. First, we did not account for comorbidities or medications that may impact bone density, such as thiazide diuretics for hypertension or conditions such as type 2 diabetes. Additionally, because the study relied on retrospective chart reviews, not all relevant medical information was consistently recorded, particularly for patients managed by external institution (21, 22, 26).
Not unexpectedly, the presence of fracture at any time (pre-LT and within 1-year post-LT) is one of the strongest predictors of 5-year disease progression compared to those that did not fracture. The presence of a new fracture in the first-year post-LT visit, regardless of prior fracture, was highly correlated with disease progression (p <0.001).
Moreover, patients who received treatment for osteoporosis after the first year post-LT were classified as having “bone loss progression,” based on the assumption that treatment initiation reflects a clinical decision prompted by observed bone loss or increased risk. While it is possible that some patients may have started treatment as a preventive measure, we lacked sufficient data to differentiate between those treated for active bone loss and those treated prophylactically. Further studies should aim to clarify this distinction.
We developed a risk-scoring tool to enable clinicians to identify individuals with the highest risk of deterioration in bone health, defined as time to decline to the subsequent worse diagnosis (osteopenia and osteoporosis) based on the lowest BMD T score, received treatment for osteoporosis or had a new fracture. The BMD progression risk score is an easy-to-calculate scoring system based on information collected at the one-year follow-up assessment after a liver transplant. This tool though an encouraging start, will require prospective validation.
The raw data supporting the conclusions of this article will be made available by the authors, without undue reservation.
The studies involving humans were approved by Mayo clinic Florida institution review board. The studies were conducted in accordance with the local legislation and institutional requirements. Written informed consent for participation was not required from the participants or the participants’ legal guardians/next of kin in accordance with the national legislation and institutional requirements.
EA: Conceptualization, Data curation, Formal analysis, Funding acquisition, Investigation, Methodology, Project administration, Resources, Software, Supervision, Validation, Visualization, Writing – original draft, Writing – review & editing. AM: Conceptualization, Data curation, Formal analysis, Investigation, Methodology, Project administration, Resources, Software, Validation, Visualization, Writing – original draft, Writing – review & editing. LY: Conceptualization, Data curation, Formal analysis, Funding acquisition, Investigation, Methodology, Resources, Supervision, Validation, Visualization, Writing – original draft, Writing – review & editing. CB: Conceptualization, Data curation, Formal analysis, Funding acquisition, Investigation, Methodology, Resources, Software, Validation, Writing – original draft, Writing – review & editing. AK: Conceptualization, Data curation, Formal analysis, Funding acquisition, Investigation, Methodology, Project administration, Resources, Software, Supervision, Validation, Visualization, Writing – original draft, Writing – review & editing.
The author(s) declare financial support was received for the research, authorship, and/or publication of this article. Statistical support provided by Mayo Clinic.
The authors declare that the research was conducted in the absence of any commercial or financial relationships that could be construed as a potential conflict of interest.
All claims expressed in this article are solely those of the authors and do not necessarily represent those of their affiliated organizations, or those of the publisher, the editors and the reviewers. Any product that may be evaluated in this article, or claim that may be made by its manufacturer, is not guaranteed or endorsed by the publisher.
The Supplementary Material for this article can be found online at: https://www.frontiersin.org/articles/10.3389/fendo.2025.1467825/full#supplementary-material
LT, Liver transplant; BMD, Bone mineral density; DXA, dual-energy X-ray absorptiometry; MELD, Model for End-Stage Liver Disease.
1. Cohen A, Sambrook P, Shane E. Management of bone loss after organ transplantation. J Bone Miner Res. (2004) 19:1919–32. doi: 10.1359/jbmr.040912
2. Krol CG, Dekkers OM, Kroon HM, Rabelink TJ, van Hoek B, Hamdy NA. No association between BMD and prevalent vertebral fractures in liver transplant recipients at time of screening before transplantation. J Clin Endocrinol Metab. (2014) 99:3677–85. doi: 10.1210/jc.2014-1469
3. Krol CG, Dekkers OM, Kroon HM, Rabelink TJ, van Hoek B, Hamdy NA. Longitudinal changes in BMD and fracture risk in orthotopic liver transplant recipients not using bone- modifying treatment. J Bone Miner Res. (2014) 29:1763–9. doi: 10.1002/jbmr.2214
4. Abate EG, Vega MV, Rivas AM, Meek S, Yang L, Ball CT, et al. Evaluation of factors associated with fracture and loss of bone mineral density within 1 year after liver transplantation. Endocr Pract. (2021) 27:426–32. doi: 10.1016/j.eprac.2020.10.008
5. Butin S, Griffoul I, Espitalier F, Salame E, Mulleman D, Goupille P. High incidence of vertebral osteoporotic fracture within the first year after liver transplantation. Clin Exp Rheumatol. (2017) 35(6):913–8.
6. Chiu YC, Liao PS, Chou YT, Lin CL, Hung CH, Lin CC, et al. The incidence and risk factors of hip fracture after liver transplantation (LT): A nationwide population-based study. BioMed Res Int. (2019) 2019:5845709. doi: 10.1155/2019/5845709
7. Danford CJ, Trivedi HD, Bonder A. Bone health in patients with liver diseases. J Clin Densitom. (2020) 23:212–22. doi: 10.1016/j.jocd.2019.01.004
8. Bergmann PJ. Change in bone density and reduction in fracture risk: A meta- regression of published trials. J Bone Miner Res. (2019) 34:1976. doi: 10.1002/jbmr.3835
9. Martin P, DiMartini A, Feng S, Brown R Jr., Fallon M. Evaluation for liver transplantation in adults: 2013 practice guideline by the American Association for the Study of Liver Diseases and the American Society of Transplantation. Hepatology. (2014) 59:1144–65. doi: 10.1002/hep.26972
10. Guichelaar MM, Malinchoc M, Sibonga J, Clarke BL, Hay JE. Bone metabolism in advanced cholestatic liver disease: analysis by bone histomorphometry. Hepatology. (2002) 36:895–903. doi: 10.1053/jhep.2002.36357
11. Guichelaar MM, Malinchoc M, Sibonga JD, Clarke BL, Hay JE. Bone histomorphometric changes after liver transplantation for chronic cholestatic liver disease. J Bone Miner Res. (2003) 18:2190–9. doi: 10.1359/jbmr.2003.18.12.2190
12. Vedi S, Ninkovic M, Garrahan NJ, Alexander GJ, Compston JE. Effects of a single infusion of pamidronate prior to liver transplantation: a bone histomorphometric study. Transpl Int. (2002) 15:290–5. doi: 10.1111/j.1432-2277.2002.tb00167.x
13. Bodingbauer M, Wekerle T, Pakrah B, Roschger P, Peck-Radosavljevic M, Silberhumer G, et al. Prophylactic bisphosphonate treatment prevents bone fractures after liver transplantation. Am J Transplant. (2007) 7:1763–9. doi: 10.1111/j.1600-6143.2007.01844.x
14. Vedi S, Greer S, Skingle SJ, Garrahan NJ, Ninkovic M, Alexander GA, et al. Mechanism of bone loss after liver transplantation: A histomorphometric analysis. J Bone Miner Res. (1999) 14:281–7. doi: 10.1359/jbmr.1999.14.2.281
15. Harrell FE, Lee KL, Mark DB. Tutorial in Biostatistics: Multivariable prognostic models: issues in developing models, evaluating assumptions and adequacy, and measuring and reducing errors. Stat Med. (1996) 15:361–87. doi: 10.1002/(SICI)1097-
16. Looker AC, Melton LJ 3rd, Borrud LG, Shepherd JA. Lumbar spine bone mineral density in US adults: demographic patterns and relationship with femur neck skeletal status. Osteoporos Int. (2012) 23:1351–60. doi: 10.1007/s00198-011-1693-z
17. Bouxsein ML, Eastell R, Lui LY, Wu LA, de Papp AE, Grauer A, et al. Change in bone density and reduction in fracture risk: A meta-regression of published trials. J Bone Miner Res. (2019) 34:632–42. doi: 10.1002/jbmr.3641
18. Stein E, Ebeling P, Shane E. Post-transplantation osteoporosis. Endocrinol Metab Clin North Am. (2007) 36:937–63. doi: 10.1016/j.ecl.2007.07.008
19. Buckley L, Guyatt G, Fink HA, Cannon M, Grossman J, Hansen KE, et al. 2017 American college of rheumatology guideline for the prevention and treatment of glucocorticoid- induced osteoporosis. Arthritis Rheumatol. (2017) 69:1521–37. doi: 10.1002/art.40137
20. van Staa TP. The pathogenesis, epidemiology and management of glucocorticoid- induced osteoporosis. Calcif Tissue Int. (2006) 79:129–37. doi: 10.1007/s00223-006-0019-1
21. Feller RB, McDonald JA, Sherbon KJ, McCaughan GW. Evidence of continuing bone recovery at a mean of 7 years after liver transplantation. Liver Transpl Surg. (1999) 5:407–13. doi: 10.1002/(ISSN)1527-6473a
22. Goffin E, Devogelaer JP, Lalaoui A, Depresseux G, De Naeyer P, Squifflet JP, et al. Tacrolimus and low-dose steroid immunosuppression preserves bone mass after renal transplantation. Transpl Int. (2002) 15:73–80. doi: 10.1111/j.1432-2277.2002.tb00133.x
23. Guichelaar MM, Kendall R, Malinchoc M, Hay JE. Bone mineral density before and after OLT: long-term follow-up and predictive factors. Liver Transpl. (2006) 12:1390–402. doi: 10.1002/(ISSN)1527-6473
24. Mart i G, Gomez R, Jodar E, Loinaz C, Moreno E, Hawkins E. Long-term follow-up of bone mass after orthotopic liver transplantation: effect of steroid withdrawal from the immunosuppressive regimen. Osteoporos Int. (2002) 13:147–50. doi: 10.1007/s001980200006
25. Monegal A, Navasa M, Guanabens N, Peris P, Pons F, Martinez de Osaba MJ, et al. Bone disease after liver transplantation: a long-term prospective study of bone mass changes, hormonal status and histomorphometric characteristics. Osteoporos Int. (2001) 12:484–9. doi: 10.1007/s001980170094
Keywords: liver transplant, transplant related bone disease, osteoporosis, bone risk factors, fractures, post liver transplant related bone loss, glucocorticoid induced osteoporosis
Citation: Abate EG, McKenna A, Yang L, Ball CT and Kearns AE (2025) Five-year evaluation of bone health in liver transplant patients: developing a risk score for predicting bone fragility progression beyond the first year. Front. Endocrinol. 16:1467825. doi: 10.3389/fendo.2025.1467825
Received: 21 July 2024; Accepted: 02 January 2025;
Published: 20 February 2025.
Edited by:
Julio Carballido-Gamio, University of Colorado Anschutz Medical Campus, United StatesReviewed by:
Po-hung Wu, University of California, San Francisco, United StatesCopyright © 2025 Abate, McKenna, Yang, Ball and Kearns. This is an open-access article distributed under the terms of the Creative Commons Attribution License (CC BY). The use, distribution or reproduction in other forums is permitted, provided the original author(s) and the copyright owner(s) are credited and that the original publication in this journal is cited, in accordance with accepted academic practice. No use, distribution or reproduction is permitted which does not comply with these terms.
*Correspondence: Ejigayehu G. Abate, QWJhdGUuZWppZ2F5ZWh1QG1heW8uZWR1
Disclaimer: All claims expressed in this article are solely those of the authors and do not necessarily represent those of their affiliated organizations, or those of the publisher, the editors and the reviewers. Any product that may be evaluated in this article or claim that may be made by its manufacturer is not guaranteed or endorsed by the publisher.
Research integrity at Frontiers
Learn more about the work of our research integrity team to safeguard the quality of each article we publish.