 Yeongkeun Kwon1,2,3†
 Hanseok Yoon4†Jane Ha5Hyeon-seong Lee6
 Kisoo Pahk7*
 Hyunwoo Kwon7*
 Sungeun Kim7*
 Sungsoo Park1,2,3
- 1Center for Obesity and Metabolic Diseases, Korea University Anam Hospital, Seoul, Republic of Korea
- 2Gut & Metabolism Laboratory, Korea University College of Medicine, Seoul, Republic of Korea
- 3Division of Foregut Surgery, Korea University College of Medicine, Seoul, Republic of Korea
- 4Division of Biotechnology, Korea University, Seoul, Republic of Korea
- 5Clinical and Translational Epidemiology Unit, Massachusetts General Hospital, Boston, MA, United States
- 6Gangneung Institute of Natural Products, Korea Institute of Science and Technology, Gangneung, Republic of Korea
- 7Department of Nuclear Medicine, Korea University College of Medicine, Seoul, Republic of Korea
Introduction: Levodopa (L-3,4-dihydroxyphenylalanine)g, a dopamine precursor that circulates in the peripheral region, is involved in pancreatic glycemic control. Although previous animal studies have shown that peripheral levodopa is correlated with insulin secretion in pancreatic beta cells, the mechanism by which the pancreas uses levodopa differently in humans with obesity and type 2 diabetes remains unknown. Our study aimed to observe how the pancreas uptakes and utilizes levodopa differently under obese and diabetic conditions.
Materials and method: 18F-fluoro-L-dopa positron emission tomography-computed tomography (18F-FDOPA PET-CT) was used to visualize how the human body uses levodopa under obese and diabetic conditions and presented its clinical implications. 10 patients were divided into 3 groups: 1) Group A, normal weight without type 2 diabetes; 2) Group B, obese without type 2 diabetes; and 3) Group C, obese with new-onset type 2 diabetes. All patients’ lifestyle modification was conducted prior to 18F-FDOPA PET-CT, and plasma samples were collected to confirm changes in amino acid metabolites.
Results: Pancreatic levodopa uptake increased in obese patients with insulin resistance, whereas it decreased in obese patients with new-onset type 2 diabetes [standardized uptake value (SUV) mean in participants with normal weight, 2.6 ± 0.7; SUVmean in patients with obesity, 3.6 ± 0.1; SUVmean in patients with obesity and new-onset type 2 diabetes, 2.6 ± 0.1, P = 0.02].
Conclusions: This suggested that the alterations in the functional capacity of pancreatic beta cells to take up circulating levodopa are potentially linked to the insulin resistance and the pathogenesis of type 2 diabetes. The differences in the uptake values between the groups implied that pancreatic levodopa uptake could be an early indicator of type 2 diabetes.
1 Introduction
Obesity and type 2 diabetes are global health challenges intricately linked through insulin resistance and chronic low-grade inflammation. Obesity contributes to type 2 diabetes by increasing adipose tissue-derived inflammatory cytokines which impair pancreatic beta-cell function, leading to progressive glycemic dysregulation (1).
Beta cells play a central role in glucose homeostasis by secreting insulin in response to rising blood glucose, thus their function has been a therapeutic target for both obesity and type 2 diabetes (2).
Levodopa (L-3,4-dihydroxyphenylalanine) or L-DOPA circulating in the peripheral region has been revealed to influence insulin secretion and glycemic control within pancreatic beta cells (3, 4). As a precursor to dopamine, Levodopa is mostly obtained through dietary tyrosine and absorbed in the upper gastrointestinal tract (5, 6), and synthesizes dopamine (7).
The role of levodopa is widely recognized as a treatment for Parkinson’s disease due to its low molecular weight, which enables it to cross the Blood-Brain Barrier (BBB) and elevate dopamine levels in the central regions (8). In 1976, researchers discovered that long-term levodopa therapy in Parkinson’s disease patients could elevate blood glucose levels in the peripheral region (9). Combined with the hyperglycemic responses observed in rats injected with levodopa and dopamine in 1967 (10), abnormal glycemic response concerned with levodopa prompted further investigations into the relationship between the pancreatic dopaminergic pathway and glycemic control.
Compared to the levodopa-derived dopaminergic pathway in the brain, the role of peripheral levodopa in glycemic control is not well understood. After the discovery that levodopa is absorbed by beta cells in the human pancreas and synthesizes dopamine (11), numerous studies have revealed that dopamine is co-secreted with insulin and can negatively regulate glucose-stimulated insulin secretion (GSIS), proving its potential role as a therapeutic target for type 2 diabetes (12–14).
(Figure 1) 1). Circulating pancreatic levodopa is uptaken by the L-type amino acid transporter 1 (LAT1) on the beta cell membrane, subsequently converting it into dopamine by aromatic L-amino acid decarboxylase (AADC) (15). Intracellular dopamine is then transported into the insulin secretory vesicles by the vesicular monoamine transporter2 (VMAT2) and co-secreted with insulin (16). Co-secreted dopamine can bind dopamine receptors and inhibit GSIS by regulating Ca2+ oscillations or transported into beta cells by the dopamine transporter (17).
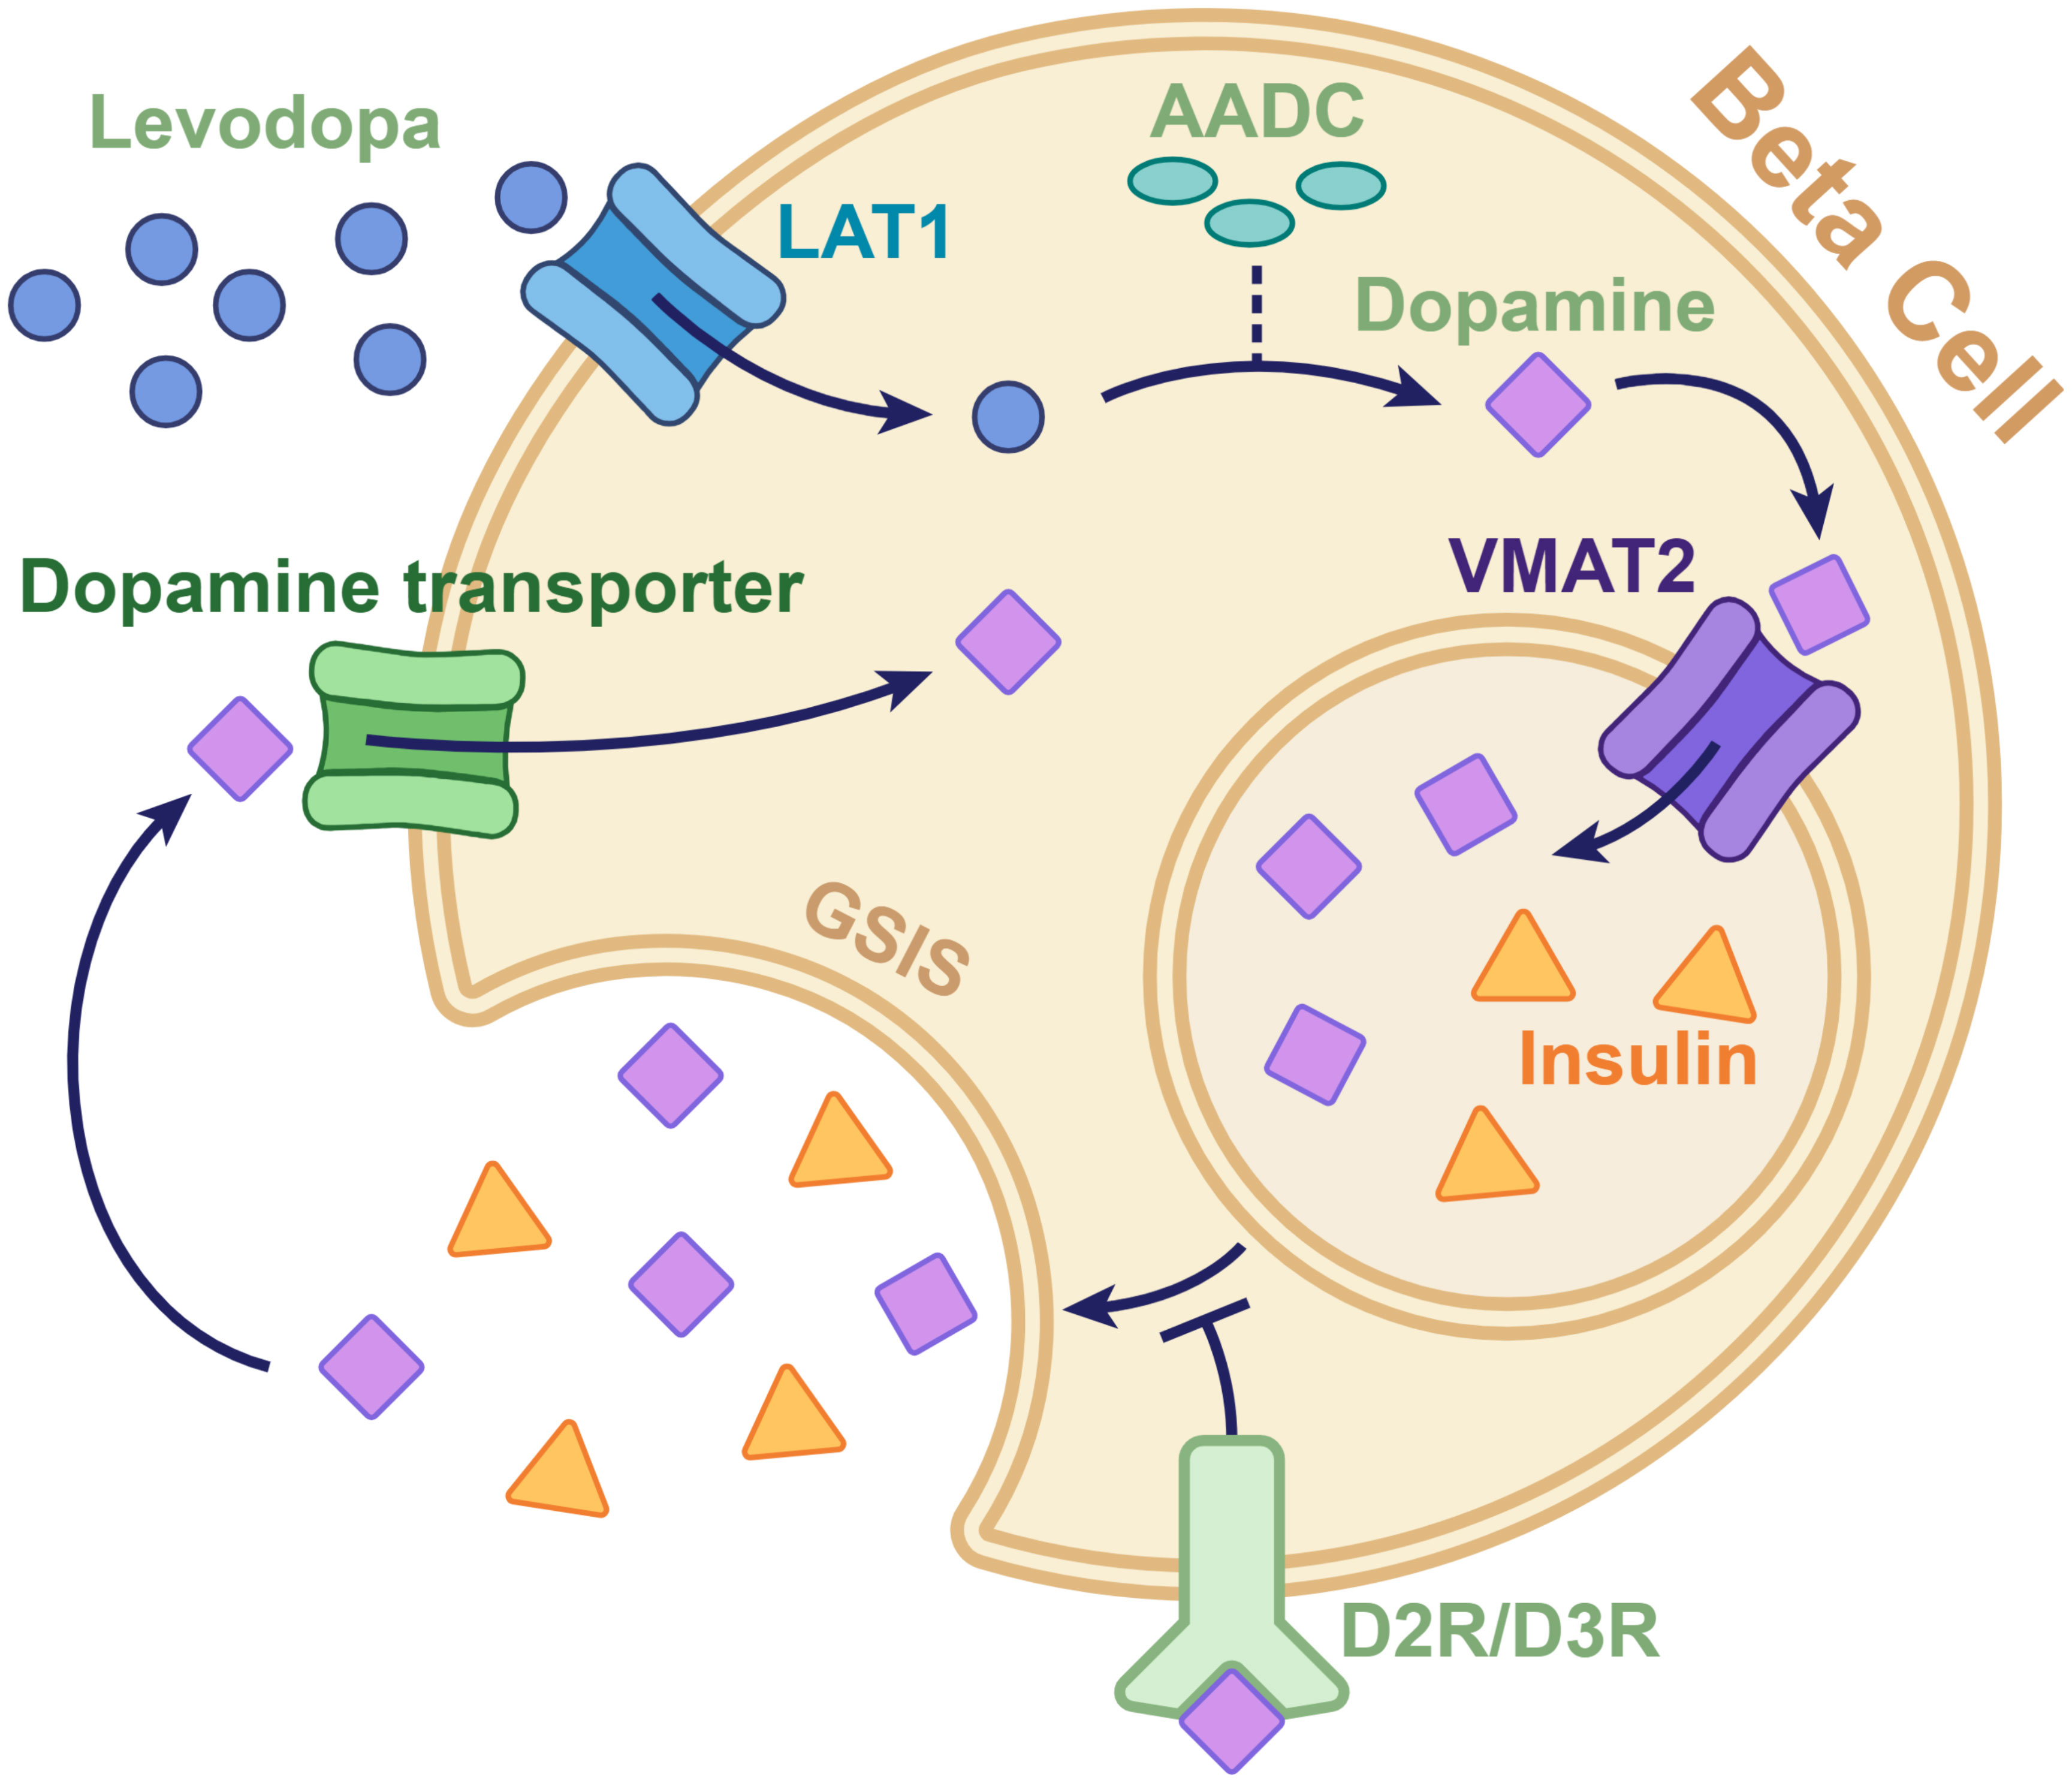
Figure 1. Diagram of the dopaminergic pathway involved in insulin secretion in the pancreatic beta cell. Levodopa, which is taken up by the L-type amino acid transporter 1 on the beta cell membrane, is converted to dopamine by aromatic L-amino acid decarboxylase. The converted dopamine is then transported from the cytoplasm to the intracellular vesicles by the vesicular monoamine transporter 2. The dopamine in vesicles is released through exocytosis along with insulin. The dopamine co-secreted with insulin can either be taken back into the cytoplasm by the dopamine transporters or can bind to dopamine D2 and D3 receptors to send signals that inhibit insulin secretion. AADC, aromatic l-amino acid decarboxylase; D2R/D3R, dopamine D2 and D3 receptors; GSIS, glucose-stimulated insulin secretion; LAT1, L-type amino acid transporter 1; VMAT2, vesicular monoamine transporter 2.
These findings show that GSIS can be further regulated by neurotransmitters such as levodopa (18, 19). Nevertheless, the precise mechanism in which levodopa uptake and dopaminergic pathways change in the human pancreas and interact with the progression of type 2 diabetes remains unclear.
Given the growing prevalence of obesity and type 2 diabetes, understanding peripheral metabolic pathways influenced by levodopa could open new perspectives for treatment. Therefore, this study aims to bridge this gap by investigating the role of levodopa in pancreatic beta-cell function across different metabolic states.
An experimental model with subjects divided into 3 groups (Group A with normal weight, Group B with obesity, and Group C with new-onset type 2 diabetes) was used to observe and visualize how levodopa uptake changes during the onset of type 2 diabetes.
This study represents the first human model investigation to compare pancreatic levodopa uptake between different metabolic states. 18F-fluoro-L-dopa positron emission tomography-computed tomography (18F-FDOPA PET-CT) was used to visualize and quantify levodopa uptake in the pancreas, and additional metabolomic analysis was conducted to quantify levodopa and related amino acid metabolites in plasma. By observing levodopa uptake and analyzing metabolomes in each group, we aim to elucidate the potential roles of levodopa in the pathogenesis of type 2 diabetes, emphasizing its significance in developing new therapeutic alternatives for type 2 diabetes.
2 Materials and methods
2.1 Study protocol
In 2020, ten patients were prospectively recruited for the study. The study population consisted of individuals aged 30–50 years, and participants were divided into three groups based on BMI and diabetes status: 1) Group A, normal weight without type 2 diabetes (n=3); 2) Group B, obese without type 2 diabetes (n=3); and 3) Group C, obese with new-onset type 2 diabetes (n=3). The male-to-female ratio of each group was 2:1 or 1:2. We enrolled an additional patient with type 1 diabetes to compare the degree of beta cell dysfunction assessed using 18F-FDOPA PET-CT with that of other cohorts. Obesity was defined as having a body mass index (BMI) ≥30 kg/m2 and normal weight as having a BMI within 18.5–25 kg/m2. New-onset type 2 diabetes was diagnosed in participants with a glycated hemoglobin (HbA1c) level ≥6.5%, a 2-h plasma glucose level ≥200 mg/dL in the 75-g oral glucose tolerance test, no history of type 2 diabetes or diabetes medication use, and confirmation of normoglycemia in a blood test within 2 years.
Patients were included if they had 1) BMI 18.5-25 kg/m2 and no history of type 2 diabetes (Group A); 2) BMI ≥ 30 kg/m2 and no history of type 2 diabetes (Group B); 3) BMI ≥ 30 kg/m2 and diagnosed with new-onset type 2 diabetes (Group C); 4) type 1 diabetes and beta cell dysfunction; 5) age with ≥ 30 and < 50 years old.
Patients were excluded if they had 1) type 2 diabetes who tested positive for islet cell antibodies (anti-glutamic acid decarboxylase and anti-insulin); 2) >5% change in the body weight within the last 6 months; 3) a history of medication use that could influence the results of 18F-FDOPA PET-CT, including carbidopa, haloperidol, monoamine oxidase inhibitors, or reserpine; 4) an estimated glomerular filtration rate <90 mL/min/1.73 m2; 5) previously undergone complex thoracic, abdominal, and/or pelvic surgeries; 6) chronic liver diseases; 7) gastrointestinal disorders including malabsorptive disorders or inflammatory bowel diseases; or 8) malignancy history; 9) pregnancy <. The inclusion and exclusion criteria are presented in Supplementary Table 1. As a pilot study, power calculation was not conducted, since no prior data was available for reference. Preliminary data, including metabolomic analyses, were internally reviewed to validate the sample’s appropriateness and ensure its relevance for exploratory analysis. Informed consent was obtained from all participants prior to the study enrollment. This study was approved by the Institutional Review Board (no. 2018AN0256).
2.2 Outcome measurements
The homeostatic model assessment indices were calculated using the HOMA2 calculator (20). HOMA2-S provides an estimation of insulin sensitivity, presented as percentages. The model has previously been calibrated to equate 100% with the value obtained from healthy adults. HOMA-2-IR provides an estimation of insulin resistance. Additionally, the insulinogenic index for beta cell function was computed using the formula (insulin 30 min−insulin fasting)/(glucose 30 min−glucose fasting) (21).
2.3 Lifestyle modification prior to 18F-FDOPA PET-CT
After enrollment, participants underwent a 2-week pre-study optimization period to minimize the confounding effects of lifestyle or medication use (Figure 2). Although the dietary intake of amino acids has a minor effect on the circulating amino acid concentrations (22), to increase the reliability of the study results, participants were required to maintain protein and amino acid intake within ±20% of the recommended levels (23). They performed 150–200 min of walking exercises for 3 days per week, with a perceived exertion rate of 12–14 on the Borg scale (24). Medications influencing glucose levels or weight status were identified and discontinued before the study evaluation. Participants were monitored via phone calls and text messages to ensure adherence to the hospital-recommended lifestyle before undergoing 18F-FDOPA PET-CT.
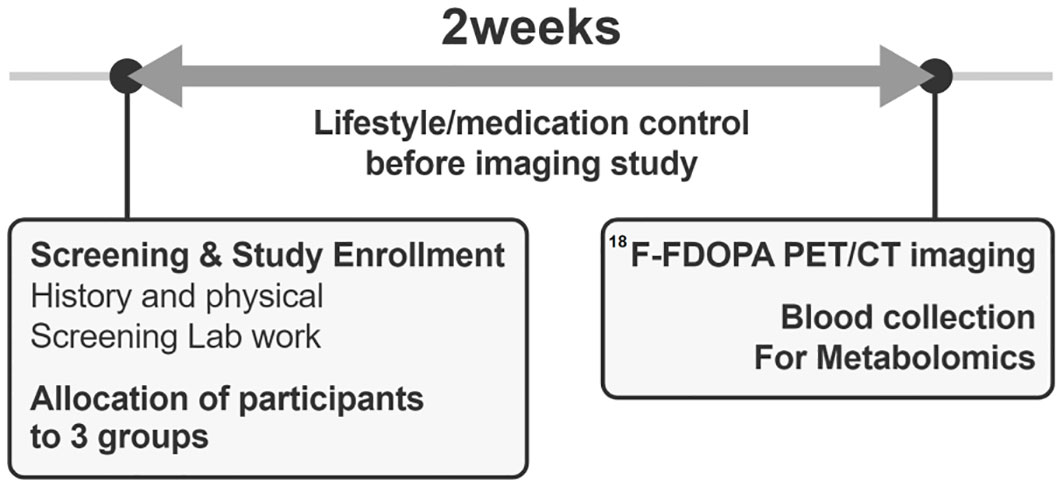
Figure 2. A diagram of the study progress.
2.4 Plasma metabolite measurements
After 2 weeks of lifestyle and medication interventions, plasma samples were collected after 8-h of overnight fasting before undergoing 18F-FDOPA PET-CT (Figure 2). Liquid chromatography-mass spectrometry was used to measure the plasma levels of the targeted amino acid metabolites (levodopa, leucine, isoleucine, phenylalanine, tryptophan, valine, and tyrosine), which are transported into the pancreatic beta cells by LAT1. The detailed protocol for measuring the plasma metabolite levels is presented in Supplementary Table 2.
2.5 18F-FDOPA PET-CT imaging protocol
PET-CT was performed using a dedicated scanner (Gemini TF 16; Philips Medical Systems). All participants fasted for 8 hours before scanning, and without carbidopa premedication was administered. Patients were injected with 4 MBq/kg of 18F-FDOPA one hour before scanning. CT for attenuation correction was performed from the patient’s skull vertex to the upper thigh, and static PET was performed for 1 min with the patient lying supine in bed. The acquired transaxial PET/CT images were analyzed using a dedicated workstation (Extended Brilliance Workspace 4.0). The SUV was calculated using the following formula: tracer activity within the volume of interest (VOI)(MBq/mL)/injected FDOPA dose (MBq/kg body weight). The following metabolic parameters were measured: maximum and mean SUVs (SUVmax and SUVmean), dopaminergic tumor volume (DTV40), and total lesion FDOPA activity (TLDA). SUVmax is the value of the voxel with the highest count within a VOI. SUVmean is the mean SUV value within a VOI. DTV40 was defined as a volume greater than the fixed threshold of 40% of the maximum activity within the VOI. TLDA was calculated by multiplying the SUVmean with the DTV40 values.
2.6 Statistical analysis
In this study, the sample size was small, and the data did not meet the assumptions of normality and homoscedasticity. Therefore, non-parametric tests, including the Mann–Whitney or Kruskal–Wallis tests, were utilized to compare continuous variables between the groups. Dunn’s test was applied for post hoc multiple comparisons when significance was identified in the Kruskal-Wallis test. Statistical analyses were performed using the Stata 16 software (StataCorp, College Station, TX, USA). Statistical significance was defined as a two-tailed P value of <0.05.
3 Results
3.1 Characteristics of the study participants
The participants’ mean ages were 36.0 ± 5.6, 38.0 ± 8.9, and 40.7 ± 7.4 years in Groups A, B, and C, respectively (Table 1). The mean BMI values were 22.2 ± 1.4 kg/m2, 37.2 ± 2.6 kg/m2, and 38.5 ± 2.6 kg/m2 in Groups A, B, and C, respectively, demonstrating significant differences (P<0.05). The fasting plasma insulin and C-peptide levels were 7.94 ± 3.20 mIU/mL and 1.19 ± 0.33 ng/mL in Group A, 22.41 ± 1.06 mIU/mL and 3.45 ± 1.30 ng/mL in Group B, and 54.63 ± 24.07 mIU/mL and 5.89 ± 2.22 ng/mL in Group C, respectively, demonstrating significant differences (P<0.05). Group B exhibited the highest insulinogenic index (2.0 ± 0.8), which measures the level of insulin secretion in the pancreas (P<0.05). Group C exhibited the lowest HOMA2-S (16.9 ± 5.9%) and HOMA2-IR (6.4 ± 1.9) values for insulin sensitivity and resistance (P<0.05), respectively. Group C exhibited a significantly higher HbA1c level of 8.1 ± 0.9% than other groups (P<0.05). Patients with type 1 diabetes exhibited a fasting plasma C-peptide level of 0.06 ng/mL, indicating pancreatic beta cell dysfunction.
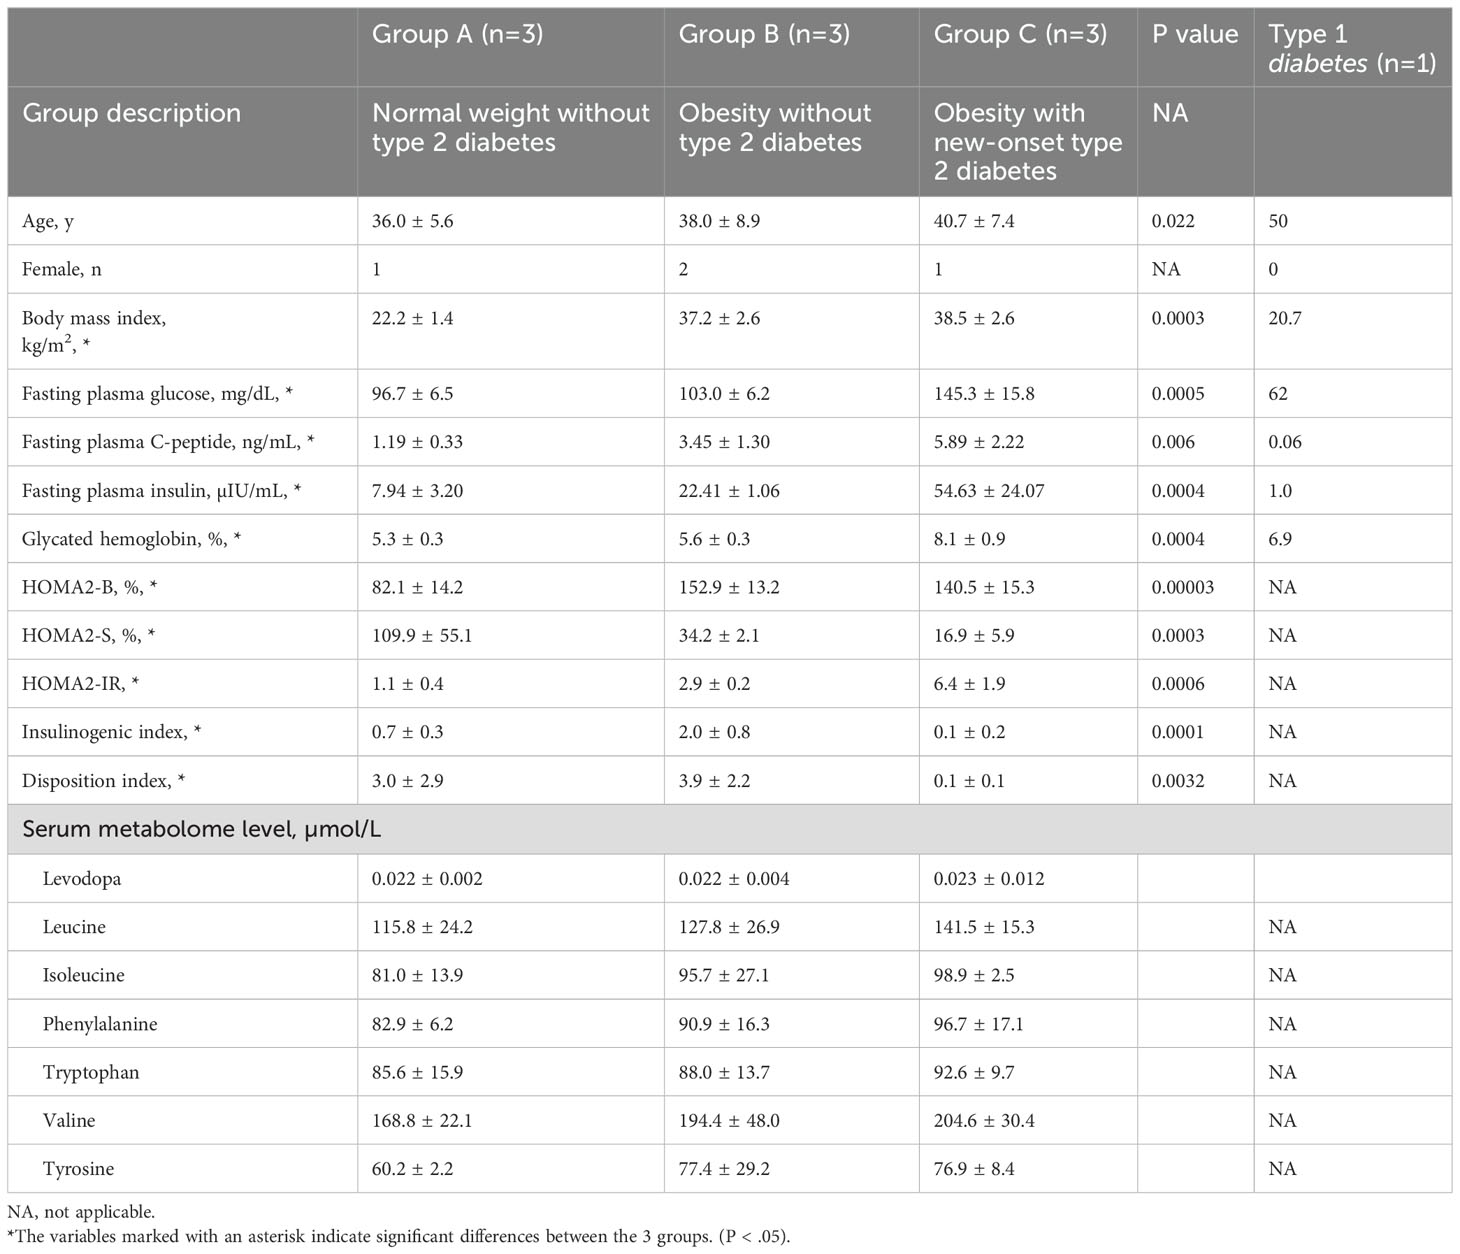
Table 1. Descriptive data of the study participants.
3.2 18F-FDOPA PET-CT findings
Group B exhibited the highest SUVmax and SUVmean assessed from the 18F-FDOPA PET-CT images (SUVmax=6.2 ± 0.4, P=0.02 and SUVmean=3.6 ± 0.1, P=0.02) (Figure 3). Group B exhibited significantly higher TLDA than Groups A or C (Group B= 448.4 ± 98.8, P=0.02) each. Patients with type 1 diabetes exhibited SUVmax, SUVmean, and TLDA values of 1.0, 0.8, and 3.2, respectively.
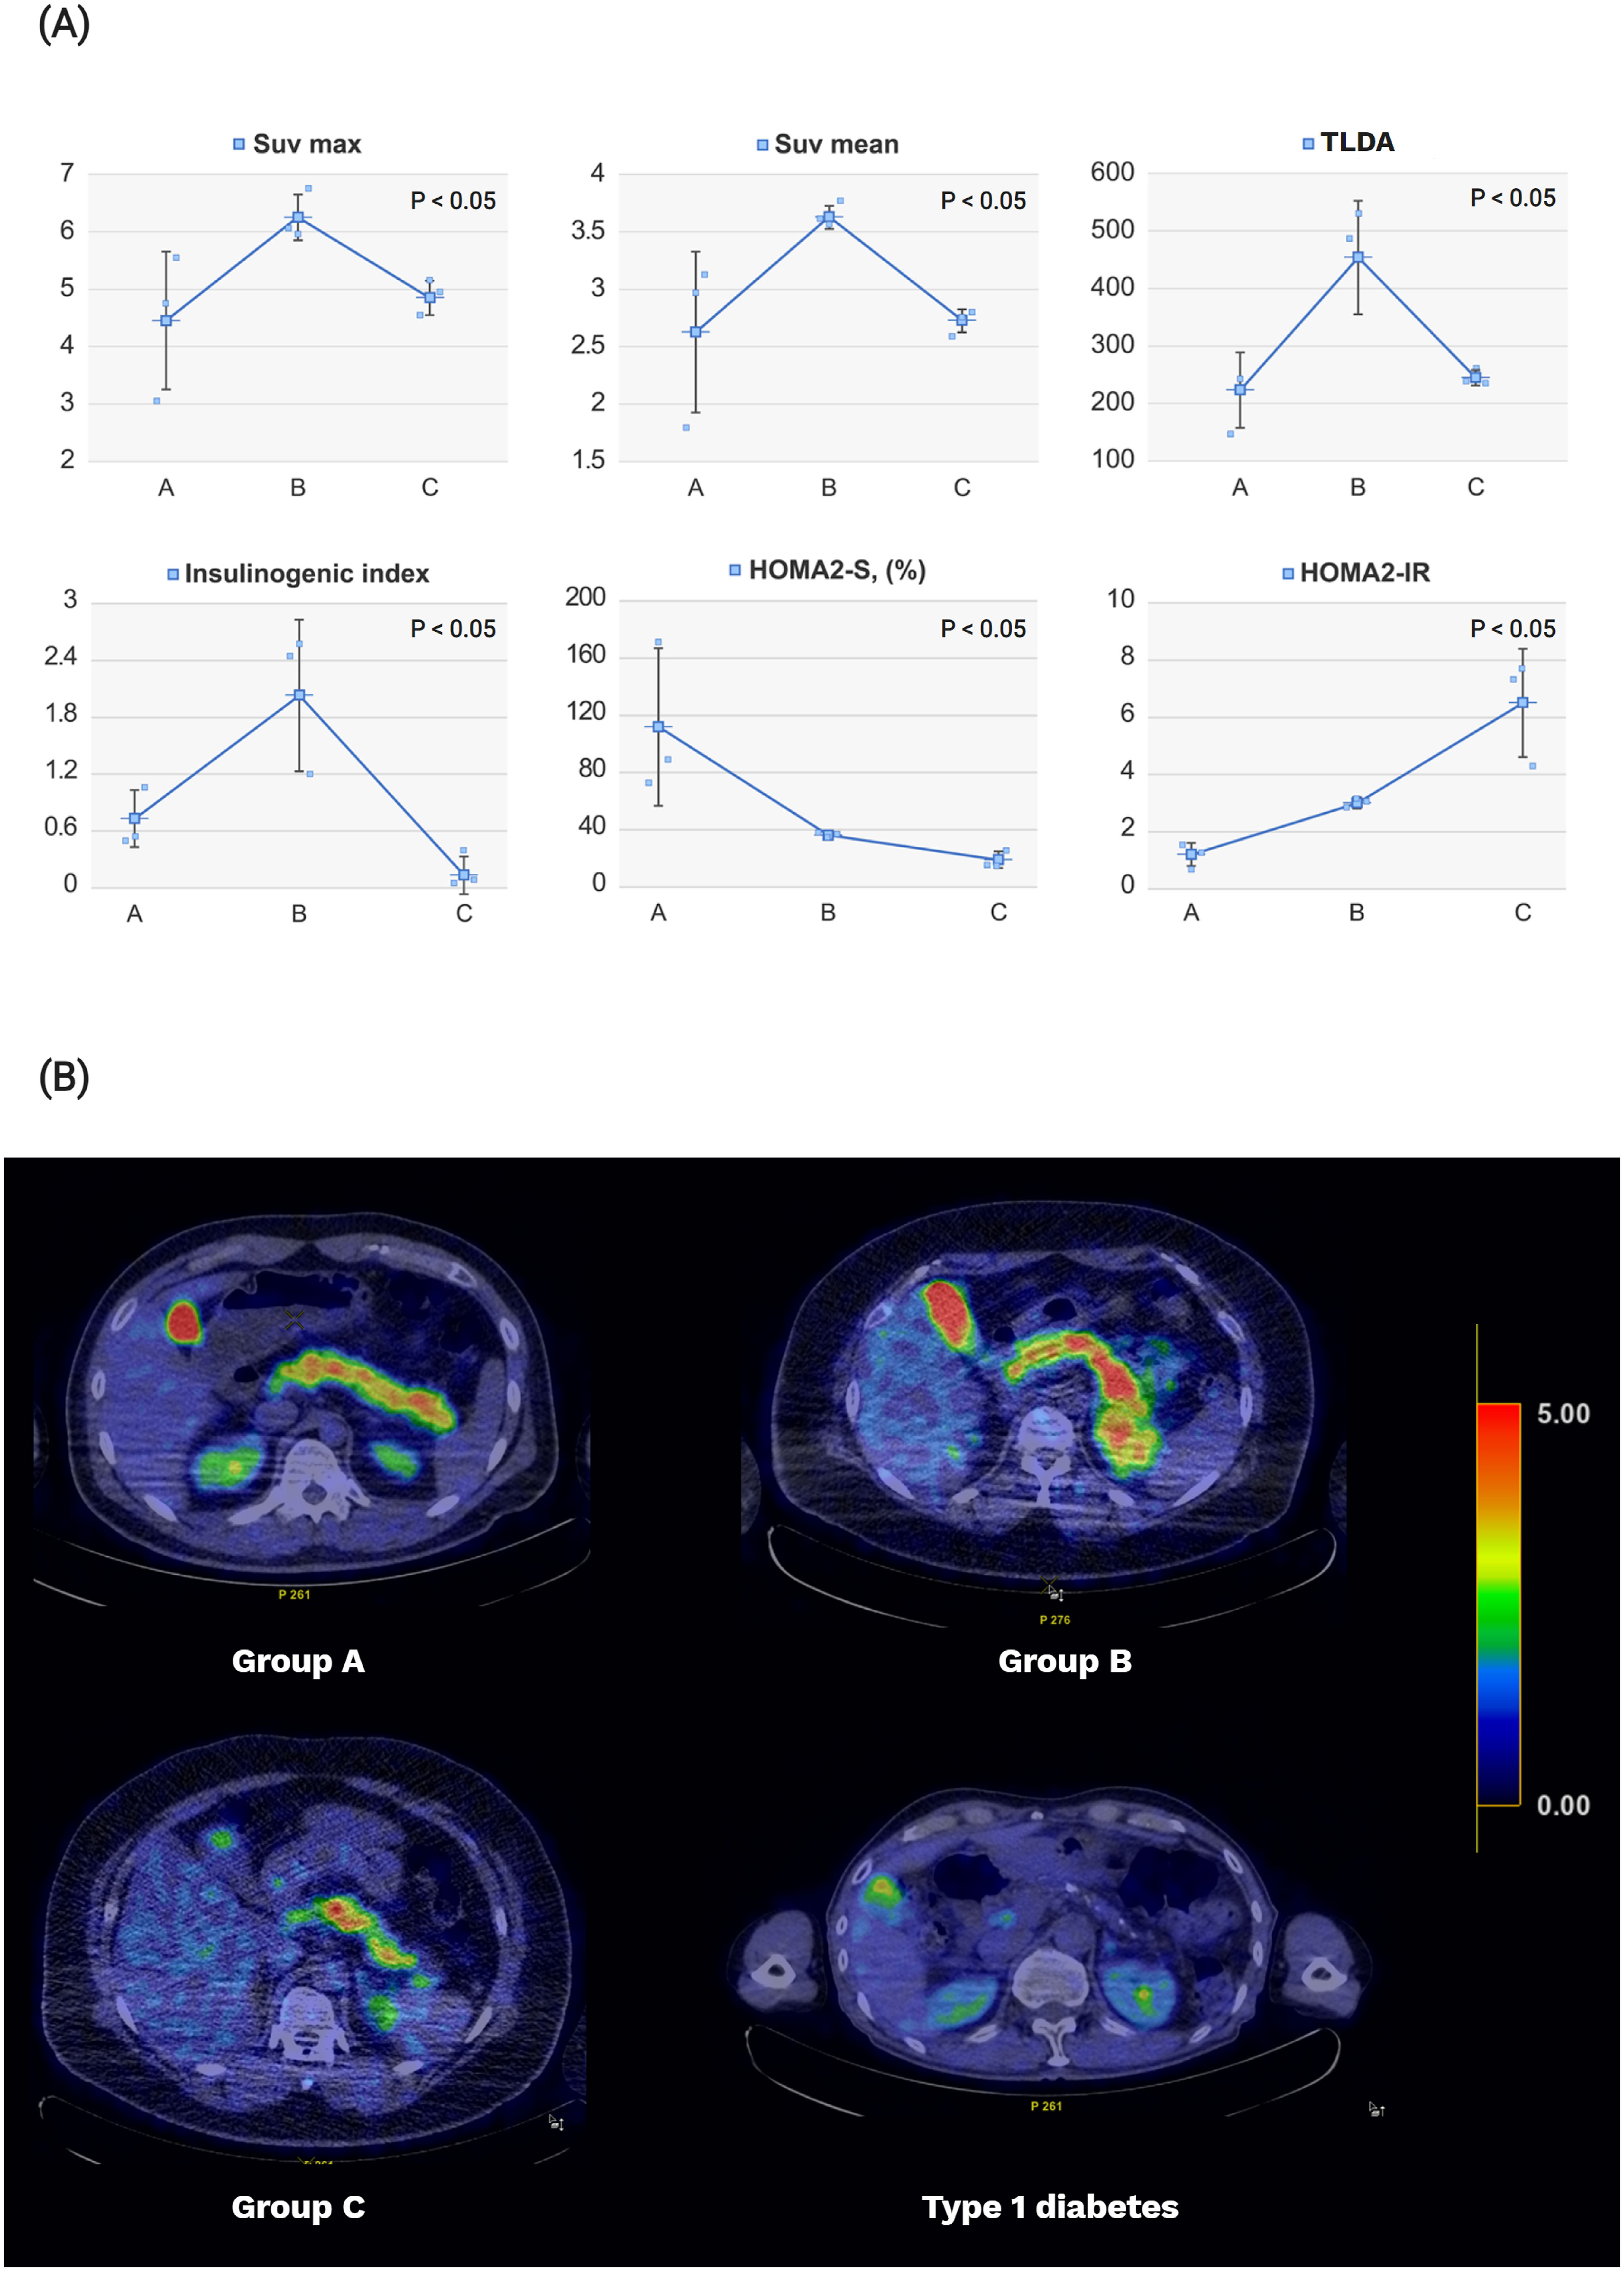
Figure 3. Pancreatic levodopa uptake on 18F-FDOPA PET-CT imaging and diabetes-related indices according to the study groups. (A) Obese patients (Group B) showed increases in pancreatic beta cell function represented by the insulinogenic index and pancreatic levodopa uptake compared with that of normal controls (Group A). Patients with new-onset type 2 diabetes (Group C) showed decreases in beta cell function and pancreatic levodopa uptake compared with those in Group (B) The degree of insulin sensitivity and insulin resistance gradually worsened in Groups A–C. The pancreatic beta cell function was expressed using the insulinogenic index, while the pancreatic levodopa uptake was expressed using the SUVmean, SUVmax, and TLDA. The insulin sensitivity and insulin resistance were expressed using the HOMA2-S and HOMA2-IR values, respectively. (B) The 18F-FDOPA PET/CT image was reconstructed by changing the color according to the values of SUVmean. The higher the SUVmean value, the closer the color to red; the lower the SUVmean value, the closer the color to blue. The averages of SUVmean for each group are as follows: [mean (standard deviation): Group A, 2.6 (0.7); Group B, 3.6 (0.1); and Group C, 2.6 (0.1); type 1 diabetes, 0.8]. SUV, standardized uptake value; TLDA, total lesion FDOPA activity; HOMA, homeostatic model assessment.
3.3 Targeted metabolome data
No significant differences were observed in the plasma concentrations of the seven metabolites (levodopa, leucine, isoleucine, phenylalanine, tryptophan, valine, and tyrosine) transported by the LAT1 among the three groups (Table 1).
4 Discussion
4.1 Summary
We aimed to observe how levodopa uptake changes between subjects with normal weight, patients with obesity, and patients with new-onset type 2 diabetes. The 18F-FDOPA PET-CT and metabolomics data revealed that Group B exhibited increased pancreatic beta cell function and levodopa uptake compared to Group A. Conversely, Group C exhibited decreased pancreatic beta cell function and levodopa uptake compared to Group B. To exclude other metabolites’ involvement in insulin secretion, additional metabolite analysis was conducted and showed that changes in other metabolite uptake were insignificant among the groups. Therefore, it is less likely that changes in the uptake of other metabolites affect the function of beta cells.
The results of the 18F-FDOPA PET-CT and targeted metabolome data showed that levodopa uptake and beta cell function exhibited a positive correlation with varying degrees in each group. Thus, our finding calls into question the previous consensus that pancreatic dopamine inhibits glucose-stimulated insulin secretion (GSIS) through autocrine and paracrine mechanisms, suggesting that the dopaminergic pathway in pancreatic beta cells not only inhibits GSIS but also may play an additional role in modifying beta cell function. We hypothesize that changes in levodopa uptake accompany modifications in the dopaminergic pathway, contributing to changes in beta cell function. A systematic review of previous research on dopaminergic pathways in obesity and type 2 diabetes was conducted to examine modifications in pancreatic dopaminergic pathways and their implications for the development of type 2 diabetes.
4.2 Dopaminergic pathway modification in patients with obesity
Patients with obesity are generally known to exhibit low-grade inflammation and hyperinsulinemia (25), and our study similarly observed increased insulin secretion and higher levodopa uptake in Group B compared to Group A. The elevated levodopa uptake can be explained by enhanced activity of LAT1 in patients with obesity. Patients with obesity exhibit a higher amount of adipose tissue compared to normal-weight subjects and have beta cells in which LAT1 activity is elevated (26). This elevation is due to secretomes secreted by the adipose tissue, which cause inflammation and increase the uptake of circulating levodopa into pancreatic beta cells. Increased levodopa uptake promotes dopamine synthesis, raises intracellular dopamine levels in beta cells, and enhances insulin secretion (27). The increase in insulin secretion can be explained by an overexpression of VMAT2 (28). Overexpression of VMAT2 sequesters the elevated cytoplasmic dopamine into insulin-containing vesicles more frequently (29). Consequently, it facilitates the co-secretion of dopamine and insulin in beta cells. In summary, higher activity of LAT1 and overexpression of VMAT2 in patients with obesity can temporarily enhance insulin secretion. Hyperinsulinemia allows patients with obesity to maintain normal glycemia, which can lower blood glucose levels and prevent vascular damage.
4.3 Dopaminergic pathway modification in patients with type 2 diabetes
In contrast, patients in Group C demonstrated reduced insulin secretion and pancreatic levodopa uptake compared to Group B. This observation is consistent with the pathophysiology of type 2 diabetes, which is characterized by insulin resistance and beta cell dysfunction, primarily characterized by insulin underproduction (30, 31). Patients with type 2 diabetes exhibit opposite changes in dopaminergic pathways compared to Group B. In contrast to Group B, the patient model with type 2 diabetes was found to have underexpression of LAT1 in the hyperglycemic condition (32). Underexpression of LAT1 leads to a lower amount of levodopa uptake into the pancreatic dopaminergic pathway and is accompanied by the downregulation of VMAT2 (33). As VMAT2 transports dopamine to the secretory vesicles for insulin secretion, downregulation of VMAT2 activity results in decreased insulin secretion with impaired GSIS. Studies on the differential activity of the two transporters in the dopaminergic pathways under obese and type 2 diabetic conditions support our findings of different levodopa uptake among the three groups.
4.4 Role of dopaminergic pathway modification
As type 2 diabetes progresses and beta cells lose their function, changes in the dopaminergic pathway may serve a different role than increasing insulin secretion. Some studies have addressed the beneficial role of dopamine accumulation and increased expression of VMAT2 in obesity. Modifying the dopaminergic pathway in obese conditions can be a self-defense mechanism of the pancreas and beta cells from inflammation and oxidative stress (29). Compared to normal-weight subjects, M1-type adipose tissue macrophages are specifically present in patients with obesity and induce an inflammatory response by secreting pro-inflammatory adipokines such as interleukin- 6, TNF-α, and nitric oxide (34, 35). Accumulation of pancreatic dopamine can protect the pancreas against inflammation by reducing pro-inflammatory cytokines and microvascular permeability (36, 37). In this case, the hyperactivity of LAT1 enhances the levodopa uptake by beta cells, facilitating dopamine accumulation. Simultaneously the overexpression of VMAT2 protects pancreatic beta cells from oxidative stress caused by dopamine accumulation in the cytoplasm (38). However, little research has been conducted to show the clear implication of changes in the dopaminergic pathways in obese and type 2 diabetic patients.
4.5 Limitations
The limitations of this paper include a small study sample, cross-sectional design, presence of artefacts and species specificity.
Due to the exploratory nature of this pilot study, a small sample size of n=3 per group was employed to collect preliminary data and generate hypotheses for further research. While we acknowledge that the small sample size may limit the generalizability of our findings, we adopted several measures to enhance the reliability of the results, including a lifestyle/medication control period prior to 18F-FDOPA PET/CT, strict patient enrollment criteria, and confirmation of preliminary data, including the metabolome of participants. Despite these efforts, we fully recognize that sample size is small for human studies, particularly in the context of investigating complex metabolic pathways such as the pancreatic dopaminergic pathway. This limitation arises primarily from the resource-intensive nature of 18F-FDOPA PET-CT imaging and the challenges of patient recruitment under strict inclusion/exclusion criteria. However, the findings from this study serve as proof of concept for the feasibility of using 18F-FDOPA PET-CT in visualizing pancreatic levodopa uptake and its correlation with beta-cell function. These results can guide the design of future large-scale cohort studies, which are currently underway in our lab to confirm and expand upon the current findings.
We also acknowledge that the cross-sectional design may limit the ability to infer causality. Therefore, we propose a future longitudinal study to track pancreatic levodopa uptake over time, particularly during the transition from obesity to type 2 diabetes.
Another limitation of this study is the potential presence of artefacts in 18F-FDOPA PET-CT imaging. Artefacts, such as partial volume effects and motion-related distortion, can occur in PET-CT scans, particularly when imaging small organs like the pancreas. These artefacts may lead to inaccurate quantification of levodopa uptake. To minimize this risk, we applied strict imaging protocols and validated our findings through additional metabolomic analysis, which showed consistent results across groups. Despite these efforts, the possibility of artefacts cannot be entirely excluded. Therefore, future studies employing higher-resolution imaging techniques and larger cohorts are warranted to further confirm our results and rule out potential artefactual influences.
The study of pancreatic dopaminergic pathways has a crucial limitation of species specificity (39, 40), which makes generalization difficult. As prior studies were mostly conducted with different animal models, the results are difficult to generalize and may not be directly applicable to humans. Therefore, novel radiologic markers or stem cell-derived organoids can be excellent alternatives, as active research in human models is highly needed to shed light on the role of pancreatic dopamine. To overcome the problem of species specificity, our study used 18F-FDOPA PET-CT to investigate the pancreatic dopaminergic pathway in the human pancreas.
5 Conclusion
This study provides exploratory insights into the role of pancreatic levodopa uptake in obesity and type 2 diabetes. Patients with obesity exhibited increased pancreatic levodopa uptake and beta-cell function compared to normal controls, while those with obesity and new-onset type 2 diabetes showed reduced uptake and impaired beta-cell function.
Using 18F-FDOPA PET/CT, this is the first study to visualize changes in pancreatic levodopa uptake in human models, highlighting its decline with the onset of type 2 diabetes. These findings suggest that pancreatic levodopa uptake may serve as an early marker for type 2 diabetes and a potential therapeutic target for preserving beta-cell function.
As there are no reliable methods to measure human pancreatic beta cell mass (BCM) in vivo (41), 18F-FDOPA PET/CT can allow early detection and prevention of type 2 diabetes in the labile group by tracking levodopa absorption and visualizing the overall function of beta cells in a minimally invasive manner (42).
Currently, there are many unknowns due to the lack of research on the dopaminergic pathway in the peripheral region. Previous studies have reported that levodopa uptake reduces glucose-stimulated insulin secretion (GSIS) through autocrine or paracrine mechanisms in animal models. However, our findings suggest that increased levodopa uptake may transiently stimulate insulin secretion, co-released with dopamine, particularly in individuals with obesity but without diabetes. This apparent discrepancy is less likely due to species-specific differences between animal models and humans, and instead may reflect short-term versus long-term effects of levodopa uptake on beta-cell function. Specifically, levodopa uptake may temporarily promote dopamine synthesis and insulin secretion (43), while chronic exposure or overexpression of dopaminergic signaling may inhibit GSIS, as observed in previous studies.
Additionally, studies on how dopamine affects pancreatic glucagon secretion and stimulates insulin secretion in a concentration-dependent manner suggest that the dopaminergic pathway is complex research target than previously thought (44). Therefore, further investigations are required to estimate the precise mechanism of the dopaminergic pathway in the peripheral region. Our study is meaningful for observing changes in levodopa uptake in the human pancreas during the onset of type 2 diabetes and for highlighting the potential processes and roles of modification in the pancreatic dopaminergic pathway based on previous research.
Given the pilot study’s small sample size, further research with larger cohorts is necessary to validate these findings and establish the clinical relevance of pancreatic dopaminergic pathways. Future studies should also explore the dual role of dopamine in regulating insulin and glucagon secretion, as well as its broader implications for metabolic health. Despite its limitations, this study provides a foundation for understanding the dynamic role of levodopa in the pancreas and its potential impact on the prevention and management of type 2 diabetes.
Data availability statement
The original contributions presented in the study are included in the article/Supplementary Material. Further inquiries can be directed to the corresponding authors.
Ethics statement
The studies involving humans were approved by Institutional Review Board (no. 2018AN0256). The studies were conducted in accordance with the local legislation and institutional requirements. The participants provided their written informed consent to participate in this study. The manuscript presents research on animals that do not require ethical approval for their study.
Author contributions
YK: Conceptualization, Data curation, Formal analysis, Funding acquisition, Investigation, Methodology, Project administration, Resources, Software, Supervision, Visualization, Writing – original draft, Writing – review & editing. HY: Conceptualization, Data curation, Formal analysis, Investigation, Methodology, Project administration, Software, Validation, Visualization, Writing – original draft, Writing – review & editing. JH: Conceptualization, Formal analysis, Investigation, Writing – original draft. HL: Conceptualization, Formal analysis, Writing – review & editing. KP: Data curation, Formal analysis, Investigation, Methodology, Project administration, Writing – review & editing. HK: Data curation, Formal analysis, Investigation, Methodology, Project administration, Writing – review & editing. SK: Data curation, Formal analysis, Investigation, Methodology, Project administration, Supervision, Writing – original draft. SP: Conceptualization, Formal analysis, Investigation, Writing – review & editing.
Funding
The author(s) declare financial support was received for the research, authorship, and/or publication of this article. This work was supported by the Basic Science Research Program of the National Research Foundation of Korea (grant number: 2020R1I1A1A01070106 for YK). This research was supported by a grant of Korea University Anam Hospital, Seoul, Republic of Korea(for YK). This research was supported by Young Medical Scientist Research Grant through the Seokchunnanum Foundation (grant number: R2127811 for YK). This research was also supported by a grant of Korea University (grant number: K2327201 for KP).
Conflict of interest
The authors declare that the research was conducted in the absence of any commercial or financial relationships that could be construed as a potential conflict of interest.
Publisher’s note
All claims expressed in this article are solely those of the authors and do not necessarily represent those of their affiliated organizations, or those of the publisher, the editors and the reviewers. Any product that may be evaluated in this article, or claim that may be made by its manufacturer, is not guaranteed or endorsed by the publisher.
Supplementary material
The Supplementary Material for this article can be found online at: https://www.frontiersin.org/articles/10.3389/fendo.2025.1460253/full#supplementary-material
References
1. Kahn SE, Hull RL, Utzschneider KM. Mechanisms linking obesity to insulin resistance and type 2 diabetes. Nature. (2006) 444:840–6. doi: 10.1038/nature05482
2. Campbell JE, Newgard CB. Mechanisms controlling pancreatic islet cell function in insulin secretion. Nat Rev Mol Cell Biol. (2021) 22:142–58. doi: 10.1038/s41580-020-00317-7
3. Korner J, Cline GW, Slifstein M, Barba P, Rayat GR, Febres G, et al. A role for foregut tyrosine metabolism in glucose tolerance. Mol Metab. (2019) 23:37–50. doi: 10.1016/j.molmet.2019.02.008
4. Lopez Vicchi F, Luque GM, Brie B, Nogueira JP, Garcia Tornadu I, Becu-Villalobos D. Dopaminergic drugs in type 2 diabetes and glucose homeostasis. Pharmacol Res. (2016) 109:74–80. doi: 10.1016/j.phrs.2015.12.029
5. Fernstrom JD, Wurtman RJ, Hammarstrom-Wiklund B, Rand WM, Munro HN, Davidson CS. Diurnal variations in plasma concentrations of tryptophan, tryosine, and other neutral amino acids: effect of dietary protein intake. Am J Clin Nutr. (1979) 32:1912–22. doi: 10.1093/ajcn/32.9.1912
6. Eisenhofer G, Aneman A, Friberg P, Hooper D, Fåndriks L, Lonroth H, et al. Substantial production of dopamine in the human gastrointestinal tract. J Clin Endocrinol Metab. (1997) 82:3864–71. doi: 10.1210/jcem.82.11.4339
7. Tambasco N, Romoli M, Calabresi P. Levodopa in parkinson's disease: current status and future developments. Curr Neuropharmacol. (2018) 16:1239–52. doi: 10.2174/1570159x15666170510143821
8. Hardebo JE, Owman C. Barrier mechanisms for neurotransmitter monoamines and their precursors at the blood-brain interface. Ann Neurol. (1980) 8:1–11. doi: 10.1002/ana.410080102
9. Rosati G, Maioli M, Aiello I, Farris A, Agnetti V. Effects of long-term L-dopa therapy on carbohydrate metabolism in patients with parkinson's disease. Eur Neurol. (1976) 14:229–39. doi: 10.1159/000114744
10. Håkanson R, Lundquist I, Rerup C. On the hyperglycaemic effect of dopa and dopamine. Eur J Pharmacol. (1967) 1:114–9. doi: 10.1016/0014-2999(67)90047-7
11. Falck B, Hellman B. Evidence for the presence of biogenic amines in pancreatic islets. Experientia. (1963) 19:139–40. doi: 10.1007/BF02171596
12. Ericson LE, Håkanson R, Lundquist I. Accumulation of dopamine in mouse pancreatic B-cells following injection of L-dopa. Localization to secretory granules and inhibition of insulin secretion. Diabetologia. (1977) 13:117–24. doi: 10.1007/BF00745138
13. Farino ZJ, Morgenstern TJ, Maffei A, Quick M, De Solis AJ, Wiriyasermkul P, et al. New roles for dopamine D(2) and D(3) receptors in pancreatic beta cell insulin secretion. Mol Psychiatry. (2020) 25:2070–85. doi: 10.1038/s41380-018-0344-6
14. Freyberg Z, Gittes GK. Roles of pancreatic islet catecholamine neurotransmitters in glycemic control and in antipsychotic drug-induced dysglycemia. Diabetes. (2023) 72:3–15. doi: 10.2337/db22-0522
15. Lindström P. Aromatic-L-amino-acid decarboxylase activity in mouse pancreatic islets. Biochim Biophys Acta. (1986) 884:276–81. doi: 10.1016/0304-4165(86)90174-1
16. Ustione A, Piston DW, Harris PE. Minireview: dopaminergic regulation of insulin secretion from the pancreatic islet. Mol Endocrinol. (2013) 27:1198–207. doi: 10.1210/me.2013-1083
17. Ustione A, Piston DW. Dopamine synthesis and D3 receptor activation in pancreatic B-cells regulates insulin secretion and intracellular [Ca(2+)] oscillations. Mol Endocrinol. (2012) 26:1928–40. doi: 10.1210/me.2012-1226
18. Rubí B, Ljubicic S, Pournourmohammadi S, Carobbio S, Armanet M, Bartley C, et al. Dopamine D2-like receptors are expressed in pancreatic beta cells and mediate inhibition of insulin secretion. J Biol Chem. (2005) 280:36824–32. doi: 10.1074/jbc.M505560200
19. Ahrén B. Autonomic regulation of islet hormone secretion – implications for health and disease. Diabetologia. (2000) 43:393–410. doi: 10.1007/s001250051322
20. Levy JC, Matthews DR, Hermans MP. Correct homeostasis model assessment (Homa) evaluation uses the computer program. Diabetes Care. (1998) 21:2191–2. doi: 10.2337/diacare.21.12.2191
21. Aono D, Oka R, Kometani M, Takeda Y, Karashima S, Yoshimura K, et al. Insulin secretion and risk for future diabetes in subjects with a nonpositive insulinogenic index. J Diabetes Res. (2018) 2018:5107589. doi: 10.1155/2018/5107589
22. Haufe S, Witt H, Engeli S, Kaminski J, Utz W, Fuhrmann JC, et al. Branched-chain and aromatic amino acids, insulin resistance and liver specific ectopic fat storage in overweight to obese subjects. Nutr Metab Cardiovasc Dis. (2016) 26:637–42. doi: 10.1016/j.numecd.2016.03.013
23. Jeong HJ. Dietary Reference Intakes for Koreans 2015. Sejong (South Korea): Ministry of Health and Welfare (2015).
24. Borg GA. Psychophysical bases of perceived exertion. Med Sci Sports Exerc. (1982) 14:377–81. doi: 10.1249/00005768-198205000-00012
25. Zhang AMY, Wellberg EA, Kopp JL, Johnson JD. Hyperinsulinemia in obesity, inflammation, and cancer. Diabetes Metab J. (2021) 45:285–311. doi: 10.4093/dmj.2020.0250
26. Thompson C, Rahman MM, Singh S, Arthur S, Sierra-Bakhshi C, Russell R, et al. The adipose tissue-derived secretome (Ads) in obesity uniquely induces L-type amino acid transporter 1 (Lat1) and mtor signaling in estrogen-receptor-positive breast cancer cells. Int J Mol Sci. (2021) 22:6706. doi: 10.3390/ijms22136706
27. Kobayashi N, Okazaki S, Sampetrean O, Irie J, Itoh H, Saya H. Cd44 variant inhibits insulin secretion in pancreatic B Cells by attenuating lat1-mediated amino acid uptake. Sci Rep. (2018) 8:2785. doi: 10.1038/s41598-018-20973-2
28. Freeby M, Goland R, Ichise M, Maffei A, Leibel R, Harris P. Vmat2 quantitation by pet as a biomarker for B-cell mass in health and disease. Diabetes Obes Metab. (2008) 10:98–108. doi: 10.1111/j.1463-1326.2008.00943.x
29. Sakano D, Uefune F, Tokuma H, Sonoda Y, Matsuura K, Takeda N, et al. Vmat2 Safeguards B-Cells against Dopamine Cytotoxicity under High-Fat Diet–Induced Stress. Diabetes. (2020) 69:2377–91. doi: 10.2337/db20-0207
30. Czech MP. Insulin action and resistance in obesity and type 2 diabetes. Nat Med. (2017) 23:804–14. doi: 10.1038/nm.4350
31. Boland BB, Rhodes CJ, Grimsby JS. The dynamic plasticity of insulin production in B-cells. Mol Metab. (2017) 6:958–73. doi: 10.1016/j.molmet.2017.04.010
32. Zhang J, Xu Y, Li D, Fu L, Zhang X, Bao Y, et al. Review of the correlation of lat1 with diseases: mechanism and treatment. Front Chem. (2020) 8:564809. doi: 10.3389/fchem.2020.564809
33. Cline GW, Naganawa M, Chen L, Chidsey K, Carvajal-Gonzalez S, Pawlak S, et al. Decreased vmat2 in the pancreas of humans with type 2 diabetes mellitus measured in vivo by pet imaging. Diabetologia. (2018) 61:2598–607. doi: 10.1007/s00125-018-4624-0
34. Rohm TV, Meier DT, Olefsky JM, Donath MY. Inflammation in obesity, diabetes, and related disorders. Immunity. (2022) 55:31–55. doi: 10.1016/j.immuni.2021.12.013
35. Odegaard JI, Chawla A. Alternative macrophage activation and metabolism. Annu Rev Pathol. (2011) 6:275–97. doi: 10.1146/annurev-pathol-011110-130138
36. Bhattacharya R, Sinha S, Yang SP, Patra C, Dutta S, Wang E, et al. The neurotransmitter dopamine modulates vascular permeability in the endothelium. J Mol Signal. (2008) 3:14. doi: 10.1186/1750-2187-3-14
37. Basu S, Nagy JA, Pal S, Vasile E, Eckelhoefer IA, Bliss VS, et al. The neurotransmitter dopamine inhibits angiogenesis induced by vascular permeability factor/vascular endothelial growth factor. Nat Med. (2001) 7:569–74. doi: 10.1038/87895
38. Ferrero E, Masini M, Carli M, Moscato S, Beffy P, Vaglini F, et al. Dopamine-mediated autocrine inhibition of insulin secretion. Mol Cell Endocrinol. (2024) 592:112294. doi: 10.1016/j.mce.2024.112294
39. Dolenšek J, Rupnik MS, Stožer A. Structural similarities and differences between the human and the mouse pancreas. Islets. (2015) 7:e1024405. doi: 10.1080/19382014.2015.1024405
40. Feldman JM. Species variation in the islets of langerhans. Diabetologia. (1979) 16:1–4. doi: 10.1007/BF00423142
41. Demine S, Schulte ML, Territo PR, Eizirik DL. Beta cell imaging-from pre-clinical validation to first in man testing. Int J Mol Sci. (2020) 21:7274. doi: 10.3390/ijms21197274
42. Christiansen CD, Petersen H, Nielsen AL, Detlefsen S, Brusgaard K, Rasmussen L, et al. 18f-dopa pet/ct and 68ga-dotanoc pet/ct scans as diagnostic tools in focal congenital hyperinsulinism: A blinded evaluation. Eur J Nucl Med Mol Imaging. (2018) 45:250–61. doi: 10.1007/s00259-017-3867-1
43. Ahrén B, Lundquist I. Effects of L-dopa-induced dopamine accumulation on 45ca2+ Efflux and insulin secretion in isolated rat islets. Pharmacology. (2008) 30:71–82. doi: 10.1159/000138053
Keywords: obesity, type 2 diabetes, 18 F-FDOPA PET-CT, levodopa, insulin secretion
Citation: Kwon Y, Yoon H, Ha J, Lee H-s, Pahk K, Kwon H, Kim S and Park S (2025) Changes in pancreatic levodopa uptake in patients with obesity and new-onset type 2 diabetes: an 18F-FDOPA PET-CT study. Front. Endocrinol. 16:1460253. doi: 10.3389/fendo.2025.1460253
Received: 05 July 2024; Accepted: 23 January 2025;
Published: 03 March 2025.
Edited by:
Undurti Narasimha Das, UND Life Sciences LLC, United StatesReviewed by:
Ken-Ichi Kobayashi, Notre Dame Seishin University, JapanRishat Ruzi, First Affiliated Hospital of Xinjiang Medical University, China
Copyright © 2025 Kwon, Yoon, Ha, Lee, Pahk, Kwon, Kim and Park. This is an open-access article distributed under the terms of the Creative Commons Attribution License (CC BY). The use, distribution or reproduction in other forums is permitted, provided the original author(s) and the copyright owner(s) are credited and that the original publication in this journal is cited, in accordance with accepted academic practice. No use, distribution or reproduction is permitted which does not comply with these terms.
*Correspondence: Kisoo Pahk, a2lzdTk5QGtvcmVhLmFjLmty; Hyunwoo Kwon, aG53b29Aa29yZWEuYWMua3I=; Sungeun Kim, c2Vpb25nQGtvcmVhLmFjLmty
†These authors have contributed equally to this work and share first authorship