 Qing Zhang
 Di Gong
 Manman Huang
 Zhentao Zhu
 Weihua Yang
 Gaoen Ma
94% of researchers rate our articles as excellent or good
Learn more about the work of our research integrity team to safeguard the quality of each article we publish.
Find out more
SYSTEMATIC REVIEW article
Front. Endocrinol., 16 April 2025
Sec. Clinical Diabetes
Volume 16 - 2025 | https://doi.org/10.3389/fendo.2025.1438739
This article is part of the Research TopicAdvances in the Research of Diabetic Retinopathy, Volume IIIView all 15 articles
Introduction: Optical coherence tomography angiography (OCTA), a noninvasive imaging technique, is increasingly used in managing ophthalmic diseases like diabetic retinopathy (DR). This review examines OCTA’s imaging principles, its utility in detecting DR lesions, and its diagnostic advantages over fundus fluorescein angiography (FFA).
Methods: We systematically analyzed 75 articles (2015–2024) from the Web of Science Core Collection, focusing on OCTA’s technical principles, clinical applications in DR diagnosis, and its use in diabetes mellitus (DM) without DR and prediabetes. The use of artificial intelligence (AI) in OCTA image analysis for DR severity evaluation was investigated.
Results: OCTA effectively identifies DR lesions and detects early vascular abnormalities in DM and prediabetes, surpassing FFA in noninvasiveness and resolution. AI integration enhances OCTA’s capability to diagnose, evaluate, and predict DR progression.
Discussion: OCTA offers significant clinical value in early DR detection and monitoring. Its synergy with AI holds promise for refining diagnostic precision and expanding predictive applications, positioning OCTA as a transformative tool in future ophthalmic practice.
Optical coherence tomography angiography (OCTA) is a noninvasive imaging technique that captures detailed images of the retinal and choroidal microvasculature. This method exploits the reflectivity of laser light from the surface of moving red blood cells, Although OCTA cannot directly display the vascular structures, it can detect the presence of blood flow in different regions and layers of the retina (1) Optical coherence tomography (OCT), another retinal imaging technique, uses multiple A-scans to generate a B-scan, providing valuable information on the retina’s structural characteristics in a cross-sectional view (2). OCTA detects and compares changes in blood flow by taking multiple images at different time points, rather than directly measuring blood flow velocity. These time-series images enable OCTA to distinguish regional variations in different blood flow rates (3).
Diabetic retinopathy (DR) is the most common and significant ocular complication among individuals with diabetes. Approximately one-third of diabetics show signs of DR, with some experiencing vision-threatening retinopathy or macular edema (4). DR results from diabetes-related damage to the eye’s tiny blood vessels and can progress from non-proliferative diabetic retinopathy (NPDR) to proliferative diabetic retinopathy (PDR). Diabetic macular edema (DME), characterized by increased blood vessel permeability, thickening, and hard exudates in the macula, frequently occurs regardless of the DR stage (5, 6). OCTA, an emerging imaging modality, enables the detection of effects in various layers of the retina in DR, the impact of different treatment modalities on retinal microvasculature and blood flow, and the correlation between functional levels and anatomical and vascular indicators. As a widely used method, OCTA aids in diagnosing DR and its complications, assisting in DR grading and early detection, particularly in diabetic patients who have not yet developed the condition (7). OCTA’s imaging modality can reveal more profound changes that ophthalmologists’ fundoscopy may not detect, helping predict and detect pre-diabetic retinopathy stage changes. In clinical applications and DR research, OCTA can identify promising and sensitive biomarkers under different modalities, offering new insights into the early-stage pathophysiology and treatment and screening of DR (8).
Since its introduction in 2014, OCTA has gained significant traction in clinical practice and has witnessed extensive utilization for various ocular diseases (9). The two most commonly employed OCTA devices are Spectral-domain OCTA (SD-OCTA) and Swept-source OCTA (SS-OCTA), both utilizing Fourier domain detection techniques. However, in SD-OCTA instruments, a broadband near-infrared superluminescent diode serves as the light source, currently operating at a center wavelength of approximately 840 nm, with a spectrometer as the detector. With the advancement of the SD-OCTA device, the clinical application of the prototype 1.0 micrometer SD-OCTA has also been reported. In contrast, SS-OCTA instruments adopt a tunable swept laser with a central wavelength of around 1050 nm and a single photodiode detector (10). SS-OCTA offers the advantage of faster scanning speed compared to SD-OCTA, enabling denser scan patterns and wider scan areas within a given acquisition time. Additionally, the use of longer wavelength in SS-OCTA leads to reduced sensitivity roll-off and improved light penetration through the retinal pigment epithelium (RPE) for better detection of signals from deeper layers. Moreover, the longer wavelength used in SS-OCTA ensures greater safety for the eye, allowing for higher laser power to be employed. The combination of higher power and reduced sensitivity roll-off enhances the ability to detect weaker signals from deeper layers, thus overcoming the barrier posed by the RPE in SS-OCT systems (11). The OCTA algorithm segments the resulting image (ranging from 3 mm2–12 mm2) into four zones, as per the standard: the superficial retinal plexus, deep retinal plexus, outer retina, and choriocapillaris. When applied to an optical disk, this encompasses the entire depth of the disk (12). While ultra-wide-field OCTA (UWF-OCTA) images have been developed and employed in clinical research, their practical clinical application may be limited due to factors such as longer acquisition time and image quality (13).
This paper aimed to present an overview of OCTA for DR applications. We obtained all the literature from the Web of Science Core Collection (WoSCC), a leading global database of scholarly information founded in 1985. The WoSCC contains both authoritative and influential journals from a wide range of disciplines. We used the WoS core set of journals indexed to the Science Citation Index and combined titles and subjects to search for subject terms to maximize accuracy while maintaining search sensitivity. Our search formula was as follows: TS= ((“Optical coherence tomography angiography” and “diabetic retinopathy”) OR (“OCTA” and “diabetic retinopathy”) OR (“Optical coherence tomography angiography” and “DR”) OR (“OCTA” and “DR”)) OR TI=((“Optical coherence tomography angiography” and “diabetic retinopathy”) OR (“OCTA” and “diabetic retinopathy”) OR (“Optical coherence tomography angiography” and “DR”) OR (“OCTA” and “DR”)) AND (DT==(“ARTICLE”) AND LA==(“ENGLISH”)). Within our search formula, TS=Topic, TI=Title, DT=Document type, LA=Language. We restricted the documents to essays and review papers, limited the language to English, and excluded documents outside the year of the OCTA application.
A search of literatures revealed a total of 885 articles published in the field over the last decade. 75 articles were mentioned in this review after being screened by ophthalmic imaging specialists and retinal disease specialists. In this review, many research directions within the field of OCTA in DR applications are mentioned. The Literature Search and Review Roadmap is shown in Figure 1.
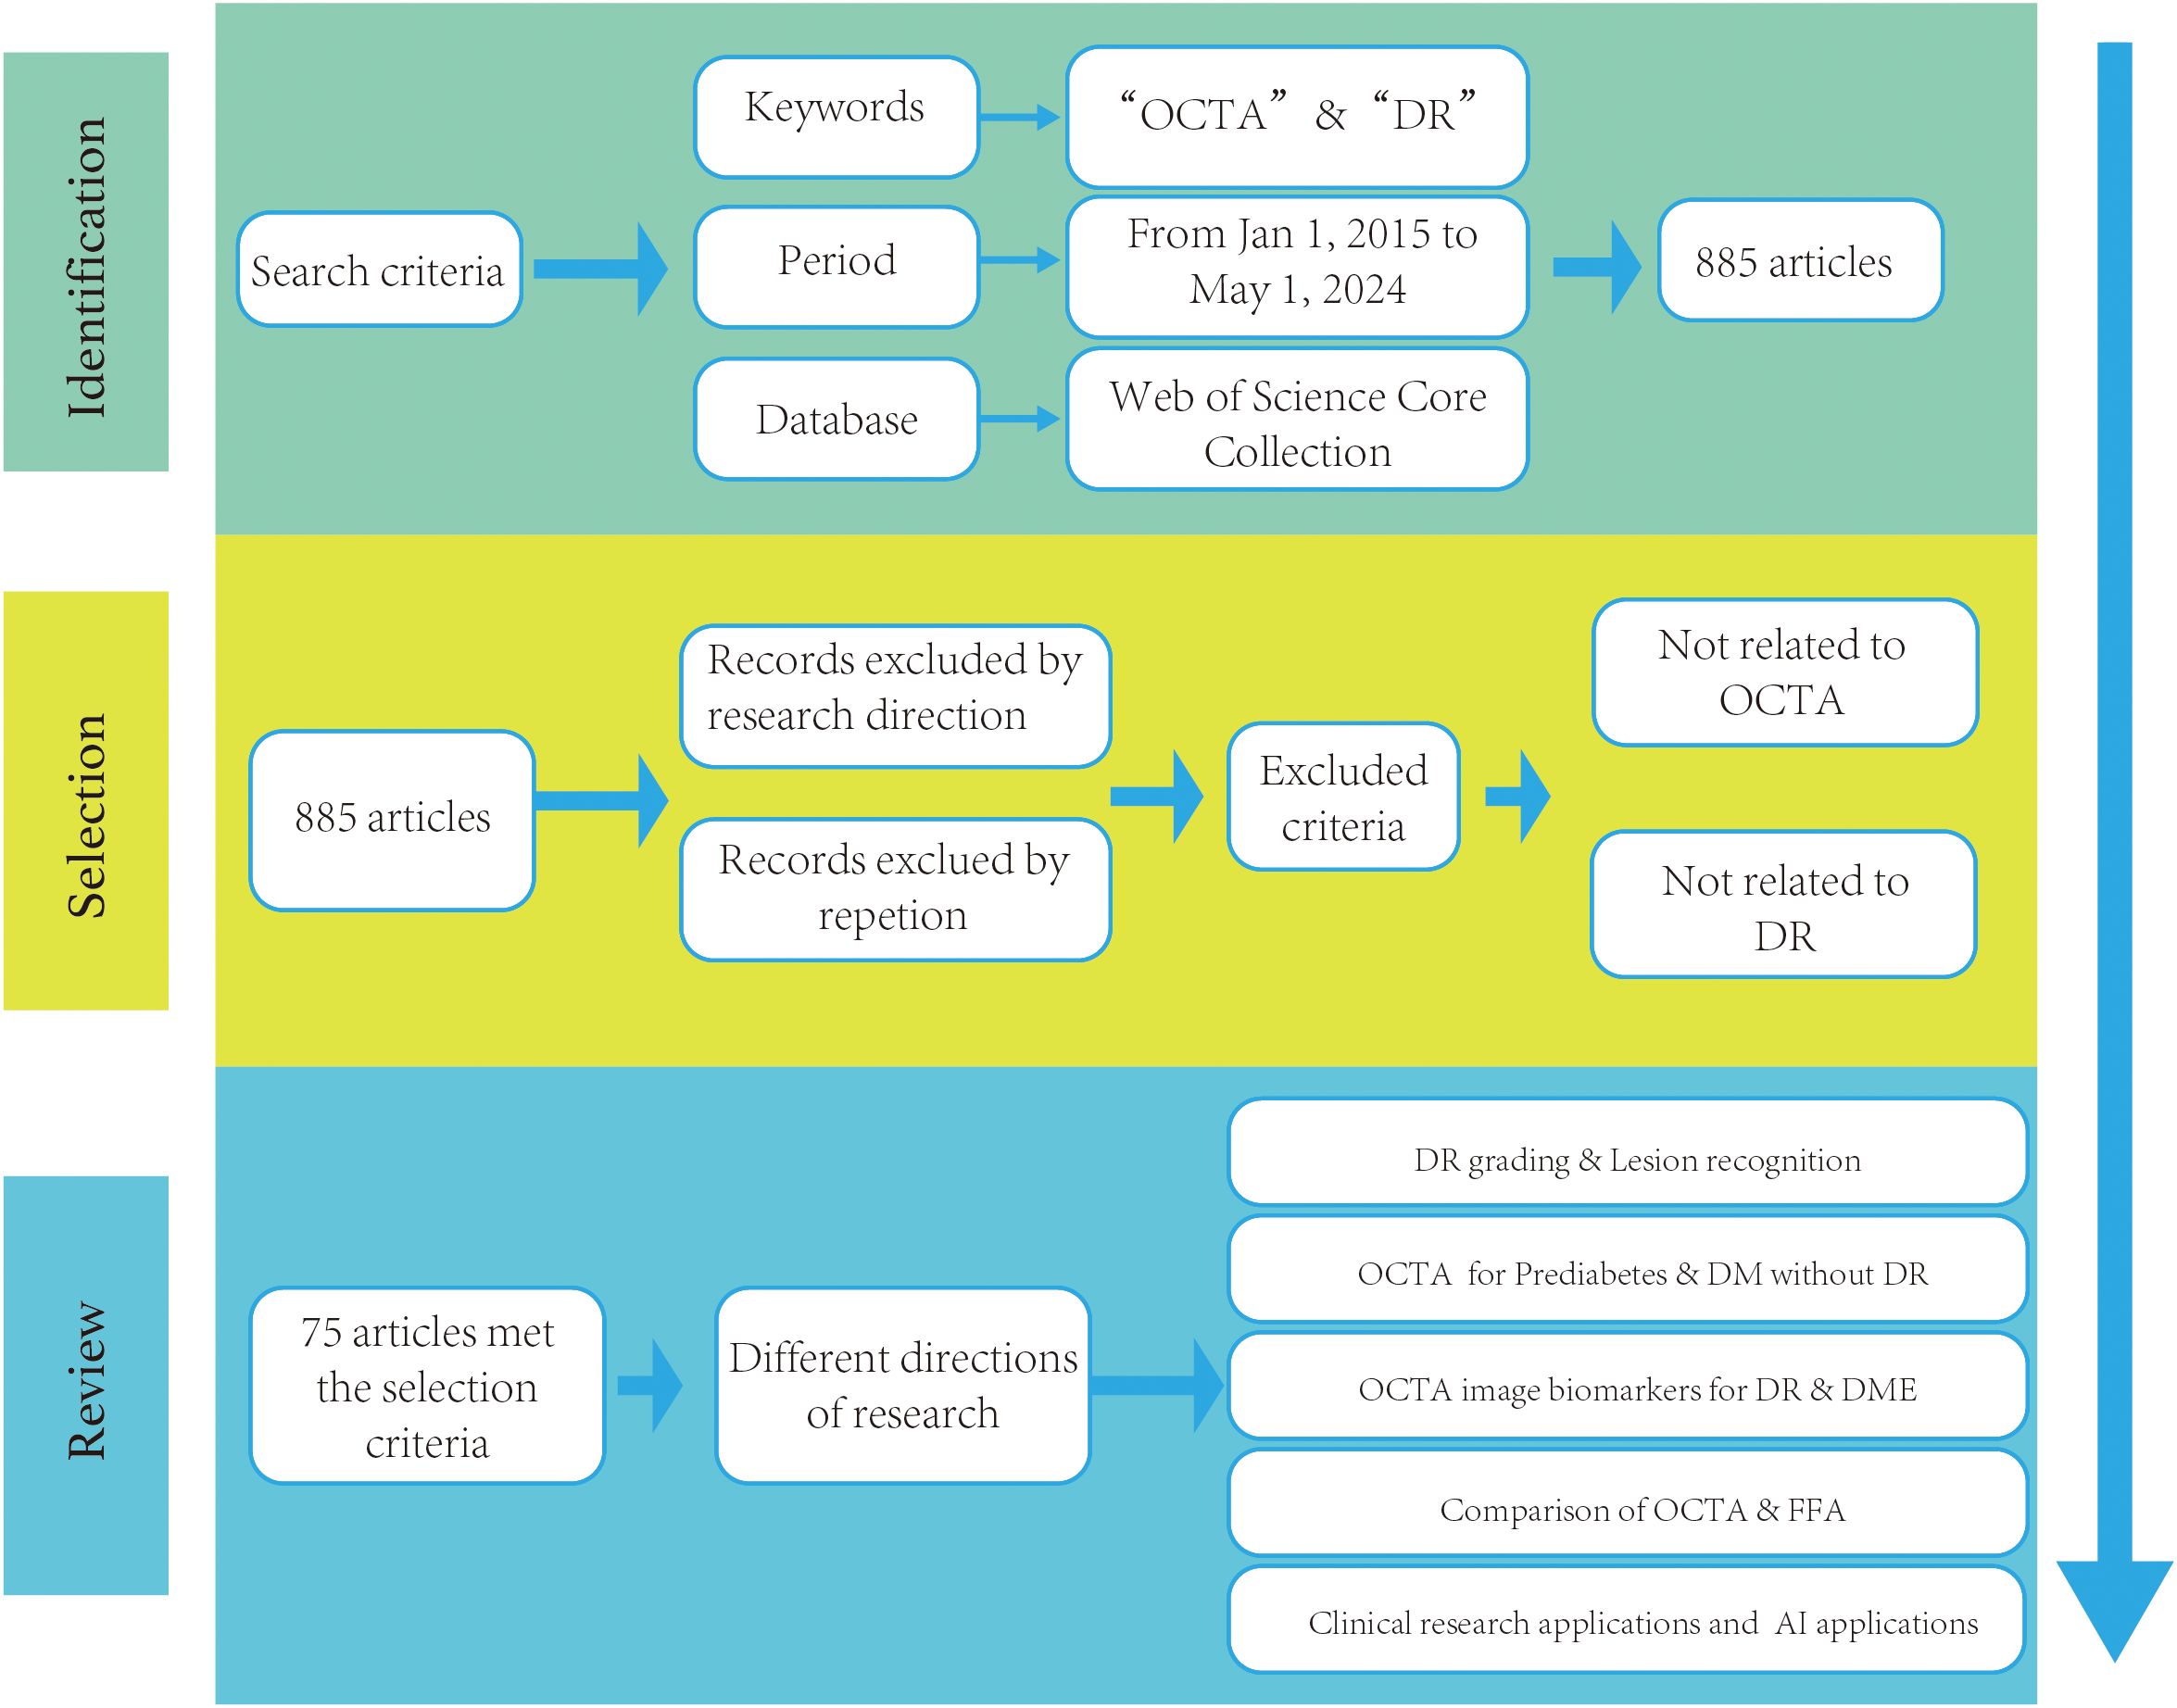
Figure 1. The literature search and review roadmap.
OCTA can produce a signal that reveals the impact of motor blood flow on retinal and choroidal vessels, providing a clear view of the superficial capillary network (SCN) in the ganglion cell layer (GCL), deep capillary network (DCN), and choriocapillaris (CC) in the outer plexiform layer. With its high sensitivity and specificity, OCTA effectively detects neovascularization even in the presence of blood flow (14). OCTA enables the detection of blood vessel shape and distribution in various retina regions, the mean artery count is 7.0 ± 1.2, and the mean vein count is 6.9 ± 1.2 in the 3 mm × 3 mm retina OCTA (15, 16).
OCTA’s capabilities extend beyond the detection of neovascularization, as it also allows for the measurement of the foveal avascular zone (FAZ) size and identification of areas without blood flow in patients who exhibit no visible clinical symptoms. Additionally, OCTA facilitates a more detailed examination of the choroid’s perfusion status, identification of choroidal capillaries, and detection of neovascular complexes in certain non-exudative lesions (17).
DR, a potentially vision-threatening condition, poses three primary threats to visual health: vitreous hemorrhages resulting from neovascularization, retinal detachment that can cause substantial vision loss, and localized damage to the macula or fovea, leading to the loss of central vision (4). Historically, the classification and grading of DR severity have been based on visible signs of increasing severity under the color fundus photograph, progressing from no retinopathy to non-proliferative or pre-proliferative stages, and finally to advanced proliferative disease. The grading of DR is crucial in guiding and preventing clinical management of the disease. Precise DR grading can assist patients in better managing the condition, thereby reducing the risk of vision loss. However, this grading system may not accurately represent functionally severe disease, as maculopathy with significant visual loss can occur with moderate ophthalmoscopic signs. This has necessitated the need for disease monitoring. By clearly visualizing key DR pathological features—microaneurysms (MAs), retinal nonperfusion, intraretial microvascular abnormalities (IRMAs), and retinal neovascularizations (RNVs)—OCTA has been endorsed in expert consensus guidelines as a critical adjunct assessment tool for clinical staging and treatment decision-making in DR management (18, 19).
OCTA is employed in clinical practice for the diagnosis of DR, frequently to identify the characteristic lesions of various stages of DR. This complements the diagnosis and grading of DR, such as MAs, IRMAs, and RNVs, as shown in Figure 2 above.
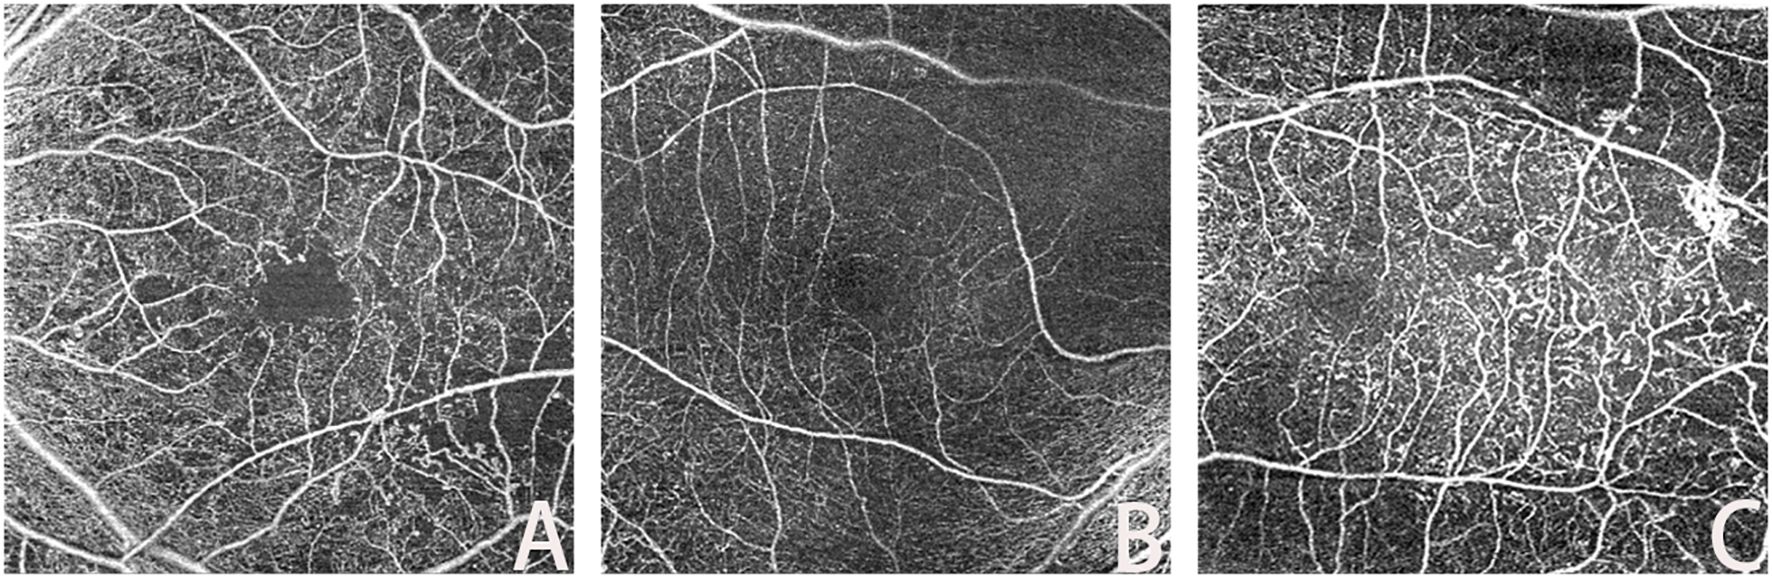
Figure 2. Lesions in OCTA ((A): MA; (B): IRMAs; (C): RNV).
Retinal microaneurysms (MAs) serve as an early symptom of DR, with the type of MA correlating with visual acuity, DR duration, and severity (20). The identification and study of MAs are of interest because their morphological features and turnover are associated with the risk of DR complications and adverse visual outcomes. OCTA techniques can reliably classify retinal MAs (21). Studies have identified various morphological types of MAs, such as focal bulge, saccular/pedunculated, fusiform, and mixed types, and found that these different typologies may correspond to DR progression at varying stages. This understanding allows for the assessment of the relationship between MAs and the progression of clinical stages of DR.
Intraretinal microvascular abnormalities (IRMAs) were first observed in the eyes of diabetic patients with severe NPDR and PDR. It was initially unclear whether these vascular anomalies indicated the development of new intraretinal blood vessels or the expansion of existing ones (22). IRMAs are characterized by abnormal branching or dilation of existing retinal capillaries, and their presence correlates with the severity and progression of DR (23). These abnormalities may be a consequence of ongoing ischemia.
OCTA images reveal IRMAs as abnormal, branching, and dilated retinal vessels that do not extend into the vitreous cavity (24). OCTA enables the visualization of morphological changes in IRMAs both before and after pan-retinal photocoagulation (PRP), which aids in classifying IRMAs into more specific types. Monitoring these morphological changes in IRMAs can facilitate the early detection of severe signs of DR, potentially leading to earlier treatment interventions (25).
Retinal neovascularization (RNV) is a critical clinical feature of PDR, representing a pathophysiological alteration resulting from retinal ischemia in DR. This abnormal formation of blood vessels signifies the progression of DR to PDR (26). RNV increases the risk of severe vision loss due to complications such as vitreous hemorrhage or traction retinal detachment. Early detection and timely treatment of RNV are crucial for preventing disease progression and subsequent vision loss (27).
Ophthalmologic fundoscopy can reveal RNV as irregular red blood columns in the optic nerve head and retina. However, the direct visualization of neovascularization is limited by the retinal structure and laser spots formed after treatment. Although OCTA has poor ability to detect NVD or NVE by the lack of detection of leakage from RNV. On OCTA images, the most common neovascular lesions are irregular hyperplasia of fine blood vessels, while some RNVs appear as filamentous neovascular loops (28).
The identification of characteristic lesions of DR, as described, often relies on OCTA as complementary information for DR diagnosis. RNV identification was rigorously performed using B-scan flow analysis, where neovascularization confirmation required detectable flow signals above the internal limiting membrane (ILM), thereby distinguishing true RNV from IRMA. Nevertheless, OCTA has limitations; it cannot detect hard exudates, which are due to the extravasation of lipids and proteins following the breakdown of the blood-retina barrier, nor can it accurately identify vessels with low blood flow velocities or hemodynamically abnormal capillaries.
In patients with diabetes mellitus (DM) without DR, OCTA imaging parameters can detect potential microvascular and neurological changes that may not be observable during fundoscopic examination. A prospective study analyzing OCTA data from patients with type 1 diabetes, in conjunction with clinical data, found that metabolic markers and other patient data influenced OCTA results (29). Several studies have indicated that microvascular changes, such as enlargement and remodeling of the FAZ and capillary nonperfusion zone, may begin before the clinical signs of DR become apparent. OCTA is used to identify diabetic patients at risk for retinopathy and to provide rapid, noninvasive screening for diabetes prior to a systematic diagnosis (30). Retinal microvascular abnormalities, including capillary dropout, dilated capillary loops, tortuous capillary branches, patches of reduced capillary perfusion, irregular FAZ contours, FAZ enlargement, and focal or diffuse choriocapillaris flow impairment, have been observed in some diabetic eyes without retinopathy. These abnormalities may serve as early signs of DR and could potentially act as biomarkers for early detection and monitoring of the disease (31).
OCTA metrics have proven valuable in anticipating the advancement of DR in individuals with type 2 DM through the assessment of thickness measurements, retinal nerve fiber layer, and plexiform layer thickness measurements within the ganglion cell layer. Changes in retinal vascular parameters in participants were identified by OCTA measurements of retinal avascular zones, including area, circumference, circularity, vascular density (VD), and macular perfusion (MP) (29, 32, 33). In individuals diagnosed with type 1 diabetes without any signs of DR, it was observed that the VD of the superficial capillary plexus (SCP), deep capillary plexus (DCP), and choroidal ciliary body was lower compared to that of healthy individuals, indicating an earlier impact on both retinal and choroidal circulation before the manifestation of DR (34). Furthermore, patients with diabetes exhibited a reduced vessel density in the superficial and deep retinas surrounding the central fovea (35). However, various studies have reported conflicting findings regarding changes in the size of the FAZ in the early stages of DR. Some studies suggest a significant increase in FAZ size among patients with diabetes (30), while others found no notable differences in FAZ size between the SCP and DCP regions (36). Given the considerable variability in the FAZ region among healthy individuals, its association with DR requires further investigation and verification (37).
In diabetic patients without DR, there is an association between early changes in the morphology of blood vessels around the optic nerve and the density of blood vessels in the retinal choroid capillaries. These changes are linked to a decrease in the thickness of the nerve fiber layer. Notably, alterations in surface vessel density are more commonly observed in the peripapillary region than in the macular area. It is important to note that patients with diabetes may experience early damage to both neurons and small blood vessels, even before clinical signs of DR are present (38). Furthermore, individuals with diabetes exhibit a reduced vascular response to flash stimuli, and there is a decrease in perfusion density in the deep capillary layer in those without DR (37). OCTA imaging reveals damage in the retinal microvasculature, and it has been observed that patients with type 2 diabetes who have microalbuminuria but do not yet have DR exhibit changes in retinal microcirculation. These alterations could potentially serve as an early monitoring tool for tracking microvascular complications in such patients (39, 40).
RNV can arise from IRMAs. Early detection of IRMAs may serve as a reliable method to predict the progression of PDR. Regular use of OCTA to monitor the occurrence of IRMAs may aid in the timely diagnosis of PDR (41). Identifying alterations in OCT and OCTA parameters in specific diabetic patients at an early stage may serve as an indicator of subsequent overt retinopathy (42). A decrease in macular CC perfusion could potentially act as an initial marker for clinically undetectable diabetic vasculopathy (43). The analysis of intercapillary areas (ICAs) involves measuring the distance between surrounding vessels and each pixel in the intercapillary region. Consequently, employing OCTA in DM patients without existing DR holds promise for early detection and prediction of DR development (44). It is imperative to enhance the quantification of retinal ischemia through various perspectives and integrate OCTA imaging into routine clinical and scientific practices. The adoption of standardized and device-independent image analysis methods becomes essential in this regard (45). OCTA has demonstrated remarkable potential in the management of prevalent ocular complications among DM patients. The use of imaging tests for preventing and controlling DR is particularly crucial for DM patients with existing DR.
Prediabetes, also known as impaired glucose regulation (IGR), is a pathological condition characterized by blood glucose levels that are higher than normal but have not yet reached the diagnostic criteria for diabetes. According to the World Health Organization (WHO), prediabetes is classified into two types: impaired fasting glucose (IFG) and abnormal glucose tolerance (IGT) (46). The risk of DR may be related to prediabetes. During examination by direct ophthalmoscopy, vascular changes, such as a lower arteriole-to-venule ratio and increased retinal arteriole or venular caliber, were found in the retinas of patients with prediabetes, which may be associated with the pre-diabetic state (47). The current application of the OCTA technique for monitoring blood flow in normoglycemia versus prediabetes shows that the paravascular density in the SCP and DCP layers of the retina was reduced in the prediabetes group compared with that in the normoglycemia group (48).
In the application of OCTA for DR, several image markers can be utilized to predict the severity of the disease and provide complementary information for DR diagnosis and management. These markers include metrics for the FAZ and vascular and perfusion densities, which have been extensively studied as clinically interpretable features to gauge the severity of DR.
Foveal avascular zone (FAZ) corresponds to the region of the human retina with the highest concentration of cone photoreceptors and oxygen consumption (49). Researchers have extensively studied the correlation between FAZ changes and various ocular diseases (50). As DR progresses, the fovea, which is responsible for central vision, can be affected. In such cases, abnormalities in the size and shape of the FAZ can contribute to vision loss (51). OCTA assessment of the FAZ area in patients with type 2 diabetes enables early detection of macular changes that precede findings from conventional retinography and SD-OCT examinations (52). One study conducted an assessment of neurological dysfunction in pre-diabetic individuals using multifocal electroretinography (mfERG), analysis of neurodegeneration, and measurement of retinal layer thickness with SD-OCT. Additionally, quantitative parameters such as FAZ area, vessel area density (VAD), vessel length fraction (VLF), vessel diameter index (VDI), and fractal dimension (FD) were measured using OCTA. It should be noted that the association between pre-diabetic neurodegeneration and early microvascular damage is not yet fully understood. However, a glycemic threshold was identified for pre-diabetic patients with observable retinopathy (53, 54).
Vessel density (VD) was defined as the proportion of the vascular area in the image to the total measured area and was used to indicate microvascular perfusion (55, 56). The VD must be corrected for the thickness of the retinal layers during analysis, such as the macular ganglion cell inner plexiform layer (35). Moreover, VD is related to scanning signal strength (57). During clinical applications, poor-quality images should be deleted.
Vascular length density (VLD)/skeleton density (SD) serves as a metric similar to VD. However, because VD only considers the density per unit area of the vascular area, VLD is deemed to be more sensitive than VD to changes in perfusion at the capillary level (3).
The vessel diameter index (VDI) and the average vessel caliber (AVC) were determined by analyzing binarized and skeletonized images. This metric quantifies the average size of blood vessels in terms of their vascular caliber (54), increased VDI may be associated with higher fasting blood glucose levels (58).
Fractal dimension (FD), an indicator of vascular network complexity calculated via methods like box-counting or circular mass-radius in OCTA images, reflects the self-similarity of the retinal capillary network, notably in the superficial (SCP) and deep capillary plexus (DCP), and is automatically computed by artificial intelligence (AI) as a potential biomarker for DR progression (59). Research shows FD typically decreases in DR patients compared to healthy controls and diabetics without DR, especially in the DCP, with Singh et al. (2021) noting a significant reduction using the circular mass-radius method (60)., and Zahid et al. (2016) confirming lower FD in DR versus controls and non-DR diabetics (60), suggesting vascular simplification due to capillary dropout. The FD variation pattern differs across DR stages: in diabetic patients without clinical DR signs, FD may align with healthy controls (60), yet a 2022 study found it already lower, hinting at early changes (61); in NPDR, FD drops below normal and non-DR diabetic levels, particularly in the DCP, reflecting capillary dropout-induced simplification (62); in PDR, FD further declines, with DCP FD lower than in NPDR (60), likely due to intensified capillary loss, though neovascular complexity in PDR may not be fully captured by standard FD measures despite new vessel growth.
OCTA has the capability to identify and objectively detect diseases through alternative biomarkers, such as the VDI, vessel perimeter index (VPI), and vessel skeleton density (VSD) (63). These biomarkers have been further detailed in the context of detecting and categorizing DR during regular care for patients with PDR (64). To quantify the extent of retinal ischemia, the intercapillary area (ICA) is analyzed by measuring the distance between each intercapillary pixel and adjacent vessels (45). The capillary nonperfusion area (NPA) serves as a critical biomarker for assessing DR progression by OCTA, with its distribution varying among patients with different severities of DR (65). Certain OCTA biomarkers and parameters are essential assessment criteria in clinical studies of anti-VEGF drugs, although signal attenuation artifacts can pose challenges to accurate quantification (66, 67). Among these biomarkers, the extrafoveal avascular area (EAA) correlates well with DR severity and demonstrates high sensitivity in differentiating between diabetic and healthy populations (68). In the management of diabetic maculopathy, OCTA can detect changes in reflectance at different stages of progression, which aids in understanding the characteristics of microaneurysms and improves the timing of treatment for diabetic maculopathy lesions, facilitating a more individualized treatment plan (69). OCTA’s potential in managing patients with diabetic macular degeneration has been highlighted by a study showing that some patients with early DR macular degeneration (characterized by microaneurysms, leakage, neovascularization, and internal microvascular abnormalities) exhibit more pronounced changes in the FAZ, despite a relatively normal clinical presentation (52).
Utilizing OCTA, the identification and structural assessment of DME now extend beyond merely delineation of internal morphological disruptions. This enhanced investigative modality also affords a nuanced in-depth visual interrogation of the macular microvasculature in DME and enables precise monitoring of dynamic alterations using quantifiable OCTA parameters (70).
The progression of DME is intrinsically linked to the development of DMI. Clinically, DMI presents with enlargement and irregularity in the FAZ, along with the loss of retinal capillaries, predominantly in regions not directly bordering the macula (71). Analysis of outcomes through Fundus fluorescein Angiography (FFA) and OCTA revealed consistent observations, thereby substantiating the gradability of DMI via OCTA (72).
Underpinning studies on Diabetic Macular Ischemia have elucidated a predictive capacity within OCTA, particularly through the evaluation of SCP and DCP. This allows for the prognostic discrimination of DME’s advancement. Severe presentations of DME exhibit irregular FAZ morphology and extensive vascular damage within the Deep Vascular Plexus (DVP), compounding vision impairment ancillary to escalated degrees of DME severity, expanded FAZ regions, and accentuated central macular thickness (73). Furthermore, VD has been demonstrated to bear potential in managing DME. Among individuals with DME, there exists a statistically significant decrease in DCP’s VD compared to those without evidence of DME (74).
OCTA applications within research about anti-VEGF treatment for DME have been pivotal. By quantifying changes within macular microvasculature through OCTA parameters, enhanced insight and evaluation of the anti-VEGF therapy’s efficacy are facilitated. The integrity of the DCP is closely correlated with the treatment outcomes concerning VEGF inhibitors in DME management. The extent of DCP has been identified as a significant predictor of the response to anti-VEGF therapies (75). A comparative analysis between DME patients and those without DME highlights a distinct deterioration in visual function across multiple quadrants for those with DME. Particularly, after treatment with VEGF inhibitory agents, a superior post-treatment visual prognosis is observed in patients with higher visual deficits in both the SCP and DCP (76).
In the assessment of DR using OCTA, age significantly influences the baseline values of parameters such as VD, fractal dimension (FD), and NPA. In healthy populations, VD and FD exhibit a physiological decline with age—for instance, macular VD decreases by approximately 1.5-2.0% per decade (77)—whereas in DR patients, pathological changes superimpose upon age-related degeneration, increasing the complexity of clinical interpretation. In younger patients (<50 years), OCTA parameters are more sensitive to early microvascular changes, with VD reductions reaching 10-12% during the NPDR stage (78), though rapid disease progression can confound results. In older patients (≥60 years), vascular network degeneration may obscure early ischemic signs, and systemic factors such as hypertension often exacerbate parameter heterogeneity—for example, peripapillary vessel tortuosity increases by 15% (79).
OCTA is capable of accurately detecting changes in the retinal vasculature, although it has limitations in identifying specific lesions in clinical practice. Primarily, OCTA provides supplementary information for the management and diagnosis of patients with DR. FFA, an essential diagnostic tool for evaluating the clinical fundus characteristics of DR, can detect primary vasculopathy and vascular anomalies, such as venous bead-like changes and retinal microvascular anomalies, during the development of vasculopathy in DR. In cases of retinal nonperfusion, characterized by dark areas surrounded by large blood vessels, neovascularization is often marked by significant leakage of fluorescent dye into the vitreous cavity on FFA (80). The FFA procedure involves injecting a fluorescent dye into the anterior vein, typically via a short posterior ciliary artery, which then reaches the optic and choroid regions 8 to 12 seconds later. The choroid circulation appears as choroidal flush, a patchy, mottled hyperfluorescence, as the choroid lobules fill (81). Retinal circulation occurs 1 to 3 seconds later (11-18 seconds after injection). Early arteriovenous malformation (AVM) is associated with the filling of the retinal arteries, arterioles, and capillaries, followed by an advanced arteriovenous or laminar venous phase as the dye fills the veins in a laminar fashion. After about 10 minutes, the complete emptying of the dye occurs, and during this phase, the optic disc, Bruch’s membrane, choroid, and sclera are stained (82). The normal stages of FFA include: 1. choroidal phase; 2. arterial phase; 3. arteriovenous phase; 4. venous phase; and 5. recirculation phase. The features of DR, as identified by OCTA and FFA, are summarized in Table 1.
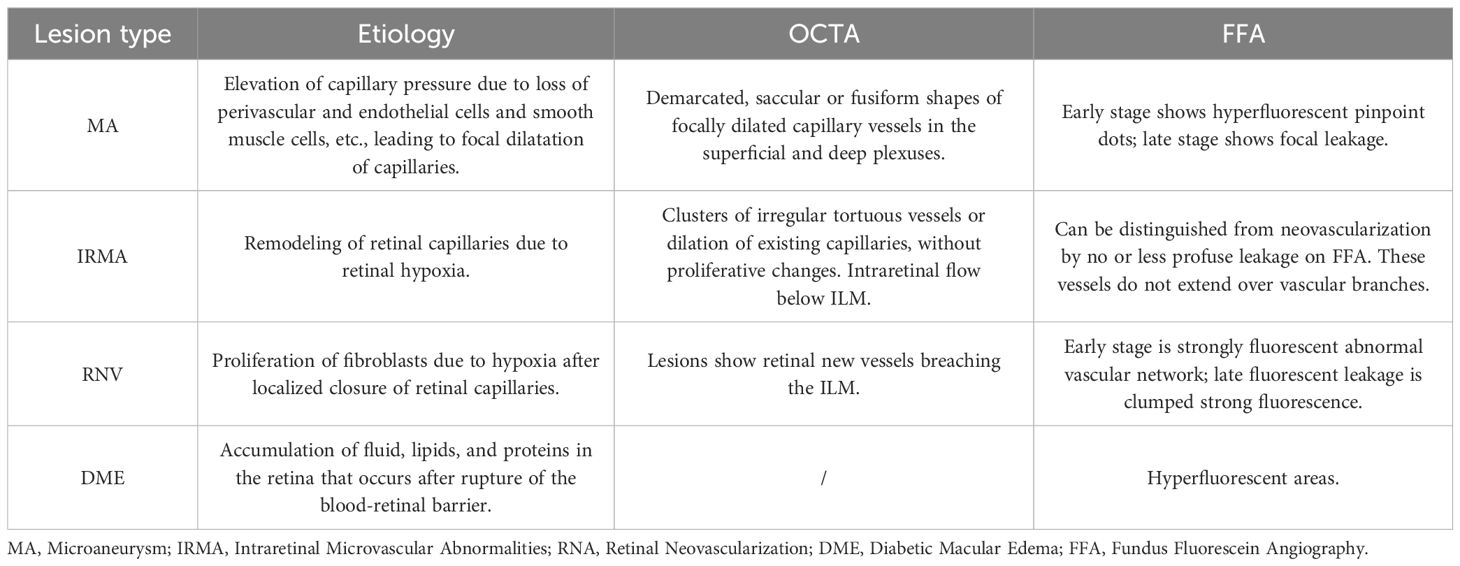
Table 1. Comparison of OCTA and FFA.
FFA offers a wider field of view and can dynamically display retinal blood flow. In contrast, OCTA provides a clearer visualization of dynamic blood flow at various retinal levels under different parameters, although it may be slightly less effective in detecting specific lesions with inaccessible or localized blood turbulence (80). The primary clinical disadvantage of FFA is its invasiveness and time-consuming nature. The contrast agent used in FFA can cause several potential side effects, including nausea, vomiting, hives, seizures, allergic reactions, and even death (83). Therefore, the benefits of FFA must be weighed against the potential risks and the availability of less invasive imaging procedures in clinical practice, as presented in Figure 3 below.
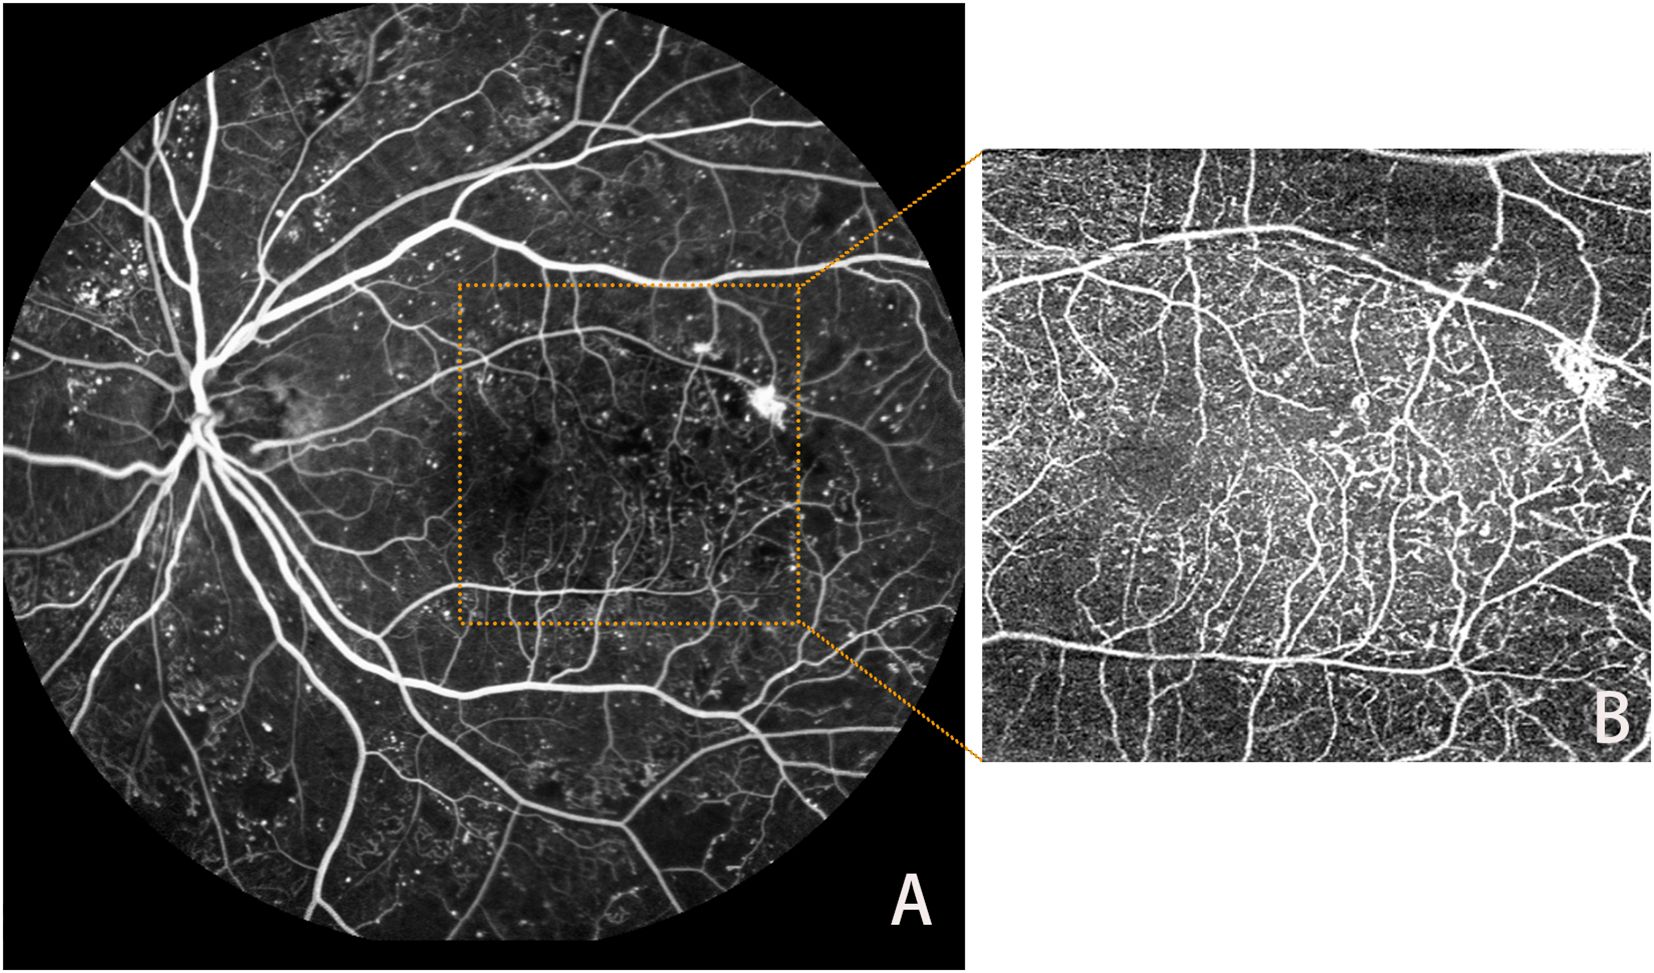
Figure 3. Lesions in FFA (A) and OCTA (B).
As a noninvasive, dye-free method for ocular vascular visualization, OCTA complements other diagnostic investigations in diagnosing, screening, and managing patients with DR. The advent and development of UWF-OCTA have partially addressed the limitations of OCTA’s small-image recognition area. UWF-OCTA can detect a broader range of retinal images during the actual acquisition process, but its longer image acquisition time may result in more artifacts and lower resolution. Thus, it is crucial to find the optimal balance between scanning area and parameter settings for UWF-OCTA under different circumstances (13, 84).
When assessing the severity of DR, UWF-OCTA has demonstrated promising results in evaluating DR retinal blood flow status. It captures more detailed information about retinal blood flow operations at once compared to standard OCTA due to its larger image range (40, 85). Furthermore, when used as input data for artificial intelligence (AI) analysis, UWF-OCTA reflects the significant potential of integrating AI with clinical applications, as it contains richer image information (86).
In clinical studies, OCTA imaging modalities facilitate the identification of complications that may lead to retinal ischemia and assess the natural course and progression of retinal ischemia in DR, emphasizing the importance of prevention (87). However, in certain cases where patients have background retinal structures and laser scars, the detailed manifestation of the disease may not be visualized solely through color fundus photograph examination. OCTA has proven effective in accurately detecting various types of neovascularization, particularly beneficial for monitoring patients with a history of retinal surgery (28). OCTA is extensively used in diverse clinical studies, such as assessing retinal inner layer (DRIL) and ellipsoid zone (EZ) losses, leading to the identification of biomarkers that contribute to visual function evaluation in patients’ eyes (88).
The assessment of GCL and inner plexiform layer (IPL) thickness for detecting retinal neurodegenerative changes has revealed a correlation between retinal vascular closure and the advancement of DR severity in patients with NPDR. This suggests that OCTA vascular closure measurements can serve as an indicator of DR progression severity. Post-analysis of OCTA images has shown that retinal neurodegeneration exhibits consistent and stable progression, potentially due to a reduction in vessel density, including vessel closure, caused by alterations in the DCP (89, 90). The analysis of biomarkers, such as VAD, VLF, and VDI, provides quantitative insights into neuronal damage observed in DR patients, indicating that it cannot be attributed solely to microvascular damage (42). The increasing use of OCTA in clinical research underscores its growing significance in advanced ophthalmic studies, including investigating potential retinal microvascular damage caused by different treatment modalities. This technique effectively assesses the number and circulatory condition of peripapillary microvessels, evaluating surgical outcomes and prognoses in clinical settings. For example, OCTA can be used when evaluating the efficacy and follow-up of surgical procedures like pars plana vitrectomy (PPV) combined with ILM peeling for epiretinal membrane (ERM) cases (91). It can also be applied in combination with certain drugs in proliferative DR and various neovascularization-related retinal diseases (92), assessing the efficacy of drug application in DR patients, and comparing the efficacy and safety after different drug applications (93). When applied to DR, OCTA parameters have been found to be good predictors of the efficacy of anti-VEGF drugs (ranibizumab (94), bevacizumab (95)) and also play a role in observing the therapeutic efficacy of other fundus implants (e.g., drug nanoparticles) (96). OCTA has played a crucial role in assessing retinal nerve damage and microvascular changes in several experimental studies (97). Compared to other imaging techniques, such as FFA, OCTA is more accurate in detecting specific lesions in clinical research and has gained broader application due to its noninvasive, user-friendly, and harmless nature.
The diagnosis of DR and the selection of treatment approaches and timing heavily depend on digital imaging data, encompassing OCT and FFA. Targeted feature extraction and objective feature quantification present significant opportunities for biomarker discovery, disease burden assessment, and prediction of treatment response. With the recent advancements in AI in ophthalmic applications, AI-assisted image analysis and OCTA data acquisition, generation, and collection can be technologically integrated. Machine learning-based techniques are particularly well-suited for leveraging OCTA to gather a vast amount of information. AI can transform the generation of OCTA images from a motion-contrast measurement to an image transformation problem, potentially reducing artifacts that are challenging to manage in traditional OCTA image formation (98). For diabetic patients without overt DR signs, OCTA’s quantitative vascular metrics (e.g., vessel density and morphological parameters) serve as tools for early screening and follow-up (99). The application of AI in analyzing and processing various biomarkers derived from OCTA has revealed the potential of specific biomarkers to serve as new imaging biomarkers for the early detection of DR (Table 2).
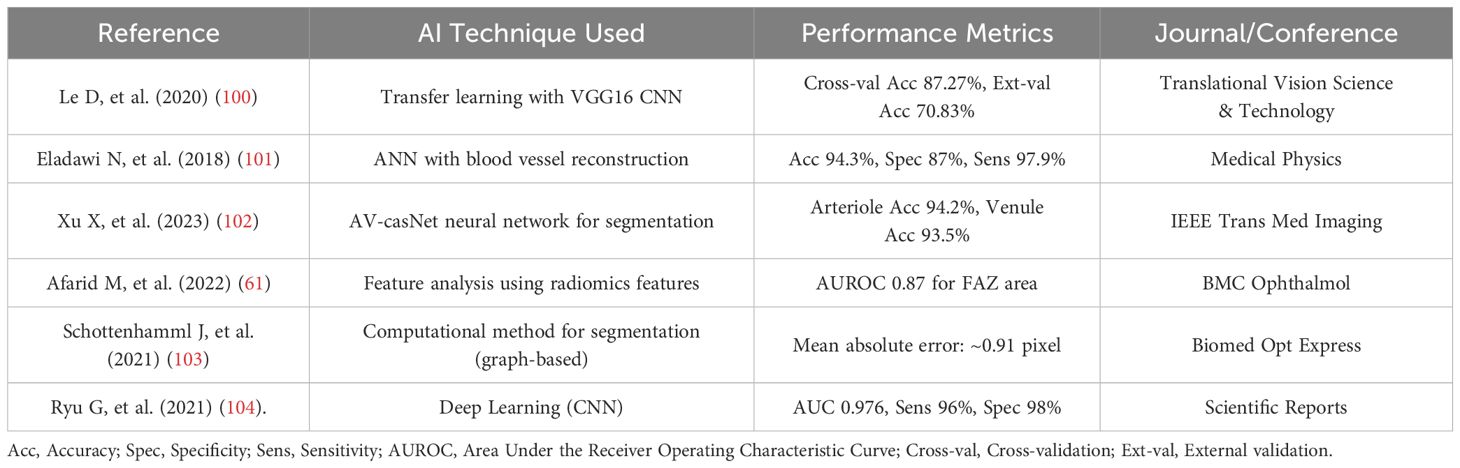
Table 2. Performance summary of AI techniques in OCTA application.
The FAZ, a central avascular region in the macula, typically enlarges in DR due to capillary dropout, with studies showing significantly higher median FAZ area in DR patients, especially in severe NPDR and PDR stages (105). AI, via deep learning (DL) automates FAZ quantification; Guo et al. (2021) demonstrated strong consistency with manual measurements (68), underscoring AI’s precision in measuring FAZ area as a potential DR severity biomarker.
Vessel density, reflecting overall retinal vascular density, decreases in DR progression, notably in superficial and deep capillary plexuses, indicating vascular loss. Research highlights a marked VD reduction with increasing DR severity, particularly post-VEGF inhibitor treatment (106). AI employs DL for vessel segmentation and density quantification, with Wang et al. (2020) validating high consistency with manual measurements (107), affirming AI’s efficacy in assessing VD as a DR progression marker.
FD measures vascular complexity, with varying findings in DR. Some studies report reduced FD in DR patients, reflecting network simplification; Hashmi et al. (2021) found significantly lower FD using the circular mass-radius method (108), supported by Zahid et al. (2019) in the deep capillary layer (60). Conversely, early DR may show FD increases due to abnormal vessels or microaneurysms, though OCTA-specific evidence is limited. AI rarely measures FD directly, relying on image processing algorithms, but may implicitly learn FD-related features for DR classification. These parameters, analyzed via AI, serve as potential biomarkers for DR severity and progression, though FD variability warrants further investigation.
AI enhances DR detection accuracy through parameter analysis. Kim et al. (2021) achieved an AUC of 0.976, sensitivity of 96%, and specificity of 98% using a CNN model (104). Le et al. (2020) reported a cross-validation accuracy of 87.27% with VGG16 transfer learning, dropping to 70.83% in external validation, highlighting generalization issues (100). Eladawi et al. (2018) used support vector machines (SVM) to extract FAZ area and VD features, achieving 94.3% accuracy (101).
The rapid advancement of AI has revolutionized DR classification through convolutional neural networks (CNNs) and transfer learning models. Studies demonstrate high diagnostic accuracy, such as Kim et al.’s CNN model achieving an AUC of 0.976 with 96% sensitivity and 98% specificity using 6×6 mm² OCTA images (104). However, generalization challenges persist, exemplified by Le et al.’s VGG16 transfer learning model showing an 87.27% cross-validation accuracy that dropped to 70.83% in external validation (109).
AI algorithms predict DR severity by analyzing biomarkers including NPA, macular ganglion cell/inner plexiform layer thickness, retinal arteriole/venule conditions, and extrafoveal vessel density (102). CNN-based approaches further classify DR into five stages (Normal to PDR) by processing OCTA parameters, enhancing grading precision (85). Despite these advancements, variability in imaging protocols and instrument settings underscores the need for standardized acquisition parameters to ensure broader clinical applicability.
In the application of AI to OCTA images of DR patients, motion correction techniques can be employed to eliminate artifacts caused by eye movements, thereby enhancing the clarity of images, DR characteristic retinopathy, and surrounding features (110). During the collection and processing of information by AI, it is advisable to construct a standard computer-aided diagnostic (CAD) system as defined in each learning model. OCTA, as part of ophthalmic imaging examinations, has demonstrated significant effectiveness in retinal assessment when combined with DL and machine learning (ML) methods, along with other patient imaging data (111). Some studies suggest that collaborative DL can yield comparable outcomes to conventional DL, achieved by utilizing jointly learned models and merging databases for microvessel segmentation and DR classification. These findings highlight the potential applicability of jointly learned models across various domains in OCT and OCTA data (112).
Enhancing the objectivity of OCTA image interpretation in future research, longitudinal tracking, and the integration of computational models to create automated diagnostics and clinical decision-support systems can augment their practical applications. Advances in computational technologies, including DL and radiomics, offer the possibility of developing distinct imaging phenotypes. The construction of these ocular imaging phenotypes can facilitate personalized disease management and increase opportunities for precision medicine. These quantifiable biomarkers and automated methods can be applied to individualized medicine, where treatments are tailored to patient-specific, longitudinally trackable biomarkers, and response monitoring can be achieved with high accuracy. Despite the integration of AI with OCTA image information in DR research, a standardized CAD system remains elusive. The evaluation criteria for learning models across different AI clinical studies are not well-defined. It is crucial to assess these models based on uniform and standardized criteria to enhance the overall proficiency of AI clinical studies in DR applications using OCTA (113).
OCTA has several limitations, including a limited field of view and an inability to visualize certain DR-characteristic lesions such as vascular leakage, as well as increased susceptibility to artifacts during the technique’s application, such as blinking, motion, and vascular reimaging. Additionally, OCTA cannot detect blood flow below the slowest detectable flow rate (66). Traditional markers for DR diagnostic grading, such as blood-retinal barrier disruption and vascular leakage, lack clear diagnostic markers in OCTA. The standardization of output from different OCTA instruments also significantly impacts the subsequent processing of image data. Current OCTA imaging also faces challenges, such as the inability to detect some ischemic vessels, specific blood flow rate requirements, low imaging efficiency for larger resolution images, and the inevitable formation of noise and artifacts due to subject eye movements during the imaging process. OCTA has a limitation in effectively identifying detailed lesion structures and comprehending the overall architecture of the retinal vasculature in DR.
Further research is needed to determine the utility of OCTA in clinical settings, given its relatively short history of clinical application, and to explore its potential for detailed visualization of the retinal vasculature. Subsequently, OCTA parameters and settings need to be standardized, and standardized guidelines based on the application of OCTA for DR diagnostic grading should be developed. Despite these disadvantages, OCTA offers the advantage of being noninvasive and capable of obtaining volume scans segmented to a specific depth within seconds. Future advancements should focus on obtaining a larger field of view, faster scanning speeds, and higher resolution.
While AI demonstrates high accuracy (100), automation, and potential for early screening in resource-limited settings, its clinical application faces challenges: 1) High-cost dependency on large annotated datasets for training robust models; 2) Limited generalizability, exemplified by Le et al.’s (2020) external validation accuracy of 70.83% (114); 3) Reduced clinical trust due to the black-box nature of DL; 4) Misclassification risks from artifacts (e.g., projection artifacts, motion artifacts); 5) Widespread neglect of age-stratified corrections in current models, leading to misdiagnosis of age-related VD/FD decline as DR progression or underestimation of early pathological signs in younger patients.
Future advancements should prioritize: developing interpretable AI frameworks with age-adaptive feature decoupling to distinguish physiological aging from pathological changes; establishing multicenter age-stratified cohort validation systems and age-specific reference standards; optimizing artifact correction through interdisciplinary collaboration; and promoting standardized CAD systems (115) for unified evaluation. Despite challenges in data scalability, model generalizability, and image quality dependency, the synergy of AI and OCTA holds transformative potential for precise DR management (116). Crucially, AI should be positioned as a clinical aid to enhance diagnostic objectivity, not as a replacement for expert judgment.
Since the advent of OCTA imaging technology, numerous clinical studies have explored its applications. OCTA is a common noninvasive method for examining retinal diseases, offering simplicity and convenience. Its advantages—noninvasiveness, dye-free imaging, rapid processing, and accurate blood flow localization—have led to its swift adoption in ocular examinations.
Initially, OCTA was primarily an auxiliary imaging tool for DR due to its unique imaging capabilities. However, as clinical studies progressed and the technology evolved, OCTA has increasingly been used to assess retinal nerve and vascular function in DR. It is particularly sensitive in detecting subtle lesions indicative of DR and DM before they manifest. OCTA aids in diagnosing and classifying established DR and can predict and manage retinal conditions in DM patients without DR. It can also identify retinal microcirculation states in prediabetic patients, which is beneficial for community screening and managing DM-related ocular complications.
Recent advances in OCTA for DR have focused on enhancing image resolution and improving software algorithms to better visualize microvascular changes. These improvements allow for earlier DR detection, detailed retinal vasculature mapping, and non-invasive DR progression monitoring. Enhanced OCTA technology also facilitates more accurate treatment efficacy assessments, improving patient management and outcomes. OCTA has the potential to serve as an independent predictor of DR. In clinical applications, OCTA is commonly used as a supplementary diagnostic tool for DR grading. Current technological developments aim to collect high-resolution, wide-field OCTA images faster, leveraging AI’s powerful processing capabilities. Further exploration is needed to standardize OCTA outputs and terminology across different instruments to fully realize its potential in diagnosing, evaluating, and predicting DR.
Although OCTA is not yet a standalone diagnostic criterion for DM in ocular imaging, the emergence of UWF-OCTA and AI integration in ophthalmology has identified more diagnostic and clinically relevant OCTA biomarkers. Despite the lack of standardized grading and interpretation methods for DR assessment, ongoing clinical research and advanced AI models are expected to establish Diagnostic Classification Guidelines for OCTA in DR soon. OCTA will continue to explore new biomarkers and practical applications, playing an increasingly significant role in the prediction, diagnosis, and management of DR across various scenarios.
The original contributions presented in the study are included in the article/supplementary material. Further inquiries can be directed to the corresponding authors.
QZ: Writing – original draft, Writing – review & editing, Data curation. DG: Writing – original draft, Writing – review & editing, Data curation. MH: Writing – original draft. ZZ: Writing – review & editing, Conceptualization, Validation. WY: Writing – review & editing, Conceptualization, Supervision, Validation, Funding acquisition. GM: Writing – review & editing, Conceptualization, Funding acquisition, Validation.
The author(s) declare that financial support was received for the research and/or publication of this article. This research was funded by the Introduction Plan of High-Level Foreign Experts (G2022026027L), Major Program of Medical Science Challenging Plan of Henan province (SBGJ202102190) and Sanming Project of Medicine in Shenzhen (SZSM202311012).
The authors declare that the research was conducted in the absence of any commercial or financial relationships that could be construed as a potential conflict of interest.
All claims expressed in this article are solely those of the authors and do not necessarily represent those of their affiliated organizations, or those of the publisher, the editors and the reviewers. Any product that may be evaluated in this article, or claim that may be made by its manufacturer, is not guaranteed or endorsed by the publisher.
1. Koustenis A Jr., Harris A, Gross J, Januleviciene I, Shah A, Siesky B. Optical coherence tomography angiography: an overview of the technology and an assessment of applications for clinical research. Br J Ophthalmol. (2017) 101:16–20. doi: 10.1136/bjophthalmol-2016-309389
2. Fingler J, Readhead C, Schwartz DM, Fraser SE. Phase-contrast OCT imaging of transverse flows in the mouse retina and choroid. Invest Ophthalmol Vis Sci. (2008) 49:5055–9. doi: 10.1167/iovs.07-1627
3. Spaide RF, Klancnik JM Jr., Cooney MJ. Retinal vascular layers imaged by fluorescein angiography and optical coherence tomography angiography. JAMA Ophthalmol. (2015) 133:45–50. doi: 10.1001/jamaophthalmol.2014.3616
4. Cheung N, Mitchell P, Wong TY. Diabetic retinopathy. Lancet. (2010) 376:124–36. doi: 10.1016/S0140-6736(09)62124-3
5. Davis MD, Fisher MR, Gangnon RE, Barton F, Aiello LM, Chew EY, et al. Risk factors for high-risk proliferative diabetic retinopathy and severe visual loss: Early Treatment Diabetic Retinopathy Study Report 18. Invest Ophthalmol Vis Sci. (1998) 39:233–52.
6. Mohamed Q, Gillies MC, Wong TY. Management of diabetic retinopathy: a systematic review. Jama. (2007) 298:902–16. doi: 10.1001/jama.298.8.902
7. Vujosevic S, Cunha-Vaz J, Figueira J, Löwenstein A, Midena E, Parravano M, et al. Standardization of optical coherence tomography angiography imaging biomarkers in diabetic retinal disease. Ophthalmic Res. (2021) 64:871–87. doi: 10.1159/000518620
8. Liu K, Zhu T, Gao M, Yin X, Zheng R, Yan Y, et al. Functional OCT angiography reveals early retinal neurovascular dysfunction in diabetes with capillary resolution. BioMed Opt Express. (2023) 14:1670–84. doi: 10.1364/BOE.485940
9. Spaide RF, Fujimoto JG, Waheed NK, Sadda SR, Staurenghi G. Optical coherence tomography angiography. Prog Retin Eye Res. (2018) 64:1–55. doi: 10.1016/j.preteyeres.2017.11.003
10. Laíns I, Wang JC, Cui Y, Katz R, Vingopoulos F, Staurenghi G, et al. Retinal applications of swept source optical coherence tomography (OCT) and optical coherence tomography angiography (OCTA). Prog Retin Eye Res. (2021) 84:100951. doi: 10.1016/j.preteyeres.2021.100951
11. Miller AR, Roisman L, Zhang Q, Zheng F, Rafael de Oliveira Dias J, Yehoshua Z, et al. Comparison between spectral-domain and swept-source optical coherence tomography angiographic imaging of choroidal neovascularization. Invest Ophthalmol Vis Sci. (2017) 58:1499–505. doi: 10.1167/iovs.16-20969
12. Spaide RF, Curcio CA. Evaluation of segmentation of the superficial and deep vascular layers of the retina by optical coherence tomography angiography instruments in normal eyes. JAMA Ophthalmol. (2017) 135:259–62. doi: 10.1001/jamaophthalmol.2016.5327
13. Zhu Y, Cui Y, Wang JC, Lu Y, Zeng R, Katz R, et al. Different scan protocols affect the detection rates of diabetic retinopathy lesions by wide-field swept-source optical coherence tomography angiography. Am J Ophthalmol. (2020) 215:72–80. doi: 10.1016/j.ajo.2020.03.004
14. Querques L, Giuffrè C, Corvi F, Zucchiatti I, Carnevali A, De Vitis LA, et al. Optical coherence tomography angiography of myopic choroidal neovascularisation. Br J Ophthalmol. (2017) 101:609–15. doi: 10.1136/bjophthalmol-2016-309162
15. Bonnin S, Mané V, Couturier A, Julien M, Paques M, Tadayoni R, et al. New insight into the macular deep vascular plexus imaged by optical coherence tomography angiography. Retina. (2015) 35:2347–52. doi: 10.1097/IAE.0000000000000839
16. Savastano MC, Lumbroso B, Rispoli M. In vivo characterization of retinal vascularization morphology using optical coherence tomography angiography. Retina. (2015) 35:2196–203. doi: 10.1097/IAE.0000000000000635
17. Huang D, Jia Y, Rispoli M, Tan O, Lumbroso B. Optical coherence tomography angiography of time course of choroidal neovascularization in response to Anti-Angiogenic treatment. Retina. (2015) 35:2260–4. doi: 10.1097/IAE.0000000000000846
18. Amoaku WM, Ghanchi F, Bailey C, Banerjee S, Banerjee S, Downey L, et al. Diabetic retinopathy and diabetic macular oedema pathways and management: UK Consensus Working Group. Eye (Lond). (2020) 34:1–51. doi: 10.1038/s41433-020-0961-6
19. Lee J, Rosen R. Optical coherence tomography angiography in diabetes. Curr Diabetes Rep. (2016) 16:123. doi: 10.1007/s11892-016-0811-x
20. Pappuru RKR, Ribeiro L, Lobo C, Alves D, Cunha-Vaz J. Microaneurysm turnover is a predictor of diabetic retinopathy progression. Br J Ophthalmol. (2019) 103:222–6. doi: 10.1136/bjophthalmol-2018-311887
21. Fukuda Y, Nakao S, Kaizu Y, Arima M, Shimokawa S, Wada I, et al. Morphology and fluorescein leakage in diabetic retinal microaneurysms: a study using multiple en face OCT angiography image averaging. Graefes Arch Clin Exp Ophthalmol. (2022) 260:3517–23. doi: 10.1007/s00417-022-05713-7
22. Goldberg MF, Jampol LM. Knowledge of diabetic retinopathy before and 18 years after the Airlie House Symposium on Treatment of Diabetic Retinopathy. Ophthalmology. (1987) 94:741–6. doi: 10.1016/S0161-6420(87)33524-9
23. Sabanayagam C, Banu R, Chee ML, Lee R, Wang YX, Tan G, et al. Incidence and progression of diabetic retinopathy: a systematic review. Lancet Diabetes Endocrinol. (2019) 7:140–9. doi: 10.1016/S2213-8587(18)30128-1
24. Pan J, Chen D, Yang X, Zou R, Zhao K, Cheng D, et al. Characteristics of neovascularization in early stages of proliferative diabetic retinopathy by optical coherence tomography angiography. Am J Ophthalmol. (2018) 192:146–56. doi: 10.1016/j.ajo.2018.05.018
25. Shimouchi A, Ishibazawa A, Ishiko S, Omae T, Ro-Mase T, Yanagi Y, et al. A proposed classification of intraretinal microvascular abnormalities in diabetic retinopathy following panretinal photocoagulation. Invest Ophthalmol Vis Sci. (2020) 61:34. doi: 10.1167/iovs.61.3.34
26. de Carlo TE, Bonini Filho MA, Baumal CR, Reichel E, Rogers A, Witkin AJ, et al. Evaluation of preretinal neovascularization in proliferative diabetic retinopathy using optical coherence tomography angiography. Ophthalmic Surg Lasers Imaging Retina. (2016) 47:115–9. doi: 10.3928/23258160-20160126-03
27. Wong TY, Sun J, Kawasaki R, Ruamviboonsuk P, Gupta N, Lansingh VC, et al. Guidelines on diabetic eye care: the international council of ophthalmology recommendations for screening, follow-up, referral, and treatment based on resource settings. Ophthalmology. (2018) 125:1608–22. doi: 10.1016/j.ophtha.2018.04.007
28. Ishibazawa A, Nagaoka T, Yokota H, Takahashi A, Omae T, Song YS, et al. Characteristics of retinal neovascularization in proliferative diabetic retinopathy imaged by optical coherence tomography angiography. Invest Ophthalmol Vis Sci. (2016) 57:6247–55. doi: 10.1167/iovs.16-20210
29. Wysocka-Mincewicz M, Baszyńska-Wilk M, Gołębiewska J, Olechowski A, Byczyńska A, Hautz W, et al. Influence of metabolic parameters and treatment method on OCT angiography results in children with type 1 diabetes. J Diabetes Res. (2020) 2020:4742952. doi: 10.1155/2020/4742952
30. de Carlo TE, Chin AT, Bonini Filho MA, Adhi M, Branchini L, Salz DA, et al. Detection of microvascular changes in eyes of patients with diabetes but not clinical diabetic retinopathy using optical coherence tomography angiography. Retina. (2015) 35:2364–70. doi: 10.1097/IAE.0000000000000882
31. Choi W, Waheed NK, Moult EM, Adhi M, Lee B, De Carlo T, et al. Ultrahigh speed swept source optical coherence tomography angiography of retinal and choriocapillaris alterations in diabetic patients with and without retinopathy. Retina. (2017) 37:11–21. doi: 10.1097/IAE.0000000000001250
32. Srinivasan S, Sivaprasad S, Rajalakshmi R, Anjana RM, Malik RA, Kulothungan V, et al. Association of OCT and OCT angiography measures with the development and worsening of diabetic retinopathy in type 2 diabetes. Eye (Lond). (2023) 37(18):3781–6. doi: 10.1038/s41433-023-02605-w
33. Wang XN, Gai X, Li TT, Long D, Wu Q. Peripapillary vessel density and retinal nerve fiber layer thickness changes in early diabetes retinopathy. Int J Ophthalmology. (2022) 15:1488–95. doi: 10.18240/ijo.2022.09.12
34. Cao D, Yang D, Huang Z, Zeng Y, Wang J, Hu Y, et al. Optical coherence tomography angiography discerns preclinical diabetic retinopathy in eyes of patients with type 2 diabetes without clinical diabetic retinopathy. Acta Diabetol. (2018) 55:469–77. doi: 10.1007/s00592-018-1115-1
35. Dimitrova G, Chihara E, Takahashi H, Amano H, Okazaki K. Quantitative retinal optical coherence tomography angiography in patients with diabetes without diabetic retinopathy. Invest Ophthalmol Vis Sci. (2017) 58:190–6. doi: 10.1167/iovs.16-20531
36. Scarinci F, Picconi F, Giorno P, Boccassini B, De Geronimo D, Varano M, et al. Deep capillary plexus impairment in patients with type 1 diabetes mellitus with no signs of diabetic retinopathy revealed using optical coherence tomography angiography. Acta Ophthalmol. (2018) 96:e264–e5. doi: 10.1111/aos.2018.96.issue-2
37. Sacconi R, Casaluci M, Borrelli E, Mulinacci G, Lamanna F, Gelormini F, et al. Multimodal imaging assessment of vascular and neurodegenerative retinal alterations in type 1 diabetic patients without fundoscopic signs of diabetic retinopathy. J Clin Med. (2019) 8(9):1409. doi: 10.3390/jcm8091409
38. Vujosevic S, Muraca A, Gatti V, Masoero L, Brambilla M, Cannillo B, et al. Peripapillary microvascular and neural changes in diabetes mellitus: an OCT-angiography study. Invest Ophthalmol Vis Sci. (2018) 59:5074–81. doi: 10.1167/iovs.18-24891
39. Cankurtaran V, Inanc M, Tekin K, Turgut F. Retinal microcirculation in predicting diabetic nephropathy in type 2 diabetic patients without retinopathy. Ophthalmologica. (2020) 243:271–9. doi: 10.1159/000504943
40. Wang F, Saraf SS, Zhang Q, Wang RK, Rezaei KA. Ultra-widefield protocol enhances automated classification of diabetic retinopathy severity with OCT angiography. Ophthalmol Retina. (2020) 4:415–24. doi: 10.1016/j.oret.2019.10.018
41. Russell JF, Shi Y, Scott NL, Gregori G, Rosenfeld PJ. Longitudinal angiographic evidence that intraretinal microvascular abnormalities can evolve into neovascularization. Ophthalmol Retina. (2020) 4:1146–50. doi: 10.1016/j.oret.2020.06.010
42. Pilotto E, Torresin T, Leonardi F, Gutierrez De Rubalcava Doblas J, Midena G, Moretti C, et al. Retinal microvascular and neuronal changes are also present, even if differently, in adolescents with type 1 diabetes without clinical diabetic retinopathy. J Clin Med. (2022) 11(14):3982. doi: 10.3390/jcm11143982
43. Dai Y, Zhou H, Chu Z, Zhang Q, Chao JR, Rezaei KA, et al. Microvascular changes in the choriocapillaris of diabetic patients without retinopathy investigated by swept-source OCT angiography. Invest Ophthalmol Vis Sci. (2020) 61:50. doi: 10.1167/iovs.61.3.50
44. Sarabi MS, Khansari MM, Zhang J, Kushner-Lenhoff S, Gahm JK, Qiao Y, et al. 3D retinal vessel density mapping with OCT-angiography. IEEE J BioMed Health Inform. (2020) 24:3466–79. doi: 10.1109/JBHI.6221020
45. Lauermann P, van Oterendorp C, Storch MW, Khattab MH, Feltgen N, Hoerauf H, et al. Distance-thresholded intercapillary area analysis versus vessel-based approaches to quantify retinal ischemia in OCTA. Transl Vis Sci Technol. (2019) 8:28. doi: 10.1167/tvst.8.4.28
46. Tabák AG, Herder C, Rathmann W, Brunner EJ, Kivimäki M. Prediabetes: a high-risk state for diabetes development. Lancet. (2012) 379:2279–90. doi: 10.1016/S0140-6736(12)60283-9
47. Nguyen TT, Wang JJ, Wong TY. Retinal vascular changes in pre-diabetes and prehypertension: new findings and their research and clinical implications. Diabetes Care. (2007) 30:2708–15. doi: 10.2337/dc07-0732
48. Santos AR, Ribeiro L, Bandello F, Lattanzio R, Egan C, Frydkjaer-Olsen U, et al. Functional and structural findings of neurodegeneration in early stages of diabetic retinopathy: cross-sectional analyses of baseline data of the EUROCONDOR project. Diabetes. (2017) 66:2503–10. doi: 10.2337/db16-1453
49. Yu DY, Cringle SJ, Su EN. Intraretinal oxygen distribution in the monkey retina and the response to systemic hyperoxia. Invest Ophthalmol Vis Sci. (2005) 46:4728–33. doi: 10.1167/iovs.05-0694
50. Conrath J, Giorgi R, Raccah D, Ridings B. Foveal avascular zone in diabetic retinopathy: quantitative vs qualitative assessment. Eye (Lond). (2005) 19:322–6. doi: 10.1038/sj.eye.6701456
51. Alipour SH, Rabbani H, Akhlaghi M, Dehnavi AM, Javanmard SH. Analysis of foveal avascular zone for grading of diabetic retinopathy severity based on curvelet transform. Graefes Arch Clin Exp Ophthalmol. (2012) 250:1607–14. doi: 10.1007/s00417-012-2093-6
52. Stana D, Potop V, Istrate SL, Eniceicu C, Mihalcea AR, Paşca IG, et al. Foveal avascular zone area measurements using OCT angiography in patients with type 2 diabetes mellitus associated with essential hypertension. Rom J Ophthalmol. (2019) 63:354–9. doi: 10.22336/rjo.2019.55
53. Kirthi V, Reed KI, Alattar K, Zuckerman BP, Bunce C, Nderitu P, et al. Multimodal testing reveals subclinical neurovascular dysfunction in prediabetes, challenging the diagnostic threshold of diabetes. Diabetes Med. (2023) 40:e14952. doi: 10.1111/dme.14952
54. Frizziero L, Midena G, Longhin E, Berton M, Torresin T, Parrozzani R, et al. Early retinal changes by OCT angiography and multifocal electroretinography in diabetes. J Clin Med. (2020) 9(11):3514. doi: 10.3390/jcm9113514
55. You Q, Freeman WR, Weinreb RN, Zangwill L, Manalastas PIC, Saunders LJ, et al. Reproducibility of vessel density measurement with optical coherence tomography angiography in eyes with and without retinopathy. Retina. (2017) 37:1475–82. doi: 10.1097/IAE.0000000000001407
56. Shen Q, Ao R, Niu YL, Xin L, Zhang YS, Liu CY, et al. Reproducibility of macular perfusion parameters in non-proliferative diabetic retinopathy patients by two different OCTA sweep modes. Int J Ophthalmology. (2022) 15:1483–7. doi: 10.18240/ijo.2022.09.11
57. Lim HB, Kim YW, Kim JM, Jo YJ, Kim JY. The importance of signal strength in quantitative assessment of retinal vessel density using optical coherence tomography angiography. Sci Rep. (2018) 8:12897. doi: 10.1038/s41598-018-31321-9
58. Tang FY, Ng DS, Lam A, Luk F, Wong R, Chan C, et al. Determinants of quantitative optical coherence tomography angiography metrics in patients with diabetes. Sci Rep. (2017) 7:2575. doi: 10.1038/s41598-017-02767-0
59. Uji A, Balasubramanian S, Lei J, Baghdasaryan E, Al-Sheikh M, Sadda SR. Impact of multiple en face image averaging on quantitative assessment from optical coherence tomography angiography images. Ophthalmology. (2017) 124:944–52. doi: 10.1016/j.ophtha.2017.02.006
60. Zahid S, Dolz-Marco R, Freund KB, Balaratnasingam C, Dansingani K, Gilani F, et al. Fractal dimensional analysis of optical coherence tomography angiography in eyes with diabetic retinopathy. Invest Ophthalmol Vis Sci. (2016) 57:4940–7. doi: 10.1167/iovs.16-19656
61. Afarid M, Mohsenipoor N, Parsaei H, Amirmoezzi Y, Ghofrani-Jahromi M, Jafari P, et al. Assessment of macular findings by OCT angiography in patients without clinical signs of diabetic retinopathy: radiomics features for early screening of diabetic retinopathy. BMC ophthalmology. (2022) 22:281. doi: 10.1186/s12886-022-02492-x
62. Kim AY, Chu Z, Shahidzadeh A, Wang RK, Puliafito CA, Kashani AH. Quantifying microvascular density and morphology in diabetic retinopathy using spectral-domain optical coherence tomography angiography. Invest Ophthalmol Visual Sci. (2016) 57:OCT362 – OCT70. doi: 10.1167/iovs.15-18904
63. Schwartz R, Khalid H, Sivaprasad S, Nicholson L, Anikina E, Sullivan P, et al. Objective evaluation of proliferative diabetic retinopathy using OCT. Ophthalmol Retina. (2020) 4:164–74. doi: 10.1016/j.oret.2019.09.004
64. Le D, Dadzie A, Son T, Lim JI, Yao X. Comparative analysis of OCT and OCT angiography characteristics in early diabetic retinopathy. Retina. (2023) 43(6):992–8. doi: 10.1097/IAE.0000000000003761
65. Kawai K, Murakami T, Mori Y, Ishihara K, Dodo Y, Terada N, et al. Clinically significant nonperfusion areas on widefield OCT angiography in diabetic retinopathy. Ophthalmol Sci. (2023) 3:100241. doi: 10.1016/j.xops.2022.100241
66. Choi KE, Yun C, Cha J, Kim SW. OCT angiography features associated with macular edema recurrence after intravitreal bevacizumab treatment in branch retinal vein occlusion. Sci Rep. (2019) 9:14153. doi: 10.1038/s41598-019-50637-8
67. Guo Y, Hormel TT, Xiong H, Wang B, Camino A, Wang J, et al. Development and validation of a deep learning algorithm for distinguishing the nonperfusion area from signal reduction artifacts on OCT angiography. BioMed Opt Express. (2019) 10:3257–68. doi: 10.1364/BOE.10.003257
68. Guo Y, Hormel TT, Gao L, You Q, Wang B, Flaxel CJ, et al. Quantification of nonperfusion area in montaged widefield OCT angiography using deep learning in diabetic retinopathy. Ophthalmol Sci. (2021) 1:100027. doi: 10.1016/j.xops.2021.100027
69. Vujosevic S, Toma C, Villani E, Brambilla M, Torti E, Leporati F, et al. Subthreshold micropulse laser in diabetic macular edema: 1-year improvement in OCT/OCT-angiography biomarkers. Transl Vis Sci Technol. (2020) 9:31. doi: 10.1167/tvst.9.10.31
70. Mané V, Dupas B, Gaudric A, Bonnin S, Pedinielli A, Bousquet E, et al. Correlation between cystoid spaces in chronic diabetic macular edema and capillary nonperfusion detected by optical coherence tomography angiography. Retina. (2016) 36 Suppl 1:S102–s10. doi: 10.1097/IAE.0000000000001289
71. Kassoff A, Goodman AD, Buehler J, Garza D, Mehu M, Locatelli J, et al. Grading diabetic retinopathy from stereoscopic color fundus photographs–an extension of the modified Airlie House classification. ETDRS report number 10. Early Treatment Diabetic Retinopathy Study Research Group. Ophthalmology. (1991) 98:786–806. doi: 10.1016/S0161-6420(13)38012-9
72. Bradley PD, Sim DA, Keane PA, Cardoso J, Agrawal R, Tufail A, et al. The evaluation of diabetic macular ischemia using optical coherence tomography angiography. Invest Ophthalmol Vis Sci. (2016) 57:626–31. doi: 10.1167/iovs.15-18034
73. Han R, Gong R, Liu W, Xu G. Optical coherence tomography angiography metrics in different stages of diabetic macular edema. Eye Vis (Lond). (2022) 9:14. doi: 10.1186/s40662-022-00286-2
74. AttaAllah HR, Mohamed AAM, Ali MA. Macular vessels density in diabetic retinopathy: quantitative assessment using optical coherence tomography angiography. Int Ophthalmol. (2019) 39:1845–59. doi: 10.1007/s10792-018-1013-0
75. Lee J, Moon BG, Cho AR, Yoon YH. Optical coherence tomography angiography of DME and its association with anti-VEGF treatment response. Ophthalmology. (2016) 123:2368–75. doi: 10.1016/j.ophtha.2016.07.010
76. Sorour OA, Sabrosa AS, Yasin Alibhai A, Arya M, Ishibazawa A, Witkin AJ, et al. Optical coherence tomography angiography analysis of macular vessel density before and after anti-VEGF therapy in eyes with diabetic retinopathy. Int Ophthalmol. (2019) 39:2361–71. doi: 10.1007/s10792-019-01076-x
77. You QS, Chan JCH, Ng ALK, Choy BKN, Shih KC, Cheung JJC, et al. Macular vessel density measured with optical coherence tomography angiography and its associations in a large population-based study. Invest Ophthalmol Vis Sci. (2019) 60:4830–7. doi: 10.1167/iovs.19-28137
78. Rodrigues TM, Marques JP, Soares M, Simão S, Melo P, Martins A, et al. Macular OCT-angiography parameters to predict the clinical stage of nonproliferative diabetic retinopathy: an exploratory analysis. Eye (Lond). (2019) 33:1240–7. doi: 10.1038/s41433-019-0401-7
79. Li Y, Choi WJ, Wei W, Song S, Zhang Q, Liu J, et al. Aging-associated changes in cerebral vasculature and blood flow as determined by quantitative optical coherence tomography angiography. Neurobiol Aging. (2018) 70:148–59. doi: 10.1016/j.neurobiolaging.2018.06.017
80. Ishibazawa A, Nagaoka T, Takahashi A, Omae T, Tani T, Sogawa K, et al. Optical coherence tomography angiography in diabetic retinopathy: A prospective pilot study. Am J Ophthalmol. (2015) 160:35–44.e1. doi: 10.1016/j.ajo.2015.04.021
81. Zen QZ, Li SY, Yao YO, Jin EZ, Qu JF, Zhao MW. Comparison of 24x20 mm2 swept-source OCTA and fluorescein angiography for the evaluation of lesions in diabetic retinopathy. Int J Ophthalmol. (2022) 15:1798–805. doi: 10.18240/ijo.2022.11.10
82. Rabb MF, Burton TC, Schatz H, Yannuzzi LA. Fluorescein angiography of the fundus: a schematic approach to interpretation. Surv Ophthalmol. (1978) 22:387–403. doi: 10.1016/0039-6257(78)90134-0
83. Kornblau IS, El-Annan JF. Adverse reactions to fluorescein angiography: A comprehensive review of the literature. Surv Ophthalmol. (2019) 64:679–93. doi: 10.1016/j.survophthal.2019.02.004
84. Cui Y, Zhu Y, Wang JC, Lu Y, Zeng R, Katz R, et al. Imaging artifacts and segmentation errors with wide-field swept-source optical coherence tomography angiography in diabetic retinopathy. Transl Vis Sci Technol. (2019) 8:18. doi: 10.1167/tvst.8.6.18
85. Yu TT, Ma D, Lo J, Ju MJ, Beg MF, Sarunic MV. Effect of optical coherence tomography and angiography sampling rate towards diabetic retinopathy severity classification. BioMed Opt Express. (2021) 12:6660–73. doi: 10.1364/BOE.431992
86. Hirano T, Hoshiyama K, Takahashi Y, Murata T. Wide-field swept-source OCT angiography (23 × 20 mm) for detecting retinal neovascularization in eyes with proliferative diabetic retinopathy. Graefes Arch Clin Exp Ophthalmol. (2023) 261:339–44. doi: 10.1007/s00417-022-05878-1
87. Mohite AA, Perais JA, McCullough P, Lois N. Retinal ischaemia in diabetic retinopathy: understanding and overcoming a therapeutic challenge. J Clin Med. (2023) 12(6):2406. doi: 10.3390/jcm12062406
88. Tsai WS, Thottarath S, Gurudas S, Pearce E, Giani A, Chong V, et al. Characterization of the structural and functional alteration in eyes with diabetic macular ischemia. Ophthalmol Retina. (2023) 7:142–52. doi: 10.1016/j.oret.2022.07.010
89. Marques IP, Kubach S, Santos T, Mendes L, Madeira MH, de Sisternes L, et al. Optical coherence tomography angiography metrics monitor severity progression of diabetic retinopathy-3-year longitudinal study. J Clin Med. (2021) 10(11):2296. doi: 10.3390/jcm10112296
90. Marques IP, Ferreira S, Santos T, Madeira MH, Santos AR, Mendes L, et al. Association between neurodegeneration and macular perfusion in the progression of diabetic retinopathy: A 3-year longitudinal study. Ophthalmologica. (2022) 245:335–41. doi: 10.1159/000522527
91. Yoon K, Park JB, Kang MS, Kim ES, Yu SY, Kim K. Peripapillary microvasculature changes after vitrectomy in epiretinal membrane via swept-source OCT angiography. BMC Ophthalmol. (2023) 23:50. doi: 10.1186/s12886-023-02793-9
92. Silva Tavares Neto JED, Cyrino FVR, Lucena MM, Scott IU, Messias AMV, Jorge R. Intravitreal bevacizumab plus propranolol for neovascular age-related macular degeneration (the BEVALOL study): a phase I clinical trial. Int J Retina Vitreous. (2023) 9:28. doi: 10.1186/s40942-023-00460-1
93. Parravano M, Scarinci F, Parisi V, Giorno P, Giannini D, Oddone F, et al. Citicoline and vitamin B(12) eye drops in type 1 diabetes: results of a 3-year pilot study evaluating morpho-functional retinal changes. Adv Ther. (2020) 37:1646–63. doi: 10.1007/s12325-020-01284-3
94. Hsieh YT, Alam MN, Le D, Hsiao CC, Yang CH, Chao DL, et al. OCT angiography biomarkers for predicting visual outcomes after ranibizumab treatment for diabetic macular edema. Ophthalmol Retina. (2019) 3:826–34. doi: 10.1016/j.oret.2019.04.027
95. Hunt M, Teper S, Wylęgała A, Wylęgała E. Response to 1-year fixed-regimen bevacizumab therapy in treatment-naïve DME patients: assessment by OCT angiography. J Diabetes Res. (2022) 2022:3547461. doi: 10.1155/2022/3547461
96. Carnota-Méndez P, Méndez-Vázquez C, Pérez-Gavela C. OCT-angiography changes in patients with diabetic macular edema treated with intravitreal dexamethasone implant. Clin Ophthalmol. (2022) 16:247–63. doi: 10.2147/OPTH.S345947
97. Korobelnik JF, Gaucher D, Baillif S, Creuzot-Garcher C, Kodjikian L, Weber M. Optical coherence tomography angiography in diabetic macular edema treated with intravitreal aflibercept: A 48-week observational study (the DOCTA study). Ophthalmologica. (2023) 246:71–80. doi: 10.1159/000528426
98. Hormel TT, Hwang TS, Bailey ST, Wilson DJ, Huang D, Jia Y. Artificial intelligence in OCT angiography. Prog Retin Eye Res. (2021) 85:100965. doi: 10.1016/j.preteyeres.2021.100965
99. Rajesh AE, Davidson OQ, Lee CS, Lee AY. Artificial intelligence and diabetic retinopathy: AI framework, prospective studies, head-to-head validation, and cost-effectiveness. Diabetes Care. (2023) 46:1728–39. doi: 10.2337/dci23-0032
100. Le D, Alam M, Yao CK, Lim JI, Hsieh YT, Chan RVP, et al. Transfer learning for automated OCTA detection of diabetic retinopathy. Transl Vis Sci Technol. (2020) 9:35. doi: 10.1167/tvst.9.2.35
101. Eladawi N, Elmogy M, Khalifa F, Ghazal M, Ghazi N, Aboelfetouh A, et al. Early diabetic retinopathy diagnosis based on local retinal blood vessel analysis in optical coherence tomography angiography (OCTA) images. Med Physics. (2018) 45:4582–99. doi: 10.1002/mp.2018.45.issue-10
102. Xu X, Yang P, Wang H, Xiao Z, Xing G, Zhang X, et al. AV-casNet: fully automatic arteriole-venule segmentation and differentiation in OCT angiography. IEEE Trans Med Imaging. (2023) 42:481–92. doi: 10.1109/TMI.2022.3214291
103. Schottenhamml J, Moult EM, Ploner SB, Chen S, Novais E, Husvogt L, et al. OCT-OCTA segmentation: combining structural and blood flow information to segment Bruch’s membrane. BioMed Opt Express. (2021) 12:84–99. doi: 10.1364/BOE.398222
104. Ryu G, Lee K, Park D, Park SH, Sagong M. A deep learning model for identifying diabetic retinopathy using optical coherence tomography angiography. Sci Rep. (2021) 11:23024. doi: 10.1038/s41598-021-02479-6
105. Mastropasqua R, Toto L, Mastropasqua A, Aloia R, De Nicola C, Mattei PA, et al. Foveal avascular zone area and parafoveal vessel density measurements in different stages of diabetic retinopathy by optical coherence tomography angiography. Int J Ophthalmol. (2017) 10:1545–51. doi: 10.18240/ijo.2017.10.11
106. Cheong KX, Lee SY, Ang M, Teo KYC. Vessel density changes on optical coherence tomography angiography after vascular endothelial growth factor inhibitor treatment for diabetic macular edema. Turk J Ophthalmol. (2020) 50:343–50. doi: 10.4274/tjo.galenos.2020.81592
107. Wang Y, Shen Y, Yuan M, Xu J, Yang B, Liu C, et al. A deep learning-based quality assessment and segmentation system with a large-scale benchmark dataset for optical coherence tomographic angiography image. Arxiv. (2021), 2107.10476. doi: 10.2139/ssrn.4073651
108. Hashmi S, Lopez J, Chiu B, Sarrafpour S, Gupta A, Young J. Fractal dimension analysis of OCTA images of diabetic retinopathy using circular mass-radius method. Ophthalmic Surg Lasers Imaging Retina. (2021) 52:116–22. doi: 10.3928/23258160-20210302-01
109. Le D, Alam M, Taeyoon S, Lim JI, Xincheng Y. Deep learning artery-vein classification in OCT angiography. Proc SPIE - Prog Biomed Optics Imaging. (2021) 11623:116231B. doi: 10.1117/12.2577304
110. Athwal A, Balaratnasingam C, Yu DY, Heisler M, Sarunic MV, Ju MJ. Optimizing 3D retinal vasculature imaging in diabetic retinopathy using registration and averaging of OCT-A. BioMed Opt Express. (2021) 12:553–70. doi: 10.1364/BOE.408590
111. Elsharkawy M, Elrazzaz M, Sharafeldeen A, Alhalabi M, Khalifa F, Soliman A, et al. The role of different retinal imaging modalities in predicting progression of diabetic retinopathy: A survey. Sensors (Basel). (2022) 22(9):3490. doi: 10.3390/s22093490
112. Lo J, Yu TT, Ma D, Zang P, Owen JP, Zhang Q, et al. Federated learning for microvasculature segmentation and diabetic retinopathy classification of OCT data. Ophthalmol Sci. (2021) 1:100069. doi: 10.1016/j.xops.2021.100069
113. Yang WH, Shao Y, Xu YW. Guidelines on clinical research evaluation of artificial intelligence in ophthalmology (2023). Int J Ophthalmol. (2023) 16:1361–72. doi: 10.18240/ijo.2023.09.02
114. Eladawi N, Elmogy M, Ghazal M, Fraiwan L, Aboelfetouh A, Riad A, et al. Diabetic retinopathy grading using 3D multi-path convolutional neural network based on fusing features from OCTA scans, demographic, and clinical biomarkers. 2019 IEEE International Conference on Imaging Systems and Techniques (IST). (2019), 1–6. doi: 10.1109/IST48021.2019
115. Vujosevic S, Limoli C, Nucci P. Novel artificial intelligence for diabetic retinopathy and diabetic macular edema: what is new in 2024? Curr Opin Ophthalmol. (2024) 35:472–9. doi: 10.1097/ICU.0000000000001084
Keywords: optical coherence tomography angiography, diabetic retinopathy, grading, lesion recognition, artificial intelligence
Citation: Zhang Q, Gong D, Huang M, Zhu Z, Yang W and Ma G (2025) Recent advances and applications of optical coherence tomography angiography in diabetic retinopathy. Front. Endocrinol. 16:1438739. doi: 10.3389/fendo.2025.1438739
Received: 26 May 2024; Accepted: 14 March 2025;
Published: 16 April 2025.
Edited by:
Mohd Imtiaz Nawaz, King Saud University, Saudi ArabiaReviewed by:
Ricardo Adrian Nugraha, Airlangga University, IndonesiaCopyright © 2025 Zhang, Gong, Huang, Zhu, Yang and Ma. This is an open-access article distributed under the terms of the Creative Commons Attribution License (CC BY). The use, distribution or reproduction in other forums is permitted, provided the original author(s) and the copyright owner(s) are credited and that the original publication in this journal is cited, in accordance with accepted academic practice. No use, distribution or reproduction is permitted which does not comply with these terms.
*Correspondence: Zhentao Zhu, anNoYXl5enp0QDE2My5jb20=; Weihua Yang, YmVuYmVuMDYwNkAxMzkuY29t; Gaoen Ma, MTU3NTc4MjY2MTFAMTYzLmNvbQ==
†These authors have contributed equally to this work and share first authorship
Disclaimer: All claims expressed in this article are solely those of the authors and do not necessarily represent those of their affiliated organizations, or those of the publisher, the editors and the reviewers. Any product that may be evaluated in this article or claim that may be made by its manufacturer is not guaranteed or endorsed by the publisher.
Research integrity at Frontiers
Learn more about the work of our research integrity team to safeguard the quality of each article we publish.