 Aristeidis Giannakopoulos
 Alexandra Efthymiadou
 Dionisios Chrysis
- Division of Pediatric Endocrinology, Department of Pediatrics, Medical School of Patras, University Hospital, Patras, Greece
Objective: Subclinical hypothyroidism (SH) is biochemically defined by increased TSH and normal thyroid hormones, and its management is a matter of debate. Herein, we investigated thyroid function in euthyroid and children with SH using a structure parameter inference approach (SPINA) model along with published data from population-based TSH-FT4 curves.
Design: The study included 183 children and adolescents with SH and 313 healthy controls. The predicted and actual secretory capacity of thyroid gland (SPINA-GT) was calculated in all euthyroid children divided into quartiles according to TSH values, and in children with SH, which were further subcategorized into those with mild SH (TSH: 4.5 – 10 mIU/L) and severe SH (TSH > 10 mIU/L).
Results: Actual SPINA-GT values decreased significantly from the 1st to the 2nd quartile of normal TSH values in euthyroid children (p< 0.001). It was also significantly decreased in mild SH compared to the upper 2 TSH quartiles of euthyroid range, and in severe SH compared to mild SH. Actual SPINA-GT values were significantly decreased from predicted SPINA-GT values in the upper 2 quartiles of TSH in euthyroid children and in children with mild and severe SH. Thyroid antibody positivity was statistically higher in the SH group (11.3%) compared to the euthyroid group (6.4%).
Conclusion: The implementation of SPINA model for thyroid function gives a wider perspective of thyroid gland’s performance within the euthyroid range of TSH, as well as in SH and add to the discussion for the nature of SH, and the necessity of its management.
Introduction
In current pediatric clinical practice, the diagnosis and management of typical thyroidopathies such as overt hypo- or hyperthyroidism is an unambiguous task, thanks to the presence of sensitive assays for serum TSH and FT4 concentrations. However, a state of a mild thyroid derangement that is often encountered in pediatrics, called subclinical hypothyroidism (SH), is defined by serum TSH level above the upper limit of the reference range (TSH >4.5 mIU/L) in the context of normal serum concentrations of total thyroxine (T4) or free T4 (FT4) (1, 2). After the neonatal period, SH is further subcategorized by serum TSH levels, in a mild (TSH 4.5 to 10 mIU/L) or a severe form (TSH > 10 mIU/L) (1). While progression to overt hypothyroidism is possible, more commonly, stable persistence or even spontaneous normalization of the elevated TSH is observed during follow up (3). Diagnosis of SH is usually not based on specific clinical signs or symptoms but rather emerges as an incidental finding in a laboratory workup. Furthermore, the management of SH that may include either initiation of treatment with thyroxine or simple monitoring of the thyroid function, is still a matter of debate (4).
The normal range of serum TSH levels in children and adolescents is well defined and displays a skewed distribution (5). Serum concentrations of TSH and T4 (or FT4) are tightly regulated by the thyroid homeostatic mechanisms in a way that minor changes in circulating FT4 concentration result in large relative changes of TSH (6). Several studies had initially described the TSH - FT4 relationship as an inverse log linear one (7–9) although later population-based studies described the TSH - FT4 correlation by 2 overlapping negative sigmoid curves with some variations attributed to age and sex differences (10). The study of hypothalamo-pituitary –thyroid physiology over the years demonstrated the existence of the so-called set-point of thyroid function, which reflects the individual characteristics of both thyroid gland response to TSH stimulation, and feedback loop of thyroid hormones to hypothalamus and pituitary. This was based on evidence showing that individual reference ranges for serum T3 and T4 displayed half the width of population-based reference ranges (11). Consequently, the intraindividual variability of TSH and FT4 was much narrower than the interindividual one. Later studies supported that thyroid set points are in some degree genetically determined (12–14) and aging may lead to their transposition (15, 16). Recent work by Fitzgerald et al. shows that feedback regulation of TSH and FT4 is much more complex than inferred by the published FT4 and TSH curves and provides evidence that pituitary sensitivity to FT4 and thyroid sensitivity to TSH are linked, resulting in individualized response combination curves (17).
Based on the critical effect of thyroid hormones on brain development and metabolic homeostasis, the yet unanswered questions of SH in childhood regards the probability of any long-term adverse effects on central nervus system development mainly during infancy (18–20), or on the healthiness of cardiovascular system at older ages (21–24). The contradictory results of studies that have addressed these questions sustain the uncertainties on this matter.
To investigate more in depth the nature of SH in children, we studied the thyroid function of both euthyroid and children with SH by implementing a previously published multiparametric model which follows a structure parameter inference approach (SPINA) that includes the pituitary – thyroid feedback control (25). Our aim is to consider the hidden physiological parameters that govern the thyroid function in the euthyroid range of TSH values as well as in SH. Data from a large population-based analytical model that describe the TSH - FT4 relationship in both euthyroid and children with SH was used as reference for the results of our population study (10, 26). More specifically, we calculated the TSH values (henceforth referred to as predicted TSH) of all subjects using the equations developed by population -based TSH – FT4 data (10). Then, we calculated the thyroid production capacity using the SPINA model (25, 27). This latter model has evolved step-wisely over the years, from the standard logarithmic model of thyroid homeostasis (28), to more detailed multi-dimensional and non-linear relationships between TSH, FT4, T3 and their binding proteins (27, 29, 30). Descriptively, this platform includes the Michaelis–Menten kinetics for the deiodination of T4 with a time-delay model (thyroid), a negative exponential model for feedback inhibition of TSH release, and a non-linear description of plasma protein binding (31, 32). The thyroid’s secretory capacity (SPINA-GT), also referred to as thyroid output or thyroid capacity, provides an estimate for the maximum secretion rate of thyroid hormone under stimulated conditions (25). The development of SPINA-GT model was promoted by a long-standing reflection on the non-improvement of hypothyroid symptoms in a fraction of patients that were under treatment with levothyroxine and, nonetheless, biochemically euthyroid (33, 34). The SPINA parameters have been validated in several studies in different populations with more than 10,000 subjects (35, 36). To the best of our knowledge, no studies have been published regarding SPINA implementation for thyroid function in children. Finally, we tried to interpret the results of classical thyroid analysis under the prism of multivariate modeling.
Methods
This is a retrospective study that included 183 children and adolescents of Greek origin with SH with age 7.25 years (median) (range: 1 – 14.9 years) and 313 healthy children with age 8.5 years (median) (range: 1.3 – 16.7 years). SH was defined as serum TSH > 4.5 µIU/L (min = 4.51 and max = 15) with FT4 levels within normal range (min = 10.43 pmol/L and max = 24.5 pmol/L). The euthyroid group consisted of children and adolescents who presented to our department due to parental concern for short stature or for thyroid evaluation due to positive family history for thyroid disease. Subjects with known chronic disease, specific or non-specific clinical symptomatology or receiving any medication were excluded from the study. The study was approved by the local Ethical Committee of the University Hospital of Patras, Greece. Written informed consent for participation in this study was provided by the patient’s’ parents. All our subjects were considered as iodine sufficient, since Greece belongs to the group of countries with adequate iodine nutrition (37). Date of birth, family history of thyroid disorders and any acute or chronic disease were recorded. Body, height, and weight were measured using standard anthropometric techniques. BMI was calculated using the formula weight/height ^ 2 (kg/m2). BMI standard deviations score (SDS) was computed for each subject using the formula: BMI-SDS = (actual BMI-mean BMI for age, race and gender)/BMI SD for age and gender.
Serum TSH, FT4, Thyroglobulin (TG-Ab) and thyroid peroxidase (TPO-Ab) antibodies were measured by electro-chemiluminescence (Elecsys 2010, Roche Diagnostics). Anti-thyroid antibody status was considered positive when TG-Ab and/or TPO-Ab was positive (>34 IU/mL).
The relationship between the natural logarithm of TSH and free T4 in subjects > 1 year old, not receiving thyroxine treatment, were described by the following equations (10):
Predicted lnTSH was calculated using the above formulas, and results were back log-transformed to predicted TSH.
The thyroid’s secretory capacity (SPINA-GT) was defined by the formula:
(αT: Dilution factor for thyroxine = 0.1 L-1 βT: Clearance exponent for T4 = 1.1e-6 s-1 DT: Damping constant (EC50) of TSH set to 2.75 mIU/L according to experimental data previously reported (ref) K41: Dissociation constant of T4 at thyroxine-binding globulin = 2e10L/mol K42: Dissociation constant of T4 at transthyretin = 2e8 L/mol. The dissociation constants depend on the thyroid secretion rate and provide a distinct TSH for any given FT4 level as a function of thyroid secretory capacity. [TBG]: standard concentration of thyroxine-binding globulin = 300nmol/L [TBPA]: Standard transthyretin concentration = 4.5 μmol/L) as a function of equilibrium concentrations of TSH, free T4, and constants or measured values for dissociation, protein binding, distribution, and elimination (25). The reference range of SPINA-GT is between 1.4 and 8.7 pmol/s (38).
Statistics
Normally distributed parametric data were presented as mean ± SD and were compared with the two-sided Student’s t-test. Statistical comparison of SPINA-GT among groups defined by different TSH values was performed with analysis of variance (ANOVA) with Tukey’s post-hoc test and reported adjusted P values. Statistical analysis of thyroid antibody positivity between groups was performed by Pearson’s chi-squared test. A p value of <0.05 was considered statistically significant in all instances. For the analysis, Stata (version 16) was used.
Results
All 496 subjects (Male/Female: 229/267) had a median age of 8.17 year (range 1.1 to 16.75 years old). The SH group (n=183) was of younger age than the euthyroid group (n=313) (7.46 vs 8.6 years, p<0.05). BMI SDS was not statistically different between the 2 groups (Table 1). Analysis of thyroid function in both groups using serum TSH and FT4 measurements showed higher TSH (p<0.001) and lower FT4 serum levels in SH group (p<0.05) as expected. Thyroid antibody positivity was statistically higher (11.3%) in the SH group (n=22/183) compared to the euthyroid group (6.4%) (n=20/313) (Table 1).
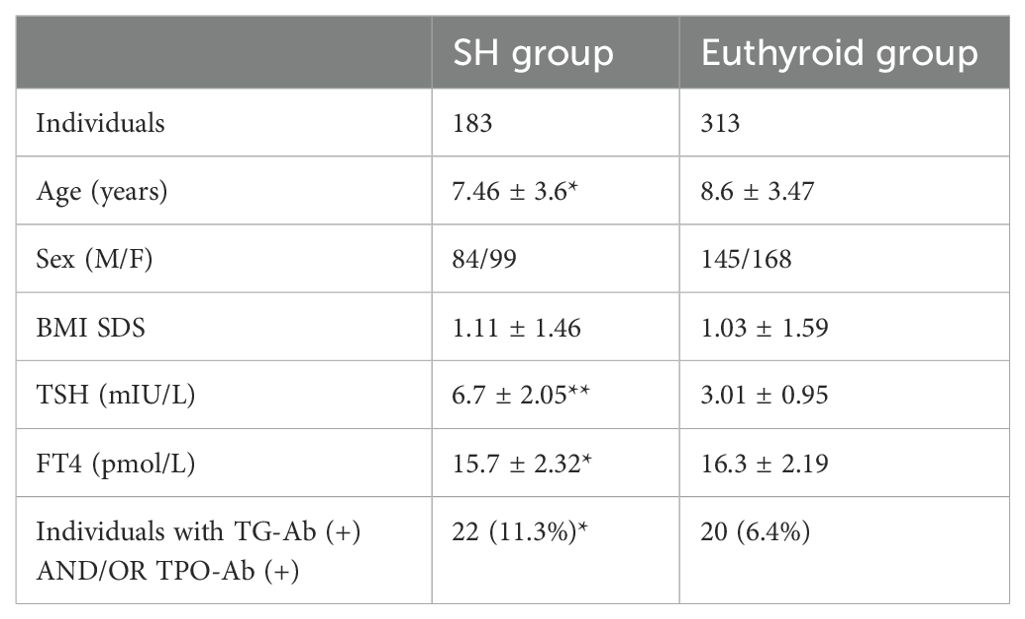
Table 1. Demographics, BMI, and biochemical indices of thyroid function in children with SH and euthyroid children (Statistical significance denoted with asterisks: **p<0.001 *p<0.05).
Firstly, we used the Equations 1, 2 (see methods section) that derived from the population curves of TSH and FT4 relationship (10) to produce the set of predicted TSH values that correspond to the FT4 values of our subjects belonging to either euthyroid or SH group. With this approach we tried to estimate the dispersion of TSH values around the model-predicted ones for the SH group, compared to the euthyroid group. The measured TSH values against the predicted ones were plotted for both euthyroid and SH group in Figure 1 (a and b respectively). Actual TSH values were dispersed around the curve of predicted TSH values within the entire euthyroid range, whereas the actual TSH values of children with SH were all above the predicted TSH curve. We then implemented the SPINA-GT formula on all children (euthyroid and SH group), using the actual univariate TSH - FT4 paired values for each subject, and the plots of SPINA-GT values in relation to the measured TSH (Figure 1c) or FT4 (Figure 1d). SPINA-GT values in correlation to the TSH values of the entire range (euthyroid and SH) formed an L- shaped scatterplot that showed a steep decrease within the lower range of TSH values, followed by a gradual decrease of GT towards the higher TSH values (Figure 1c). Additionally, SPINA-GT values were significantly correlated to FT4 levels (r=0.523, p<0.001) (Figure 1d). Subsequently, we analyzed the SPINA-GT levels in euthyroid children divided into 4 groups defined by TSH quartiles and in children with mild and severe SH. Table 2 shows the SPINA-GT median and mean values in each TSH quartile delimited by a min and a max TSH value. We found that within the euthyroid range of TSH values, actual SPINA-GT was significantly lower in the 2nd quartile compared to the 1st quartile (p<0.001) while the lower values of actual SPINA-GT seen in the 3rd and 4th TSH quartiles were not statistically different compared to the 2nd quartile (Figure 2a). Children with SH showed significantly lower actual SPINA-GT levels compared to the actual SPINA-GT levels of upper 2 TSH quartiles in the euthyroid group (p <0.001). Respectively, the group with severe SH had significantly lower levels than children with mild SH (p<0.001) (Figure 2b).
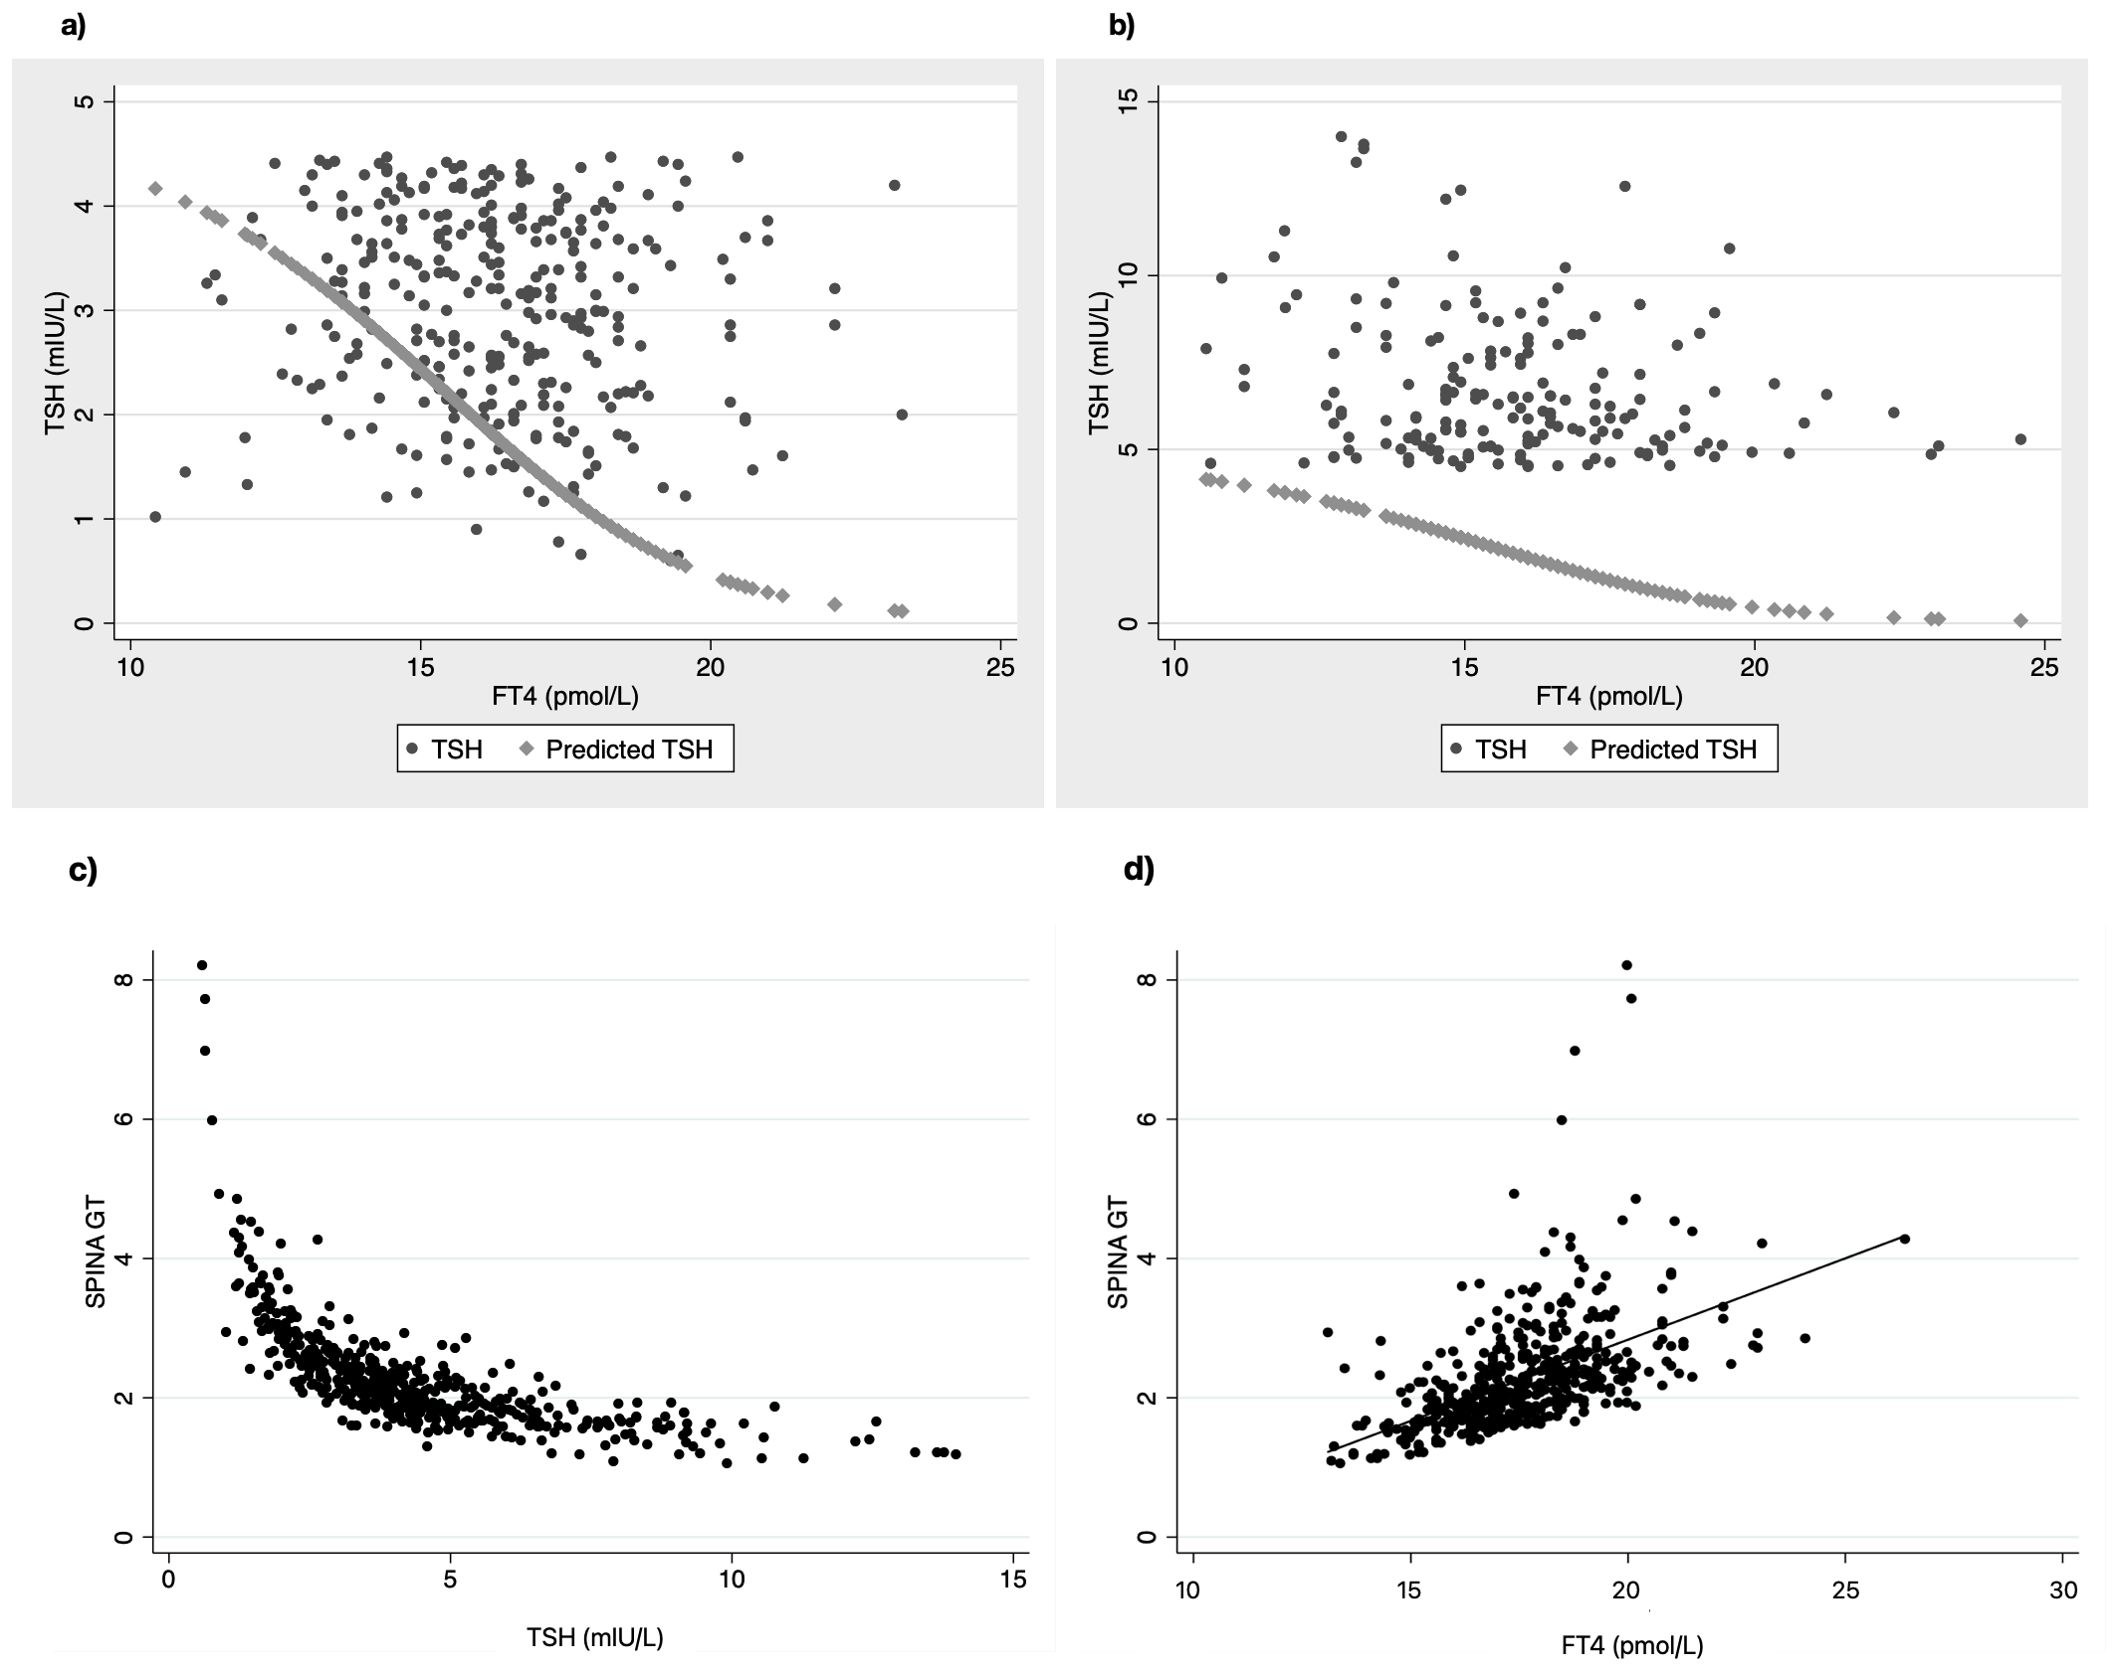
Figure 1. Scatterplots of actual TSH values dispersed around the line of predicted TSH in relation to FT4 values in (a) euthyroid children and (b) children with SH. Correlation of SPINA-GT to TSH (c) and FT4 (d) in all children (euthyroid and SH group).
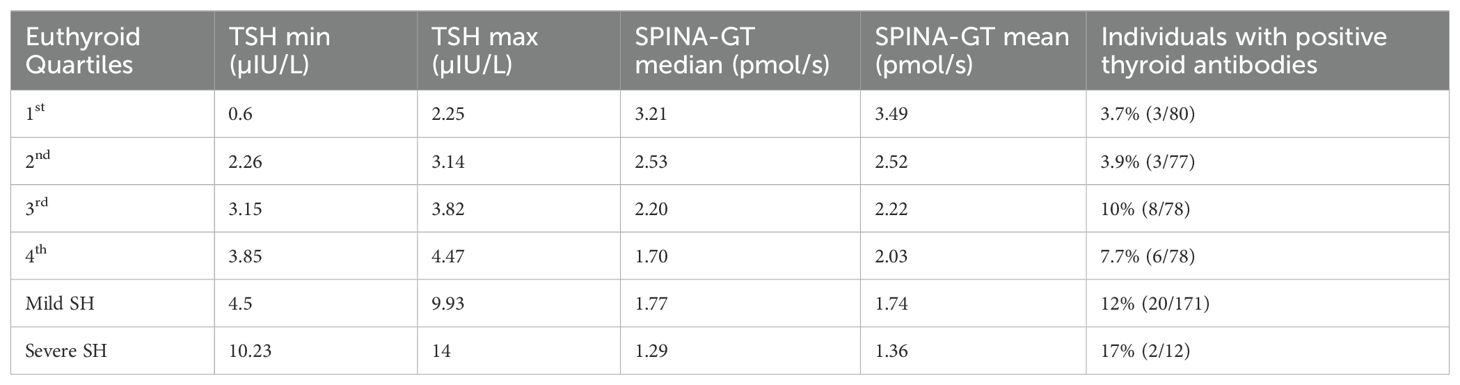
Table 2. TSH values (min and max) in euthyroid (by quartiles) and children with SH and their corresponding SPINA-GT value (median and mean) along with the frequency of thyroid antibody positivity.
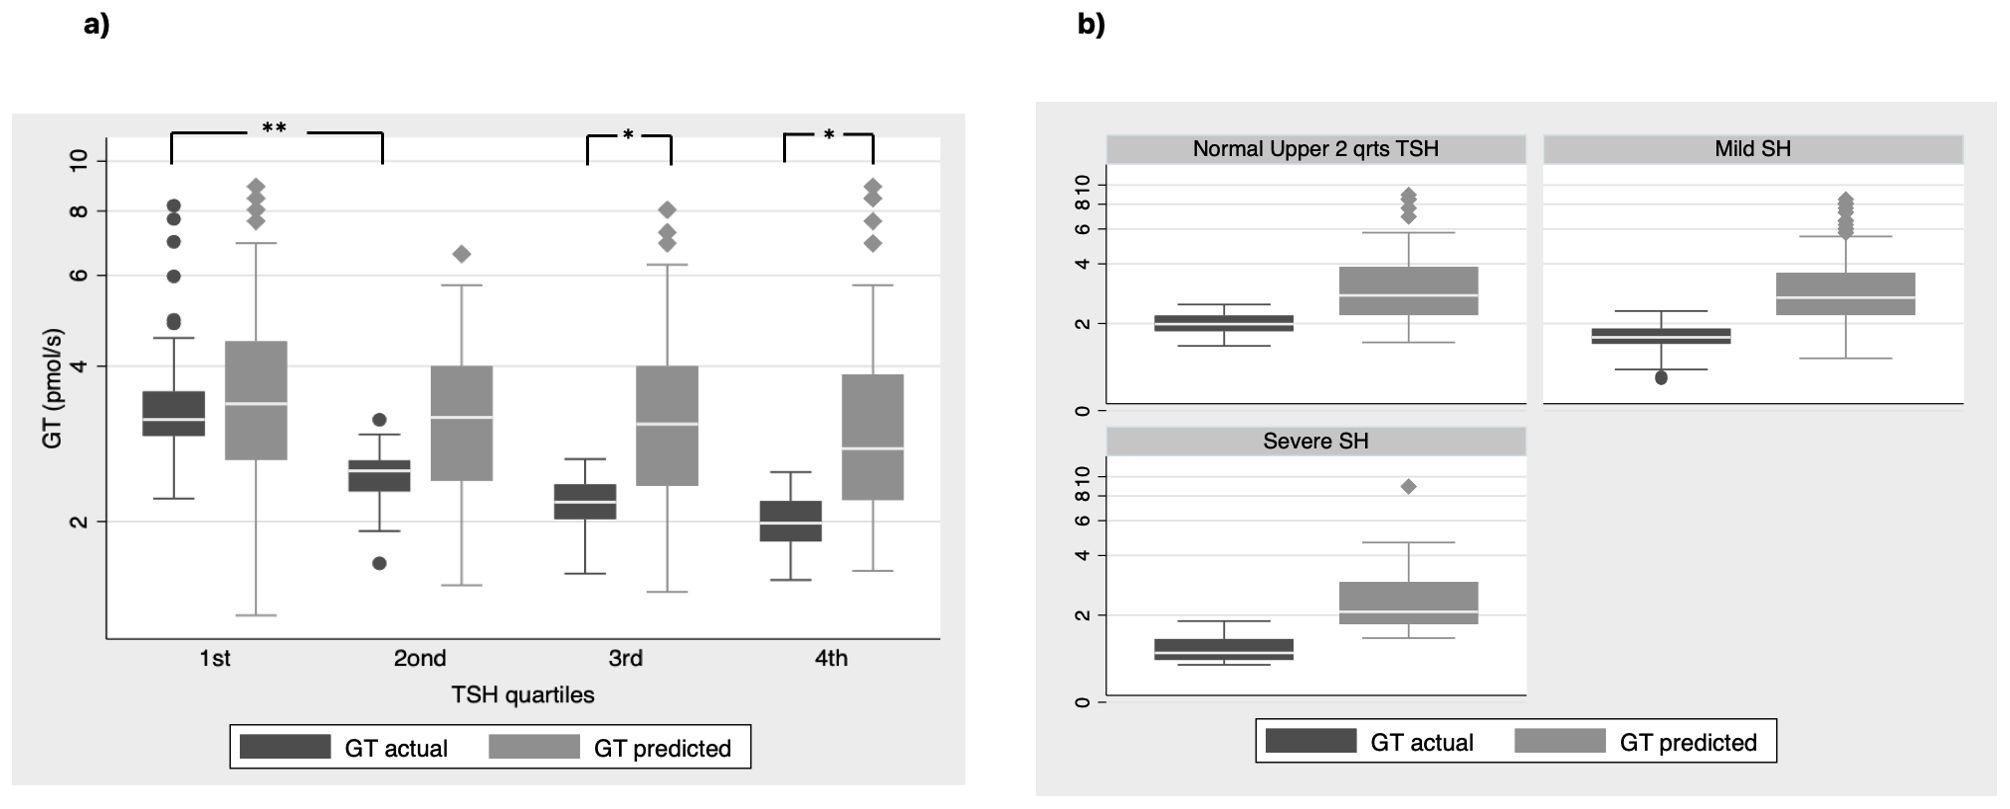
Figure 2. SPINA GT actual vs predicted values (a) in all euthyroid children divided in groups by quartiles of TSH values and (b) in children with normal TSH in the upper 2 quartiles and children with mild and severe SH (**P < 0.001, *P<0.01).
Next, we compared the previously reported SPINA-GT levels (referred also as actual SPINA-GT levels) to the predicted SPINA-GT levels (calculated from the predicted TSH using the Equations 1, 2 described in methods) in both euthyroid and SH groups. We observed that in euthyroid children, predicted SPINA-GT levels were significant higher only in the 3rd and 4th TSH quartiles (p<0.001). (Figure 2a). In the SH group predicted SPINA-GT levels were significantly higher in both mild and severe SH compared to the actual SPINA-GT levels. (Figure 2b) Regarding thyroid antibody positivity, individuals with SH show significantly increased positivity in thyroid antibodies compared to the euthyroid TSH range (p<0.05). (Table 2)
Discussion
Subclinical hypothyroidism in children, a biochemically defined condition with no clinical symptomatology, is a puzzling entity regarding its biological significance and its management. The debate on simple monitoring or treatment with levothyroxine in SH originates mainly from data on probable long-term implications on neurodevelopment when diagnosed in very young age, given the effect of thyroid hormones on postnatal brain development (39). The worse neurocognitive outcome found in school-age children, who had TSH values from 99.5th and 99.9th percentiles at neonatal screening in a large population study (40), argues in favor of treating SH in the very young ages. However, this finding is not ubiquitously supported by other smaller studies (20, 41). In cardio-metabolic health, higher lipid levels and more specifically non-HDL C, triglycerides and total cholesterol have been found to be significantly higher in SH by many studies (21, 23, 24, 42). On the contrary, blood pressure (43, 44) and glucose metabolism (21, 42) have not shown any consistent correlation with the increase of TSH in the pediatric population.
The first observation of our study was the large dispersion of TSH values around the fit line of predicted TSH values in euthyroid children. This is in accordance with the concept of increased variability of thyroid set points within the euthyroid state, that is every individual has his own homeostatic relationship between TSH and FT4. The pituitary – thyroid setpoint has strong genetic determinants but its physiology is poorly understood (45, 46). On the contrary, all children with SH had TSH values within the area above the fit line of the predicted TSH (Figures 1a, b) which is expected, because SH is defined by TSH values > 4.5 IU/ml.
Next, we investigated the thyroid capacity across the entire euthyroid range of TSH and SH by applying the multiparametric model to our data. For this we used the SPINA-GT model, the in vivo evaluation of which has proven in adults, that it can clearly differentiate between the primary thyroid disorders and euthyroidism (30). First, the significant drop of SPINA-GT values between the 1st and 2nd TSH quartile of euthyroid range (Figure 1c, 2a) supports the different thyroid hormone output within the euthyroid range, that is not detected by the classical univariate analysis. This part of thyroid physiology can only be thoroughly evaluated by adding to the secretion dynamics, the sum activity of peripheral deiodinases, the enzymes that regulate the peripheral action of thyroid hormones. For example, a parallel increase of type 2 deiodinase activity at the tissue level could compensate for the lower central thyroid production of FT4. This is only partly reflected by the circulating T3 concentrations, since other cellular factors that regulate T3 transport across cell membrane affect the plasma T3 in relation to the intracellular T3 concentration. The latter effect can be estimated by the SPINA-GD model that includes T3 as a variable (25). This is a limitation of our study since we did not have T3 measurements in our subjects, which may be attenuated because FT4, as a factor that takes part in the homeostasis of both secretion and deiodination, reliably reflects the connection between thyroid production and feedback and has demonstrated a stronger correlation to TSH than T3 (47, 48). Second, significant differences between actual and predicted SPINA-GT in euthyroid range are seen only in the 3rd and 4th TSH quartile. The lower thyroid hormone output capacity (actual SPINA-GT) in comparison to the predicted one (SPINA-GT) within the upper 2 TSH quartiles of euthyroid range could append the conversation of the current TSH upper reference limits in children and probably support a further skewness to the left distribution of TSH values. Such an argument has been previously proposed by a study that supports that TSH reference distribution may be skewed by an occult thyroid dysfunction based on increased thyroid antibodies found in the adolescent group (12-19yr) when they presented with TSH values > 2.5 mIU/L (49). In our study, we found an increased percentage of positive thyroid antibodies in the 3rd and 4th TSH quartile which were similar to the percentage in SH (Table 2). This may imply the existence of occult thyroid disease in a small group of individuals even in the euthyroid range of TSH values. In clinical practice, this means that single TSH and FT4 values within the upper normal range, do not necessarily reflect normal thyroid function for a specific individual and thus the usefulness of population-based reference range in the identification of a disease state is limited (7). A repeated, within a few months’ time, TSH – FT4 measurement may help identifying a derangement in thyroid function, given that the expected intraindividual variation of TSH is 50% of the interindividual one (11) and the analytical bias of thyroid hormones is common (50).
Focusing on the SH, our results showed that both in mild and severe SH, the actual SPINA GT values were significantly lower than the predicted ones (Figure 2b) supporting the lower thyroid capacity in the SH range. The recent development of thyroid function models has proposed a new level of regulation that include the effect of hormones as trophic factors for their downstream glands. In this context, TSH acts as a growth factor for the thyroid gland and thyroid hormones act as inhibiting factors for the pituitary gland (51). This explains the so-called hysteresis phenomenon in which TSH takes many weeks to normalize after thyroid hormones have returned within the normal range when treatment is started for hypo- or hyperthyroidism (52). Increases in thyroid gland-mass comprise a basic component of a slow adaptation, which may restore the previous thyroid set point value through an increased thyroid hormonal production. The chronic persistence or the gradually increased TSH may indicate either the inadequacy of grand-mass compensation effect or the emergence of an intrathyroidal pathology that with finally render the subclinical state into clinical disease. This hypothesis could raise questions about the role of therapy with thyroxine in the case of SH, since exogenous T4 administration would prevent this kind of reaction by suppressing TSH levels. However, there is evidence of a much higher complexity that governs the thyroid – pituitary feedback that involves linked sensitivities to TSH and FT4 respectively that result to particular combinations of TSH-FT4 curves (17). In a clinical setting though, apart from the requirement for specialized software to perform these calculations, it of prime importance any symptoms referred by the patient that may suggest a thyroid dysfunction, as well as the family history.
A main limitation is that some parameters of the model and especially the dissociation constants have been calculated from TSH-FT4 pair data from adults which would question the validity of extrapolating in the pediatric population. However different constants would be expected to affect more the regrouping of individuals (euthyroid or SH) rather than the intragroup comparisons (SH vs non-SH group). Because this model was implemented for the first time in a pediatric cohort, it is important to mention that the constants TBG and TBPA, used in the model’s equation have the same values in children (53, 54). In each case, data origination and model implementation on pediatric populations are essential for evaluating the above results.
Conclusions
The implementation of multivariate models such as SPINA-GT for thyroid function gives us a wider perspective of thyroid’s functional status within the euthyroid range of TSH, as well as in the state of SH. In addition, it provides more information for the interpretation of the classical univariate thyroid analysis showing that the maximum secretory capacity of the thyroid gland calculated by SPINA is decreased not only in SH, but even within the euthyroid range of TSH. The above changes in thyroid function need to be confirmed by further studies and introduce further questions regarding their nature in development, their meaning for its long-term effects on health and the role of the potential therapy.
Data availability statement
The raw data supporting the conclusions of this article will be made available by the authors, without undue reservation.
Ethics statement
The studies involving humans were approved by Ethics Commitee-University Hospital of Patras. The studies were conducted in accordance with the local legislation and institutional requirements. Written informed consent for participation in this study was provided by the participants’ legal guardians/next of kin.
Author contributions
AG: Conceptualization, Writing – review & editing, Writing – original draft, Validation, Resources, Methodology, Investigation, Formal Analysis, Data curation. AE: Writing – review & editing, Data curation. DK: Writing – review & editing. DC: Writing – review & editing, Methodology, Conceptualization.
Funding
The author(s) declare that no financial support was received for the research and/or publication of this article.
Conflict of interest
The authors declare that the research was conducted in the absence of any commercial or financial relationships that could be construed as a potential conflict of interest.
Publisher’s note
All claims expressed in this article are solely those of the authors and do not necessarily represent those of their affiliated organizations, or those of the publisher, the editors and the reviewers. Any product that may be evaluated in this article, or claim that may be made by its manufacturer, is not guaranteed or endorsed by the publisher.
References
1. Biondi B, Cappola AR, Cooper DS. Subclinical hypothyroidism. Jama. (2019) 322:153–60. doi: 10.1001/jama.2019.9052
2. Biondi B, Cooper DS. The clinical significance of subclinical thyroid dysfunction. Endocrine Rev. (2008) 29:76–131. doi: 10.1210/er.2006-0043
3. Karmisholt J, Andersen S, Laurberg P. Interval between tests and thyroxine estimation method influence outcome of monitoring of subclinical hypothyroidism. J Clin Endocrinol Metab. (2008) 93:1634–40. doi: 10.1210/jc.2008-0101
4. Salerno M, Improda N, Capalbo D. MANAGEMENT OF ENDOCRINE DISEASE Subclinical hypothyroidism in children. Eur J Endocrinol. (2020) 183:R13–28. doi: 10.1530/eje-20-0051
5. Lewandowski K. Reference ranges for TSH and thyroid hormones. Thyroid Res. (2015) 8:A17. doi: 10.1186/1756-6614-8-s1-a17
6. Wehmann RE, Nisula BC. Radioimmunoassay of human thyrotropin: analytical and clinical developments. Crc Cr Rev Cl Lab Sc. (1984) 20:243–83. doi: 10.3109/10408368409165776
7. Benhadi N, Fliers E, Visser TJ, Reitsma JB, Wiersinga WM. Pilot study on the assessment of the setpoint of the hypothalamus–pituitary–thyroid axis in healthy volunteers. Eur J Endocrinol. (2010) 162:323–9. doi: 10.1530/eje-09-0655
8. Meier CA, Maisey MN, Lowry A, Müller J, Smith MA. Interindividual differences in the pituitary-thyroid axis influence the interpretation of thyroid function tests. Clin Endocrinol. (1993) 39:101–7. doi: 10.1111/j.1365-2265.1993.tb01758.x
9. Spencer CA, LoPresti JS, Patel A, Guttler RB, Eigen A, Shen D, et al. Applications of a new chemiluminometric thyrotropin assay to subnormal measurement*. J Clin Endocrinol Metab. (1990) 70:453–60. doi: 10.1210/jcem-70-2-453
10. Hadlow NC, Rothacker KM, Wardrop R, Brown SJ, Lim EM, Walsh JP. The relationship between TSH and free T4 in a large population is complex and nonlinear and differs by age and sex. J Clin Endocrinol Metab. (2013) 98:2936–43. doi: 10.1210/jc.2012-4223
11. Andersen S, Pedersen KM, Bruun NH, Laurberg P. Narrow individual variations in serum T 4 and T 3 in normal subjects: A clue to the understanding of subclinical thyroid disease. J Clin Endocrinol Metab. (2002) 87:1068–72. doi: 10.1210/jcem.87.3.8165
12. Panicker V, Wilson SG, Walsh JP, Richards JB, Brown SJ, Beilby JP, et al. A locus on chromosome 1p36 is associated with thyrotropin and thyroid function as identified by genome-wide association study. Am J Hum Genet. (2010) 87:430–5. doi: 10.1016/j.ajhg.2010.08.005
13. Walsh JP. Setpoints and susceptibility: do small differences in thyroid function really matter?*. Clin Endocrinol. (2011) 75:158–9. doi: 10.1111/j.1365-2265.2011.04036.x
14. Teumer A, Chaker L, Groeneweg S, Li Y, Munno CD, Barbieri C, et al. Genome-wide analyses identify a role for SLC17A4 and AADAT in thyroid hormone regulation. Nat Commun. (2018) 9:4455. doi: 10.1038/s41467-018-06356-1
15. Boucai L, Surks MI. Reference limits of serum TSH and free T4 are significantly influenced by race and age in an urban outpatient medical practice. Clin Endocrinol. (2009) 70:788–93. doi: 10.1111/j.1365-2265.2008.03390.x
16. Bremner AP, Feddema P, Leedman PJ, Brown SJ, Beilby JP, Lim EM, et al. Age-related changes in thyroid function: A longitudinal study of a community-based cohort. J Clin Endocrinol Metab. (2012) 97:1554–62. doi: 10.1210/jc.2011-3020
17. Fitzgerald SP, Bean NG, Falhammar H, Hoermann R. Physiological linkage of thyroid and pituitary sensitivities. Endocrine. (2023) 79:143–51. doi: 10.1007/s12020-022-03184-8
18. Williams GR. Neurodevelopmental and neurophysiological actions of thyroid hormone. J Neuroendocrinol. (2008) 20:784–94. doi: 10.1111/j.1365-2826.2008.01733.x
19. Capalbo D, Alfano S, Polizzi M, Mase RD, Improda N, Esposito A, et al. Cognitive function in children with idiopathic subclinical hypothyroidism: effects of 2 years of levothyroxine therapy. J Clin Endocrinol Metab. (2020) 105:e774–81. doi: 10.1210/clinem/dgaa046
20. Cerbone M, Bravaccio C, Capalbo D, Polizzi M, Wasniewska M, Cioffi D, et al. Linear growth and intellectual outcome in children with long-term idiopathic subclinical hypothyroidism. Eur J Endocrinol. (2011) 164:591–7. doi: 10.1530/eje-10-0979
21. Cerbone M, Capalbo D, Wasniewska M, Raso GM, Alfano S, Meli R, et al. Cardiovascular risk factors in children with long-standing untreated idiopathic subclinical hypothyroidism. J Clin Endocrinol Metab. (2014) 99:2697–703. doi: 10.1210/jc.2014-1761
22. Cerbone M, Capalbo D, Wasniewska M, Alfano S, Raso GM, Oliviero U, et al. Effects of L-thyroxine treatment on early markers of atherosclerotic disease in children with subclinical hypothyroidism. Eur J Endocrinol. (2016) 175:11–9. doi: 10.1530/eje-15-0833
23. Dahl AR, Iqbal AM, Lteif AN, Pittock ST, Tebben PJ, Kumar S. Mild subclinical hypothyroidism is associated with paediatric dyslipidaemia. Clin Endocrinol. (2018) 89:330–5. doi: 10.1111/cen.13752
24. Nader NS, Bahn RS, Johnson MD, Weaver AL, Singh R, Kumar S. Relationships between thyroid function and lipid status or insulin resistance in a pediatric population. Thyroid. (2010) 20:1333–9. doi: 10.1089/thy.2010.0180
25. Dietrich JW, Landgrafe-Mende G, Wiora E, Chatzitomaris A, Klein HH, Midgley JEM, et al. Calculated parameters of thyroid homeostasis: emerging tools for differential diagnosis and clinical research. Front Endocrinol. (2016) 7:57. doi: 10.3389/fendo.2016.00057
26. Fitzgerald SP, Bean NG. The relationship between population T4/TSH set point data and T4/TSH physiology. J Thyroid Res. (2016) 2016:6351473. doi: 10.1155/2016/6351473
27. Hoermann R, Midgley JEM, Larisch R, Dietrich JW. Homeostatic control of the thyroid–pituitary axis: perspectives for diagnosis and treatment. Front Endocrinol. (2015) 6:177. doi: 10.3389/fendo.2015.00177
28. Reichlin S, Utiger RD. Regulation of the pituitary-thyroid axis in man: relationship of TSH concentration to concentration of free and total thyroxine in plasma. J Clin Endocrinol Metab. (1967) 27:251–5. doi: 10.1210/jcem-27-2-251
29. Hoermann R, Midgley JEM, Giacobino A, Eckl WA, Wahl HG, Dietrich JW, et al. Homeostatic equilibria between free thyroid hormones and pituitary thyrotropin are modulated by various influences including age, body mass index and treatment. Clin Endocrinol. (2014) 81:907–15. doi: 10.1111/cen.12527
30. Hoermann R, Larisch R, Dietrich JW, Midgley JEM. Derivation of a multivariate reference range for pituitary thyrotropin and thyroid hormones: diagnostic efficiency compared with conventional single-reference method. Eur J Endocrinol. (2016) 174:735–43. doi: 10.1530/eje-16-0031
31. Eisenberg M, Samuels M, DiStefano JJ. Extensions, validation, and clinical applications of a feedback control system simulator of the hypothalamo-pituitary-thyroid axis. Thyroid. (2008) 18:1071–85. doi: 10.1089/thy.2007.0388
32. Ben-Shachar R, Eisenberg M, Huang SA, DiStefano JJ. Simulation of post-thyroidectomy treatment alternatives for triiodothyronine or thyroxine replacement in pediatric thyroid cancer patients. Thyroid. (2012) 22:595–603. doi: 10.1089/thy.2011.0355
33. Abdalla SM, Bianco AC. Defending plasma T3 is a biological priority. Clin Endocrinol. (2014) 81:633–41. doi: 10.1111/cen.12538
34. Wiersinga WM. Paradigm shifts in thyroid hormone replacement therapies for hypothyroidism. Nat Rev Endocrinol. (2014) 10:164–74. doi: 10.1038/nrendo.2013.258
35. Dietrich JW, Stachon A, Antic B, Klein HH, Hering S. The AQUA-FONTIS study: protocol of a multidisciplinary, cross-sectional and prospective longitudinal study for developing standardized diagnostics and classification of non-thyroidal illness syndrome. BMC Endocr Disord. (2008) 8:13. doi: 10.1186/1472-6823-8-13
36. Hoermann R, Midgley JEM, Larisch R, Dietrich JW. Is pituitary TSH an adequate measure of thyroid hormone-controlled homoeostasis during thyroxine treatment? Eur J Endocrinol. (2013) 168:271–80. doi: 10.1530/eje-12-0819
37. Zimmermann MB, Andersson M. GLOBAL ENDOCRINOLOGY: Global perspectives in endocrinology: coverage of iodized salt programs and iodine status in 2020. Eur J Endocrinol. (2021) 185:R13–21. doi: 10.1530/eje-21-0171
38. Dietrich JW, Müller P, Schiedat F, Schlömicher M, Strauch J, Chatzitomaris A, et al. Nonthyroidal illness syndrome in cardiac illness involves elevated concentrations of 3,5-diiodothyronine and correlates with atrial remodeling. Eur Thyroid J. (2015) 4:129–37. doi: 10.1159/000381543
39. Horn S, Heuer H. Thyroid hormone action during brain development: more questions than answers. Mol Cell Endocrinol. (2010) 315:19–26. doi: 10.1016/j.mce.2009.09.008
40. Lain SJ, Bentley JP, Wiley V, Roberts CL, Jack M, Wilcken B, et al. Association between borderline neonatal thyroid-stimulating hormone concentrations and educational and developmental outcomes: a population-based record-linkage study. Lancet Diabetes Endocrinol. (2016) 4:756–65. doi: 10.1016/s2213-8587(16)30122-x
41. Trumpff C, Schepper JD, Vanderfaeillie J, Vercruysse N, Oyen HV, Moreno-Reyes R, et al. Neonatal thyroid-stimulating hormone concentration and psychomotor development at preschool age. Arch Dis Child. (2016) 101:1100. doi: 10.1136/archdischild-2015-310006
42. Jin HY. Prevalence of subclinical hypothyroidism in obese children or adolescents and association between thyroid hormone and the components of metabolic syndrome. J Paediatr Child H. (2018) 54:975–80. doi: 10.1111/jpc.13926
43. Ittermann T, Thamm M, Wallaschofski H, Rettig R, Völzke H. Serum thyroid-stimulating hormone levels are associated with blood pressure in children and adolescents. J Clin Endocrinol Metab. (2012) 97:828–34. doi: 10.1210/jc.2011-2768
44. Lee M-K, Kim YM, Sohn S-Y, Lee J-H, Won YJ, Kim SH. Evaluation of the relationship of subclinical hypothyroidism with metabolic syndrome and its components in adolescents: a population-based study. Endocrine. (2019) 65:608–15. doi: 10.1007/s12020-019-01942-9
45. Agretti P, Marco GD, Cosmo CD, Bagattini B, Ferrarini E, Montanelli L, et al. Frequency and effect on serum TSH of phosphodiesterase 8B (PDE8B) gene polymorphisms in patients with sporadic nonautoimmune subclinical hypothyroidism. J Endocrinol Investig. (2014) 37:189–94. doi: 10.1007/s40618-013-0036-7
46. Arnaud-Lopez L, Usala G, Ceresini G, Mitchell BD, Pilia MG, Piras MG, et al. Phosphodiesterase 8B gene variants are associated with serum TSH levels and thyroid function. Am J Hum Genet. (2008) 82:1270–80. doi: 10.1016/j.ajhg.2008.04.019
47. Goede SL, Leow MK-S, Smit JWA, Klein HH, Dietrich JW. Hypothalamus–pituitary–thyroid feedback control: implications of mathematical modeling and consequences for thyrotropin (TSH) and free thyroxine (FT4) reference ranges. B Math Biol. (2014) 76:1270–87. doi: 10.1007/s11538-014-9955-5
48. Goede SL, Leow MK-S, Smit JWA, Dietrich JW. A novel minimal mathematical model of the hypothalamus–pituitary–thyroid axis validated for individualized clinical applications. Math Biosci. (2014) 249:1–7. doi: 10.1016/j.mbs.2014.01.001
49. Spencer CA, Hollowell JG, Kazarosyan M, Braverman LE. National health and nutrition examination survey III thyroid-stimulating hormone (TSH)-thyroperoxidase antibody relationships demonstrate that TSH upper reference limits may be skewed by occult thyroid dysfunction. J Clin Endocrinol Metab. (2007) 92:4236–40. doi: 10.1210/jc.2007-0287
50. Bottani M, Aarsand AK, Banfi G, Locatelli M, Coşkun A, Díaz-Garzón J, et al. European Biological Variation Study (EuBIVAS): within- and between-subject biological variation estimates for serum thyroid biomarkers based on weekly samplings from 91 healthy participants. Clin Chem Lab Med (CCLM). (2022) 60:523–32. doi: 10.1515/cclm-2020-1885
51. Kohanim YK, Milo T, Raz M, Karin O, Bar A, Mayo A, et al. Dynamics of thyroid diseases and thyroid-axis gland masses. Mol Syst Biol. (2022) 18:e10919. doi: 10.15252/msb.202210919
52. Leow MK-S. A review of the phenomenon of hysteresis in the hypothalamus–pituitary–thyroid axis. Front Endocrinol. (2016) 7:64. doi: 10.3389/fendo.2016.00064
53. Neto EC, Rubin R. Thyroxine-binding globulin in neonates and children. Western J Med. (2001) 175:306–6. doi: 10.1136/ewjm.175.5.306
Keywords: pediatric endocrinology, thyroid, subclinical hypothyroidism, multivariate models, TSH
Citation: Giannakopoulos A, Efthymiadou A, Kritikou D and Chrysis D (2025) Usefulness of SPINA model in evaluation of the thyroid function in euthyroid pediatric patients children with subclinical hypothyroidism. Front. Endocrinol. 16:1365354. doi: 10.3389/fendo.2025.1365354
Received: 04 January 2024; Accepted: 18 March 2025;
Published: 31 March 2025.
Edited by:
George Paltoglou, National and Kapodistrian University of Athens, GreeceReviewed by:
Stephen Fitzgerald, Royal Adelaide Hospital, AustraliaKamila Magdalena Szeliga, Medical University of Silesia, Poland
Copyright © 2025 Giannakopoulos, Efthymiadou, Kritikou and Chrysis. This is an open-access article distributed under the terms of the Creative Commons Attribution License (CC BY). The use, distribution or reproduction in other forums is permitted, provided the original author(s) and the copyright owner(s) are credited and that the original publication in this journal is cited, in accordance with accepted academic practice. No use, distribution or reproduction is permitted which does not comply with these terms.
*Correspondence: Aristeidis Giannakopoulos, YWdpYW5ha0BnbWFpbC5jb20=; Dionisios Chrysis, ZGNocnlzaXNAdXBhdHJhcy5ncg==