- Department of Pediatric Surgery, Suining Central Hospital, Suining, Sichuan, China
Background: The triglyceride-glucose (TyG) index and related indices, including the triglyceride-glucose body mass index (TyG-BMI), triglyceride-glucose waist circumference (TyG-WC), and triglyceride-glucose waist-to-height ratio (TyG-WHtR), are increasingly recognized as valuable markers of insulin resistance (IR). This study aimed to assess the associations between these TyG-related indices and kidney stones.
Methods: This cross-sectional study analyzed data from 10,824 participants obtained from the National Health and Nutrition Examination Survey (NHANES) conducted between 2007 and 2020. Weighted logistic regression models were employed to evaluate the associations between TyG-related indices and kidney stones, with adjustments for potential confounding factors. Subgroup analyses and smooth curve fittings were performed to further examine these associations, while receiver operating characteristic (ROC) curves were used to compare the predictive performance of each index.
Results: All TyG-related indices demonstrated significant positive associations with kidney stones when analyzed as continuous variables. The odds ratios (OR) with 95% confidence intervals (CI) were 1.0040 (1.0028, 1.0052) for TyG-BMI, 1.0015 (1.0011, 1.0020) for TyG-WC, and 1.3305 (1.2277, 1.4419) for TyG-WHtR. Similar trends were observed in subgroup and smooth curve analyses. When stratified into tertiles, higher tertiles of each TyG-related index were associated with increased odds of kidney stones. TyG-WC demonstrated the strongest predictive capability for kidney stones (AUC = 0.6158), followed closely by TyG-WHtR (AUC = 0.6156) and TyG-BMI (AUC = 0.5949), with TyG showing the lowest AUC (0.5815).
Conclusion: This study identified significant positive associations between TyG-related indices and kidney stone formation. Among these indices, TyG-WHtR exhibited the highest predictive power for identifying kidney stone risk.
1 Introduction
Kidney stones are a prevalent urological condition with a substantial global impact. The incidence of kidney stones has been steadily rising worldwide, with estimates ranging from 5% to 19% across various regions (1, 2). In the United States, the prevalence has nearly tripled over recent decades, increasing from 3.2% to 8.8%, particularly in developed nations owing to changes in diet and lifestyle (3). The economic burden is substantial, with healthcare costs related to nephrolithiasis exceeding $10 billion annually (3, 4). Recurrence rates are high, with nearly 50% of individuals experiencing a repeat episode within five years (5, 6). Kidney stones are associated with complications such as infections, renal colic, and chronic kidney disease (7, 8), highlighting the need for effective preventive strategies.
The triglyceride-glucose (TyG) index is a recognized marker of insulin resistance (IR), calculated using fasting triglyceride and glucose levels (9). Recently, new indices combining TyG with anthropometric measures, such as triglyceride-glucose body mass index (TyG-BMI), triglyceride-glucose waist circumference (TyG-WC), and triglyceride-glucose waist-to-height ratio (TyG-WHtR), have been proposed to provide a more comprehensive assessment of metabolic risk by integrating both metabolic and body composition data (10). These TyG-related indices have demonstrated stronger correlations with IR than the TyG index alone (11–13). Since IR has been linked to kidney stone formation (14), TyG-related indices may also be associated with nephrolithiasis. However, despite the increasing evidence on the relationship between IR and kidney stones, only a limited number of studies (15, 16) have examined the association between TyG-related indices and the risk of kidney stones, leaving this area of research relatively underexplored.
This study aims to investigate the association between TyG-related indices and the risk of kidney stone formation. By analyzing data from the National Health and Nutrition Examination Survey (NHANES), we aim to determine whether higher TyG-related indices are predictive of kidney stone risk in adults. This research addresses a gap in understanding the relationship between IR markers, such as TyG-related indices, and kidney stone development, with potential implications for early detection and prevention strategies.
2 Materials and methods
2.1 Data source
This cross-sectional study analyzed data from the NHANES, conducted between 2007 and 2020. Administered by the Centers for Disease Control and Prevention (CDC) and the National Center for Health Statistics (NCHS), NHANES aims to assess the health and nutritional status of the non-institutionalized U.S. population using a stratified, multistage probability sampling technique. Data collection involved in-home interviews conducted by trained professionals and comprehensive health examinations, including laboratory tests performed at mobile examination centers. The NHANES protocol was approved by the NCHS Ethics Review Board, and all participants or their guardians provided written informed consent. This study adhered to the principles of the Declaration of Helsinki. No additional Institutional Review Board approval was required for this secondary analysis. Further details regarding NHANES methodology are available on the NHANES website (https://www.cdc.gov/nchs/nhanes).
2.2 Study population
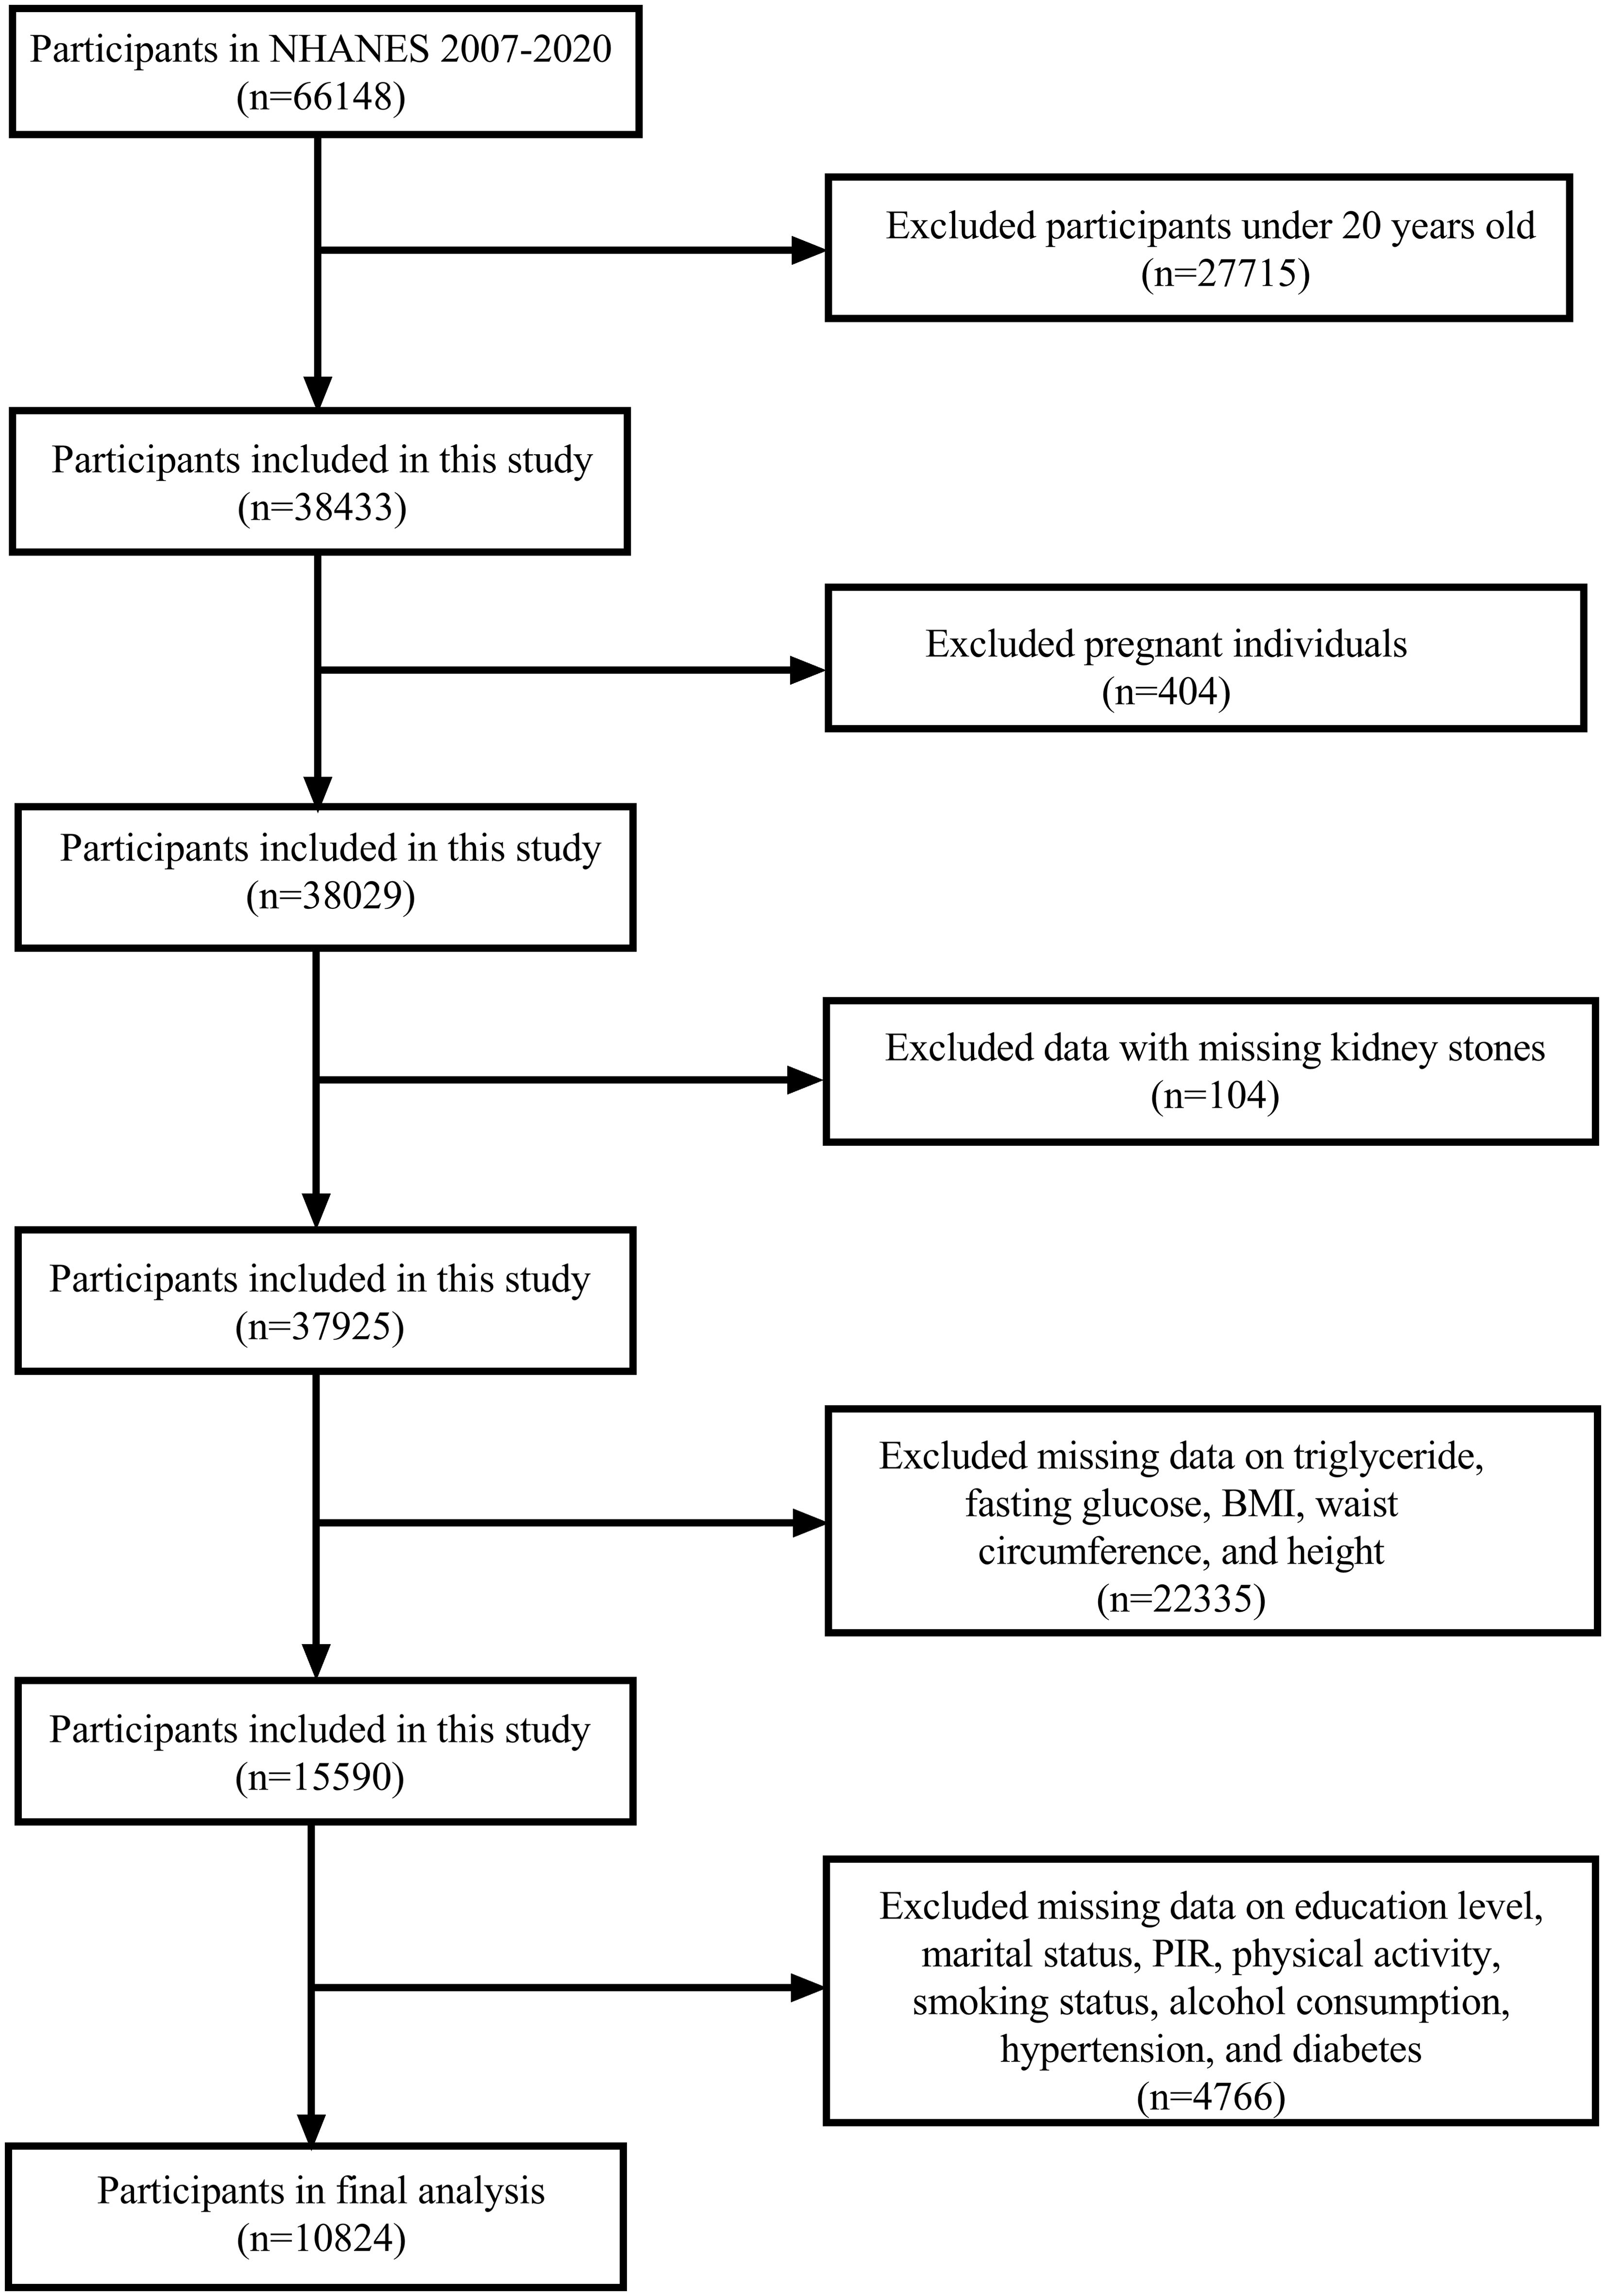
The NHANES cycles from 2007 to 2020 were selected for this study as they contained the necessary variables for our analysis. A total of 66,148 participants were included in these cycles. We first excluded participants younger than 20 years (n = 27,715), followed by the exclusion of pregnant individuals (n = 404) and those with missing data on kidney stone status (n = 104). Participants with incomplete data for triglycerides, fasting glucose, BMI, waist circumference (WC), and height (n = 22,335) were also excluded. Additionally, participants missing data on education, marital status, poverty-income ratio (PIR), physical activity, smoking habits, alcohol consumption, hypertension, and diabetes (n = 4,766) were excluded. After applying these criteria, the final analytical sample consisted of 10,824 participants (Figure 1).
2.3 Definitions of TyG−related indices
In this study, TyG-related indices were calculated using fasting triglyceride, fasting glucose levels, and body measurements. BMI was calculated as weight (in kilograms) divided by the square of height (in meters). The waist-to-height ratio (WHtR) was defined by dividing WC by height (17). The TyG index was calculated as follows: TyG index = ln [fasting triglyceride (mg/dL) × fasting glucose (mg/dL)/2] (18–20). Based on this, the following TyG-related indices were calculated: TyG-BMI = TyG × BMI (11, 21); TyG-WC = TyG × WC (21); TyG-WHtR = TyG × WHtR (22).
2.4 Kidney stones
In this study, the presence of kidney stones was determined based on responses to the NHANES questionnaire. Participants were classified as having a history of kidney stones if they answered “yes” to the question, “KIQ026 (Have you/Has the sample person ever had kidney stones)?”. Those who answered “no” were considered not to have a history of kidney stones.
2.5 Covariates
Covariates were selected based on their potential to influence the effect estimate by more than 10%, as well as their relevance from both clinical and literature perspectives (23–27). These covariates included age, gender, race, education level, marital status, PIR, physical activity, smoking status, alcohol consumption, hypertension, and diabetes. Age was analyzed both as a continuous variable (in years) and as a categorical variable with three groups: <40 years, 40–60 years, and ≥60 years. Gender was categorized as male or female. Race was divided into five groups: Mexican American, Other Hispanic, Non-Hispanic White, Non-Hispanic Black, and Other Race. Education level was classified into three categories: less than high school, high school or equivalent, and college or above. Marital status was classified into two categories: “married or living with a partner” and “single”, with “single” including participants who were never married, separated, divorced, or widowed. PIR, an indicator of socioeconomic status, was grouped into low (PIR < 1.3), medium (PIR 1.3–3.5), and high (PIR ≥ 3.5) (28).
Physical activity level was categorized according to the American Physical Activity Council’s recommendations for chronic health conditions (≥75 minutes per week of vigorous activity or ≥150 minutes per week of moderate activity). Participants were divided into three groups: active (meeting or exceeding the recommended level), less active (below the recommended level), and inactive (no physical activity) (29). Smoking status was categorized into never, former, and current smokers. Never smokers were defined as those who had smoked fewer than 100 cigarettes in their lifetime, former smokers had smoked more than 100 but had quit, and current smokers had smoked over 100 cigarettes and were still smoking (30, 31). Alcohol consumption was divided into four groups: none, moderate (up to 1 drink per day for women or 1–2 drinks per day for men), heavy (2–3 drinks per day for women or 3–4 drinks per day for men), and binge (≥4 drinks per day for women or ≥5 drinks per day for men), based on guidelines from the National Institute on Alcohol Abuse and Alcoholism (NIAAA). Hypertension was identified through self-reported high blood pressure, use of antihypertensive medication, or blood pressure readings of systolic BP ≥130 mmHg and/or diastolic BP ≥80 mmHg (32). Diabetes was defined as a self-reported diagnosis, use of diabetes medication, or insulin therapy.
2.6 Statistical Analysis
To account for the complex survey design and ensure that the data accurately represented the national population, survey weights from NHANES, including WTMEC2YR (full sample 2-year MEC exam weight), SDMVPSU (masked variance pseudo-PSU), and SDMVSTRA (masked variance pseudo-stratum), were applied. Baseline characteristics were analyzed using survey-weighted linear regression for continuous variables, while the chi-square test was used for categorical variables. Continuous variables were expressed as survey-weighted means ± standard error (SE), and categorical variables were presented as unweighted counts with percentages. Participants were grouped into tertiles based on TyG-BMI, TyG-WC, and TyG-WHtR values.
To explore the association between TyG-related indices and kidney stones, multivariate weighted logistic regression models were applied, with odds ratios (ORs) and 95% confidence intervals (CIs) reported. TyG-related indices were initially introduced as continuous variables and subsequently divided into tertiles for further analysis. Three models were constructed: Model 1 was unadjusted, Model 2 was adjusted for age, gender, and race, and Model 3 was further adjusted for additional covariates, including marital status, PIR, physical activity, smoking status, alcohol consumption, hypertension, and diabetes. Fully adjusted models with smooth curve fitting were applied to evaluate the potential non-linear relationship between TyG-related indices and kidney stones. Subgroup analyses were performed across various demographics and health conditions, such as age, gender, BMI, smoking status, alcohol consumption, hypertension, and diabetes, using multivariate weighted logistic regression models, adjusting for covariates similar to those in Model 3. Interaction terms were included to assess differences across subgroups. Receiver operating characteristic (ROC) curves were generated to compare the predictive accuracy of the three TyG indices, and cutoff values with corresponding sensitivity and specificity were identified. All analyses were conducted using Empower Stats (http://www.empowerstats.com, X&Y Solutions, Inc, CA, USA) and R software (version 4.4.0; https://www.R-project.org), with a two-sided P-value < 0.05 considered statistically significant.
3 Results
3.1 Characteristics of the participants
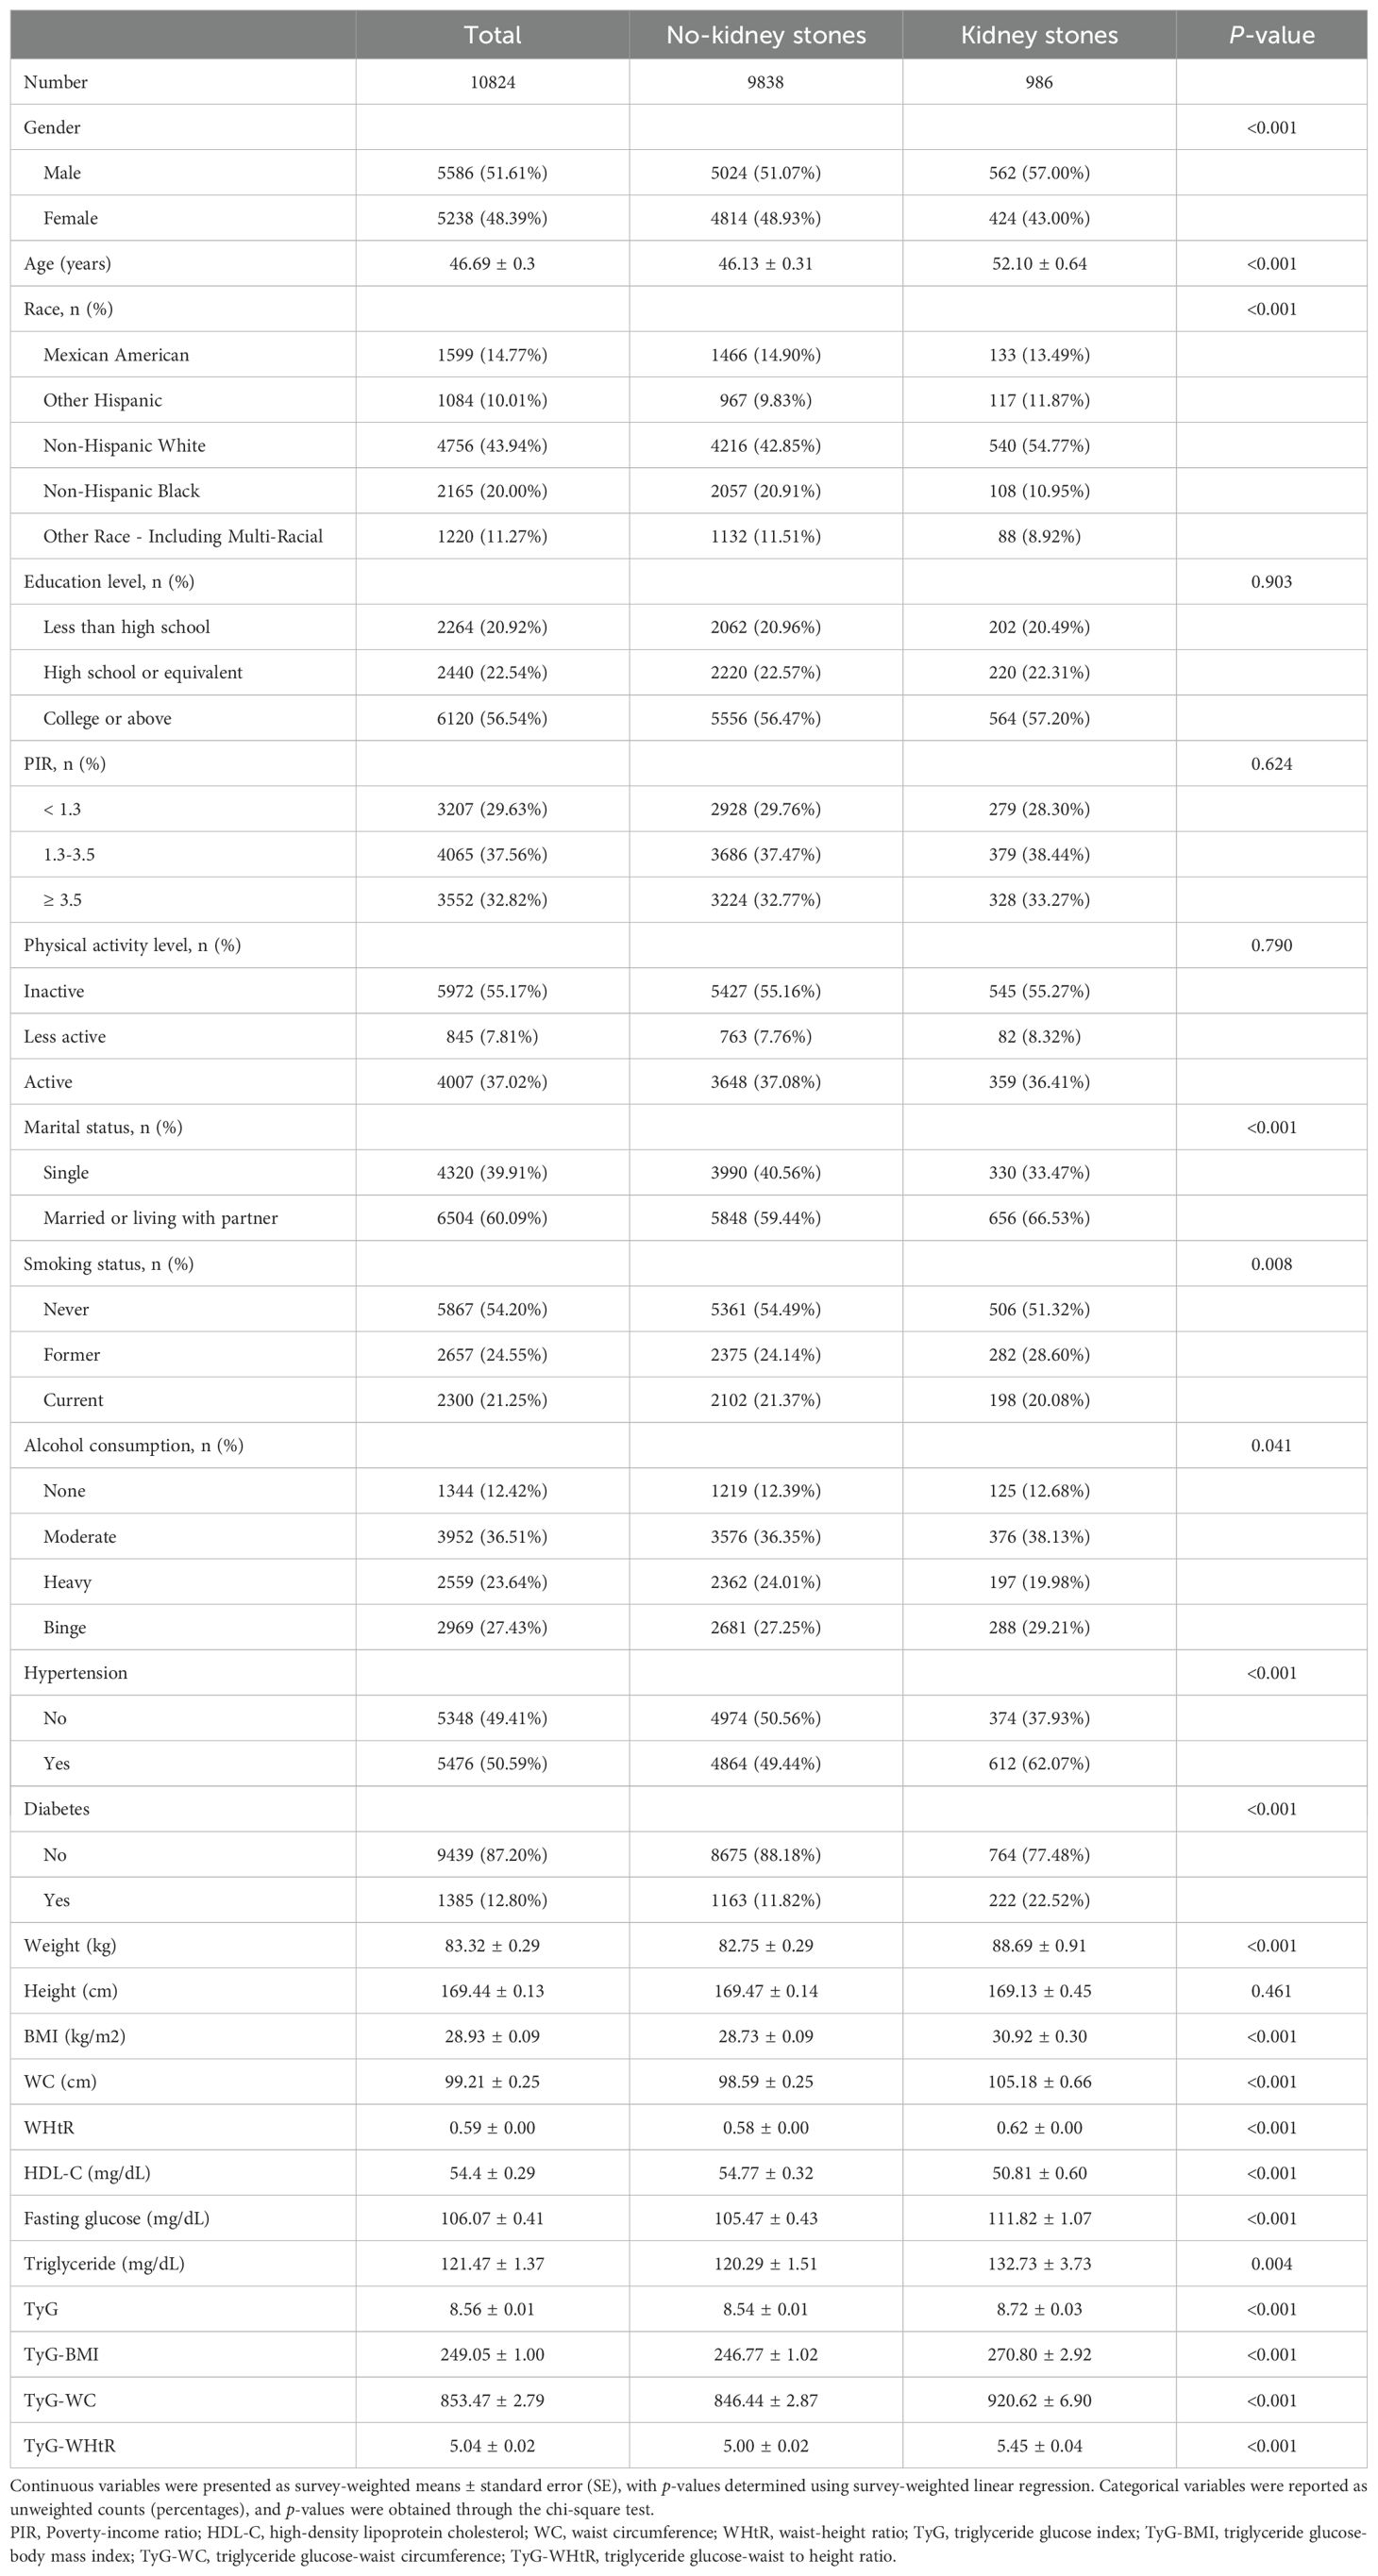
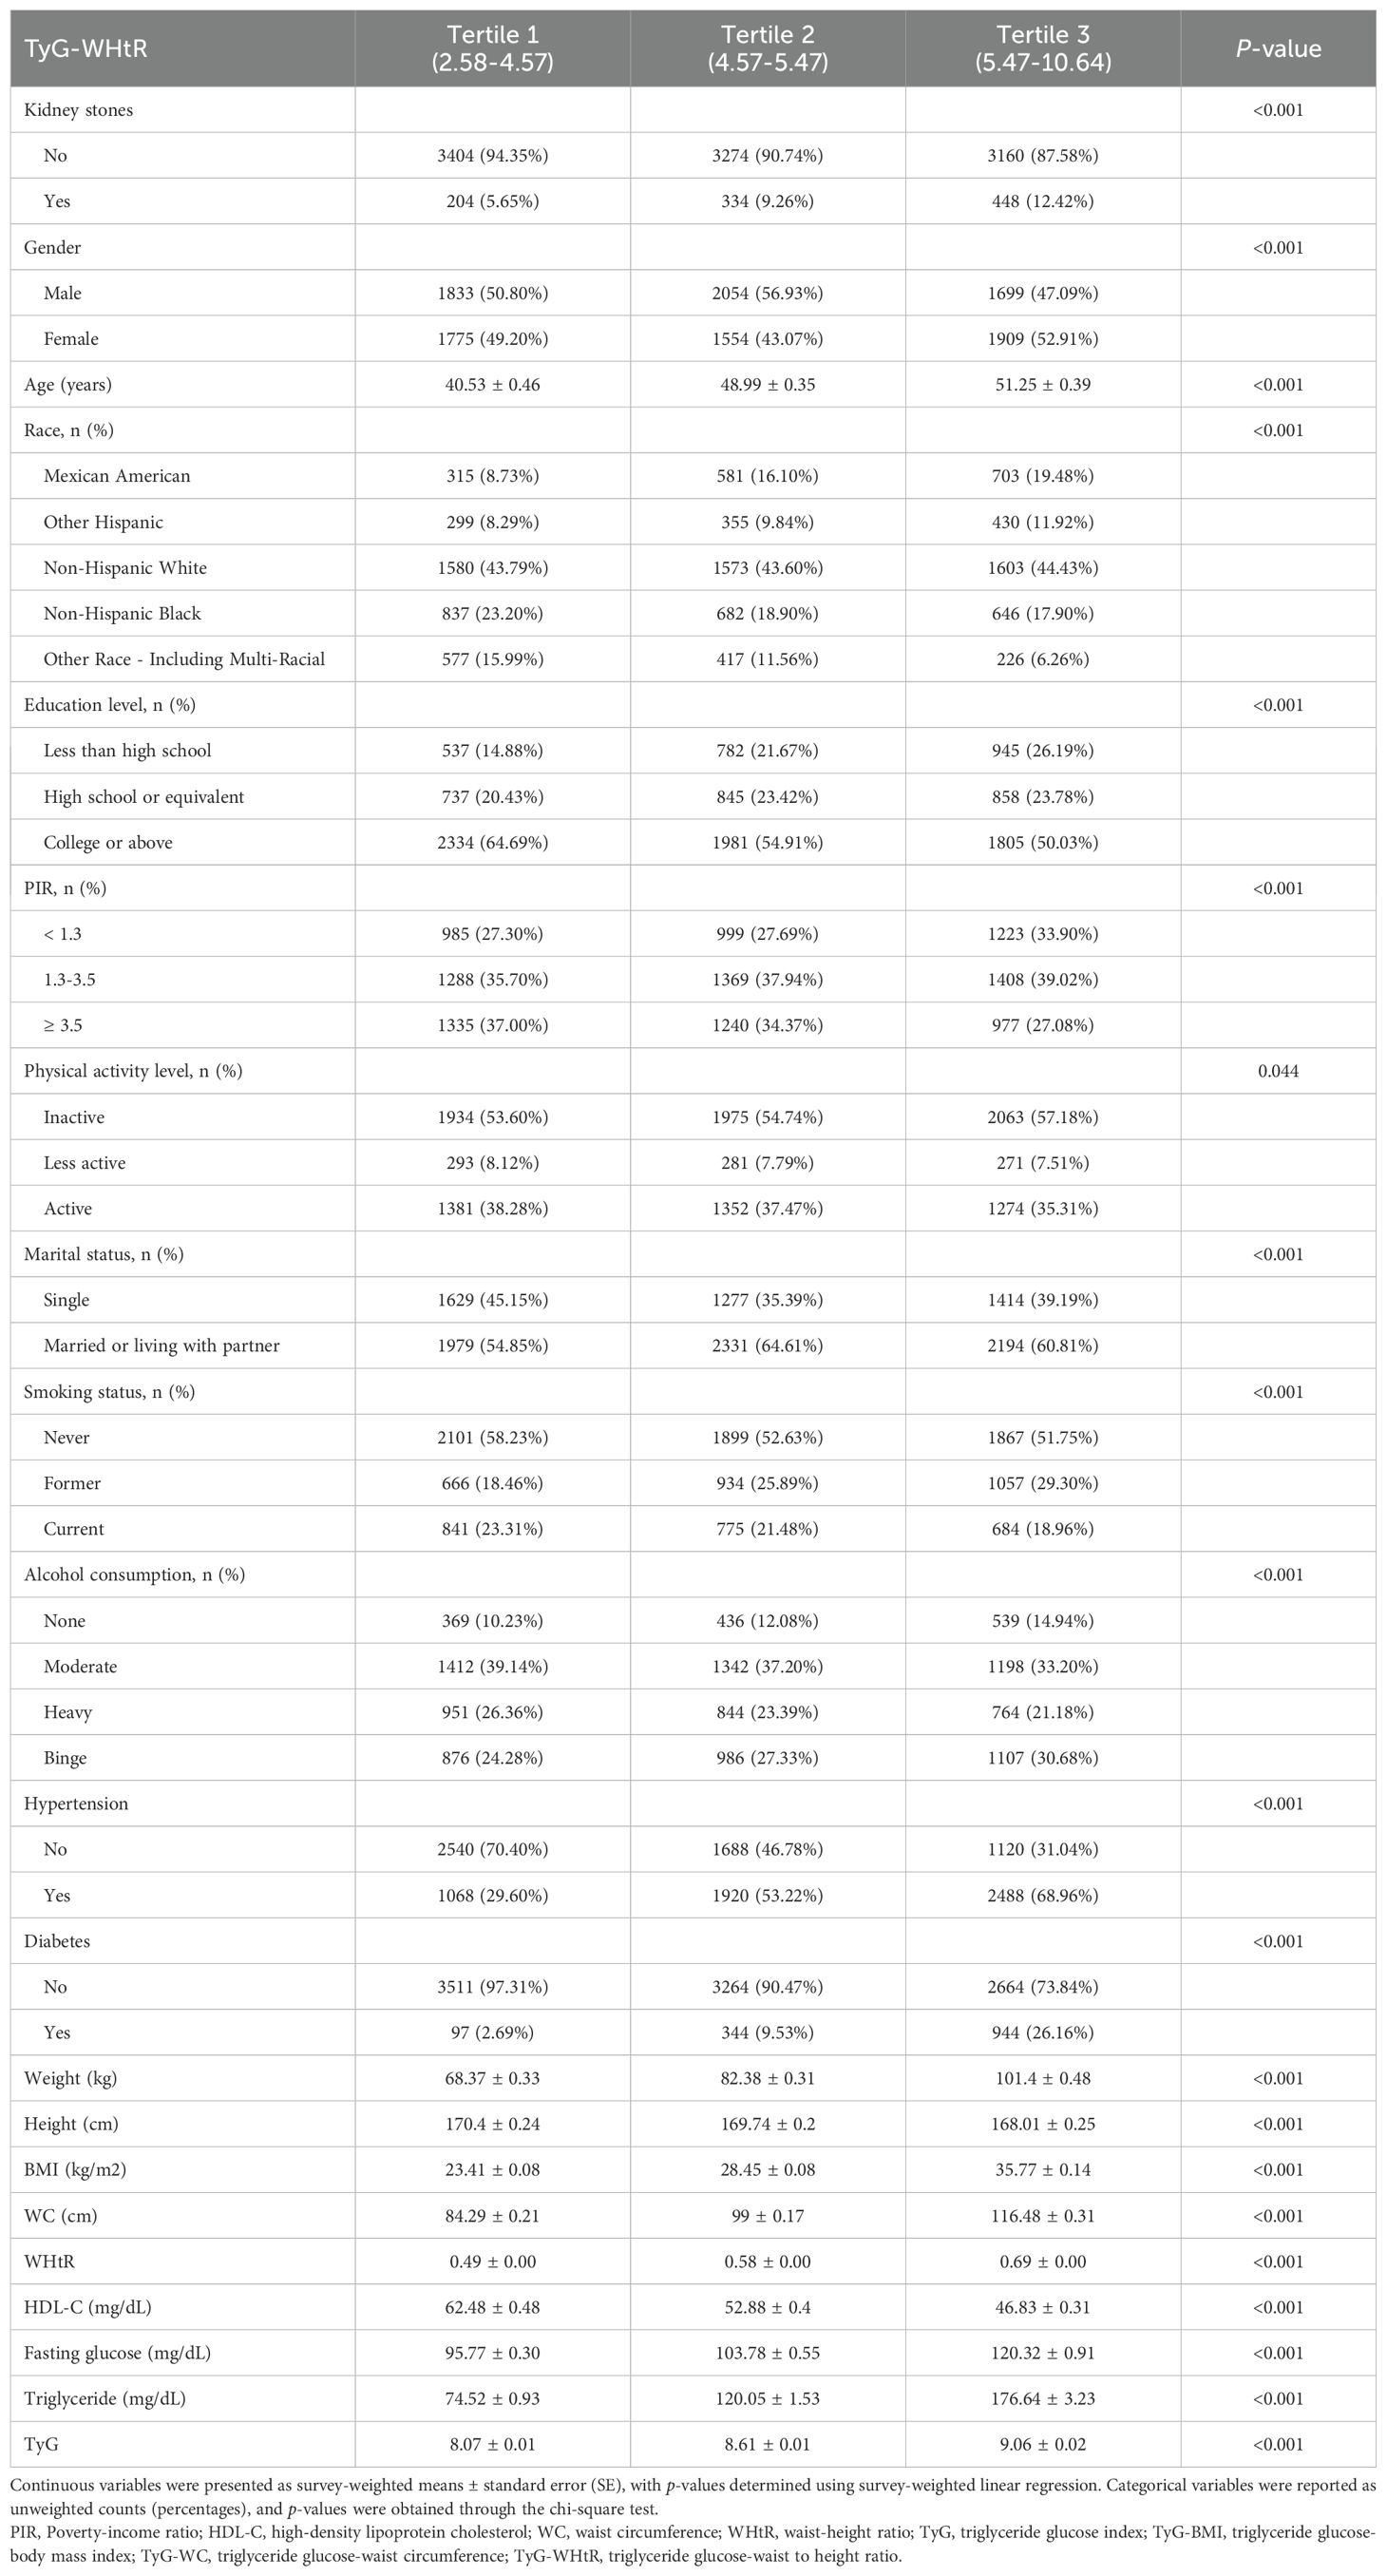
A total of 10,824 participants were included in the analysis. We classified them based on whether or not they had a history of kidney stones, identifying 986 participants with kidney stones. Participants with kidney stones tended to be older, with higher average BMI, greater WC, and an increased WHtR compared to those without kidney stones. A higher proportion of kidney stone patients were former smokers. Clinically, participants with kidney stones had a higher prevalence of hypertension and diabetes, as well as elevated fasting glucose and triglyceride levels. All TyG-related indices, including TyG-BMI, TyG-WC, and TyG-WHtR, were significantly higher in the kidney stone group compared to participants without stones (Table 1).
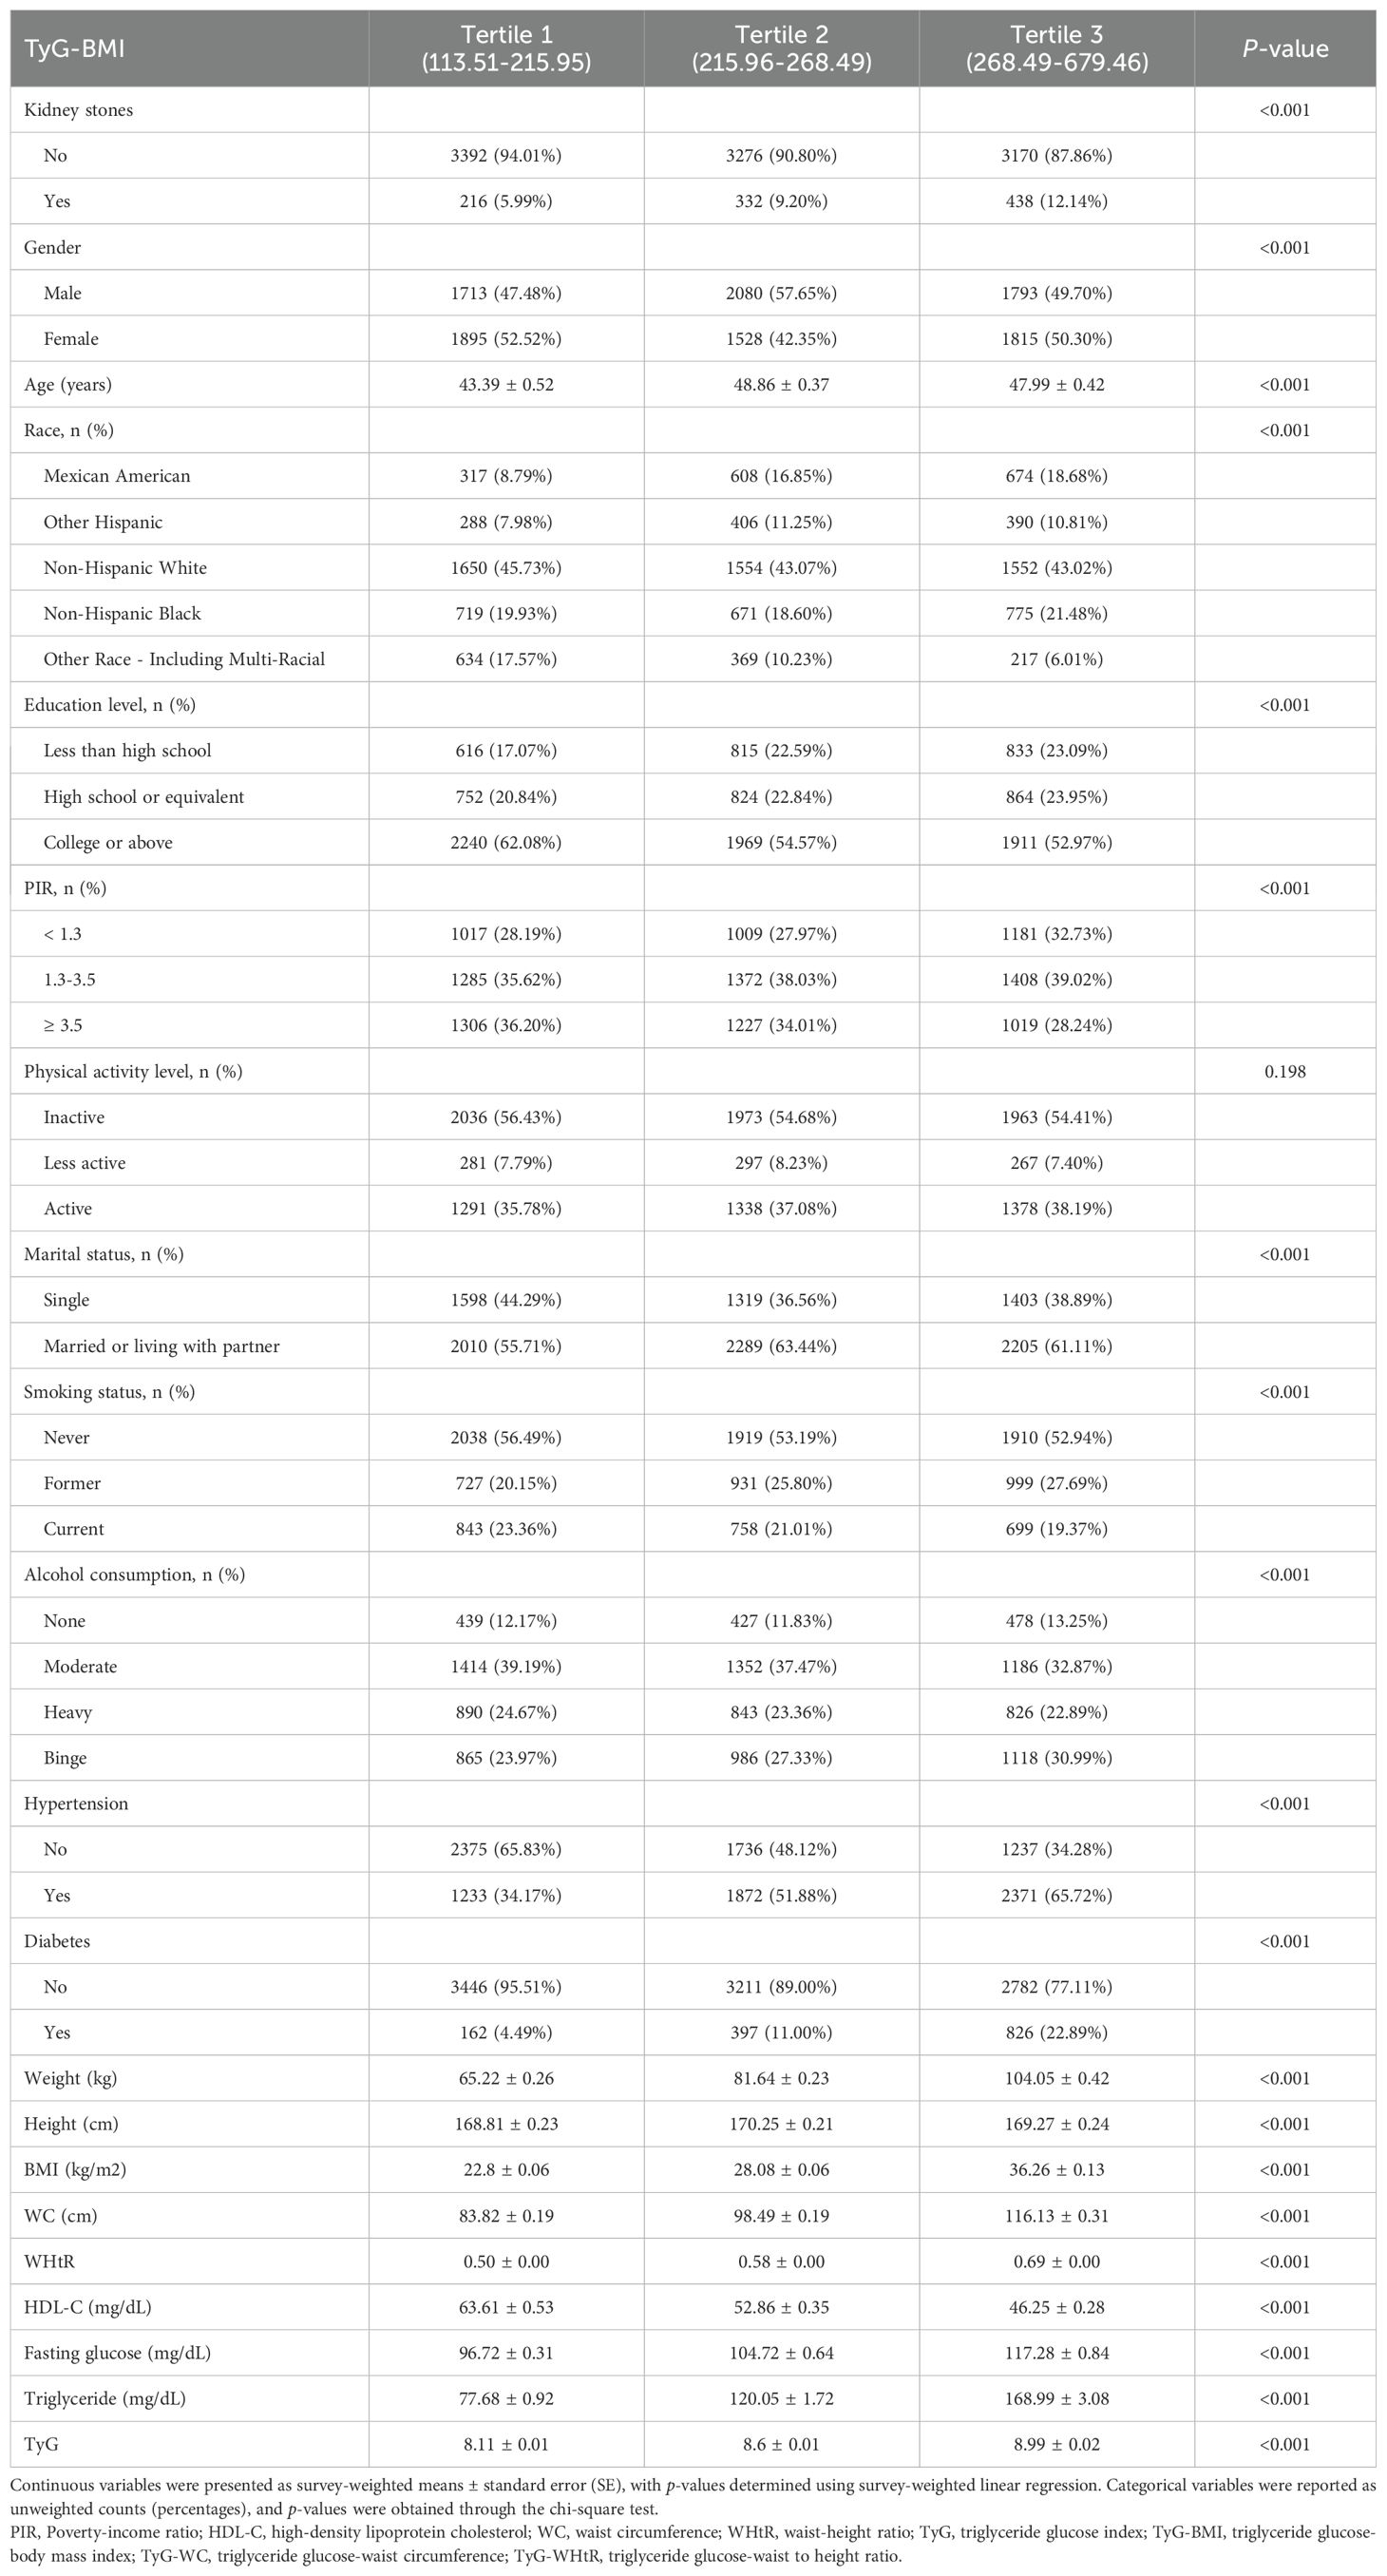
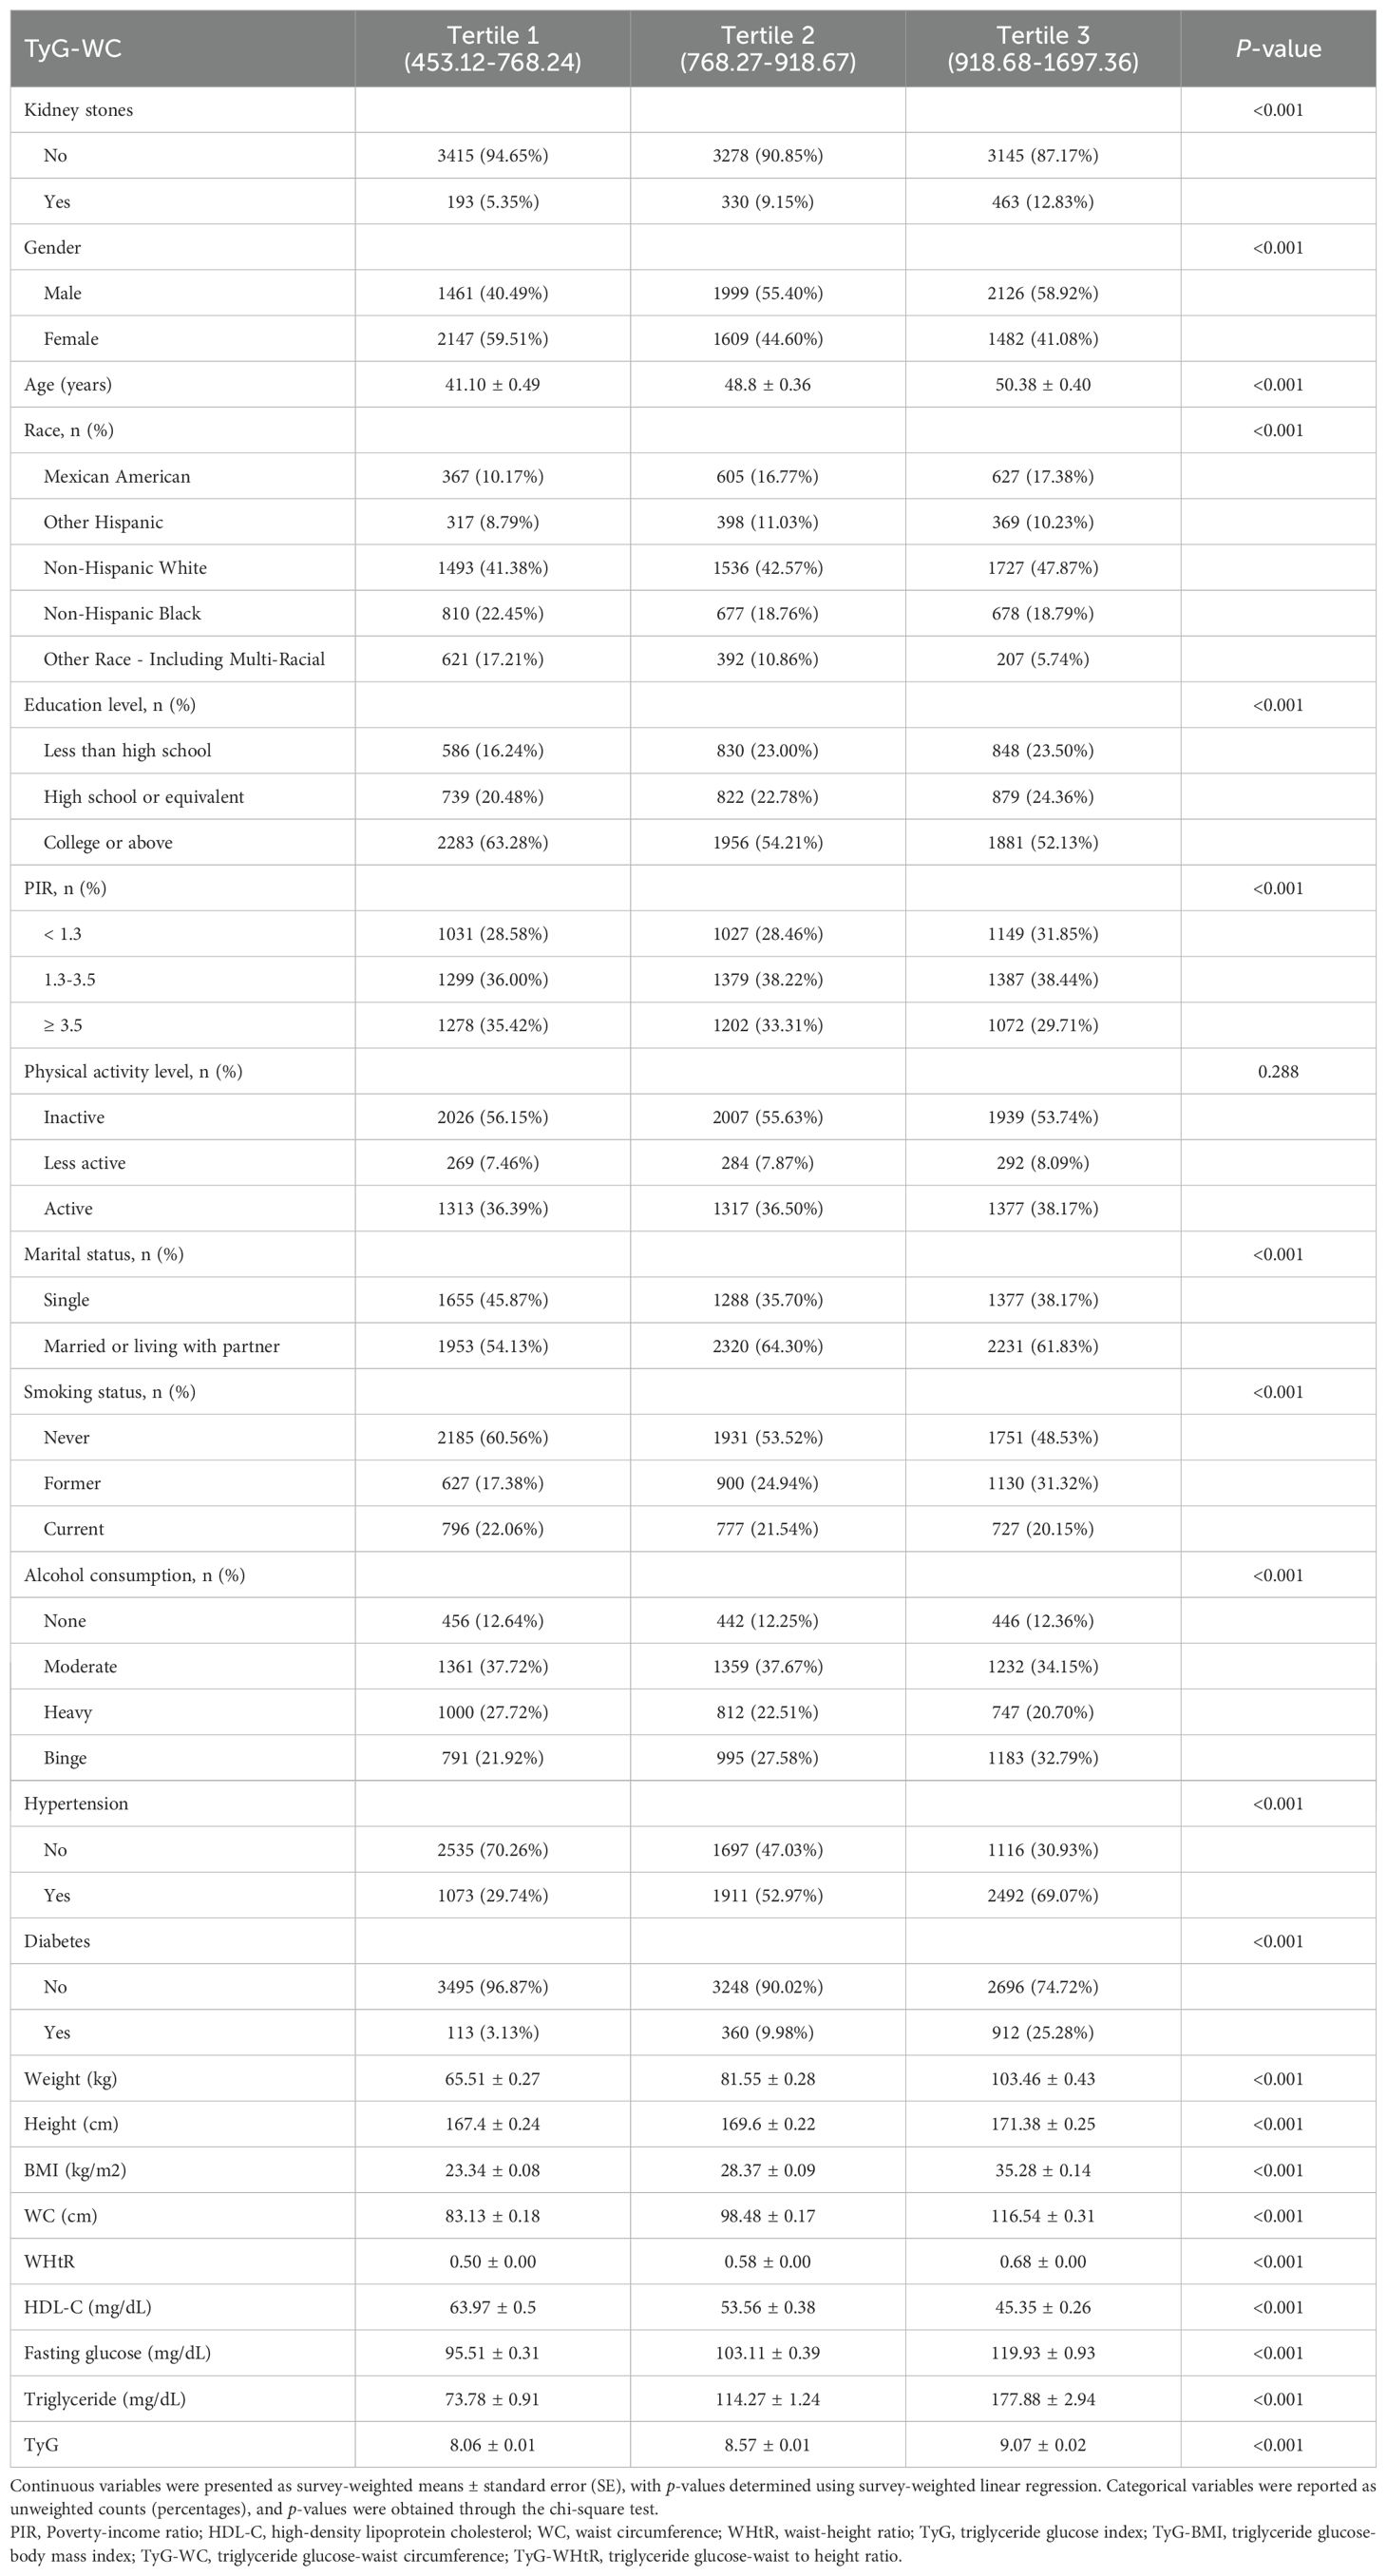
Participants were then categorized into tertiles based on TyG-BMI, TyG-WC, and TyG-WHtR, and their characteristics were compared across these groups (Tables 2–4). Analysis revealed that participants in the highest tertiles for all TyG-related indices (TyG-BMI, TyG-WC, and TyG-WHtR) were consistently older and had higher BMI, WHtR, WC, fasting glucose, and triglyceride levels compared to those in the lower tertiles. Furthermore, participants in the highest tertile exhibited lower HDL-C levels, lower levels of education, and a higher likelihood of smoking and alcohol consumption. The prevalence of both hypertension and diabetes was also significantly higher in in the highest tertile group.
3.2 Association between TyG-related indices and kidney stones
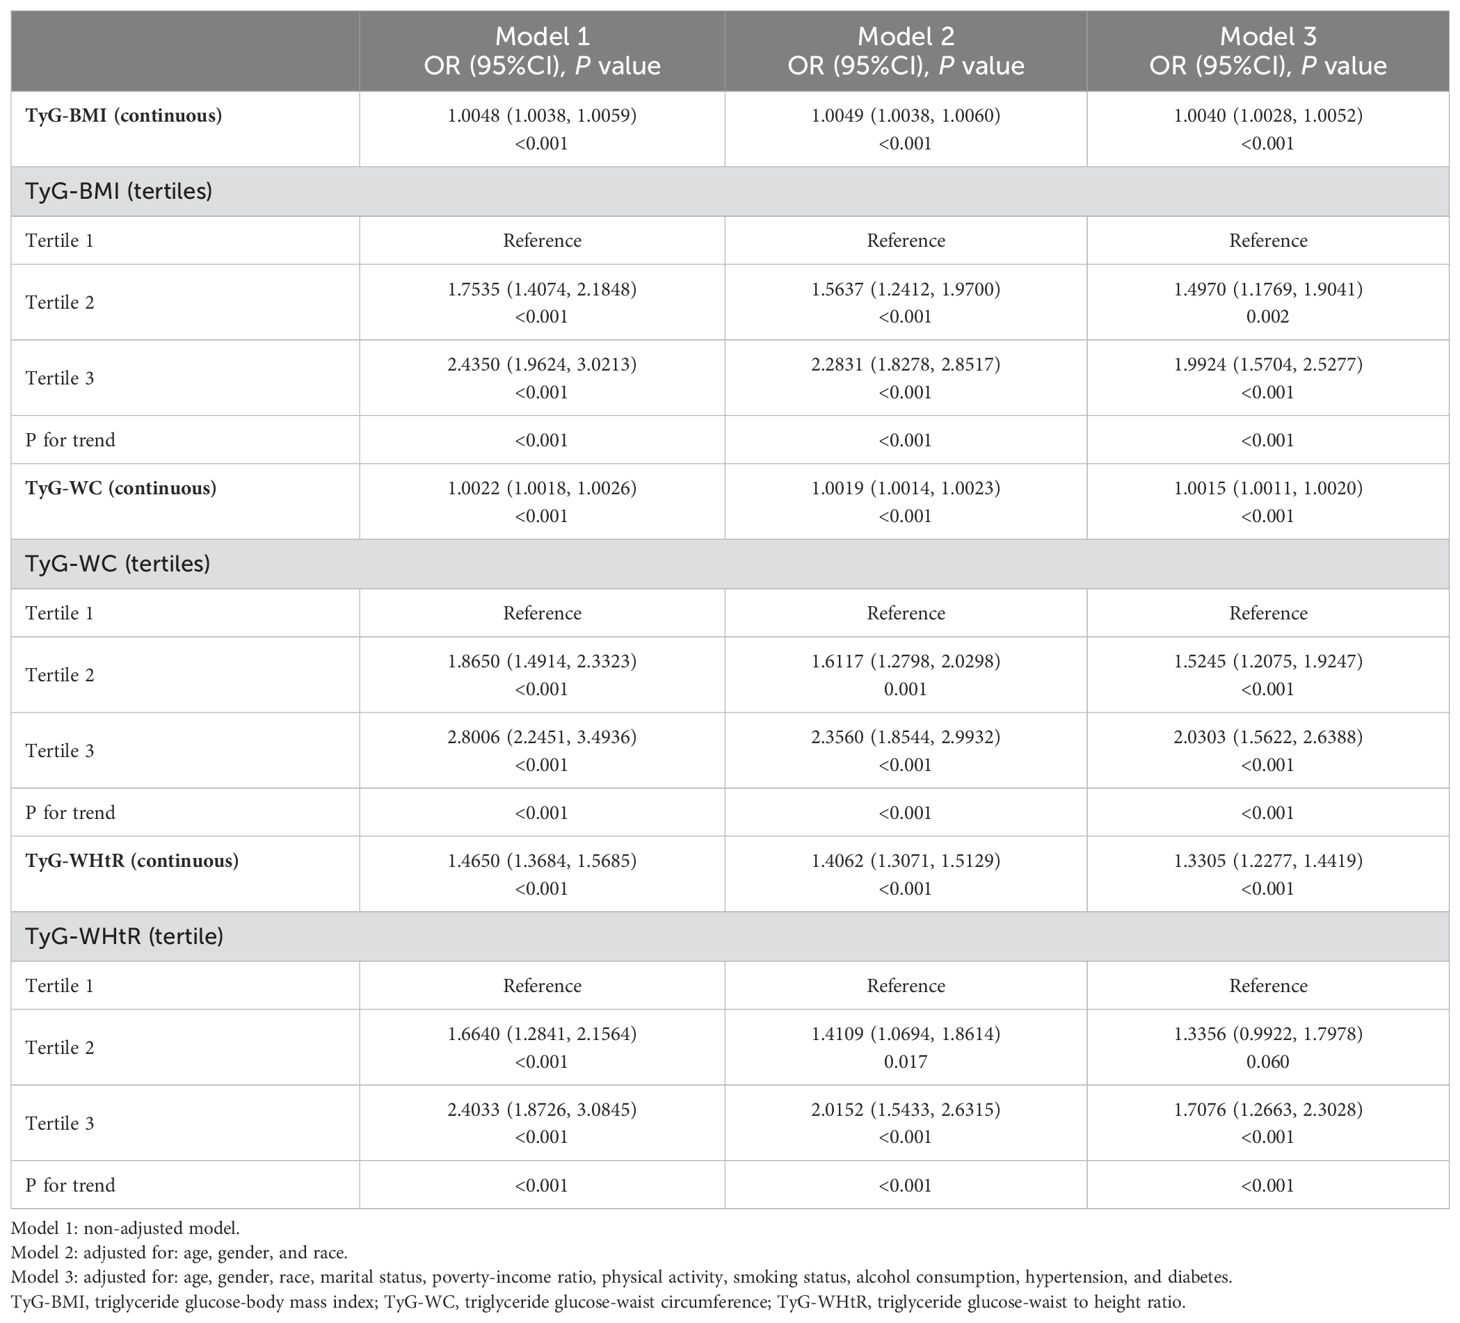
The findings from the weighted logistic regression analyses are presented in Table 5. TyG-related indices (TyG-BMI, TyG-WC, TyG-WHtR) were positively associated with the risk of kidney stones in all models. As continuous variables, each unit increase in TyG-BMI, TyG-WC, and TyG-WHtR was associated with a higher risk of kidney stones, with statistically significant results across all three models (P < 0.001). In the fully adjusted model, the OR for TyG-BMI was 1.0040 (95% CI: 1.0028, 1.0052), for TyG-WC 1.0015 (95% CI: 1.0011, 1.0020), and for TyG-WHtR 1.3305 (95% CI: 1.2277, 1.4419). When dividing participants into tertiles, the trend remained consistent. For TyG-BMI, those in the highest tertile had an OR of 1.9924 (95% CI: 1.5704, 2.5277) in Model 3 compared to the reference group in the lowest tertile. A similar pattern was observed for TyG-WC and TyG-WHtR. In TyG-WC tertiles, participants in tertile 3 had an OR of 2.0303 (95% CI: 1.5622, 2.6388) in Model 3. For TyG-WHtR, tertile 3 participants had an OR of 1.7076 (95% CI: 1.2663, 2.3028) in the fully adjusted model. The p-values for the trend across tertiles were consistently significant (P for trend < 0.001). The smooth curve fitting analysis (Figures 2–4) showed a positive association between TyG-BMI, TyG-WC, and TyG-WHtR and the probability of kidney stones. As each TyG-related index increased, the probability of kidney stones rose consistently across all models.
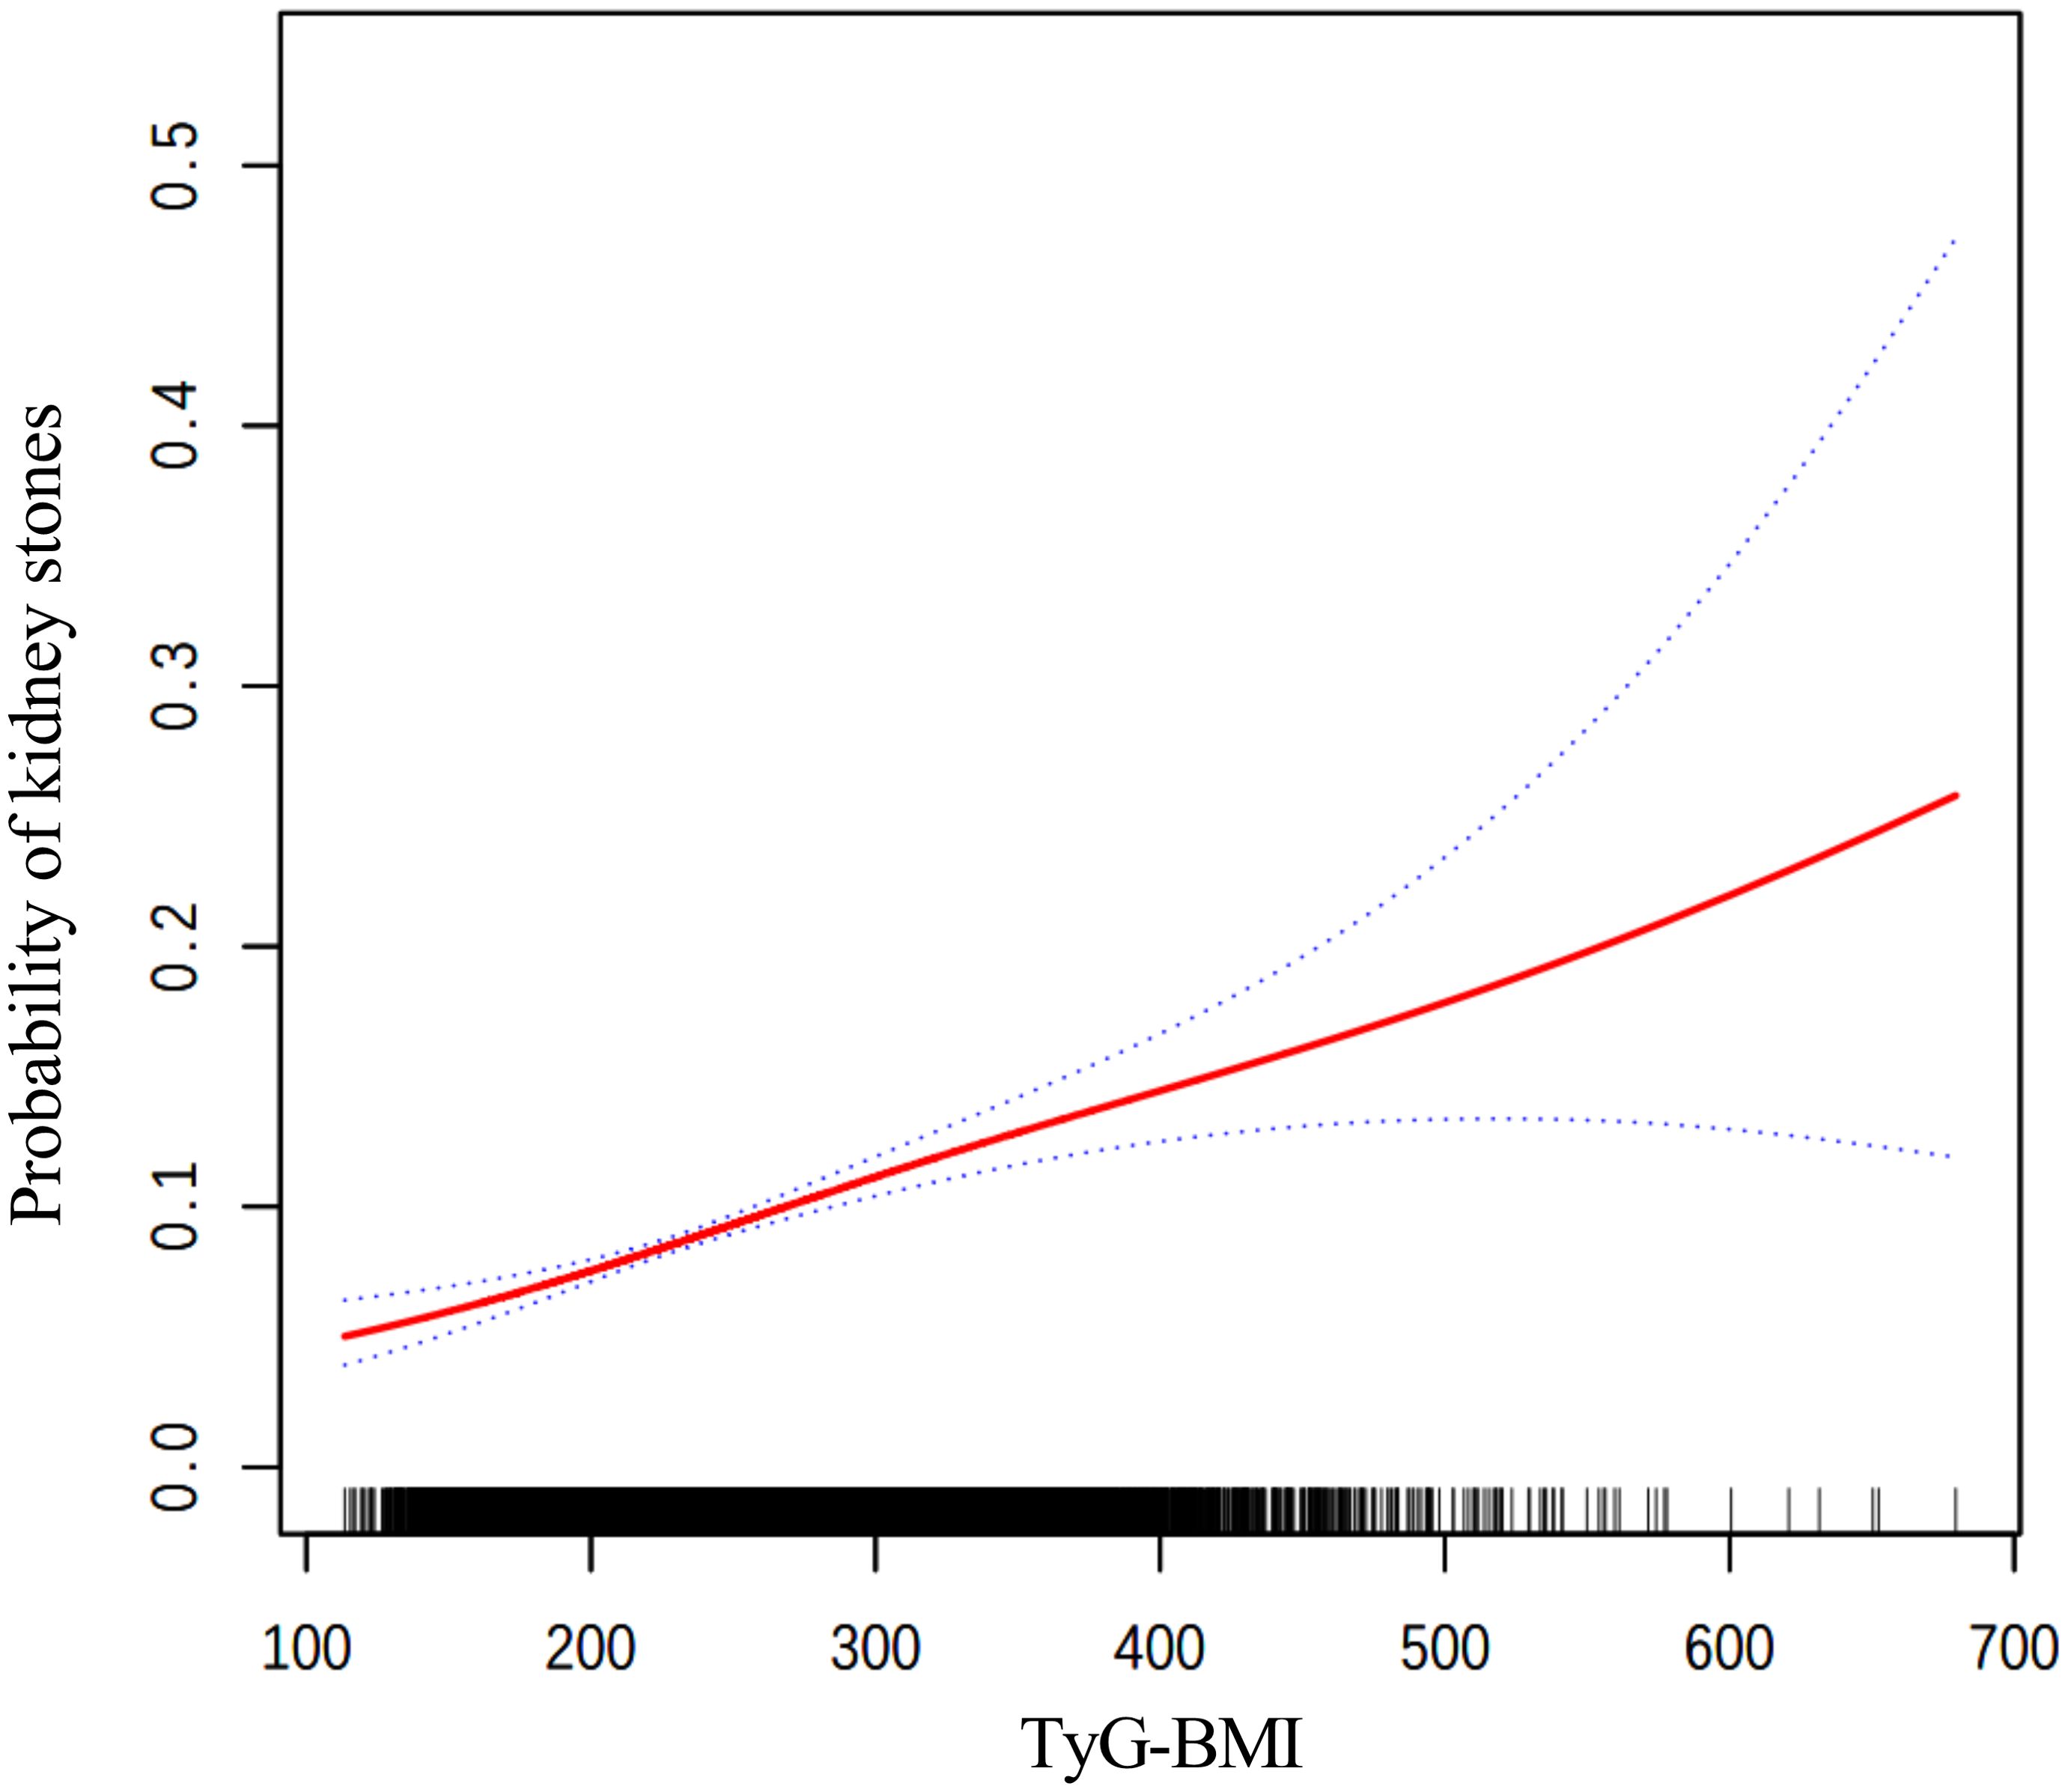
Figure 2. The smooth curve fitting between TyG-BMI and kidney stones. Adjusted for: age, gender, race, marital status, poverty-income ratio, physical activity, smoking status, alcohol consumption, hypertension, and diabetes.
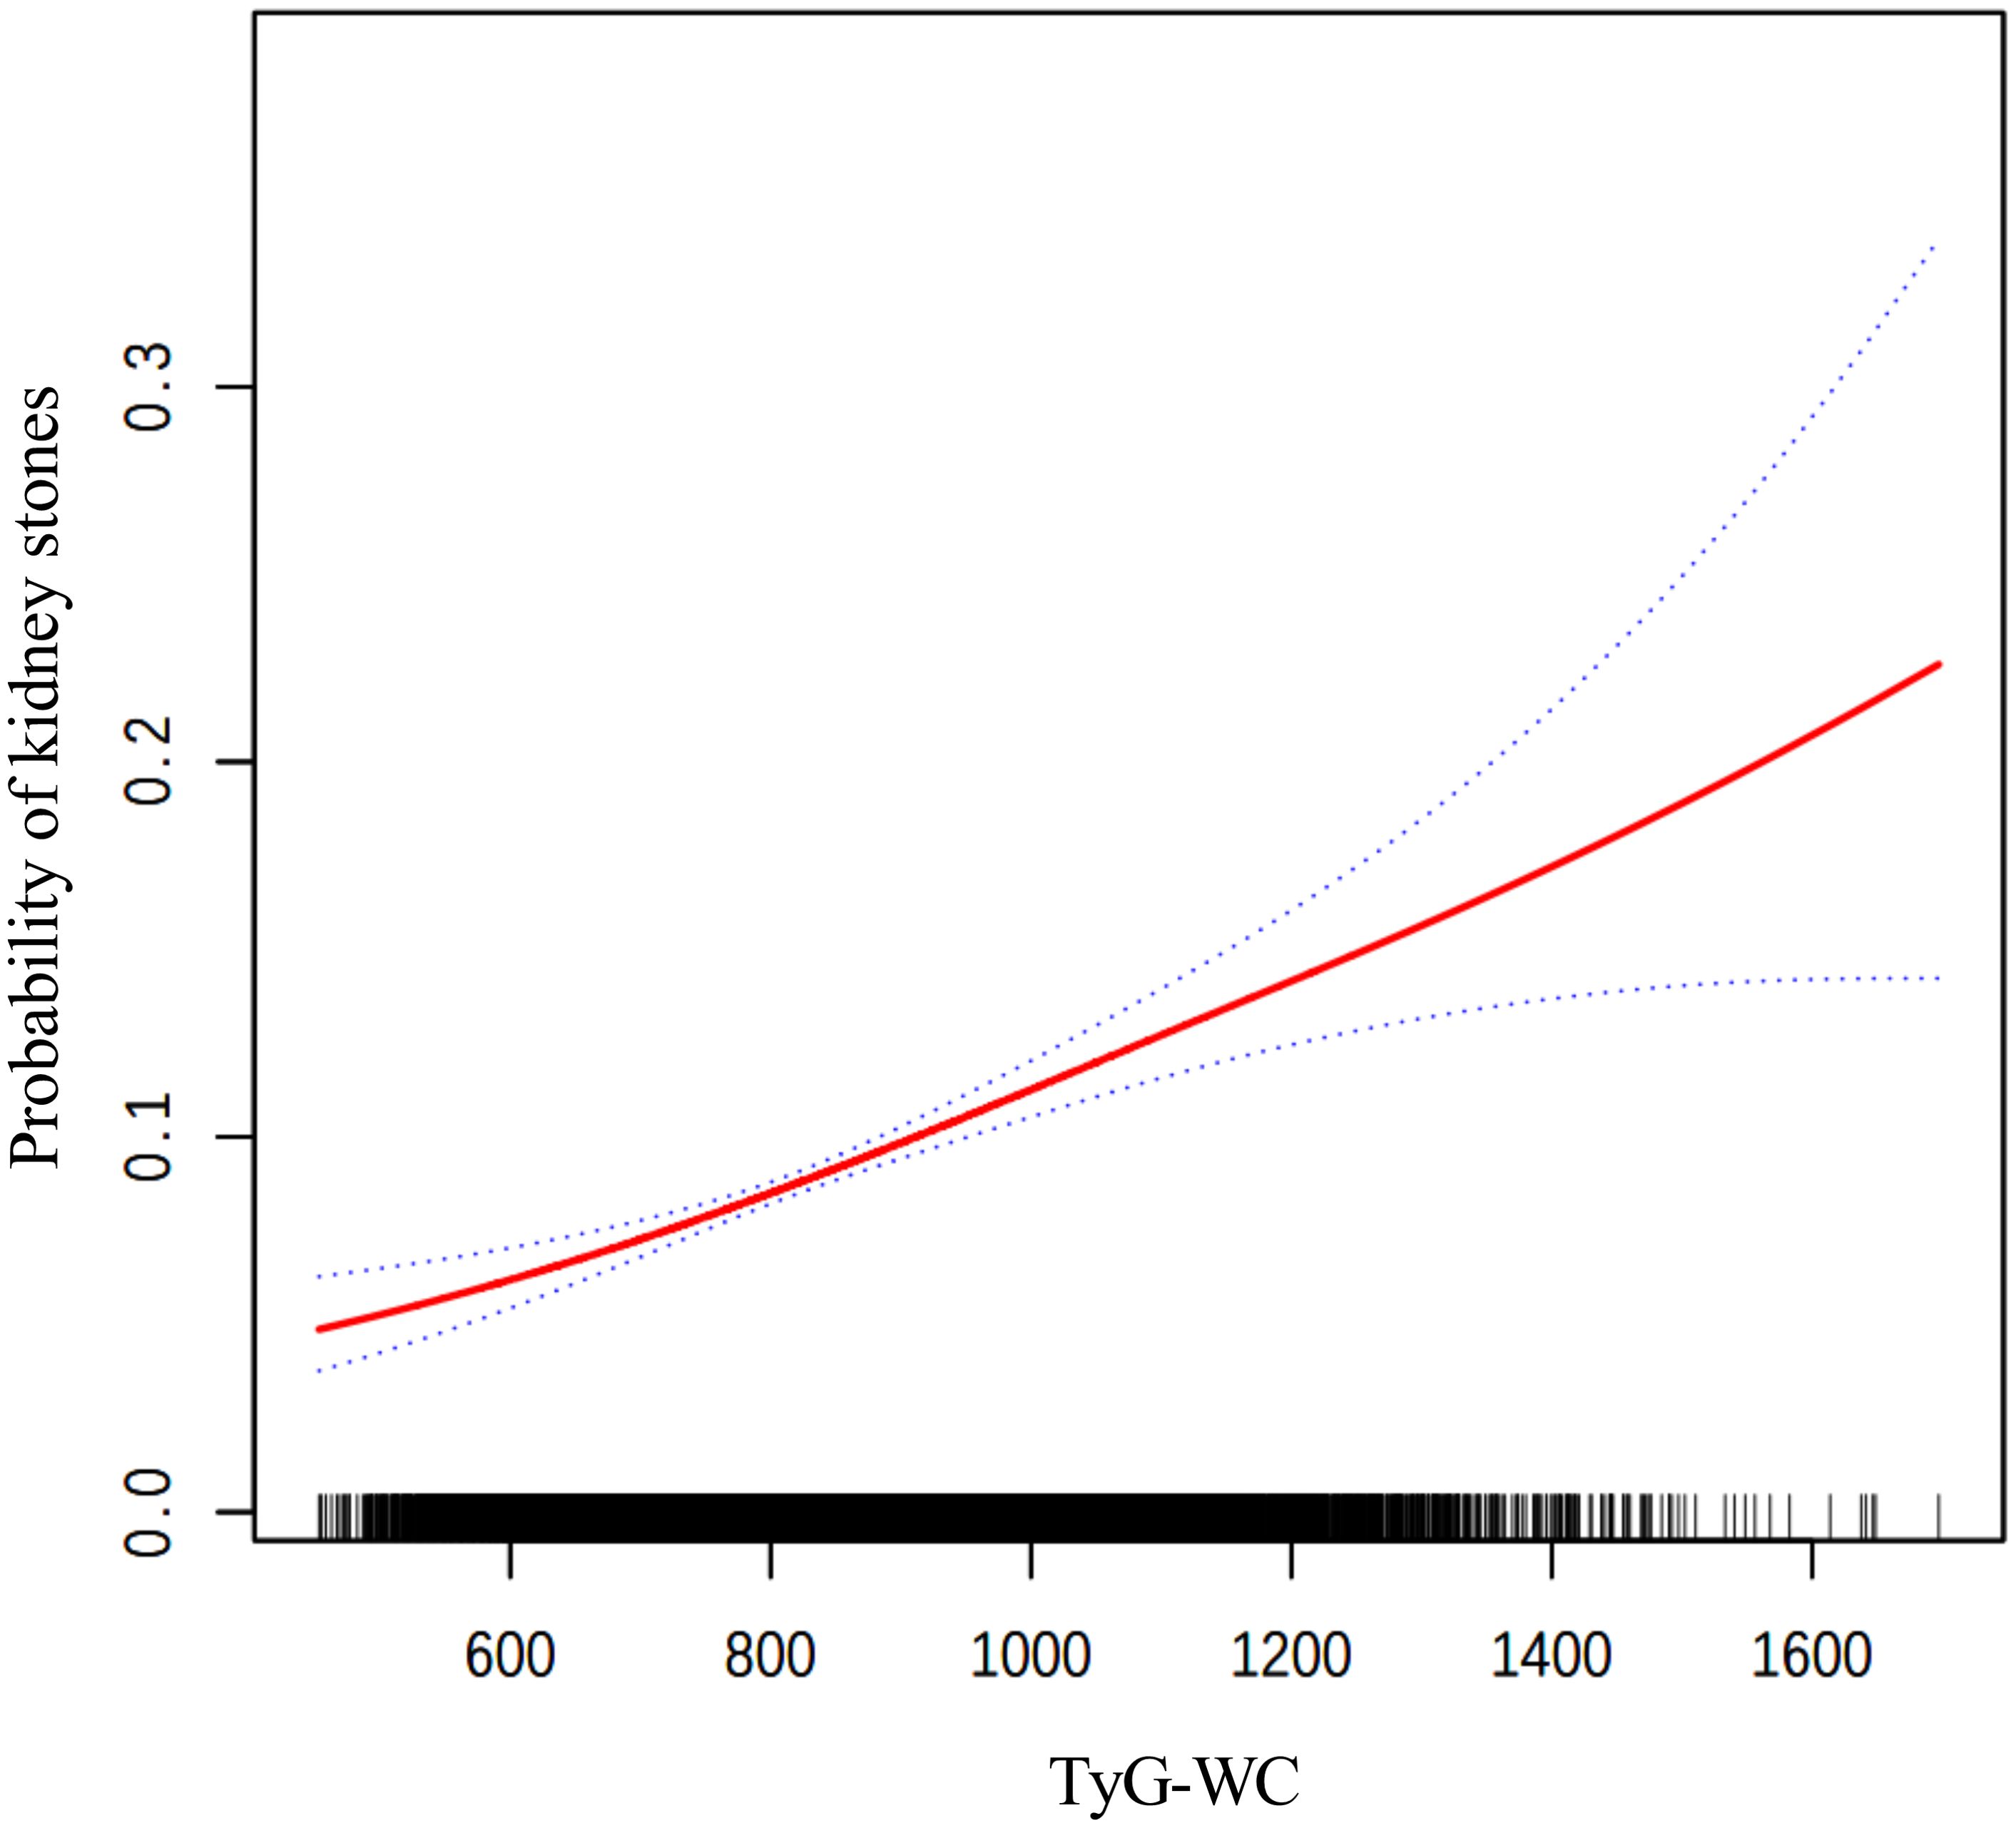
Figure 3. The smooth curve fitting between TyG-WC and kidney stones. Adjusted for: age, gender, race, marital status, poverty-income ratio, physical activity, smoking status, alcohol consumption, hypertension, and diabetes.
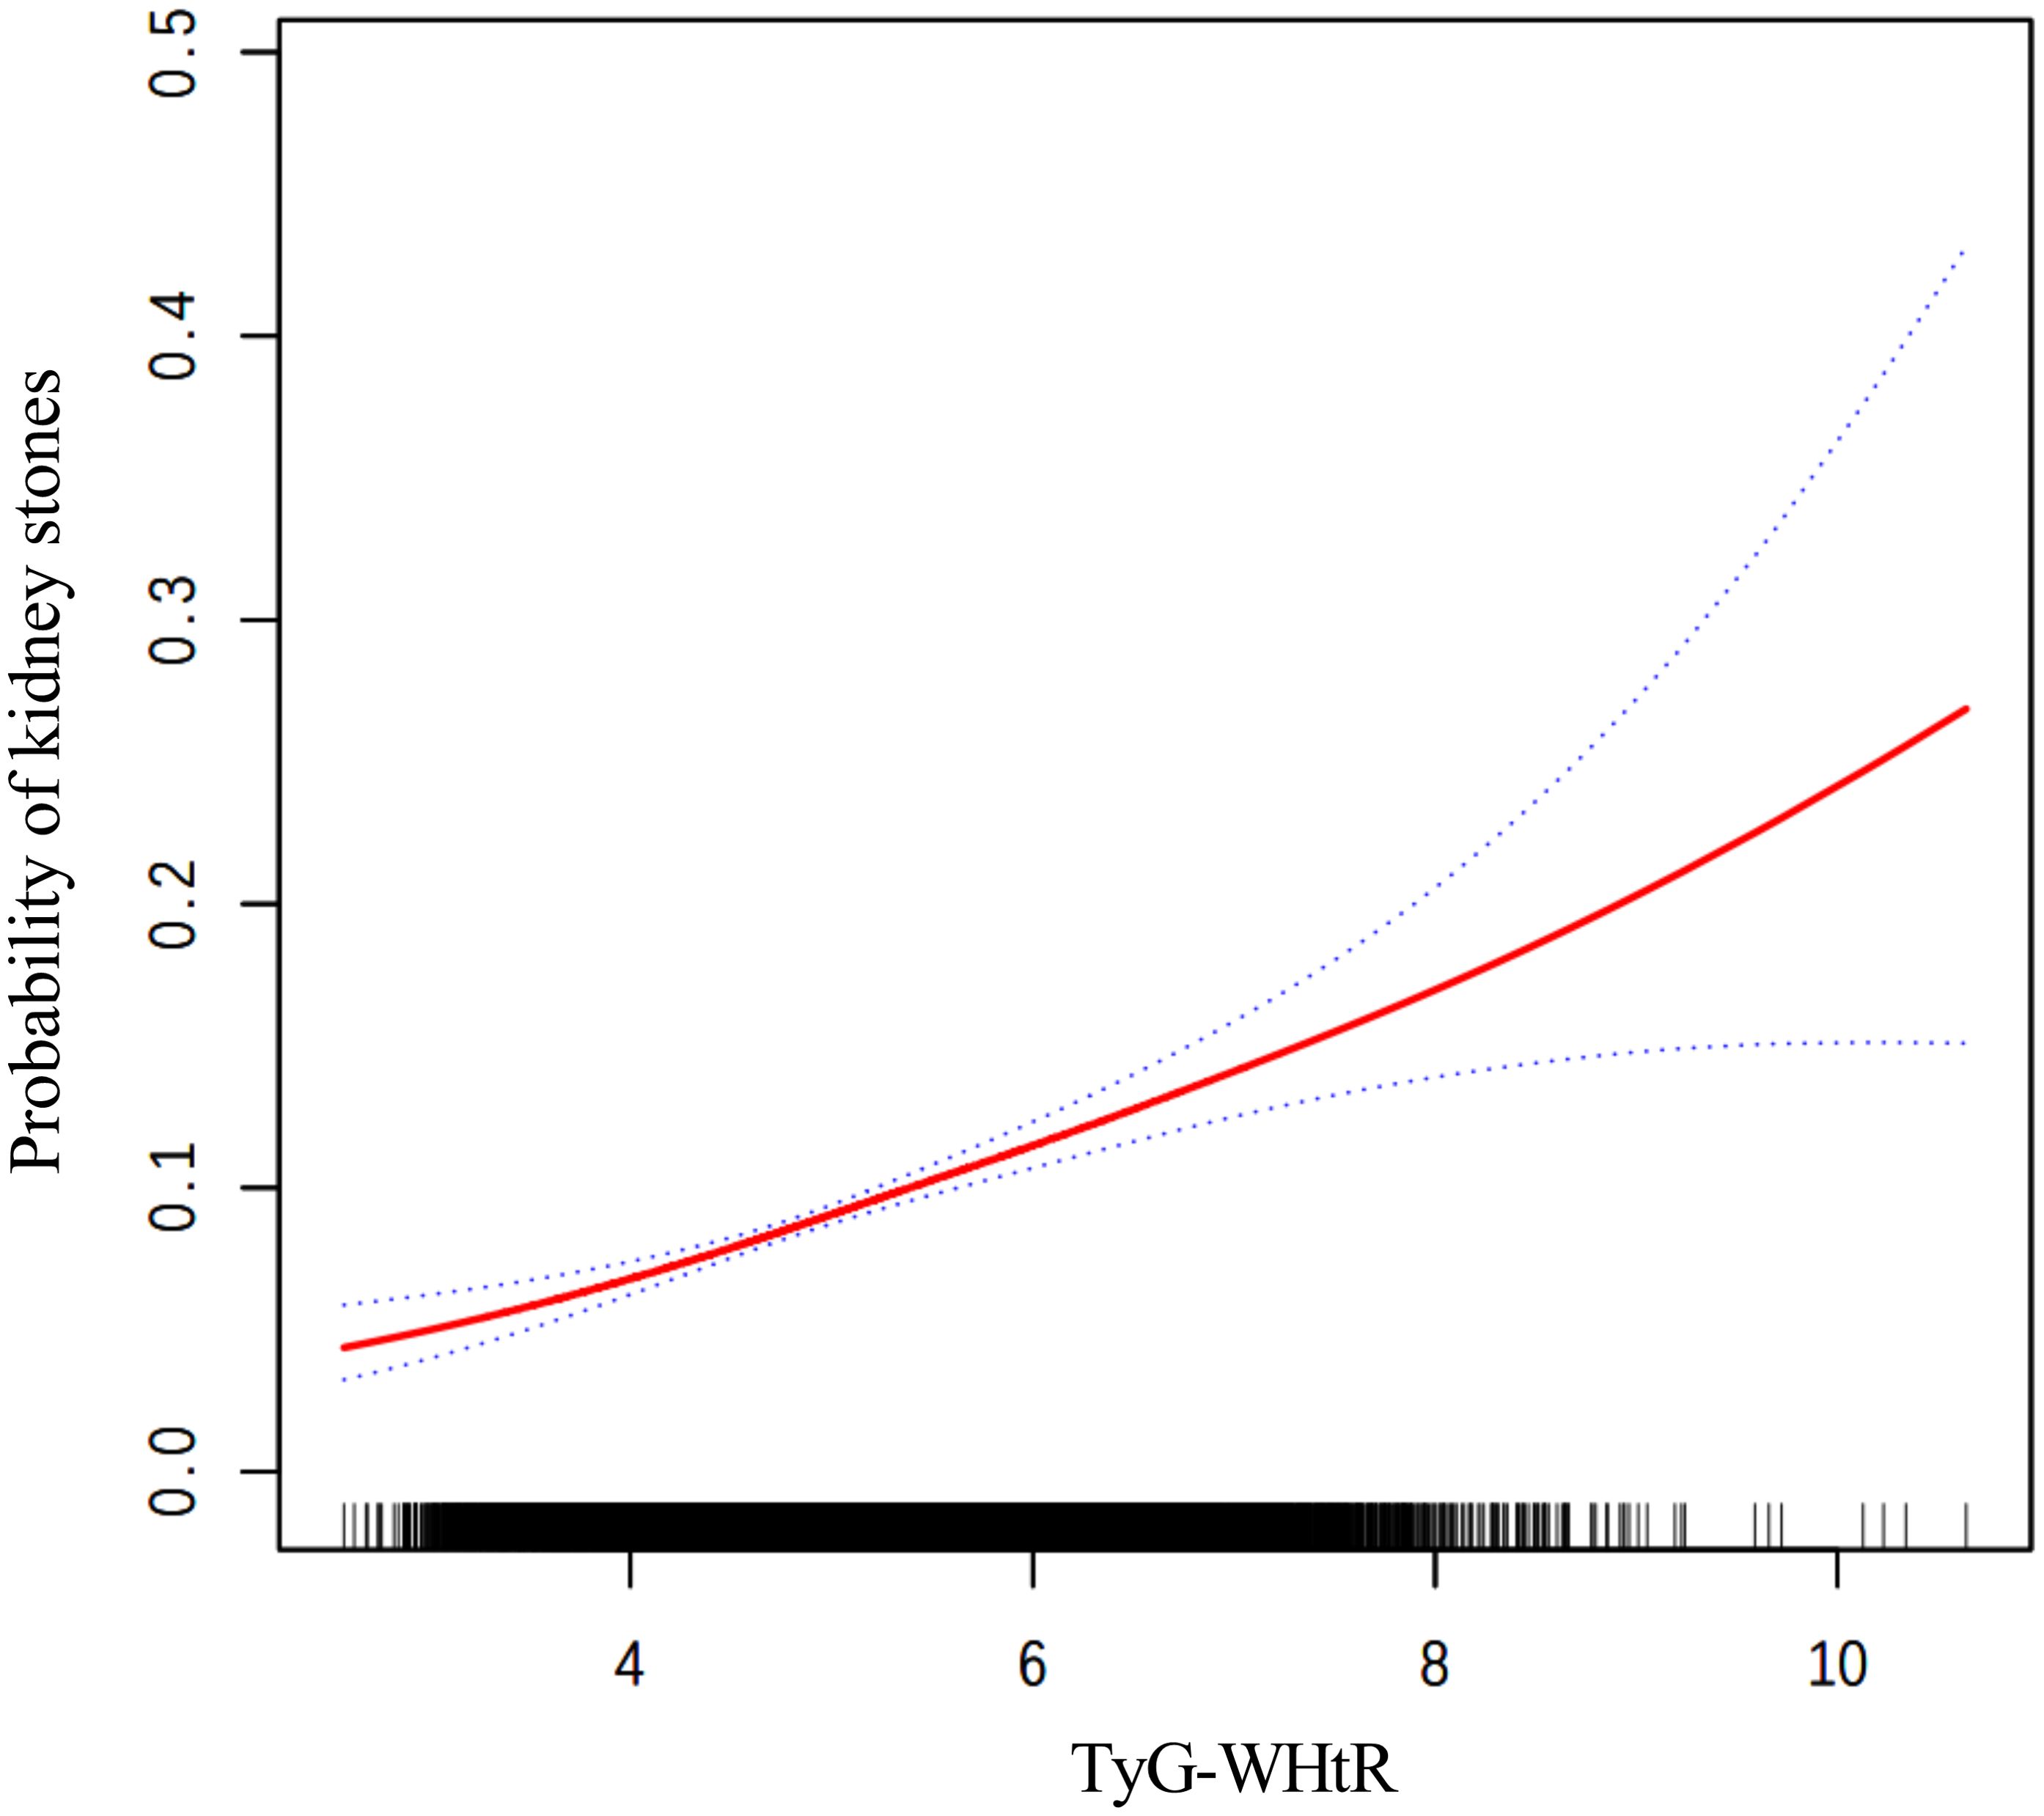
Figure 4. The smooth curve fitting between TyG-WHtR and kidney stones. Adjusted for: age, gender, race, marital status, poverty-income ratio, physical activity, smoking status, alcohol consumption, hypertension, and diabetes.
3.3 Subgroup analysis
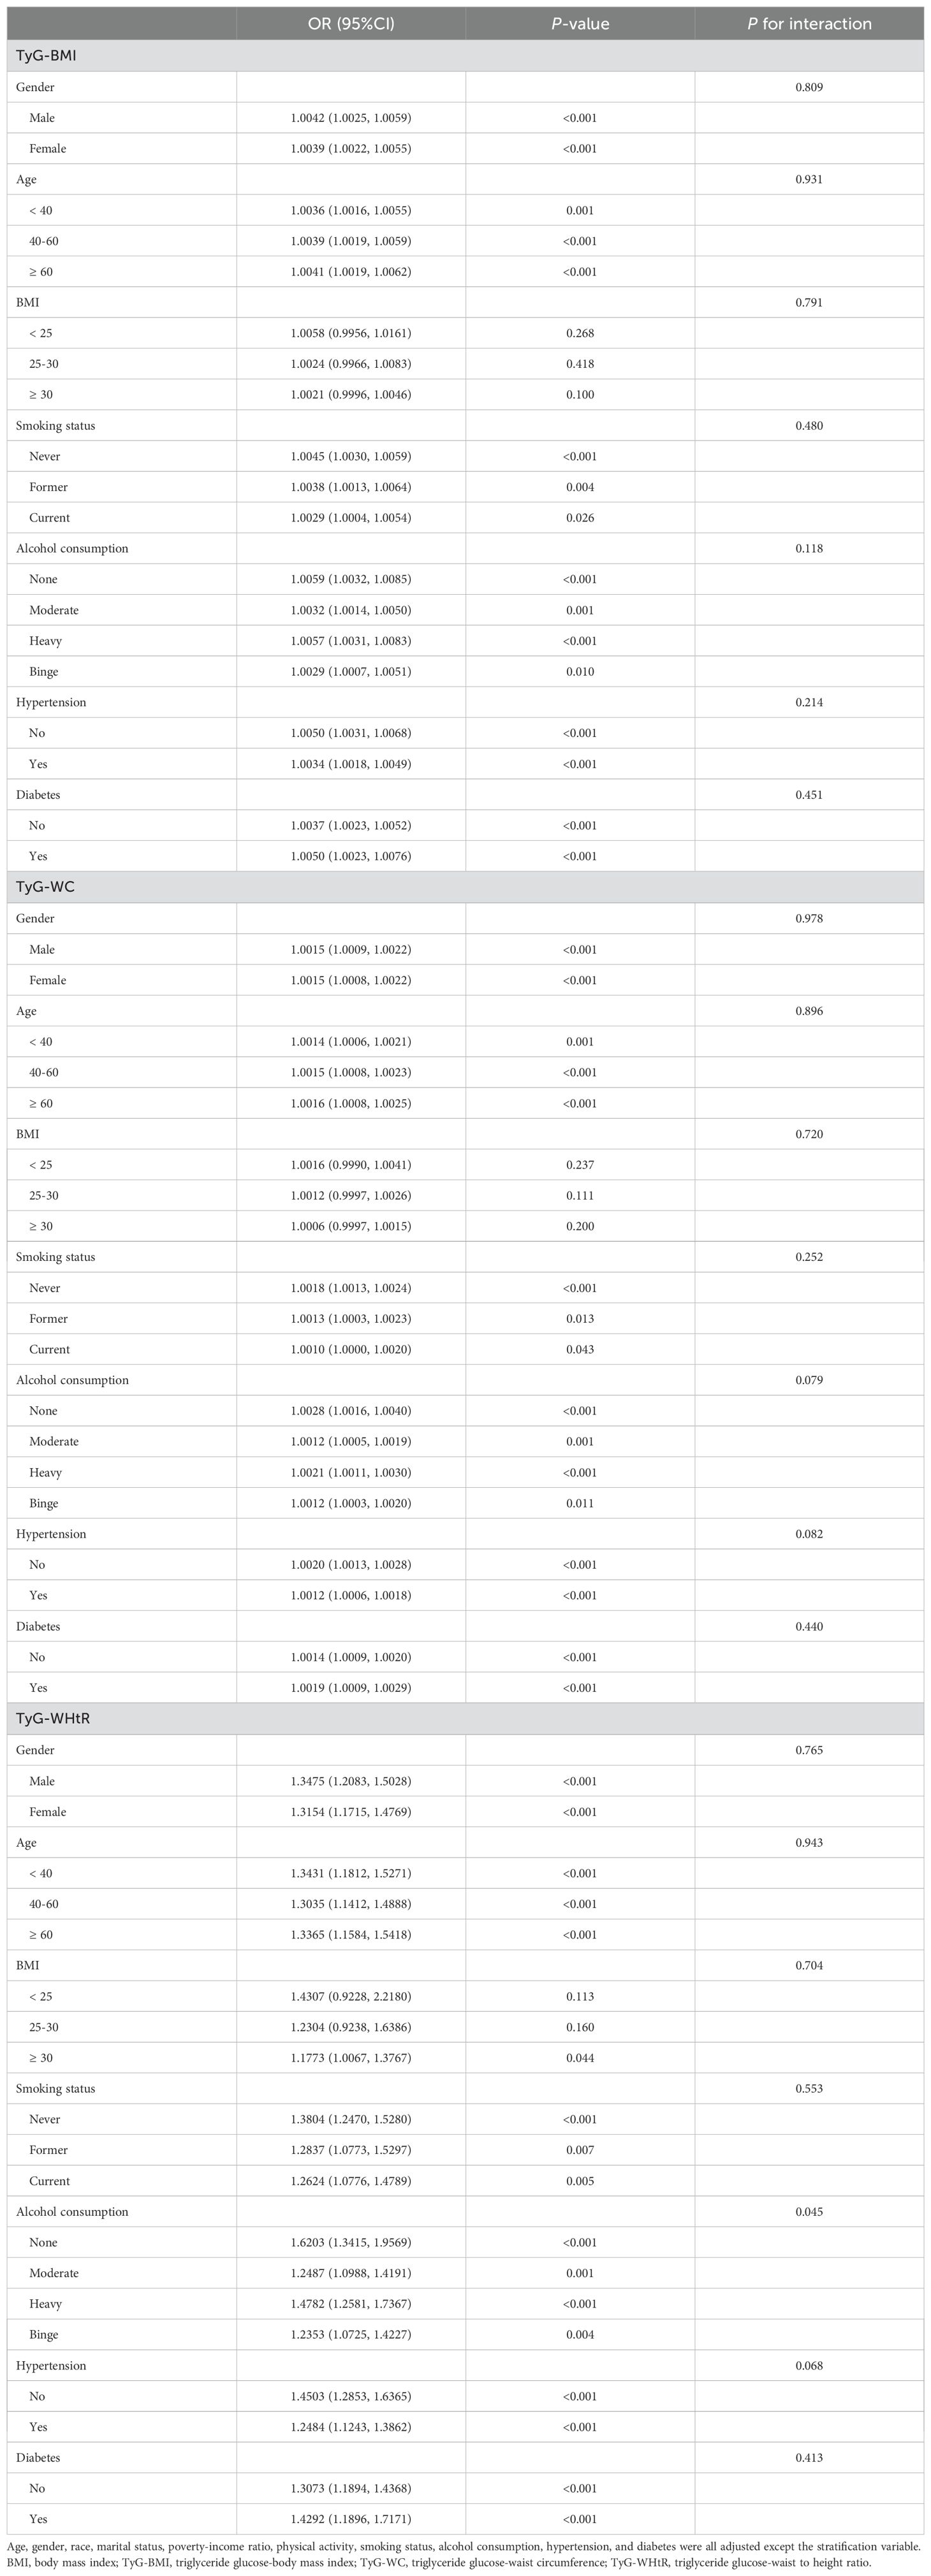
The subgroup analysis results presented in Table 6 indicate that the associations between TyG-BMI, TyG-WC, and TyG-WHtR with kidney stones were statistically significant across most subgroups, including gender, age, BMI, smoking status, alcohol consumption, hypertension, and diabetes (P < 0.05). The associations remained largely consistent without significant interaction effects for most variables (P for interaction > 0.05). However, a significant interaction was observed between alcohol consumption and TyG-WHtR (P for interaction = 0.045).
3.4 Comparison of TyG-related indices in predicting kidney stones
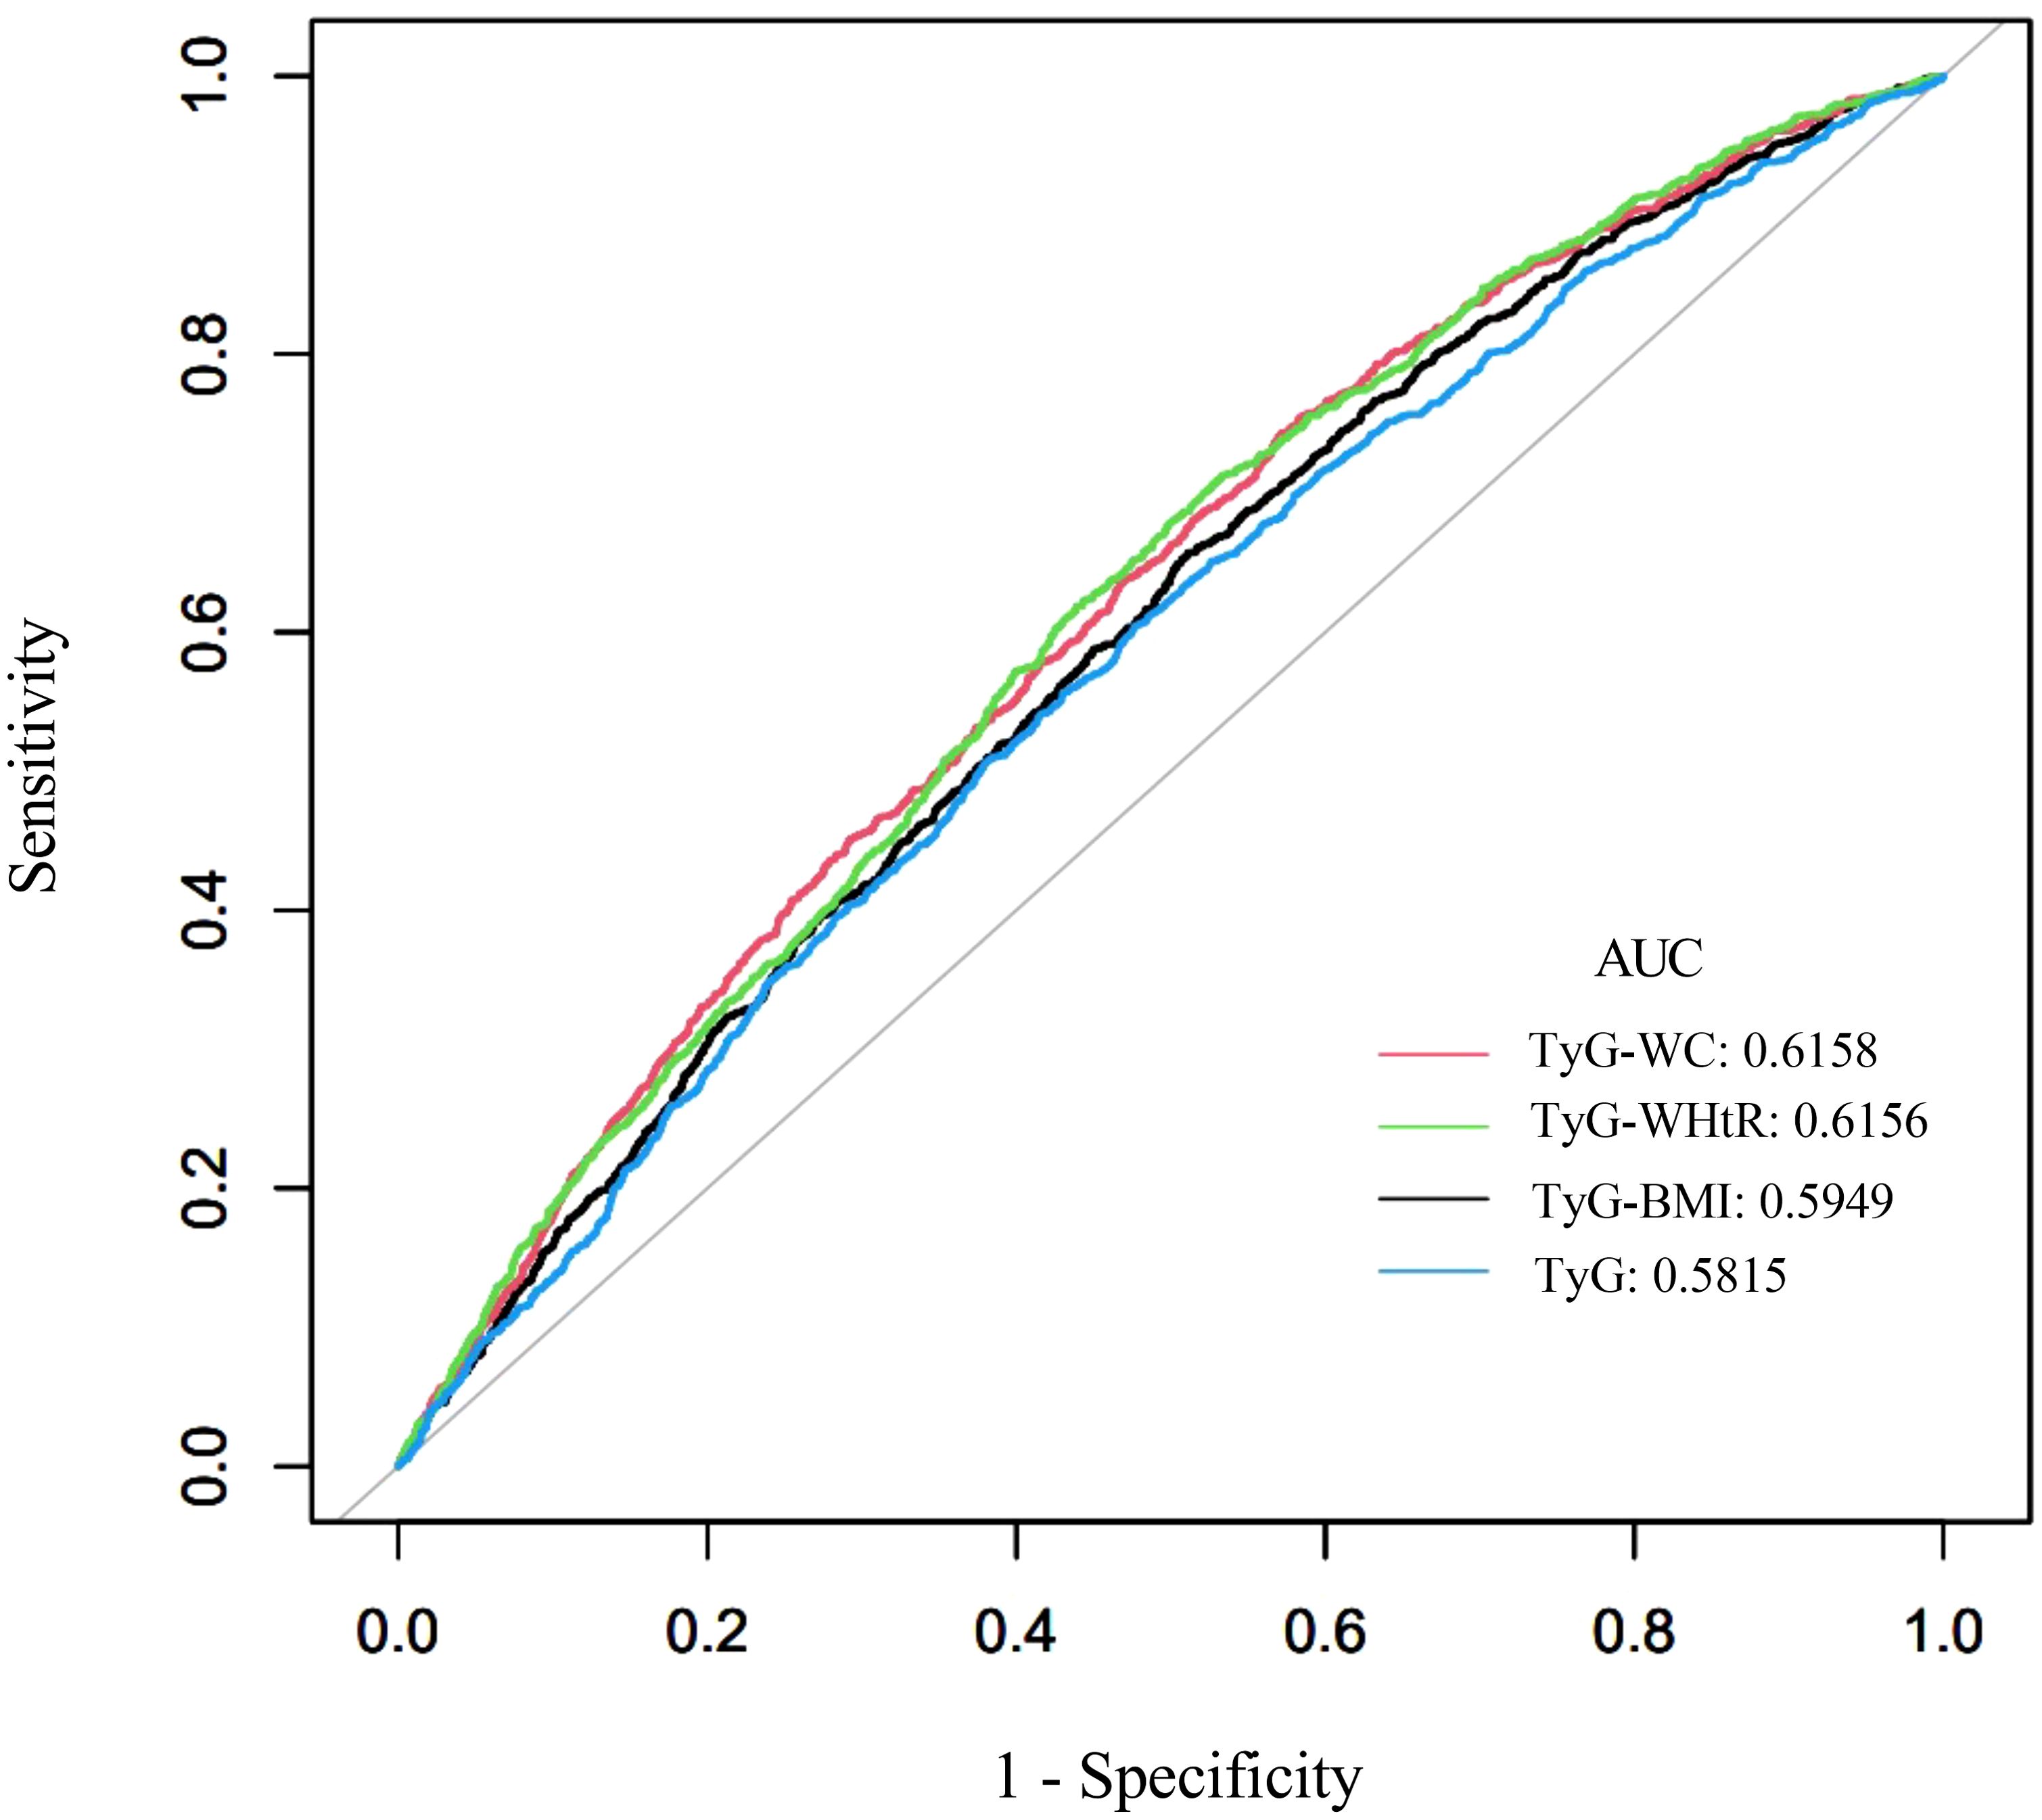
The diagnostic performance of TyG-related indices (TyG, TyG-BMI, TyG-WC, and TyG-WHtR) in predicting kidney stones was assessed using area under the curve (AUC) values, as shown in Figure 5 (ROC curves) and Table 7. Among all indices, TyG-WC demonstrated the highest predictive capability, with an AUC of 0.6158, closely followed by TyG-WHtR (AUC = 0.6156). TyG-BMI showed slightly lower predictive power (AUC = 0.5949), while TyG itself had the lowest AUC (0.5815). Sensitivity was highest for TyG-WC (0.7434), and specificity was greatest for TyG (0.5235). The cutoff values for the indices varied, with TyG-WC at 802.9051, TyG-WHtR at 4.8833, TyG-BMI at 236.6537, and TyG at 8.5577. These findings suggest that TyG-WC and TyG-WHtR have slightly better predictive performance than TyG and TyG-BMI.
4 Discussion
This study investigated the associations between TyG-related indices (TyG-BMI, TyG-WC, and TyG-WHtR) and the risk of kidney stones using a large, nationally representative dataset. The findings demonstrated that higher levels of all three TyG-related indices were significantly associated with an increased likelihood of kidney stone formation. Among the indices, TyG-WC and TyG-WHtR exhibited the strongest predictive ability, as reflected by their higher AUC values compared to TyG-BMI and the TyG index alone. Additionally, the subgroup analysis indicated that these associations were consistent across various demographic and clinical subgroups, with no significant interactions observed for most variables, except for alcohol consumption, which showed a significant interaction with TyG-WHtR. These findings suggest that TyG-related indices, especially TyG-WC and TyG-WHtR, may serve as useful markers for assessing kidney stone risk in clinical practice.
The findings of our study align with previous research highlighting the positive association between the TyG index and its related indices with kidney stone formation. In earlier studies, Jiang et al (15). and Qin et al (16). demonstrated that elevated TyG index values are significantly associated with a higher risk of nephrolithiasis. Notably, as shown in Table 1, our findings revealed that participants with kidney stones exhibited characteristics consistent with metabolic syndrome. Specifically, the kidney stone group displayed significantly greater waist circumference, elevated fasting glucose levels, adverse lipid profiles (higher triglycerides and lower HDL-C), and a higher prevalence of hypertension and diabetes, all of which align with the established diagnostic criteria for metabolic syndrome (33, 34). This observed association between kidney stones and metabolic disturbances is consistent with findings from recent studies. These studies (14, 33–37) have demonstrated that metabolic syndrome increases kidney stone risk through various pathophysiological mechanisms, including altered urinary composition, heightened oxidative stress, and systemic inflammation. These findings underscore the importance of recognizing metabolic syndrome as a significant risk factor in the management of kidney stone disease. Furthermore, our study extends these findings by confirming the associations between kidney stones and TyG-related indices, particularly TyG-WC and TyG-WHtR, which combine anthropometric data with metabolic markers, potentially offering a more accurate reflection of metabolic dysfunction than the TyG index alone (10, 38).
Obesity, particularly severe obesity (BMI ≥35), is associated with increased morbidity and mortality, as well as various complications, including cardiovascular disease, type 2 diabetes mellitus, kidney stones, and others (39). Given these associations, we combined different obesity-related indices (BMI, WC, and WHtR) with the TyG index to evaluate their associations with kidney stones. Moreover, our study further explores the distinct predictive capabilities of different TyG-related indices. We found that TyG-WC and TyG-WHtR were more strongly associated with kidney stone risk compared to TyG-BMI, reinforcing the hypothesis that abdominal obesity, as measured by WC and WHtR, may better capture the metabolic disturbances underlying IR (40, 41). Recent evidence indicates that gastrointestinal hormones, particularly ghrelin secreted by the gastric fundus, play a pivotal role in glucose homeostasis and metabolic regulation (42). In obesity, the dysregulation of these hormones may contribute to insulin resistance and impaired glucose metabolism, both key components of metabolic syndrome that are strongly linked to kidney stone formation. Visceral adiposity, particularly in the abdominal region, has been strongly linked to metabolic syndrome and is believed to play a critical role in IR. Visceral fat is metabolically active, secreting pro-inflammatory cytokines that exacerbate systemic inflammation and disrupt renal calcium handling, which can lead to nephrolithiasis (43–46). This is supported by earlier studies indicating that WC, rather than overall BMI, may be a more reliable predictor of metabolic disorders and related complications, including kidney stones (47, 48).
The AUC values for TyG-related indices (ranging from 0.5815 to 0.6158) in our study suggest modest predictive capability for kidney stone formation. These relatively low AUC values likely reflect the complex and multifactorial nature of kidney stone disease, which involves diverse pathophysiological mechanisms, environmental influences, and genetic predispositions. While TyG-related indices may serve as accessible markers of insulin resistance and its potential role in kidney stone risk, they capture only one facet of this intricate pathogenic process. Other critical factors, such as dietary habits, fluid intake, urinary pH, mineral metabolism, and genetic predisposition, also play significant roles in stone formation but are not accounted for by these indices. Consequently, these markers should be viewed as complementary tools rather than standalone predictors for kidney stone risk assessment. Future studies integrating TyG-related indices with other established risk factors may enhance the overall predictive accuracy for kidney stone formation.
In addition to confirming the association between TyG-related indices and kidney stone formation, our study also identified a novel interaction between alcohol consumption and TyG-WHtR. This significant interaction suggests that lifestyle factors may modify the relationship between metabolic dysfunction and stone formation. This finding has not been well explored in previous studies but may indicate that alcohol consumption interacts with IR by exacerbating oxidative stress and altering lipid metabolism, both of which could influence stone risk (49–51). Studies (52–55) on alcohol’s effect on metabolic health suggest that while moderate alcohol consumption may have protective cardiovascular effects, excessive intake can lead to increased triglyceride levels and systemic inflammation, both of which could contribute to kidney stone formation. However, the precise mechanisms behind this interaction remain unclear, and further research is necessary to elucidate how alcohol modulates the risk of nephrolithiasis in individuals with high TyG-related indices.
Despite the valuable findings, our study has several limitations. The cross-sectional design prevents us from establishing a causal relationship between IR and kidney stone formation. Additionally, the use of self-reported kidney stone history introduces the potential for recall bias, which may affect the reliability of our results. Furthermore, the study population was limited to a single ethnic group, potentially impacting the generalizability of the findings to other populations. Moreover, several potential confounding factors were not evaluated in this study, including elevated serum uric acid levels, calcium metabolism disorders, diuretic use, and genetic predisposition. Recent studies (56–58) have demonstrated associations between these factors and kidney stone formation; therefore, their omission may have introduced bias into our findings. Future research should consider these potential confounding variables, employ longitudinal designs to establish causality, use objective measures of kidney stone incidence, and more comprehensively account for dietary and lifestyle factors. Expanding studies to include diverse populations will also enhance the applicability of the findings.
5 Conclusions
This study demonstrates a significant association between TyG-related indices (TyG-BMI, TyG-WC, TyG-WHtR) and kidney stone formation. These indices effectively reflect the link between IR and kidney stone risk. Future research should include cohort studies that account for additional lifestyle and genetic factors to provide a deeper understanding of these associations.
Data availability statement
The original contributions presented in the study are included in the article/supplementary material. Further inquiries can be directed to the corresponding author.
Ethics statement
The studies involving humans were approved by The National Center for Health Statistics (NCHS) Ethics Review Board. The studies were conducted in accordance with the local legislation and institutional requirements. The participants provided their written informed consent to participate in this study.
Author contributions
ML: Conceptualization, Data curation, Formal Analysis, Investigation, Methodology, Project administration, Software, Writing – original draft, Writing – review & editing. PY: Data curation, Resources, Supervision, Validation, Writing – review & editing. YG: Conceptualization, Methodology, Resources, Supervision, Validation, Visualization, Writing – review & editing.
Funding
The author(s) declare that no financial support was received for the research, authorship, and/or publication of this article.
Conflict of interest
The authors declare that the research was conducted in the absence of any commercial or financial relationships that could be construed as a potential conflict of interest.
Generative AI statement
The author(s) declare that no Generative AI was used in the creation of this manuscript.
Publisher’s note
All claims expressed in this article are solely those of the authors and do not necessarily represent those of their affiliated organizations, or those of the publisher, the editors and the reviewers. Any product that may be evaluated in this article, or claim that may be made by its manufacturer, is not guaranteed or endorsed by the publisher.
Abbreviations
TyG, Triglyceride-glucose; WHtR, waist-to-height ratio; WC, waist circumference; TyG-BMI, Triglyceride-glucose body mass index; TyG-WC, Triglyceride-glucose waist circumference; TyG-WHtR, Triglyceride-glucose waist-to-height ratio; IR, Insulin resistance; NHANES, National Health and Nutrition Examination Survey; CDC, Centers for Disease Control and Prevention; NCHS, National Center for Health Statistics; PIR, poverty-income ratio; NIAAA, National Institute on Alcohol Abuse and Alcoholism; SE, standard error; OR, Odds ratio; CI, Confidence interval; ROC, Receiver operating characteristic; AUC, Area under the curve.
References
1. Abufaraj M, Xu T, Cao C, Waldhoer T, Seitz C, D’Andrea D, et al. Prevalence and trends in kidney stone among adults in the USA: analyses of national health and nutrition examination survey 2007-2018 data. Eur Urol Focus. (2021) 7:1468–75. doi: 10.1016/j.euf.2020.08.011
2. Thongprayoon C, Krambeck AE, Rule AD. Determining the true burden of kidney stone disease. Nat Rev Nephrol. (2020) 16:736–46. doi: 10.1038/s41581-020-0320-7
3. Zisman AL. Effectiveness of treatment modalities on kidney stone recurrence. Clin J Am Soc Nephrol. (2017) 12:1699–708. doi: 10.2215/cjn.11201016
4. Scales CD Jr., Tasian GE, Schwaderer AL, Goldfarb DS, Star RA, Kirkali Z. Urinary stone disease: advancing knowledge, patient care, and population health. Clin J Am Soc Nephrol. (2016) 11:1305–12. doi: 10.2215/cjn.13251215
5. Saigal CS, Joyce G, Timilsina AR. Direct and indirect costs of nephrolithiasis in an employed population: opportunity for disease management? Kidney Int. (2005) 68:1808–14. doi: 10.1111/j.1523-1755.2005.00599.x
6. Alelign T, Petros B. Kidney stone disease: an update on current concepts. Adv Urol. (2018) 2018:3068365. doi: 10.1155/2018/3068365
7. Khan SR, Pearle MS, Robertson WG, Gambaro G, Canales BK, Doizi S, et al. Kidney stones. Nat Rev Dis Primers. (2016) 2:16008. doi: 10.1038/nrdp.2016.8
8. Johnson RJ, Perez-Pozo SE, Lillo JL, Grases F, Schold JD, Kuwabara M, et al. Fructose increases risk for kidney stones: potential role in metabolic syndrome and heat stress. BMC Nephrol. (2018) 19:315. doi: 10.1186/s12882-018-1105-0
9. Guerrero-Romero F, Simental-Mendía LE, González-Ortiz M, Martínez-Abundis E, Ramos-Zavala MG, Hernández-González SO, et al. The product of triglycerides and glucose, a simple measure of insulin sensitivity. Comparison with the euglycemic-hyperinsulinemic clamp. J Clin Endocrinol Metab. (2010) 95:3347–51. doi: 10.1210/jc.2010-0288
10. Gui J, Li Y, Liu H, Guo LL, Li J, Lei Y, et al. Obesity- and lipid-related indices as a predictor of obesity metabolic syndrome in a national cohort study. Front Public Health. (2023) 11:1073824. doi: 10.3389/fpubh.2023.1073824
11. Er LK, Wu S, Chou HH, Hsu LA, Teng MS, Sun YC, et al. Triglyceride glucose-body mass index is a simple and clinically useful surrogate marker for insulin resistance in nondiabetic individuals. PloS One. (2016) 11:e0149731. doi: 10.1371/journal.pone.0149731
12. Mirr M, Braszak-Cymerman A, Ludziejewska A, Kręgielska-Narożna M, Bogdański P, Bryl W, et al. Serum asprosin correlates with indirect insulin resistance indices. Biomedicines. (2023) 11:1568. doi: 10.3390/biomedicines11061568
13. Zheng S, Shi S, Ren X, Han T, Li Y, Chen Y, et al. Triglyceride glucose-waist circumference, a novel and effective predictor of diabetes in first-degree relatives of type 2 diabetes patients: cross-sectional and prospective cohort study. J Transl Med. (2016) 14:260. doi: 10.1186/s12967-016-1020-8
14. Cupisti A, Meola M, D’Alessandro C, Bernabini G, Pasquali E, Carpi A, et al. Insulin resistance and low urinary citrate excretion in calcium stone formers. BioMed Pharmacother. (2007) 61:86–90. doi: 10.1016/j.biopha.2006.09.012
15. Jiang H, Li L, Liu J, Xu B, Chen S, Zhu W, et al. Triglyceride-glucose index as a novel biomarker in the occurrence of kidney stones: A cross-sectional population-based study. Int J Gen Med. (2021) 14:6233–44. doi: 10.2147/ijgm.S334821
16. Qin Z, Zhao J, Geng J, Chang K, Liao R, Su B. Higher triglyceride-glucose index is associated with increased likelihood of kidney stones. Front Endocrinol (Lausanne). (2021) 12:774567. doi: 10.3389/fendo.2021.774567
17. Nevill AM, Stewart AD, Olds T, Duncan MJ. A new waist-to-height ratio predicts abdominal adiposity in adults. Res Sports Med. (2020) 28:15–26. doi: 10.1080/15438627.2018.1502183
18. Kim JA, Hwang SY, Yu JH, Roh E, Hong SH, Lee YB, et al. Association of the triglyceride and glucose index with low muscle mass: KNHANES 2008-2011. Sci Rep. (2021) 11:450. doi: 10.1038/s41598-020-80305-1
19. Zoch ML, Abou DS, Clemens TL, Thorek DL, Riddle RC. In vivo radiometric analysis of glucose uptake and distribution in mouse bone. Bone Res. (2016) 4:16004. doi: 10.1038/boneres.2016.4
20. Liu XC, He GD, Lo K, Huang YQ, Feng YQ. The triglyceride-glucose index, an insulin resistance marker, was non-linear associated with all-cause and cardiovascular mortality in the general population. Front Cardiovasc Med. (2020) 7:628109. doi: 10.3389/fcvm.2020.628109
21. Khamseh ME, Malek M, Abbasi R, Taheri H, Lahouti M, Alaei-Shahmiri F. Triglyceride glucose index and related parameters (Triglyceride glucose-body mass index and triglyceride glucose-waist circumference) identify nonalcoholic fatty liver and liver fibrosis in individuals with overweight/obesity. Metab Syndr Relat Disord. (2021) 19:167–73. doi: 10.1089/met.2020.0109
22. Malek M, Khamseh ME, Chehrehgosha H, Nobarani S, Alaei-Shahmiri F. Triglyceride glucose-waist to height ratio: a novel and effective marker for identifying hepatic steatosis in individuals with type 2 diabetes mellitus. Endocrine. (2021) 74:538–45. doi: 10.1007/s12020-021-02815-w
23. Jones P, Karim Sulaiman S, Gamage KN, Tokas T, Jamnadass E, Somani BK. Do lifestyle factors including smoking, alcohol, and exercise impact your risk of developing kidney stone disease? Outcomes of a systematic review. J Endourol. (2021) 35:1–7. doi: 10.1089/end.2020.0378
24. Wei B, Tan W, He S, Yang S, Gu C, Wang S. Association between drinking status and risk of kidney stones among United States adults: NHANES 2007-2018. BMC Public Health. (2024) 24:820. doi: 10.1186/s12889-024-18307-1
25. Huang F, Li Y, Cui Y, Zhu Z, Chen J, Zeng F, et al. Relationship between serum testosterone levels and kidney stones prevalence in men. Front Endocrinol (Lausanne). (2022) 13:863675. doi: 10.3389/fendo.2022.863675
26. Li Y, Di X, Liu M, Wei J, Li T, Liao B. Association between daily sitting time and kidney stones based on the National Health and Nutrition Examination Survey (NHANES) 2007-2016: a cross-sectional study. Int J Surg. (2024) 110:4624–32. doi: 10.1097/js9.0000000000001560
27. Huang Y, Wang H, Xu C, Zhou F, Su H, Zhang Y. Associations between smoke exposure and kidney stones: results from the NHANES (2007-2018) and Mendelian randomization analysis. Front Med. (2023) 10:1218051. doi: 10.3389/fmed.2023.1218051
28. Wang DD, Leung CW, Li Y, Ding EL, Chiuve SE, Hu FB, et al. Trends in dietary quality among adults in the United States, 1999 through 2010. JAMA Intern Med. (2014) 174:1587–95. doi: 10.1001/jamainternmed.2014.3422
29. Piercy KL, Troiano RP, Ballard RM, Carlson SA, Fulton JE, Galuska DA, et al. The physical activity guidelines for americans. Jama. (2018) 320:2020–8. doi: 10.1001/jama.2018.14854
30. Kanagasabai T, Ardern CI. Contribution of inflammation, oxidative stress, and antioxidants to the relationship between sleep duration and cardiometabolic health. Sleep. (2015) 38:1905–12. doi: 10.5665/sleep.5238
31. Dirisanala S, Laller S, Ganti N, Taj S, Patel N, Singh Arora K, et al. E-cigarette use and prevalence of lung diseases among the U.S. population: a NHANES survey. J Investig Med. (2023) 71:613–22. doi: 10.1177/10815589231167357
32. Whelton PK, Carey RM, Aronow WS, Casey DE Jr., Collins KJ, Dennison Himmelfarb C, et al. 2017 ACC/AHA/AAPA/ABC/ACPM/AGS/APhA/ASH/ASPC/NMA/PCNA guideline for the prevention, detection, evaluation, and management of high blood pressure in adults: A report of the american college of cardiology/american heart association task force on clinical practice guidelines. Hypertension. (2018) 71:e13–e115. doi: 10.1161/hyp.0000000000000065
33. Chang CW, Ke HL, Lee JI, Lee YC, Jhan JH, Wang HS, et al. Metabolic syndrome increases the risk of kidney stone disease: A cross-sectional and longitudinal cohort study. J Pers Med. (2021) 11:1154. doi: 10.3390/jpm11111154
34. Ramaswamy K, Shah O. Metabolic syndrome and nephrolithiasis. Transl Androl Urol. (2014) 3:285–95. doi: 10.3978/j.issn.2223-4683.2014.06.03
35. Adomako EA, Li X, Sakhaee K, Moe OW, Maalouf NM. Urine pH and citrate as predictors of calcium phosphate stone formation. Kidney360. (2023) 4:1123–9. doi: 10.34067/kid.0000000000000184
36. Eckel RH, Grundy SM, Zimmet PZ. The metabolic syndrome. Lancet. (2005) 365:1415–28. doi: 10.1016/s0140-6736(05)66378-7
37. Ando R, Suzuki S, Nagaya T, Yamada T, Okada A, Yasui T, et al. Impact of insulin resistance, insulin and adiponectin on kidney stones in the Japanese population. Int J Urol. (2011) 18:131–8. doi: 10.1111/j.1442-2042.2010.02690.x
38. Lim J, Kim J, Koo SH, Kwon GC. Comparison of triglyceride glucose index, and related parameters to predict insulin resistance in Korean adults: An analysis of the 2007-2010 Korean National Health and Nutrition Examination Survey. PloS One. (2019) 14:e0212963. doi: 10.1371/journal.pone.0212963
39. Mulita F, Lampropoulos C, Kehagias D, Verras GI, Tchabashvili L, Kaplanis C, et al. Long-term nutritional deficiencies following sleeve gastrectomy: a 6-year single-centre retrospective study. Prz Menopauzalny. (2021) 20:170–6. doi: 10.5114/pm.2021.110954
40. Qin JH, Ma JZ, Yang XW, Hu YJ, Zhou J, Fu LC, et al. A triterpenoid inhibited hormone-induced adipocyte differentiation and alleviated dexamethasone-induced insulin resistance in 3T3-L1 adipocytes. Nat Prod Bioprospect. (2015) 5:159–66. doi: 10.1007/s13659-015-0063-5
41. Chen L, Zhang J, Shen K, Zhu Y, Zhang J, Pan J, et al. Kidney stones are associated with metabolic syndrome in a health screening population: a cross-sectional study. Transl Androl Urol. (2023) 12:967–76. doi: 10.21037/tau-23-51
42. Kehagias D, Georgopoulos N, Habeos I, Lampropoulos C, Mulita F, Kehagias I. The role of the gastric fundus in glycemic control. Hormones (Athens). (2023) 22:151–63. doi: 10.1007/s42000-023-00429-7
43. Ahmed MH, Ahmed HT, Khalil AA. Renal stone disease and obesity: what is important for urologists and nephrologists? Ren Fail. (2012) 34:1348–54. doi: 10.3109/0886022x.2012.723777
44. Vahdat S. The complex effects of adipokines in the patients with kidney disease. J Res Med Sci. (2018) 23:60. doi: 10.4103/jrms.JRMS_1115_17
45. Rampanelli E, Orsó E, Ochodnicky P, Liebisch G, Bakker PJ, Claessen N, et al. Metabolic injury-induced NLRP3 inflammasome activation dampens phospholipid degradation. Sci Rep. (2017) 7:2861. doi: 10.1038/s41598-017-01994-9
46. Ferraro PM, Taylor EN, Gambaro G, Curhan GC. Dietary and lifestyle risk factors associated with incident kidney stones in men and women. J Urol. (2017) 198:858–63. doi: 10.1016/j.juro.2017.03.124
47. Lin YA, Chen YJ, Tsao YC, Yeh WC, Li WC, Tzeng IS, et al. Relationship between obesity indices and hypertension among middle-aged and elderly populations in Taiwan: a community-based, cross-sectional study. BMJ Open. (2019) 9:e031660. doi: 10.1136/bmjopen-2019-031660
48. Stefansson VT, Schei J, Jenssen TG, Melsom T, Eriksen BO. Central obesity associates with renal hyperfiltration in the non-diabetic general population: a cross-sectional study. BMC Nephrol. (2016) 17:172. doi: 10.1186/s12882-016-0386-4
49. Newsholme P, Keane KN, Carlessi R, Cruzat V. Oxidative stress pathways in pancreatic β-cells and insulin-sensitive cells and tissues: importance to cell metabolism, function, and dysfunction. Am J Physiol Cell Physiol. (2019) 317:C420–c433. doi: 10.1152/ajpcell.00141.2019
50. Buyco DG, Martin J, Jeon S, Hooks R, Lin C, Carr R. Experimental models of metabolic and alcoholic fatty liver disease. World J Gastroenterol. (2021) 27:1–18. doi: 10.3748/wjg.v27.i1.1
51. Rhee M, Lee J, Lee EY, Yoon KH, Lee SH. Lipid variability induces endothelial dysfunction by increasing inflammation and oxidative stress. Endocrinol Metab (Seoul). (2024) 39:511–20. doi: 10.3803/EnM.2023.1915
52. Shiba S, Nakamoto N, Chu PS, Ojiro K, Taniki N, Yamaguchi A, et al. Acetaldehyde exposure underlies functional defects in monocytes induced by excessive alcohol consumption. Sci Rep. (2021) 11:13690. doi: 10.1038/s41598-021-93086-y
53. Stote KS, Tracy RP, Taylor PR, Baer DJ. The effect of moderate alcohol consumption on biomarkers of inflammation and hemostatic factors in postmenopausal women. Eur J Clin Nutr. (2016) 70:470–4. doi: 10.1038/ejcn.2015.182
54. Cahill PA, Redmond EM. Alcohol and cardiovascular disease–modulation of vascular cell function. Nutrients. (2012) 4:297–318. doi: 10.3390/nu4040297
55. Chang YY, Lin YL, Yang DJ, Liu CW, Hsu CL, Tzang BS, et al. Hepatoprotection of noni juice against chronic alcohol consumption: lipid homeostasis, antioxidation, alcohol clearance, and anti-inflammation. J Agric Food Chem. (2013) 61:11016–24. doi: 10.1021/jf4038419
56. Xu JZ, Lu JL, Hu L, Xun Y, Wan ZC, Xia QD, et al. Sex disparities in the association of serum uric acid with kidney stone: A cross-sectional study in China. Front Med (Lausanne). (2022) 9:774351. doi: 10.3389/fmed.2022.774351
57. Singh P, Harris PC, Sas DJ, Lieske JC. The genetics of kidney stone disease and nephrocalcinosis. Nat Rev Nephrol. (2022) 18:224–40. doi: 10.1038/s41581-021-00513-4
Keywords: kidney stones, TyG index, TyG-BMI, TyG-WC, TyG-WHtR, insulin resistance, NHANES
Citation: Liu M, Yang P and Gou Y (2025) Association between triglyceride glucose index-related indices and kidney stones in adults based on NHANES 2007–2020. Front. Endocrinol. 15:1516982. doi: 10.3389/fendo.2024.1516982
Received: 31 October 2024; Accepted: 17 December 2024;
Published: 07 January 2025.
Edited by:
Francesk Mulita, General Hospital of Eastern Achaia- Unit of Aigio, GreeceReviewed by:
Dimitrios Kehagias, University of Patras, GreeceViola Tzafai, University of Patras, Greece
Copyright © 2025 Liu, Yang and Gou. This is an open-access article distributed under the terms of the Creative Commons Attribution License (CC BY). The use, distribution or reproduction in other forums is permitted, provided the original author(s) and the copyright owner(s) are credited and that the original publication in this journal is cited, in accordance with accepted academic practice. No use, distribution or reproduction is permitted which does not comply with these terms.
*Correspondence: Yunpeng Gou, bHhtMTk5NjEyMDRAMTYzLmNvbQ==
 Ming Liu
 Ping Yang