- 1Department of Gastric and Colorectal Surgery, General Surgery Center, The First Hospital of Jilin University, Changchun, China
- 2Department of Joint Surgery, The First Affiliated Hospital, Sun Yat-sen University, Guangzhou, China
- 3Department of Laboratory Medicine, Med+X Center for Manufacturing, Department of General Surgery, National Clinical Research Center for Geriatrics, West China Hospital, Sichuan University, Chengdu, China
- 4Breast Center, West China Hospital, Sichuan University, Chengdu, China
Background: The association between the triglyceride-glucose (TyG) index and mortality in the general population remains controversial, with inconsistent findings across studies.
Objective: This study aims to investigate the relationship between the TyG index and mortality in the U.S. Additionally, it explores whether a new index, combining the TyG index with the neutrophil-to-lymphocyte ratio (NLR), improves the prediction of all-cause compared to the TyG index alone.
Methods: Systemic inflammatory markers and the TyG index were calculated based on participants’ complete blood counts and fasting triglyceride and glucose levels. The TyG-NLR index was derived by multiplying the TyG index by the NLR. A weighted Cox proportional hazards model was used to evaluate the associations of the TyG and TyG-NLR indices with mortality risk in the general population. Restricted cubic splines (RCS) were applied to explore and visualize the dose-response relationships between the indices and mortality.
Result: This study included 15388 participants. During a median follow-up of 118 months, 2,333 participants died. After adjusting for potential confounders, no significant association was found between the TyG index and mortality. However, compared to the lowest quartile, participants in the highest quartile of the TyG-NLR index showed a significant association with all-cause mortality. Specifically, those in the highest quartile had a 63% higher risk of all-cause mortality.
Introduction
Insulin resistance (IR) is a key feature of metabolic syndrome, characterized by a reduced ability of insulin to promote glucose uptake (1–3). Although the hyperinsulinemic-euglycemic clamp test is the gold standard for measuring IR, it is invasive and unsuitable for clinical studies (4, 5). The triglyceride-glucose (TyG) index, calculated from fasting triglyceride and glucose levels, has been shown to be a valuable alternative indicator of IR (6). Due to its simplicity, accessibility, and low cost, the TyG index is widely used in clinical settings. Several studies have investigated the association between the TyG index and mortality in individuals with metabolic disorders, highlighting its effectiveness in predicting adverse outcomes (7–9). However, factors such as sex, age, race, comorbidities, and income appear to influence the association between the TyG index and all-cause mortality in the general population, leading to inconsistent findings across studies.
To enhance the utility of the index, we took into account the combined impact of IR and systemic inflammation, as these factors are known to synergistically drive the progression of metabolic disorders and the onset of adverse health outcomes (10). In this context, the neutrophil-to-lymphocyte ratio (NLR) has emerged as a vital biomarker for evaluating systemic inflammation. Numerous studies have highlighted the significance of NLR in assessing the severity of inflammatory responses, making it an essential parameter for clinical evaluations (11–13). By addressing the interplay between IR and inflammation, we aimed to improve the predictive power of existing tools. This approach not only underscores the interconnected nature of metabolic and inflammatory pathways but also highlights the importance of utilizing comprehensive biomarkers that reflect multiple physiological processes.
Thus, we developed the TyG-NLR index by combining the TyG index with NLR and evaluated its association with all-cause mortality risk in the general population. This longitudinal cohort study aims to determine whether the TyG-NLR index is more effective than the TyG index alone in predicting all-cause mortality risk in the U.S. general population.
Methods
Data sources and outcome definitions
The National Health and Nutrition Examination Survey (NHANES) is a research program led by the U.S. Centers for Disease Control and Prevention (CDC) to assess the health status of adults and children nationwide. Initiated in 1960, it has operated as a continuous program since 1999, surveying approximately 5,000 individuals annually. The survey collects comprehensive data on demographics, socioeconomic status, diet, and health (14, 15). This study utilized data from 10 NHANES cycles spanning 1999 to 2018. Additionally, NHANES data were linked with the National Death Index (NDI) to obtain follow-up information, including follow-up duration, survival status, and causes of death (16).
The TyG index and TyG-NLR index
The TyG index is calculated by taking the natural logarithm of the product of fasting triglyceride and glucose levels for each participant. Systemic inflammation indicators are derived from complete blood counts. TyG-NLR is obtained by multiplying the TyG index by various systemic inflammation indicators (17). The formulas for these calculations are as follows:
Covariates
The NHANES dataset provided all variables used in this study, including gender, age, race, education level, and socioeconomic status. Other variables included smoking status, alcohol consumption, medical history, medication use, body mass index (BMI), complete blood counts, and biochemical blood tests. Dyslipidemia was defined using multiple parameters: low-density lipoprotein cholesterol (LDL-C) ≥ 3.37 mmol/L, total cholesterol (TC) ≥5.18 mmol/L, triglycerides (TG) ≥ 1.7 mmol/L, and high-density lipoprotein cholesterol (HDL-C) <1.04 mmol/L for men or < 1.30 mmol/L for women (18). The use of lipid-lowering medications was also considered in diagnosing dyslipidemia. Hypertension was defined by an average systolic blood pressure ≥ 140 mmHg and/or diastolic blood pressure ≥ 90 mmHg (19). Diabetes was diagnosed based on physician confirmation, fasting blood glucose ≥ 7.0 mmol/L, HbA1c ≥ 6.5%, or current use of antidiabetic medications (20). Smoking status was classified into never smokers (fewer than 100 cigarettes in a lifetime), former smokers (previously smoked but quit), and current smokers (≥ 100 cigarettes in a lifetime and currently smoking) (21). Alcohol consumption was categorized as heavy drinking (≥ 3 drinks/day for women or ≥ 4 drinks/day for men, or ≥ 5 days/month), moderate drinking (≤ 2 drinks/day for women or ≤ 3 drinks/day for men, or ≥ 2 days/month), light drinking (below moderate or heavy drinking levels), and non-drinkers (lifetime consumption < 12 drinks) (22). Medication use and cancer history were determined via survey responses (23).
Statistical analysis
All analyses were performed using R software (version 4.2.2), with statistical significance set at P < 0.05. Categorical variables are presented as frequencies and percentages, while continuous variables are reported as medians with interquartile ranges (IQR). The Kaplan-Meier method was used to estimate survival probabilities with the log-rank test. We employed three models to assess the impact of potential confounders. Model 1 was unadjusted, Model 2 adjusted for sex and age, and Model 3 further adjusted for race, PIR, education, BMI, smoking status, alcohol consumption, hypertension, diabetes, dyslipidemia, cancer, lipid-lowering medications, ALT, and AST. A restricted cubic spline (RCS) with four knots was used to explore the dose-response relationship between TyG-NLR and mortality.
Results
Participant characteristics
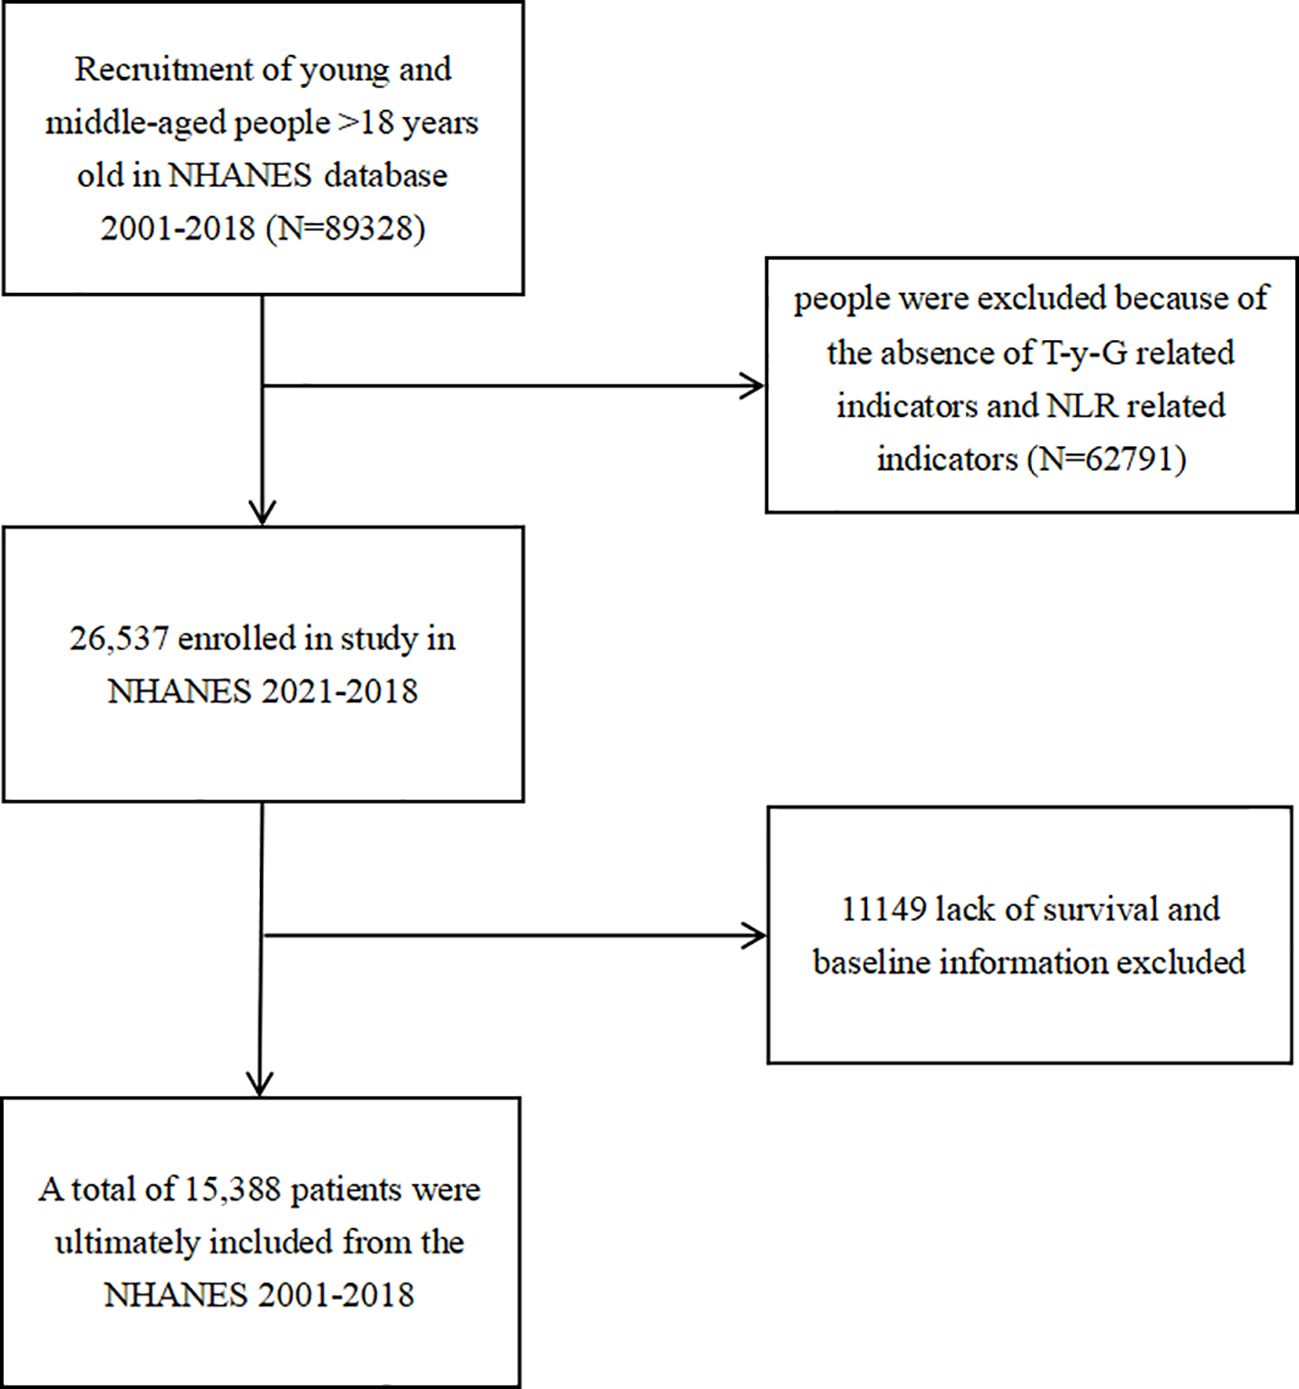
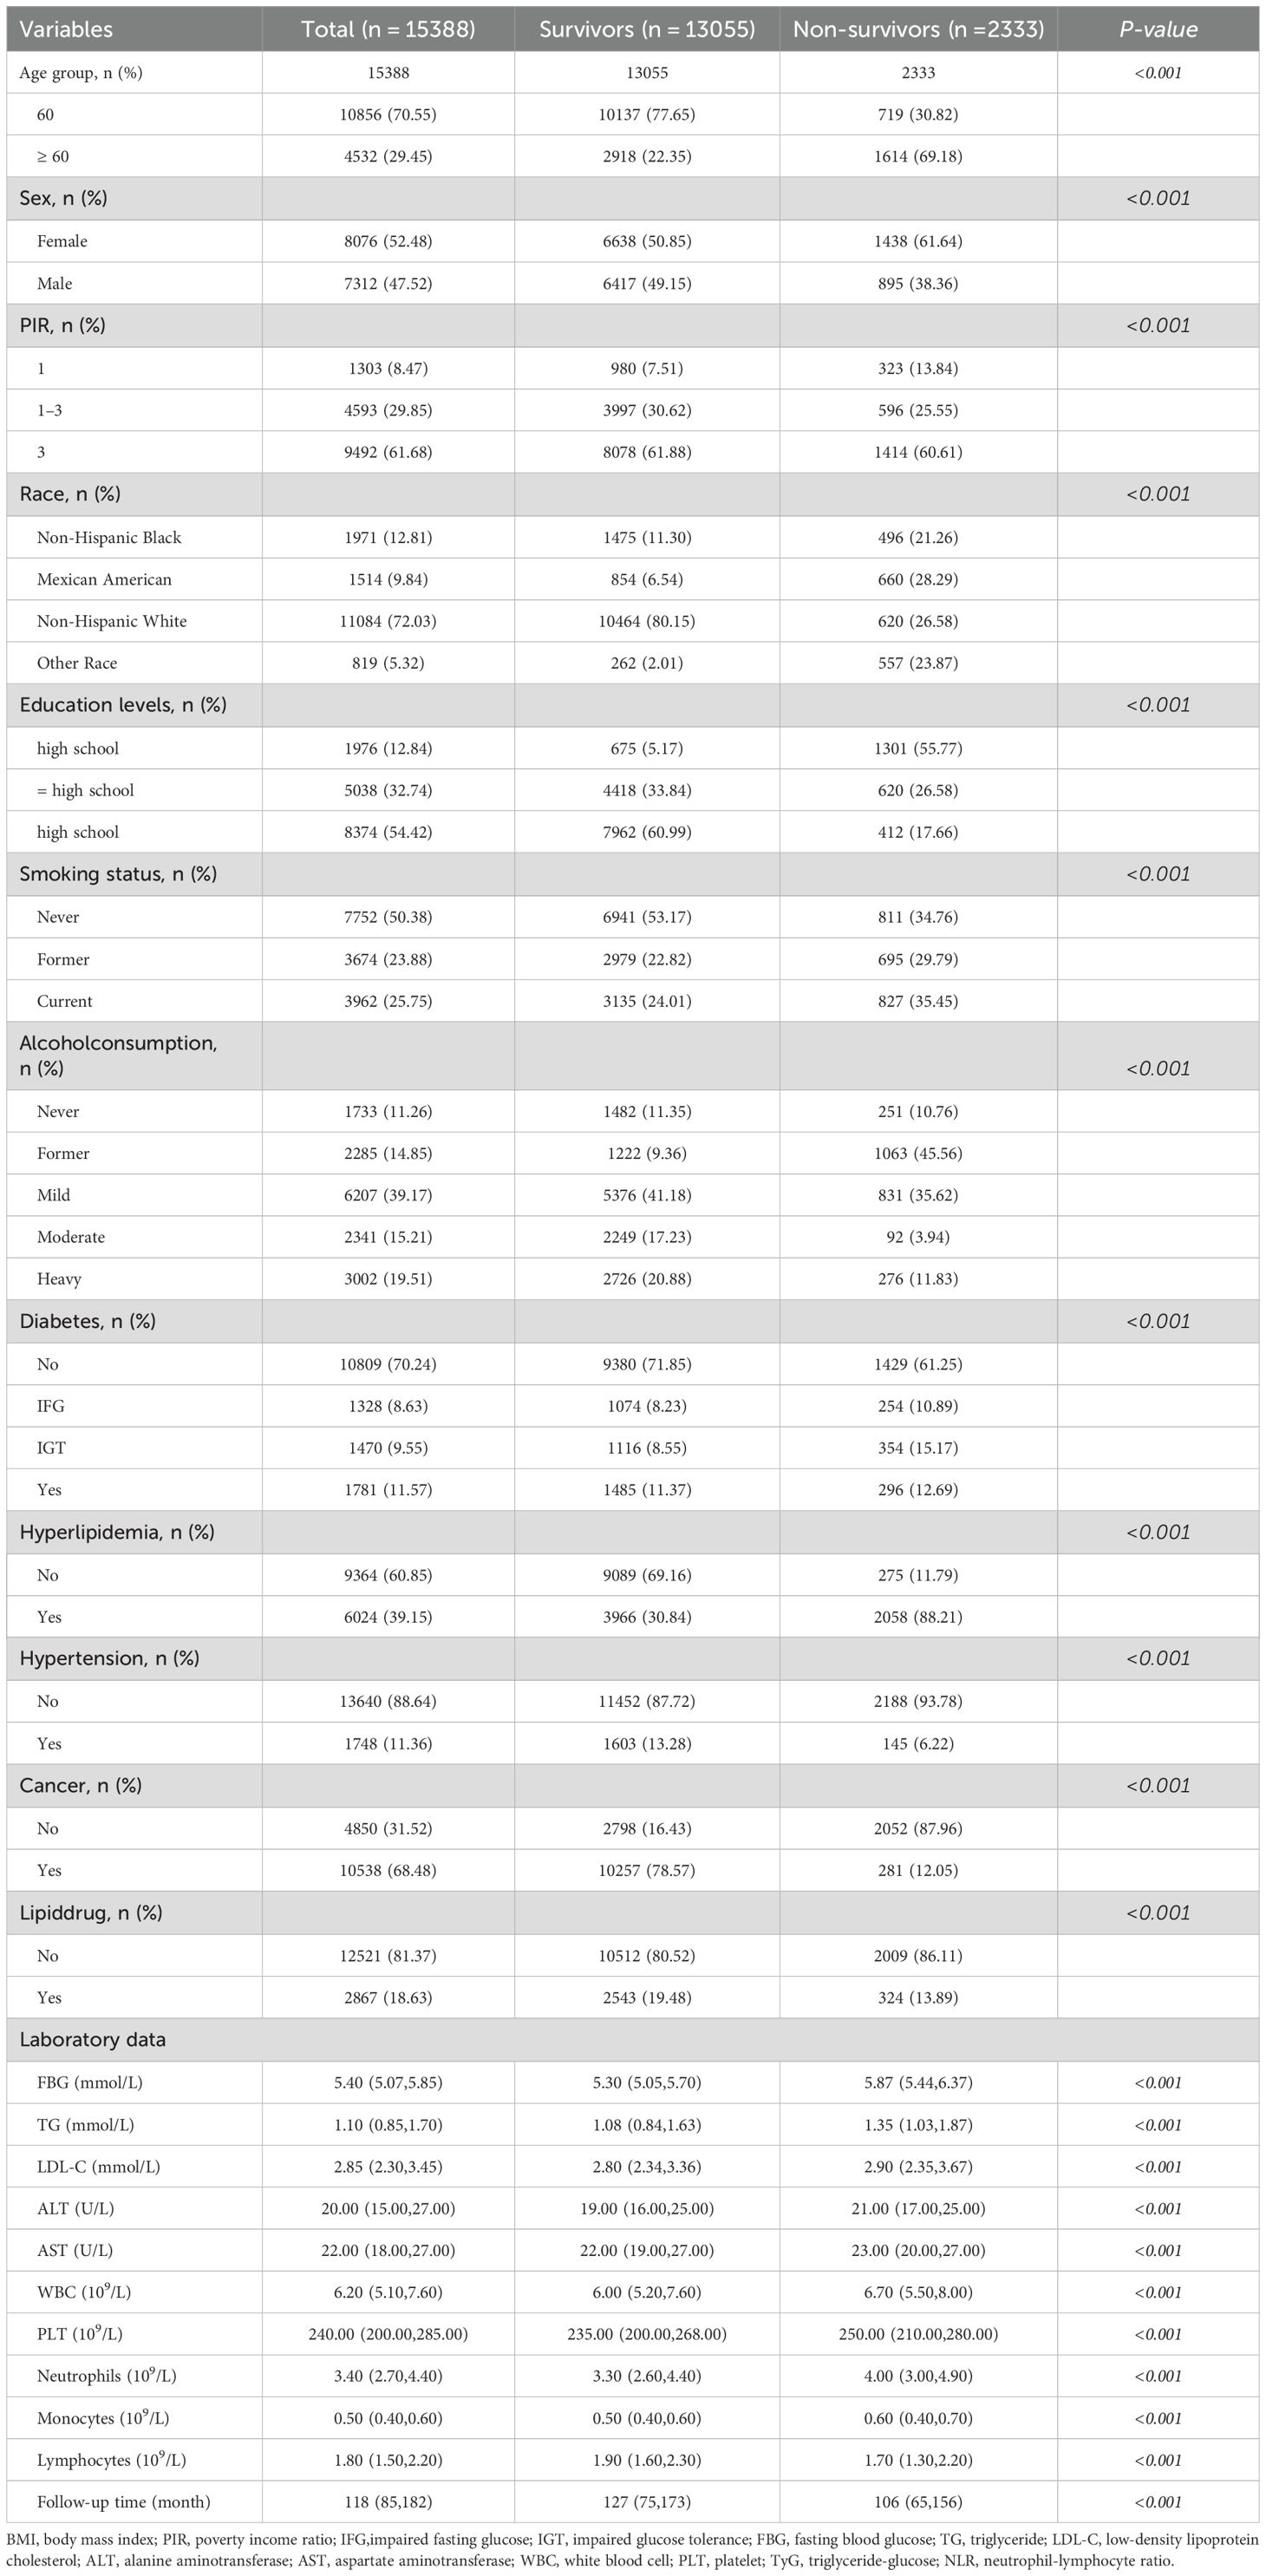
This study included a total of 15,388 participants, with 52.48% being female (Figure 1). During a median follow-up period of 118months, 2,333 participants experienced outcome events. Table 1 outlines the baseline characteristics of participants in the survivor and non-survivor groups, highlighting significant demographic, clinical, and biochemical differences. Compared to survivors, non-survivors were significantly older, with 69.19% being 60 years or older, compared to 22.35% in the survivor group. They were more likely to be male (38.36% vs. 49.15%) and predominantly non-Hispanic White (63.20% vs. 61.08%). Socioeconomic disparities were evident, with non-survivors having a higher proportion of individuals with a PIR < 1 (13.84% vs. 7.65%) and lower education levels, with only 17.66% having achieved more than high school education compared to 60.99% among survivors. Clinically, non-survivors exhibited a higher burden of comorbidities, including hypertension (93.78% vs. 69.64%), hyperlipidemia (39.15% vs. 30.94%), diabetes, and cancer (37.96% vs. 16.43%). Additionally, a higher proportion of non-survivors were on lipid-lowering medications (19.48% vs. 18.37%). These findings suggest a higher prevalence of chronic conditions and associated cardiovascular risks among non-survivors. Biochemically, non-survivors exhibited higher levels of fasting blood glucose (5.87 vs. 5.40 mmol/L), triglycerides (1.35 vs. 1.08 mmol/L), LDL-C (2.90 vs. 2.58 mmol/L), and aspartate aminotransferase (21.00 vs. 19.00 U/L). They also displayed elevated markers of inflammation, with higher levels of white blood cells (6.70 vs. 6.20 10^9/L), neutrophils (4.00 vs. 3.30 10^9/L), and monocytes (0.60 vs. 0.40 10^9/L), alongside lower lymphocyte levels (1.70 vs. 1.90 10^9/L), indicating a heightened inflammatory state and potential immune suppression.
Kaplan-Meier survival curves and the association between TyG, TyG-NLR, and all-cause mortality
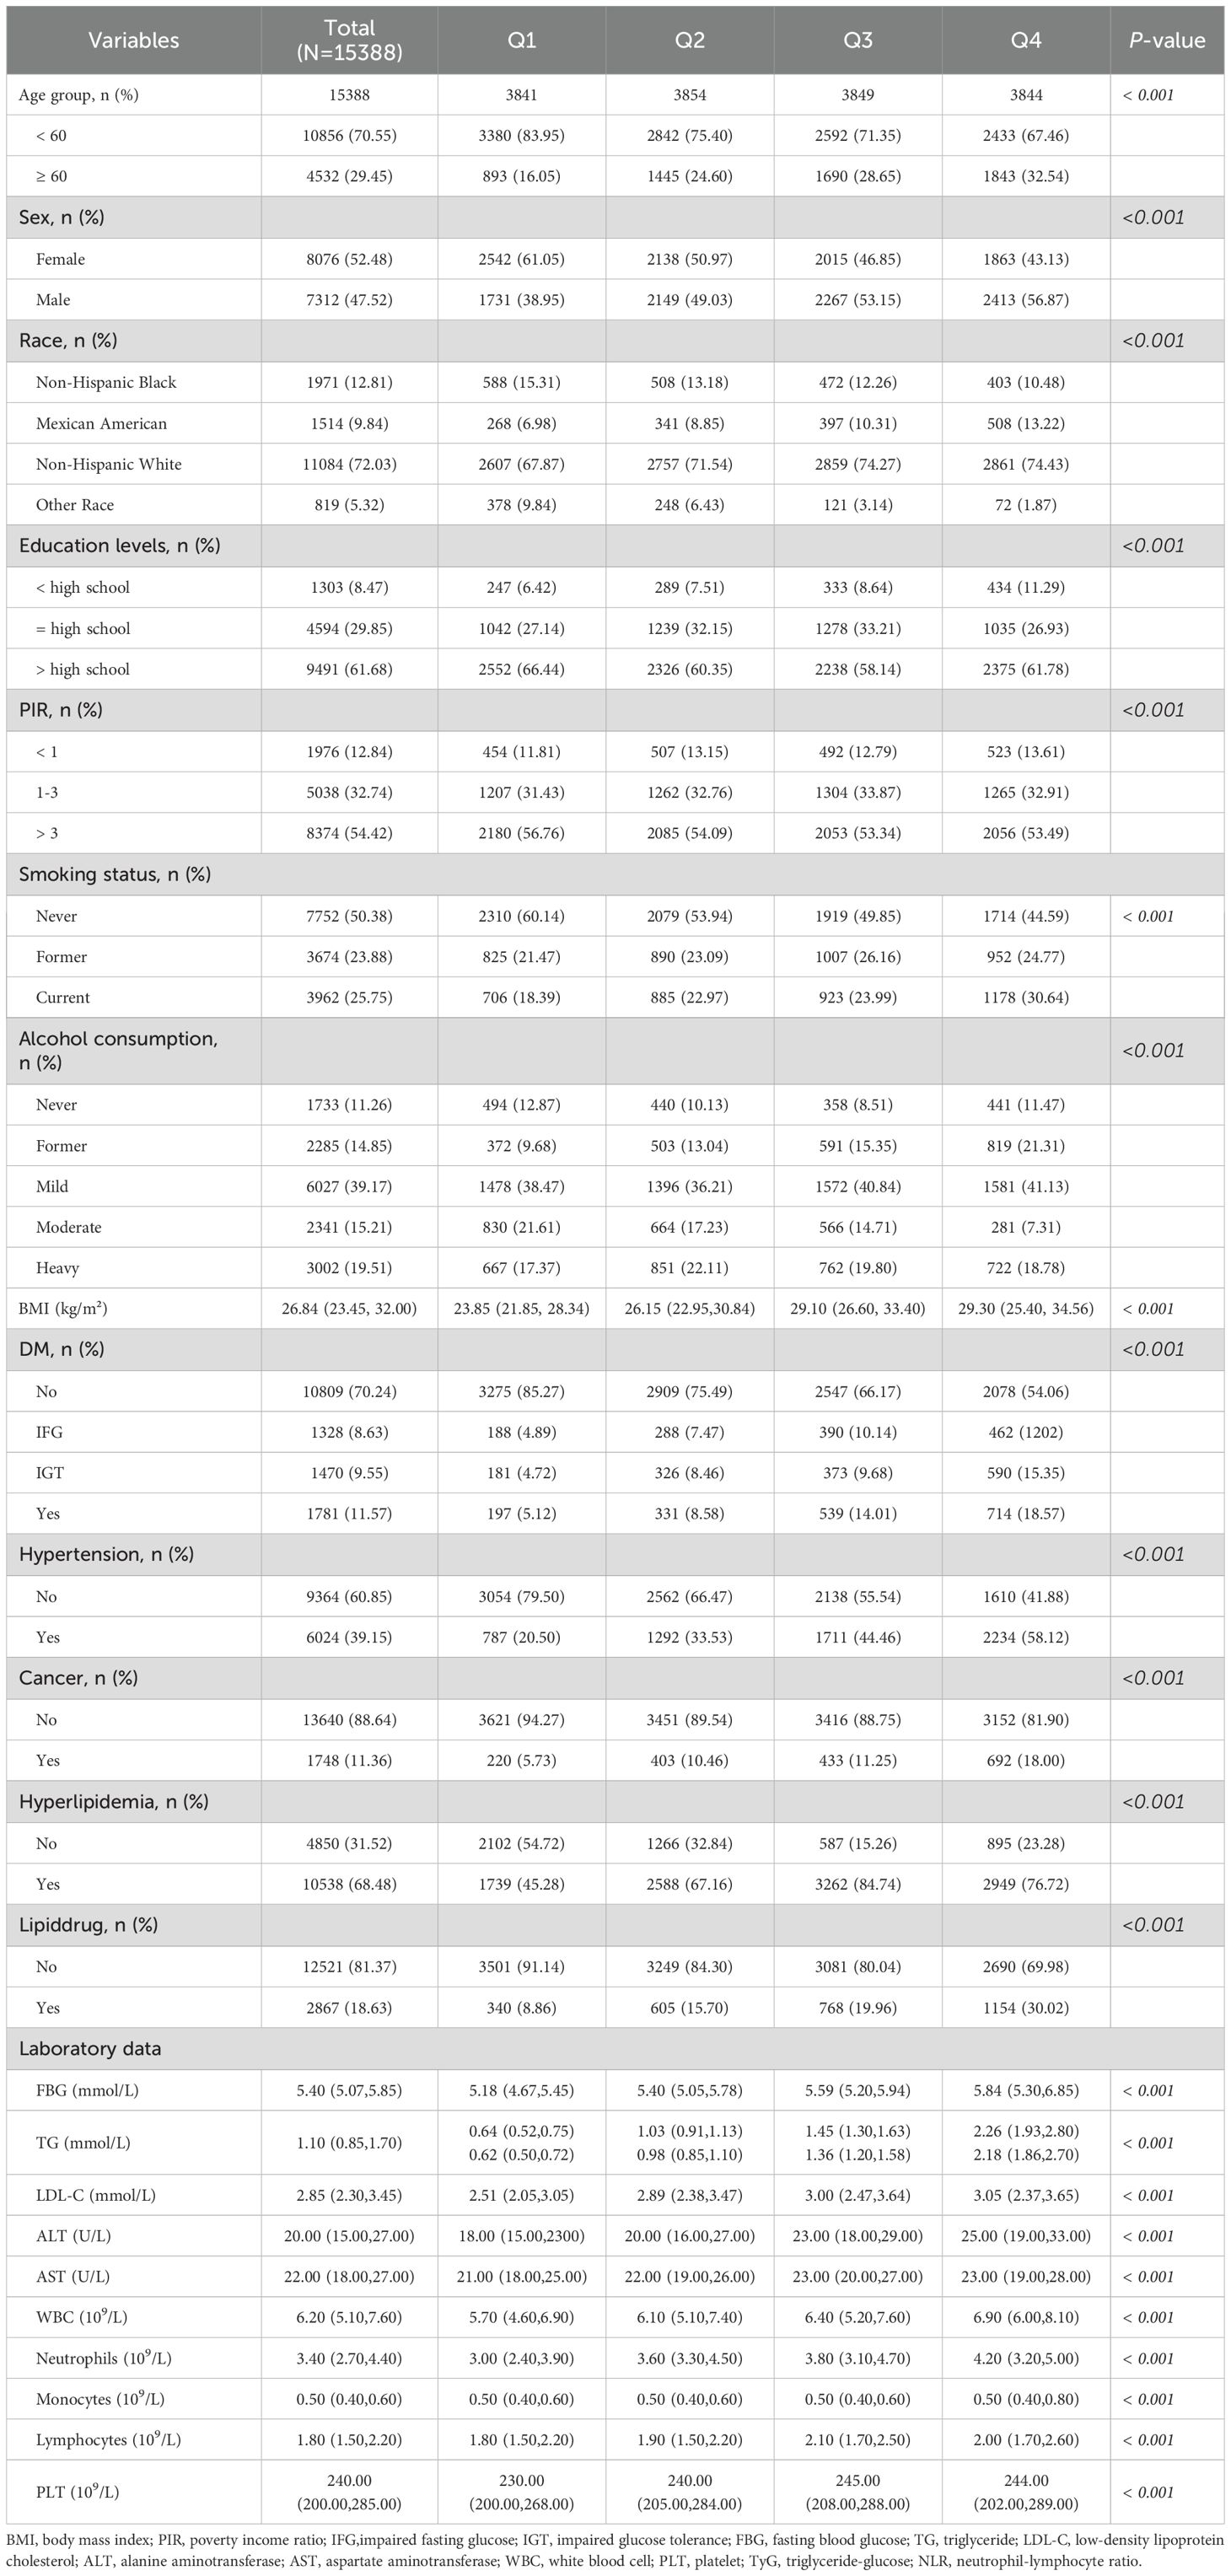
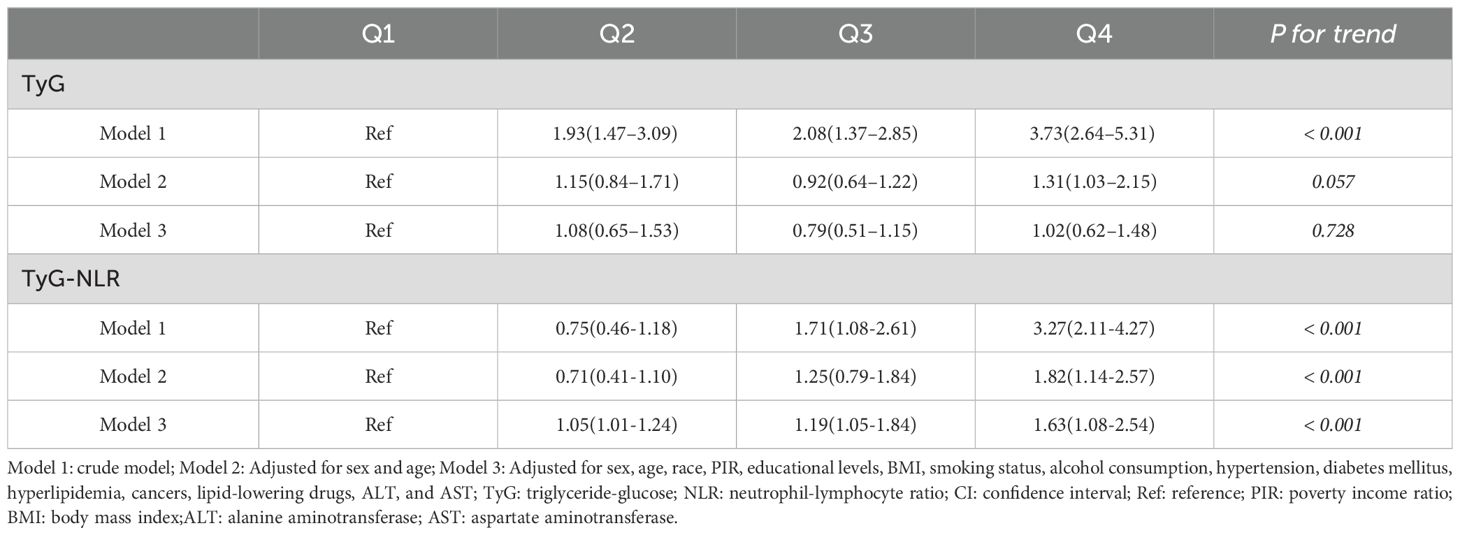
Kaplan-Meier survival analysis adjusted for all covariates based on Model 3 showed significant differences in long-term survival outcomes across groups with different TyG index levels (Figure 2A, P< 0.001). A similar pattern was observed for the TyG-NLR index (Figure 2B, P< 0.001). We employed three models to evaluate the association between the TyG and TyG-NLR indices and all-cause mortality (Table 2, Table 3). In Model 3, no significant association was observed between the TyG index and all-cause mortality across the quartiles, with hazard ratios (HRs) ranging from 0.79 (95% confidence interval [CI]: 0.51–1.15) in the third quartile to 1.02 (95% CI: 0.62–1.48) in the highest quartile (Table 4). In contrast, the TyG-NLR index demonstrated a significant positive association with all-cause mortality across all models. In Model 3, participants in the highest quartile of the TyG-NLR index had a significantly higher risk of all-cause mortality compared to those in the lowest quartile (HR = 1.63, 95% CI: 1.08–2.54). These findings suggest that while the TyG index alone may not robustly predict mortality risk, the combined TyG-NLR index effectively captures the synergistic impact of insulin resistance and systemic inflammation, making it a more reliable predictor of all-cause mortality.
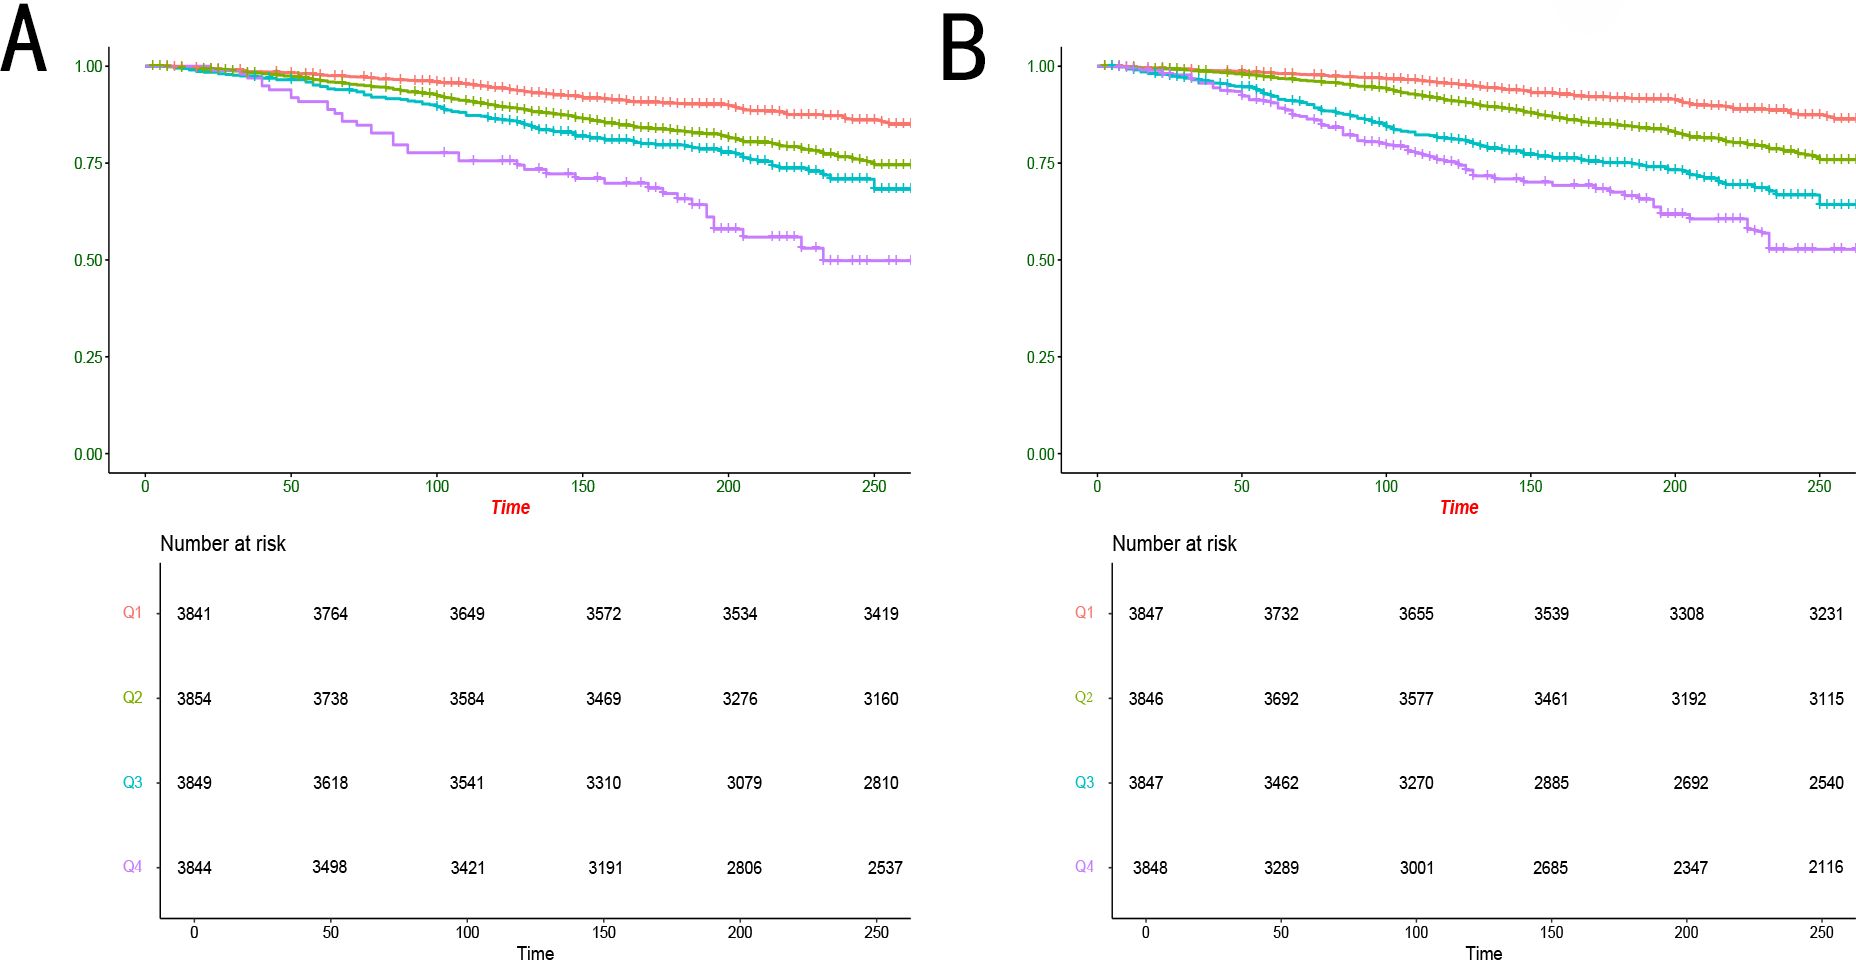
Figure 2. Kaplan-Meier analysis of all-cause mortality with different quartile levels of TyG and TyG-NLR indices. TyG, triglyceride-glucose; NLR, neutrophil-lymphocyte ratio.
The dose-response relationships between the TyG and TyG-NLR indices and mortality were analyzed
After adjusting for potential confounders, we analyzed the dose-response relationship between the TyG and TyG-NLR indices and mortality using RCS analysis (consistent with Model 3). The dose-response relationships between both indices and all-cause mortality were nonlinear (P for nonlinearity < 0.05), as shown in Figure 3. When assessing the dose-response relationships between the TyG and TyG-NLR indices and mortality (Figure 3), a similar pattern emerged. Notably, regardless of the specific shape of the dose-response curve, once the respective threshold points were exceeded, an increase in both the TyG and TyG-NLR indices was associated with a higher risk of mortality.
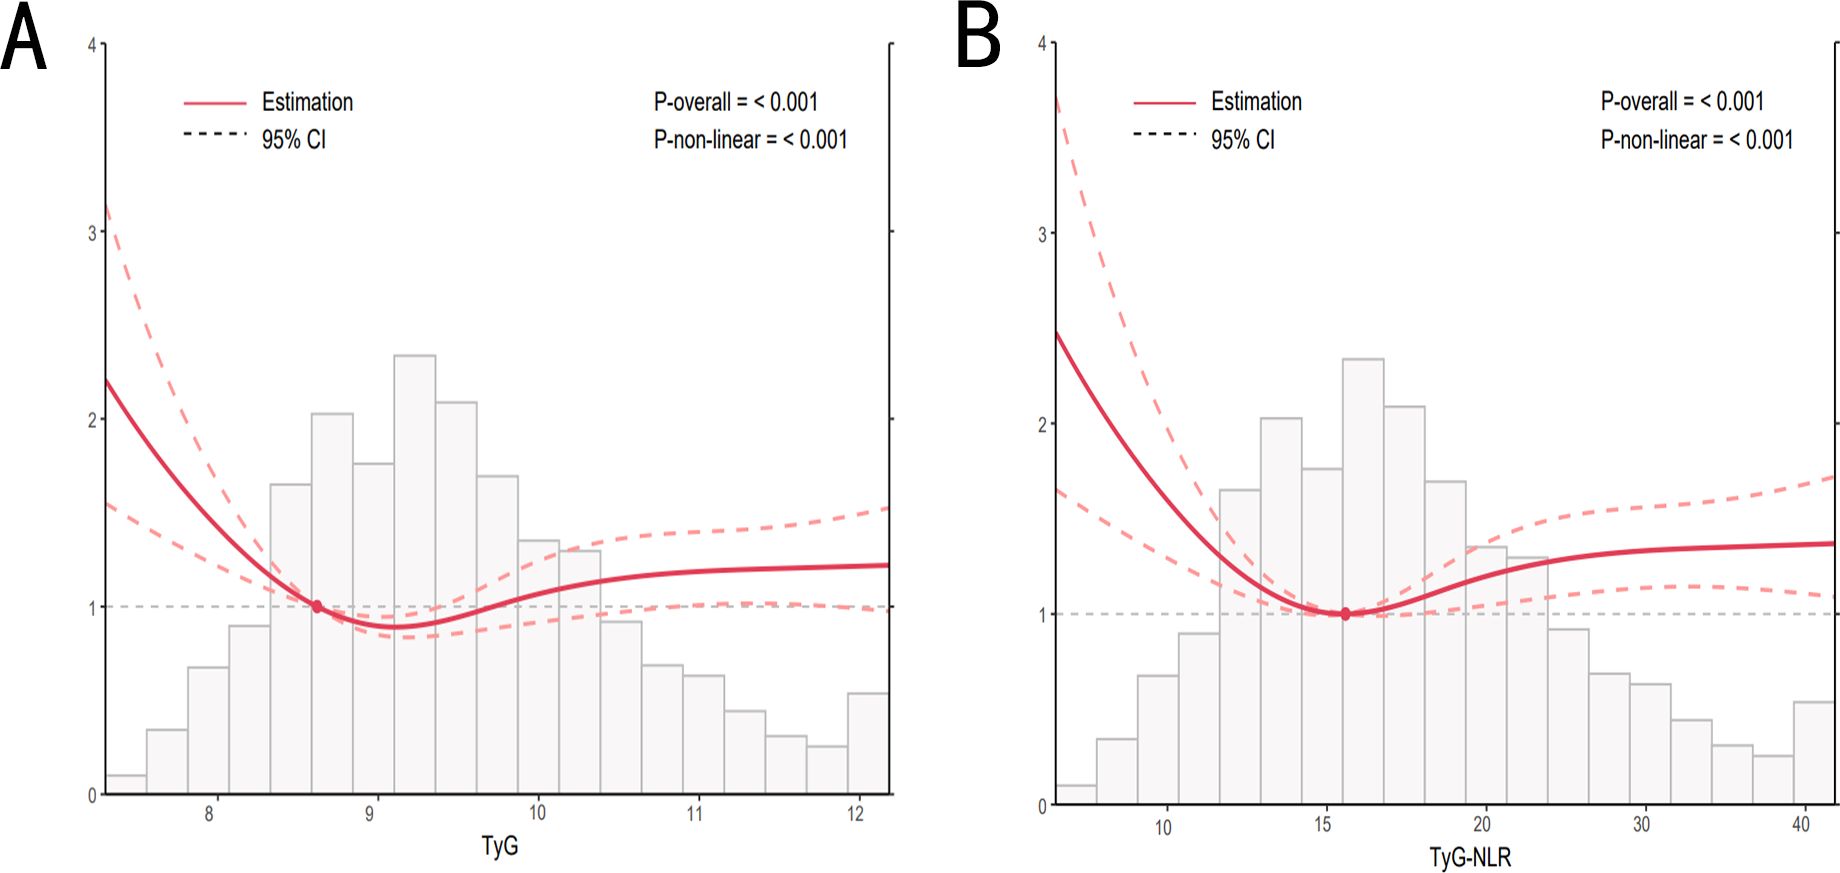
Figure 3. Dose-response relationship between TyG, TyG-NLR, and all-cause mortality. Adjusted for sex, age, race, PIR, educational levels, BMI, smoking status, alcohol consumption, hypertension, diabetes mellitus, hyperlipidemia, cancers, lipid-lowering drugs, ALT, and AST. TyG, triglyceride-glucose; NLR, neutrophil-lymphocyte ratio; PIR, poverty income ratio; BMI, body mass index; ALT, alanine aminotransferase; AST, aspartate aminotransferase.
Discussion
IR and inflammation are closely associated with various metabolic diseases and adverse outcomes (24, 25). NLR reflects the systemic inflammatory status of the body and has been shown to be related to poor outcomes and prognosis in several studies (26, 27). Therefore, in this study, we combined the TyG index with NLR, an indicator of the degree of inflammatory response, to construct a new index, TyG-NLR, which may better assess the risk of mortality in the general population. Since both NLR and the TyG index are composite indicators derived from routine blood parameters, they can be easily obtained in clinical practice, making them highly feasible for practical clinical guidance.
Several previous studies have explored and analyzed the relationship between the TyG index and mortality rates in the general population, but there are inconsistencies in their findings (28–30). Yang et al. analyzed NHANES data from 2009 to 2018 and found that for each 1-unit increase in the TyG index, the risk of all-cause mortality increased by 25%. They also noted that the relationship between the TyG index and mortality risk was influenced by gender. However, no significant association was observed when the TyG index was analyzed as a categorical variable (31). Li et al. identified a threshold effect between the TyG index and mortality, finding that participants with higher TyG levels had a 1.67-fold increased risk of all-cause mortality compared to those with lower levels. However, when the TyG index was grouped into tertiles, this association disappeared (32). Although these studies identified a correlation between the TyG index and mortality rates, the results may have been influenced by factors such as small sample sizes and confounding variables. These findings suggest that the relationship between the TyG index and all-cause mortality may be inconsistent when used as a single predictor.
In our study, the TyG index showed an association with all-cause mortality before adjusting for confounders. However, this association became non-significant after adjusting for confounders, which is consistent with previous studies, demonstrating the instability of the TyG index when used alone (33). However, when we utilized the combined TyG-NLR index, our results showed that TyG-NLR was significantly associated with all-cause mortality. After adjusting for all confounders, participants in the highest quartile of the TyG-NLR index had a 1.63-fold increased risk of all-cause mortality compared to those in the lowest quartile. Additionally, we observed that participants with TyG-NLR indices in the second and third quartiles had 1.05-fold and 1.19-fold increased mortality risks, respectively, compared to those in the lowest quartile. These characteristics not only establish the TyG-NLR index as an effective tool for evaluating the risk of all-cause mortality but also further support the central role of insulin resistance and inflammation in adverse health outcomes, providing a crucial theoretical basis for future risk stratification, prediction, and intervention strategies.
We believe the positive correlation between the TyG-NLR index and mortality risk is driven by the following factors. First, chronic insulin resistance is not only highly correlated with systemic inflammation but also leads to lipid metabolism disorders, thereby accelerating the progression of atherosclerosis, which is considered the primary pathological basis of various cardiovascular diseases. For instance, insulin resistance can lead to endothelial dysfunction through multiple pathways, impairing normal vascular regulation and increasing the risk of cardiovascular events (34, 35). Second, NLR, as a sensitive indicator of systemic inflammatory status, can assess the body’s immune response capacity. Chronic inflammation may suppress normal immune function, making individuals more susceptible to infections or malignant diseases, which may directly or indirectly increase the risk of mortality. Additionally, the interaction between insulin resistance and inflammation may exacerbate tissue and organ damage and functional decline through elevated pro-inflammatory cytokines (such as TNF-α and IL-6) and oxidative stress levels, playing a critical role in the progression of various chronic diseases (36, 37).
Notably, our findings and conclusions require further validation in larger cohorts and diverse populations to determine whether they are influenced by participants’ socioeconomic environments, similar to the TyG index. Additionally, the biological mechanisms underlying the association between the TyG-NLR index and mortality warrant further investigation. In summary, both the TyG index and systemic inflammation markers can be measured through routine blood biochemical tests that are affordable and do not require complex equipment. Once the effectiveness and reliability of the TyG-NLR index are confirmed in future studies for assessing mortality risk in the general population, it could be considered for use in primary care and health screening. Risk stratification using the TyG-NLR index may help guide targeted therapeutic strategies to improve patient outcomes.
Strengths and limitations
The strengths of this study lie in it being the first to propose the TyG-NLR index and confirm its association with mortality in the general population. Additionally, unlike previous studies that primarily focused on populations with metabolic disorders, our study demonstrates that the TyG-NLR index can serve as a predictor of mortality risk in the general population. However, this study has several limitations. First, as an observational cohort study, we cannot establish a direct causal relationship between the TyG-NLR index and mortality. Furthermore, the underlying mechanisms driving the significant association between the TyG-NLR index and mortality remain unclear. Lastly, since the study participants were from the United States, further validation is needed across different populations and regions.
Conclusion
Our results indicate a significant positive association between the TyG-NLR index and all-cause mortality. This simple, accessible, and cost-effective index holds potential as a marker for identifying mortality risk in the general population in clinical practice.
Data availability statement
The original contributions presented in the study are included in the article/supplementary material. Further inquiries can be directed to the corresponding author.
Author contributions
YW: Methodology, Software, Supervision, Writing – original draft, Writing – review & editing. CG: Methodology, Writing – review & editing. BC: Methodology, Software, Supervision, Writing – original draft, Writing – review & editing. BQ: Software, Supervision, Writing – original draft, Writing – review & editing. JY: Data curation, Investigation, Software, Supervision, Validation, Writing – original draft, Writing – review & editing.
Funding
The author(s) declare that no financial support was received for the research, authorship, and/or publication of this article.
Conflict of interest
The authors declare that the research was conducted in the absence of any commercial or financial relationships that could be construed as a potential conflict of interest.
Generative AI statement
The author(s) declare that Generative AI was used in the creation of this manuscript. We touched up the language using ChatGPT4o.
Publisher’s note
All claims expressed in this article are solely those of the authors and do not necessarily represent those of their affiliated organizations, or those of the publisher, the editors and the reviewers. Any product that may be evaluated in this article, or claim that may be made by its manufacturer, is not guaranteed or endorsed by the publisher.
References
1. Shen Y, Zhu Z, Bi X, Shen Y, Shen A, Deng B, et al. Association between insulin resistance indices and kidney stones: results from the 2015-2018 National Health and Nutrition Examination Survey. Front Nutr. (2024) 11:1444049. doi: 10.3389/fnut.2024.1444049
2. Dai Y, Zhang Y, Wang B, Cao L, Wang Z. The association between triglyceride glucose index and gout: a cross-sectional analysis based on NHANES 2007-2018. BMC Endocr Disord. (2024) 24:218. doi: 10.1186/s12902-024-01747-6
3. Ding C, Kong Z, Cheng J, Huang R. Development of a predictive model for the U-shaped relationship between the triglyceride glycemic index and depression using machine learning (NHANES 2009-2018). Heliyon. (2024) 10:e38615. doi: 10.1016/j.heliyon.2024.e38615
4. Pei H, Su X, Wu S, Wang Z. Evaluating the impact of chronic kidney disease and the triglyceride-glucose index on cardiovascular disease: mediation analysis in the NHANES. BMC Public Health. (2024) 24:2750. doi: 10.1186/s12889-024-20243-z
5. Wei X, Liu D. Association of triglyceride-glucose index with sarcopenia: NHANES 2011-2014. Front Endocrinol (Lausanne). (2024) 15:1452664. doi: 10.3389/fendo.2024.1452664
6. Shi J, Chen Z, Zhang Y. Associations between body fat anthropometric indices and mortality among individuals with metabolic syndrome. Lipids Health Dis. (2024) 23:306. doi: 10.1186/s12944-024-02272-0
7. Zheng D, Cai J, Xu S, Jiang S, Li C, Wang B. The association of triglyceride-glucose index and combined obesity indicators with chest pain and risk of cardiovascular disease in American population with pre-diabetes or diabetes. Front Endocrinol (Lausanne). (2024) 15:1471535. doi: 10.3389/fendo.2024.1471535
8. Li J, Xie R, Tian H, Wang D, Mo M, Yang J, et al. Association between triglyceride glucose body mass index and urinary incontinence: a cross-sectional study from the National Health and Nutrition Examination Survey (NHANES) 2001 to 2018. Lipids Health Dis. (2024) 23:304. doi: 10.1186/s12944-024-02306-7
9. Wang C, Liu D, Lu J, Huang B, Feng B, Yin J, et al. Gender differences in the relationship between the triglyceride-glucose index and serum Klotho concentrations among the middle-aged and elderly: a cross-sectional analysis. BMC Endocr Disord. (2024) 24:185. doi: 10.1186/s12902-024-01726-x
10. Pan R, Wang T, Tang R, Qian Z. Association of atherogenic index of plasma and triglyceride glucose-body mass index and sarcopenia in adults from 20 to 59: a cross-sectional study. Front Endocrinol (Lausanne). (2024) 15:1437379. doi: 10.3389/fendo.2024.1437379
11. Li GP, Zhang D, Li MH, Yuan FF, Hou XJ, He DJ, et al. Association between the neutrophil-to-lymphocyte ratio and cancer in adults from NHANES 2005-2018: a cross-sectional study. Sci Rep. (2024) 14:23678. doi: 10.1038/s41598-024-75252-0
12. He Y, Liu X, Wang M, Ke H, Ge C. Neutrophil-to-lymphocyte ratio as a predictor of cardiovascular mortality in cancer survivors. Sci Rep. (2024) 14:20980. doi: 10.1038/s41598-024-72027-5
13. Song S, Chen L, Yu R, Zhu J. Neutrophil-to-lymphocyte ratio as a predictor of all-cause and cardiovascular mortality in coronary heart disease and hypertensive patients: a retrospective cohort study. Front Endocrinol (Lausanne). (2024) 15:1442165. doi: 10.3389/fendo.2024.1442165
14. Zhang LN, Lu AX, Lin Y, Li J, Xu X, Yan CH, et al. Association between systemic inflammation markers and blood pressure among children and adolescents: National Health and Nutrition Examination Survey. Pediatr Res. (2024). doi: 10.1038/s41390-024-03472-1
15. Tang Y, Zhai Y, Song W, Zhu T, Xu Z, Jiang L, et al. Association between complete blood count-derived inflammatory markers and the risk of frailty and mortality in middle-aged and older adults. Front Public Health. (2024) 12:142754. doi: 10.3389/fpubh.2024.1427546
16. Wang Y, Guo S, He Y, Zhang Q, Zhou N, Wang D, et al. Relationship between neutrophil-to-lymphocyte ratio and liver fibrosis in nonalcoholic fatty liver disease among adults in the United States: data from the national health and nutrition examination survey 2017-2018. Turk J Gastroenterol. (2024) 35:335–42. doi: 10.5152/tjg.2024.23231
17. Zheng Y, Liu W, Zhu X, Xu M, Lin B, Bai Y. Neutrophil-to-lymphocyte ratio and liver fibrosis in nonalcoholic fatty liver disease among adults in the United States: data from the national health and nutrition examination survey 2017-2018. NHANES 2007-2012. Redox Biol. (2024) 76:103334. doi: 10.1016/j.redox.2024.103334
18. Chen Z, Ye H, Li E, Lin Y, Jin C, Yang L. Lipid accumulation product, poverty income ratio, and bone mineral density in U.S. adults: a mediation analysis based on NHANES (2009-2020). Front Nutr. (2024) 11:1466288. doi: 10.3389/fnut.2024.1466288
19. Zhang Z, Wu X, Qu Y, Zhang D, Li W. Association of health behaviors in life's essential 8 and hypertension in adolescents: a cross-sectional study from the NHANES database. BMC Cardiovasc Disord. (2024) 24:569. doi: 10.1186/s12872-024-04205-2
20. Liu C, Xin Z, Hua L. Lower free triiodothyronine levels are associated with higher all-cause and cardiovascular mortality in people with diabetes-NHANES 2007-2012. Diabetes Res Clin Pract. (2023) 202:110811. doi: 10.1016/j.diabres.2023.110811
21. Kahende JW, Adhikari B, Maurice E, Rock V, Malarcher A. Disparities in health care utilization by smoking status–NHANES 1999-2004. Int J Environ Res Public Health. (2009) 6:1095–106. doi: 10.3390/ijerph6031095
22. Yang L, Zhang Z, Du C, Tang L, Liu X. Risk factor control and adherence to recommended Lifestyle among US hypertension patients. BMC Public Health. (2024) 24:2853. doi: 10.1186/s12889-024-20401-3
23. Hou XF, Hou CG. Association between acute tobacco exposure and fractional exhaled nitric oxide in patients with chronic obstructive pulmonary disease: national health and nutrition examination survey (NHANES) 2007-2012. Respir Med. (2024) 15:107831. doi: 10.1016/j.rmed.2024.107831
24. Liu AB, Lin YX, Meng TT, Tian P, Chen JL, Zhang XH, et al. Associations of the cardiometabolic index with insulin resistance, prediabetes, and diabetes in U.S. adults: a cross-sectional study. BMC Endocr Disord. (2024) 24:217. doi: 10.1186/s12902-024-01676-4
25. Gao C, Gao S, Zhao R, Shen P, Zhu X, Yang Y, et al. Association between systemic immune-inflammation index and cardiovascular-kidney-metabolic syndrome. Sci Rep. (2024) 14:19151. doi: 10.1038/s41598-024-69819-0
26. Zhu B, Liu Y, Liu W, Cao C, Chen Y, Yi Y, et al. Association of neutrophil-to-lymphocyte ratio with all-cause and cardiovascular mortality in CVD patients with diabetes or pre-diabetes. Sci Rep. (2024) 14:24324. doi: 10.1038/s41598-024-74642-8
27. Chen Z, Li W, Tang Y, Zhou P, He Q, Deng Z. The neutrophil-lymphocyte ratio predicts all-cause and cardiovascular mortality among United States adults with COPD: results from NHANES 1999-2018. Front Med (Lausanne). (2024) 11:1443749. doi: 10.3389/fmed.2024.1443749
28. Chen Y, Zhao X. The mediating role of insulin resistance in the association between inflammatory score and MAFLD: NHANES 2017-2018. Immun Inflammation Dis. (2024) 12:e70035. doi: 10.1002/iid3.70035
29. He HM, Xie YY, Chen Q, Li YK, Li XX, Mu YK, et al. The additive effect of the triglyceride-glucose index and estimated glucose disposal rate on long-term mortality among individuals with and without diabetes: a population-based study. Cardiovasc Diabetol. (2024) 23:307. doi: 10.1186/s12933-024-02396-8
30. Lin Z, Yuan S, Li B, Guan J, He J, Song C, et al. Insulin-based or non-insulin-based insulin resistance indicators and risk of long-term cardiovascular and all-cause mortality in the general population: A 25-year cohort study. Diabetes Metab. (2024) 50:101566. doi: 10.1016/j.diabet.2024.101566
31. Yang M, Shangguan Q, Xie G, Sheng G, Yang J. Oxidative stress mediates the association between triglyceride-glucose index and risk of cardiovascular and all-cause mortality in metabolic syndrome: evidence from a prospective cohort study. Front Endocrinol (Lausanne). (2024) 15:1452896. doi: 10.3389/fendo.2024.1452896
32. Li S, An L, Fu Z, Zhang W, Liu H. Association between triglyceride-glucose related indices and all-cause and cause-specific mortality in the general population: a cohort study. Cardiovasc Diabetol. (2024) 23:286. doi: 10.1186/s12933-024-02390-0
33. Sun C, Hu L, Li X, Zhang X, Chen J, Li D, et al. Triglyceride-glucose index's link to cardiovascular outcomes post-percutaneous coronary intervention in China: a meta-analysis. ESC Heart Fail. (2024) 11:1317–28. doi: 10.1002/ehf2.14679
34. Minetti ET, Hamburg NM, Matsui R. Drivers of cardiovascular disease in metabolic dysfunction-associated steatotic liver disease: the threats of oxidative stress. Front Cardiovasc Med. (2024) 11:1469492. doi: 10.3389/fcvm.2024.1469492
35. Ktenopoulos N, Sagris M, Gerogianni M, Pamporis K, Apostolos A, Balampanis K, et al. Non-alcoholic fatty liver disease and coronary artery disease: A bidirectional association based on endothelial dysfunction. Int J Mol Sci. (2024) 25:10595. doi: 10.3390/ijms251910595
36. Stoian A, Muntean C, Babă DF, Manea A, Dénes L, Simon-Szabó Z, et al. Update on biomarkers of chronic inflammatory processes underlying diabetic neuropathy. Int J Mol Sci. (2024) 25:10395. doi: 10.3390/ijms251910395
Keywords: TyG, NLR, insulin resistance, mortality, NHANES
Citation: Wang Y, Gu C, Chen B, Qiu B and Yu J (2024) The association between triglyceride-glucose index and neutrophil-lymphocyte ratio and all-cause mortality in the general US population: NHANES 2001–2018. Front. Endocrinol. 15:1513543. doi: 10.3389/fendo.2024.1513543
Received: 18 October 2024; Accepted: 21 November 2024;
Published: 10 December 2024.
Edited by:
Yun Shen, Pennington Biomedical Research Center, United StatesReviewed by:
Huaqing Zheng, The University of Utah, United StatesHanfei Xu, Eli Lilly (United States), United States
Jiayan Liu, Boston University, United States, in collaboration with reviewer HX
Copyright © 2024 Wang, Gu, Chen, Qiu and Yu. This is an open-access article distributed under the terms of the Creative Commons Attribution License (CC BY). The use, distribution or reproduction in other forums is permitted, provided the original author(s) and the copyright owner(s) are credited and that the original publication in this journal is cited, in accordance with accepted academic practice. No use, distribution or reproduction is permitted which does not comply with these terms.
*Correspondence: Jinhai Yu, amluaGFpQGpsdS5lZHUuY24=
†These authors have contributed equally to this work
 Yifei Wang
 Cheng Gu2†
 Bingbing Chen
 Binxu Qiu