- 1Department of Ophthalmology, The Second Affiliated Hospital of Chengdu Medical College, Nuclear Industry 416 Hospital, Chengdu, Sichuan, China
- 2Department of Clinic Medicine, School Of Clinic Medicine, Chengdu Medical College, Chengdu, Sichuan, China
- 3Department of Biochemistry and Molecular Biology, School of Biological Sciences and Technology, Chengdu Medical College, Chengdu, Sichuan, China
- 4Department of Pathology and Pathophysiology, School of Basic Medical Science, Chengdu Medical College, Chengdu, Sichuan, China
Objective: The aim of this study was to compare the diagnostic performance of T2 mapping and Dixon in thyroid-associated ophthalmopathy’s disease activity.
Methods: Published studies were collected by systematically searching the databases PubMed, Embase, Cochrane Library, Google Scholar, Medline, Web of Science, CNKI, VIP, and WANFANG. The sensitivities, specificities, likelihood ratios, and diagnostic odds ratio (DOR) were confirmed. The symmetric receiver operator characteristic curve (SROC) was used to assess the threshold of T2 mapping and Dixon. Fagan’s nomogram was drawn. Meta-regression and subgroup analyses were applied to distinguish the sources of heterogeneity among the included studies. The review was conducted in accordance with the Preferred Reporting Items for Systematic Reviews and Meta-Analyses (PRISMA) 2020 statement.
Results: A total of 17 studies were included, comprising 1,455 participants. The combined sensitivity of T2 mapping was 0.70 [95% CI (0.65–0.75)], specificity was 0.84 [95% CI (0.75–0.90)], area under the SROC curve (AUC) was 0.78 [95% CI (0.75–0.82)], and DOR was 12. The combined sensitivity of Dixon was 0.74 [95% CI (0.58–0.85)], specificity was 0.80 [95% CI (0.58–0.93)], AUC was 0.83 [95% CI (0.80–0.86)], and DOR was 11.66. The Deeks’ funnel plot showed no existing publication bias. The prospective design, partial verification bias, and blinding contributed to the heterogeneity in specificity and sensitivity. The post-test probability of T2 mapping in TAO patients’ disease activity was 75%, and the post-test probability of Dixon in TAO was 87%.
Conclusion: Compared with T2 mapping, Dixon presented a significantly higher sensitivity and AUC for detecting TAO disease activity. Dixon is expected to further improve the accuracy of diagnosis of TAO’s disease activity.
Introduction
Graves’ ophthalmopathy (GO), also called thyroid-associated ophthalmopathy (TAO), is mainly characterized by proptosis, upper eyelid retraction, edema, and diplopia and is described as an ocular autoimmune disorder with complicated pathogenesis (1, 2). TAO is the most common orbital disease, and women had a higher incidence (8.9 cases/100,000 person-years) than men (1 case/100,000 person-years) (3, 4). It can lead to significant ocular symptoms, facial disfigurement, vision loss, and decreased quality of life (5). The assessment of TAO activity and symptom severity is the basis for formulating treatment plans, and patients in the active phase require early anti-inflammatory treatment. Therefore, timely and accurate staging is crucial in clinical practice.
In 1989, Mouritis et al. (6) proposed the use of the clinical activity score (CAS) as a common clinical method for assessing the activity of TAO, with the drawback of being overly subjective and limited (7). Tachibana Seigo’s study indicated that orbital magnetic resonance imaging (MRI) combined with CAS can improve the sensitivity of detection of disease activity and prediction of response to immunosuppressive therapy for GO (8). As an effective method, MRI can provide a variety of structural and pathological information, offering objective imaging indicators for accurate evaluation. This method can effectively prevent various injuries caused by ionizing radiation and enhance the soft tissue resolution. Unfortunately, studies that compare the ability of various MRI techniques to assess the activity stages of TAO, as well as studies focusing on combined assessments, were limited. A precise and comprehensive unified quantitative evaluation standard has not yet been established.
T2 mapping used the multi-echo spin-echo pulse sequences to obtain a complete T2 decay curve composed of different time points along with multiple echoes (9). The T2 relaxation time (T2RT) derived from T2 mapping represents the decay rate of the magnetic resonance signal, which is a physical property of a tissue. Obviously, it is widely recognized as the objective value (10). This method reflects the water content in tissues. It is simple, objective, and accurate, and thus has gradually been applied to various diseases (11–15). Several studies have validated the great potential of T2 mapping technology in predicting active TAO patients (16–18).
Furthermore, Dixon is a fat-suppression technique based on chemical shift analysis, allowing the effective separation of water and fat (19, 20). The main feature of TAO is inflammatory infiltration and the remodeling of retrobulbar tissue. The Dixon sequence performs well for quantitative measurements of the orbital fat content and the edema degree of the extraocular muscles (EOM). The superiority of the Dixon technique to conventional inversion recovery or spectral presaturation in terms of overall image quality and FS uniformity has been fully reported (21–23).
However, few studies were performed to compare the diagnosis performance between T2 mapping and Dixon against the TAO disease activity. Consequently, this study mainly evaluates and compares the diagnostic value between nuclear magnetic resonance quantitative technology T2 mapping and Dixon for the activity of TAO.
Methods
Search strategy
Two reviewers (ZFY and WPC) searched PubMed, Embase, Cochrane Library, Google Scholar, Medline, Web of Science, CNKI, VIP, and WANFANG databases up to August 2024 independently. The T2 mapping search terms were as follows: [(T2 mapping) OR (T2RT) OR (T2 value) OR (MRI T2) OR (T2 relaxation time)] AND [(Graves disease) OR (TAO) OR (TED)]. The Dixon search terms were as follows: [(Graves disease) OR (Graves Orbitopathy) OR (TAO) OR (TED)] AND [(DIXON) OR (fat-suppression) OR (fat suppression)]. TAO, thyroid-associated ophthalmopathy; TED, thyroid eye disease.
Inclusion and exclusion criteria
The inclusion criteria included the following items (1): clinical diagnosis TAO patients included as study subjects; (2) randomized controlled trials were divided into two groups: the experimental group with active TAO patients and the control group using patients with inactive TAO patients; (3) clinical trials involving T2 mapping or/and Dixon for TAO detection; (4) data of true-positive (TP) cases, false-negative (FN) cases, false-positive (FP) cases, and true-negative (TN) cases and indicators of sensitivity (Se) and specificity (Sp) shown or figured out according to the literature; and (5) CAS grade was applied as the gold standard method of diagnosis. The exclusion criteria included the following items: (1) animal studies; (2) non-case–control trials; (3) studies without sufficient or experimental data; (4) letters, case reports, guidelines, reviews, and conference abstracts; (5) published literature repeatedly; and (6) unrelated studies to diagnostic means in TAO patients.
Data extraction
Two researchers (ZFY and WPC) independently conducted data extraction from the studies and all disagreements were resolved by consensus with all investigators. The following data were extracted: study characteristics (region, year of publication, type of study, and sample size), patient characteristics (age, sex, presence of metabolic syndrome, and laboratory parameters), the gold standard (CAS) used and the outcome indicators of Dixon and T2 mapping, which included TP, FP, FN, TN, Sp, and Se.
Quality assessment
The diagnostic experimental Quality Assessment of Diagnostic Accuracy Studies-2 (QUADAS-2) tool of the RevMan5.3 software was used to evaluate the quality of the included literature and assess the risk of bias and applicability of each included literature (24). Each study was evaluated for risk of bias and applicability following four key domains: patient selection, index test, reference standard, and flow and timing. There were two high risk and six unclear risk in patient selection, five high risk and two unclear risk in index test, and three high risk and five unclear risk in flow and timing. Disagreements were resolved by consensus.
Statistics
The diagnostic modalities of studies were analyzed by Stata software (version 15.0). The bivariate model was used to calculate combined sensitivity, specificity, the positive/negative likelihood ratio (PLR/NLR), and diagnostic odds ratio (DOR). The area under the receiver operator characteristic (ROC) curve estimated the total diagnostic efficacy of Dixon or T2 mapping in Tao patients’ disease activity. The pre-test probability was assessed from conventional data, trial data, or clinical decisions. Post-test probability could determine whether diagnostic probability increased or reduced compared to pre-test probability. The statistical heterogeneity based on the included studies was evaluated using the I2 statistics and Q test. Values of I2 < 50% and p > 0.1 indicated what could be regarded as inhomogeneity; thus, a random-effects model was applied for further analysis. Otherwise, a fixed-effect model should be performed. A p-value <0.05 indicated a significant difference.
Results
Flowchart and study quality
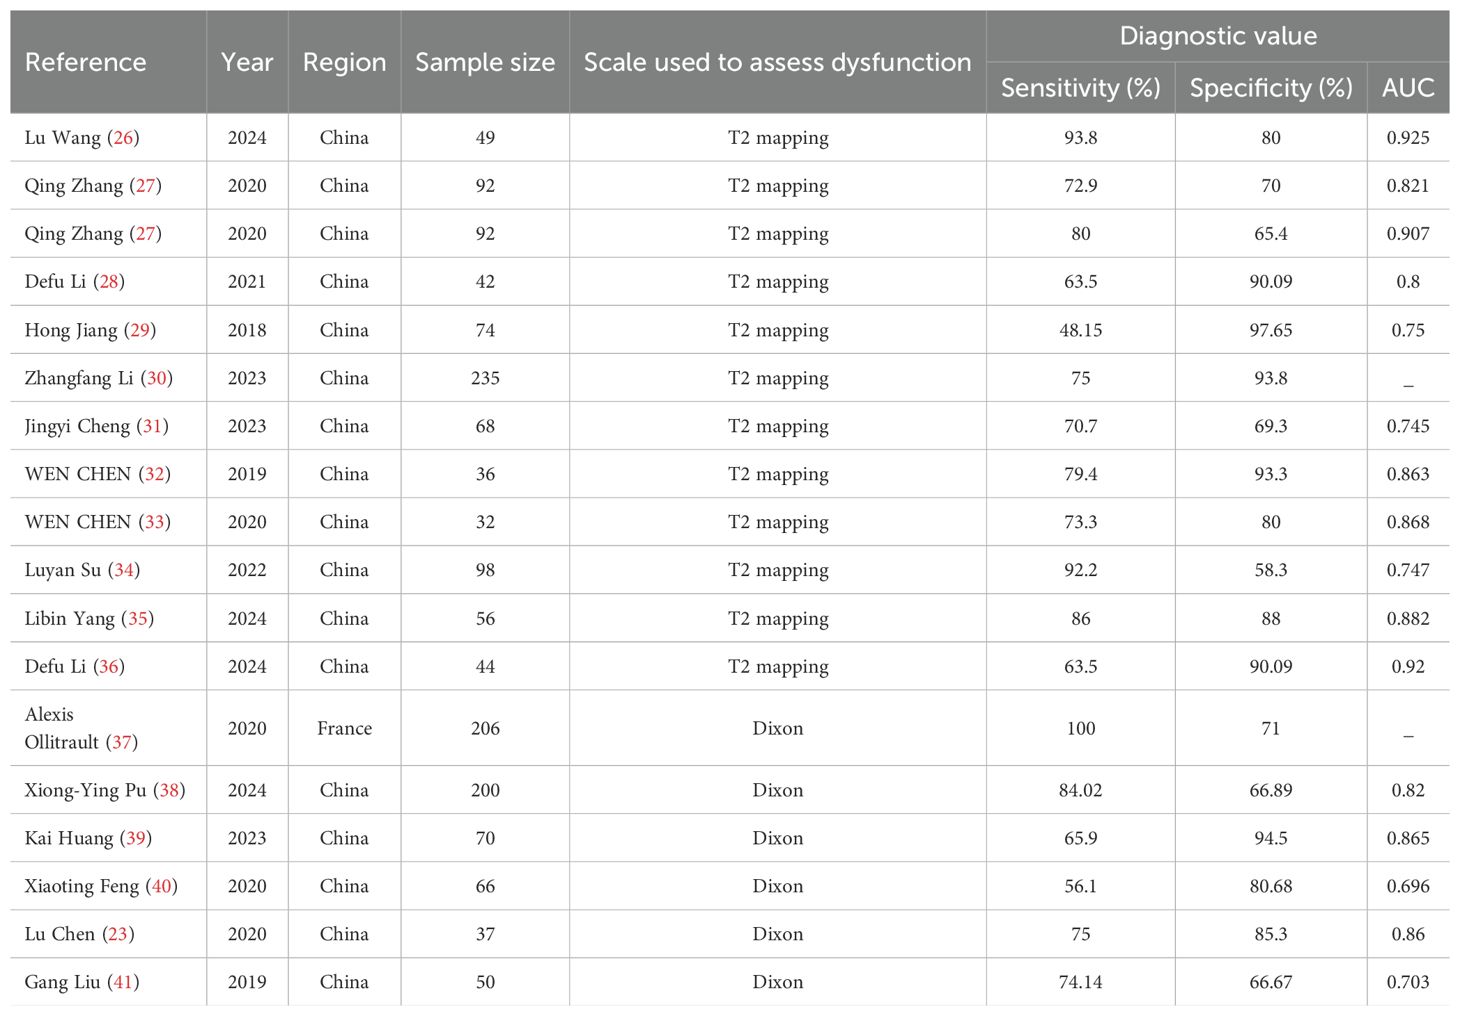
A total of 425 studies (including documents, reviews, animal experiments, case reports, and repeated studies) were retrieved from each database. After utilizing Endnotes software and manually removing 82 articles based on duplicate titles and abstracts, 343 relevant studies were included. Among these studies, 23 were excluded for being reviews, meta-analyses, or case reports, while 271 studies did not have related titles and abstracts. The full text of the remaining 49 studies was selected, and 32 studies were removed after reading the full text due to incomplete data; for example, the information on Sp, Se, or AUC was missing. The remaining 17 studies were extracted from the corresponding data according to the data extraction requirements. A total of 11 studies used T2 mapping, and 6 used Dixon. We followed the Preferred Reporting Items for Systematic Reviews and Meta-Analyses (PRISMA) (25), and the literature screening process is shown in Figure 1. The basic characteristics of each study are plotted in Table 1.
T2 mapping against the TAO
The combined sensitivity of T2 mapping against the TAO was 0.70 [95% CI (0.65–0.75)], specificity was 0.84 [95% CI (0.75–0.90)], PLR was 4.3 [95% CI (2.8–6.5)], NLR was 0.36 [95% CI (0.31–0.41)], and DOR was 12, indicating that T2 mapping had a moderate value in the screening of TAO. The random-effects model was applied because the heterogeneity was greater than 50%. For more details, please see Figures 2A–C.
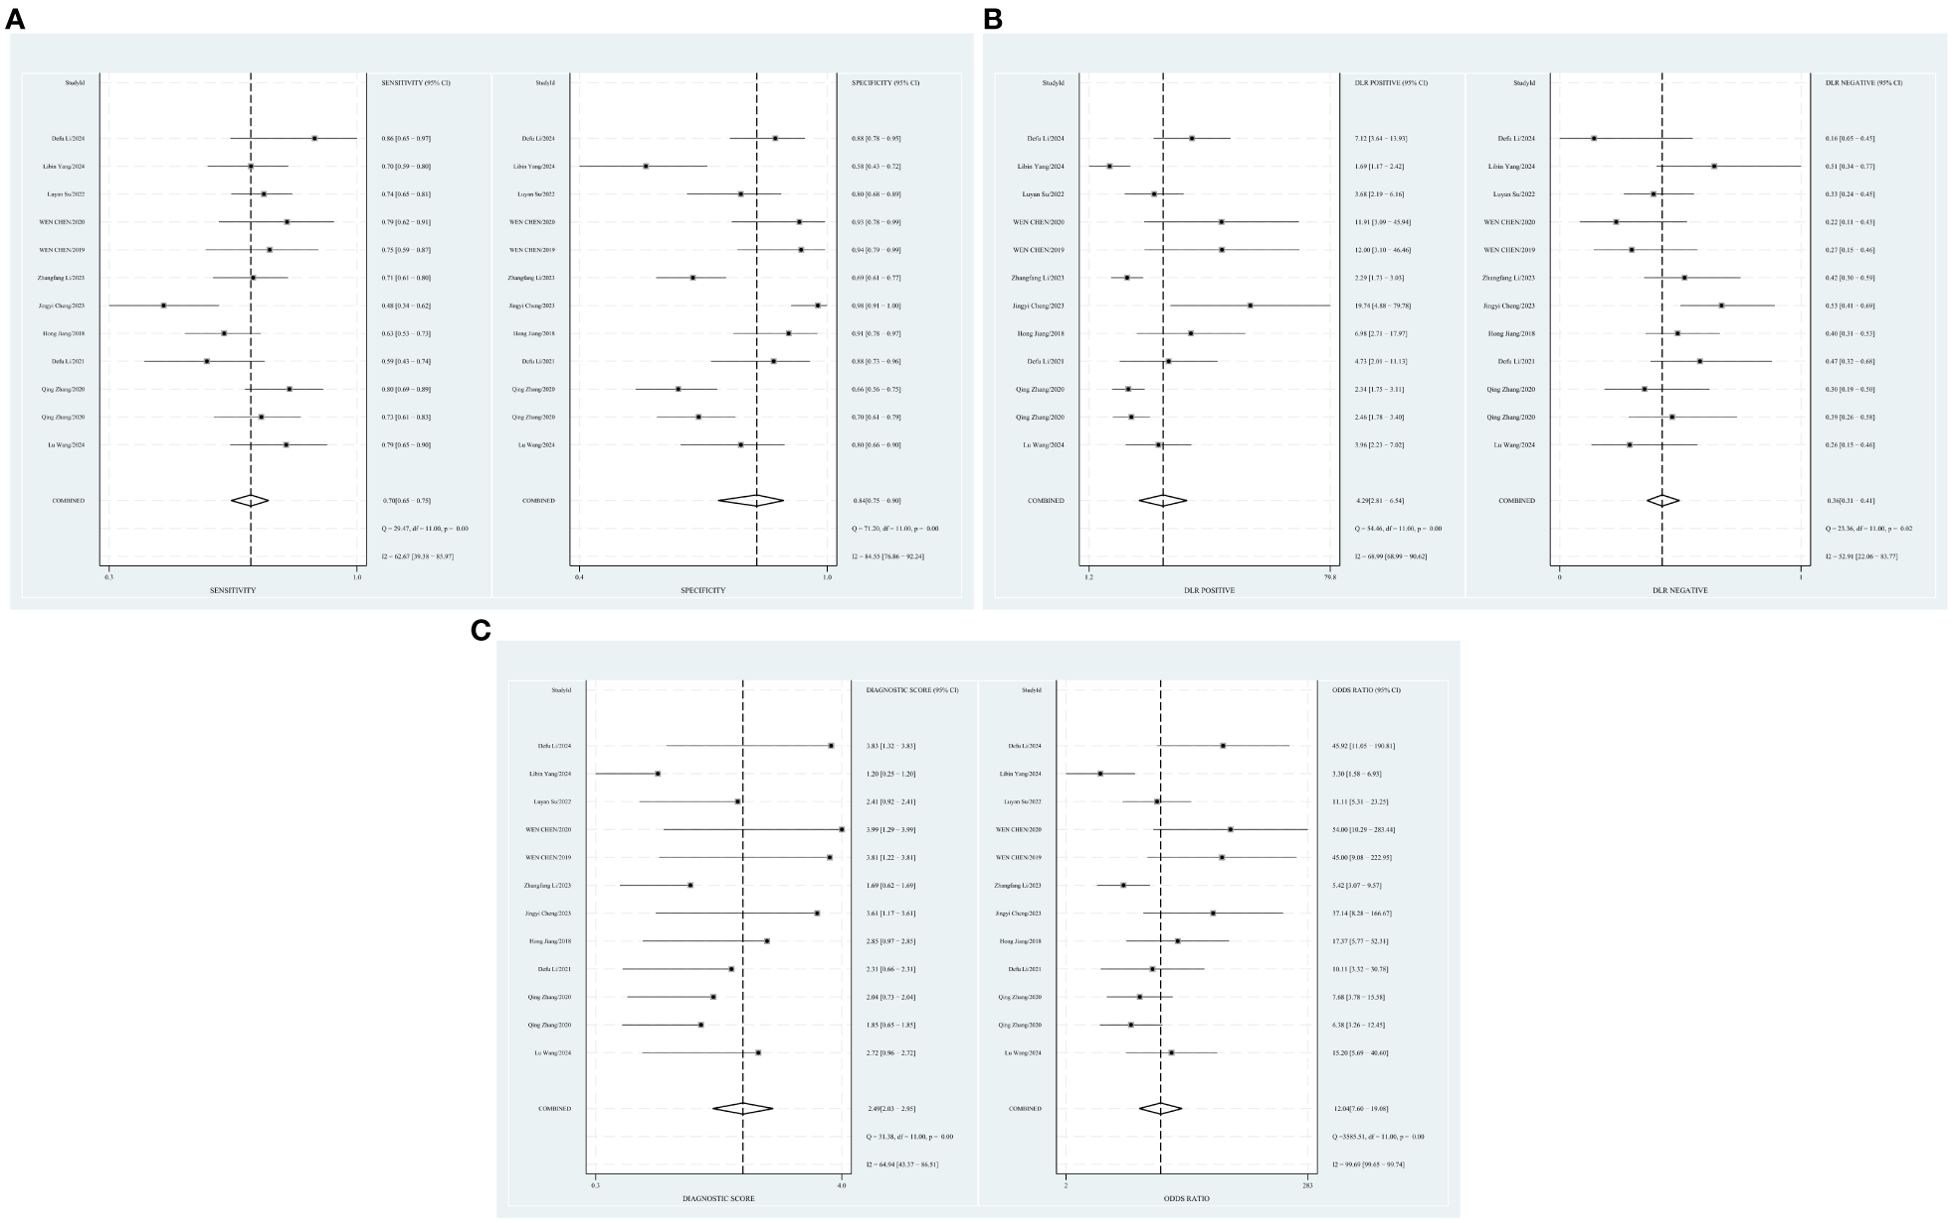
Figure 2. (A) Forest plot of sensitivity and specificity of T2 mapping in the diagnosis of TAO. (B) Forest plot of diagnosis likelihood ratio (DLR) of T2mapping in the diagnosis of TAO. (C) Forest plot of the diagnostic odds ratio (DOR) of T2mapping in the diagnosis of TAO.
Publication bias and heterogeneity
The Deeks’ funnel plots were used to assess potential publication bias in detecting TAO with T2 mapping. As shown in Supplementary Figure 1, publication bias existed, with a p-value of 0.01. The bivariate boxplot showed that two studies were out of the circles, indicating heterogeneity between included studies, as shown in Supplementary Figure 2.
Threshold effect
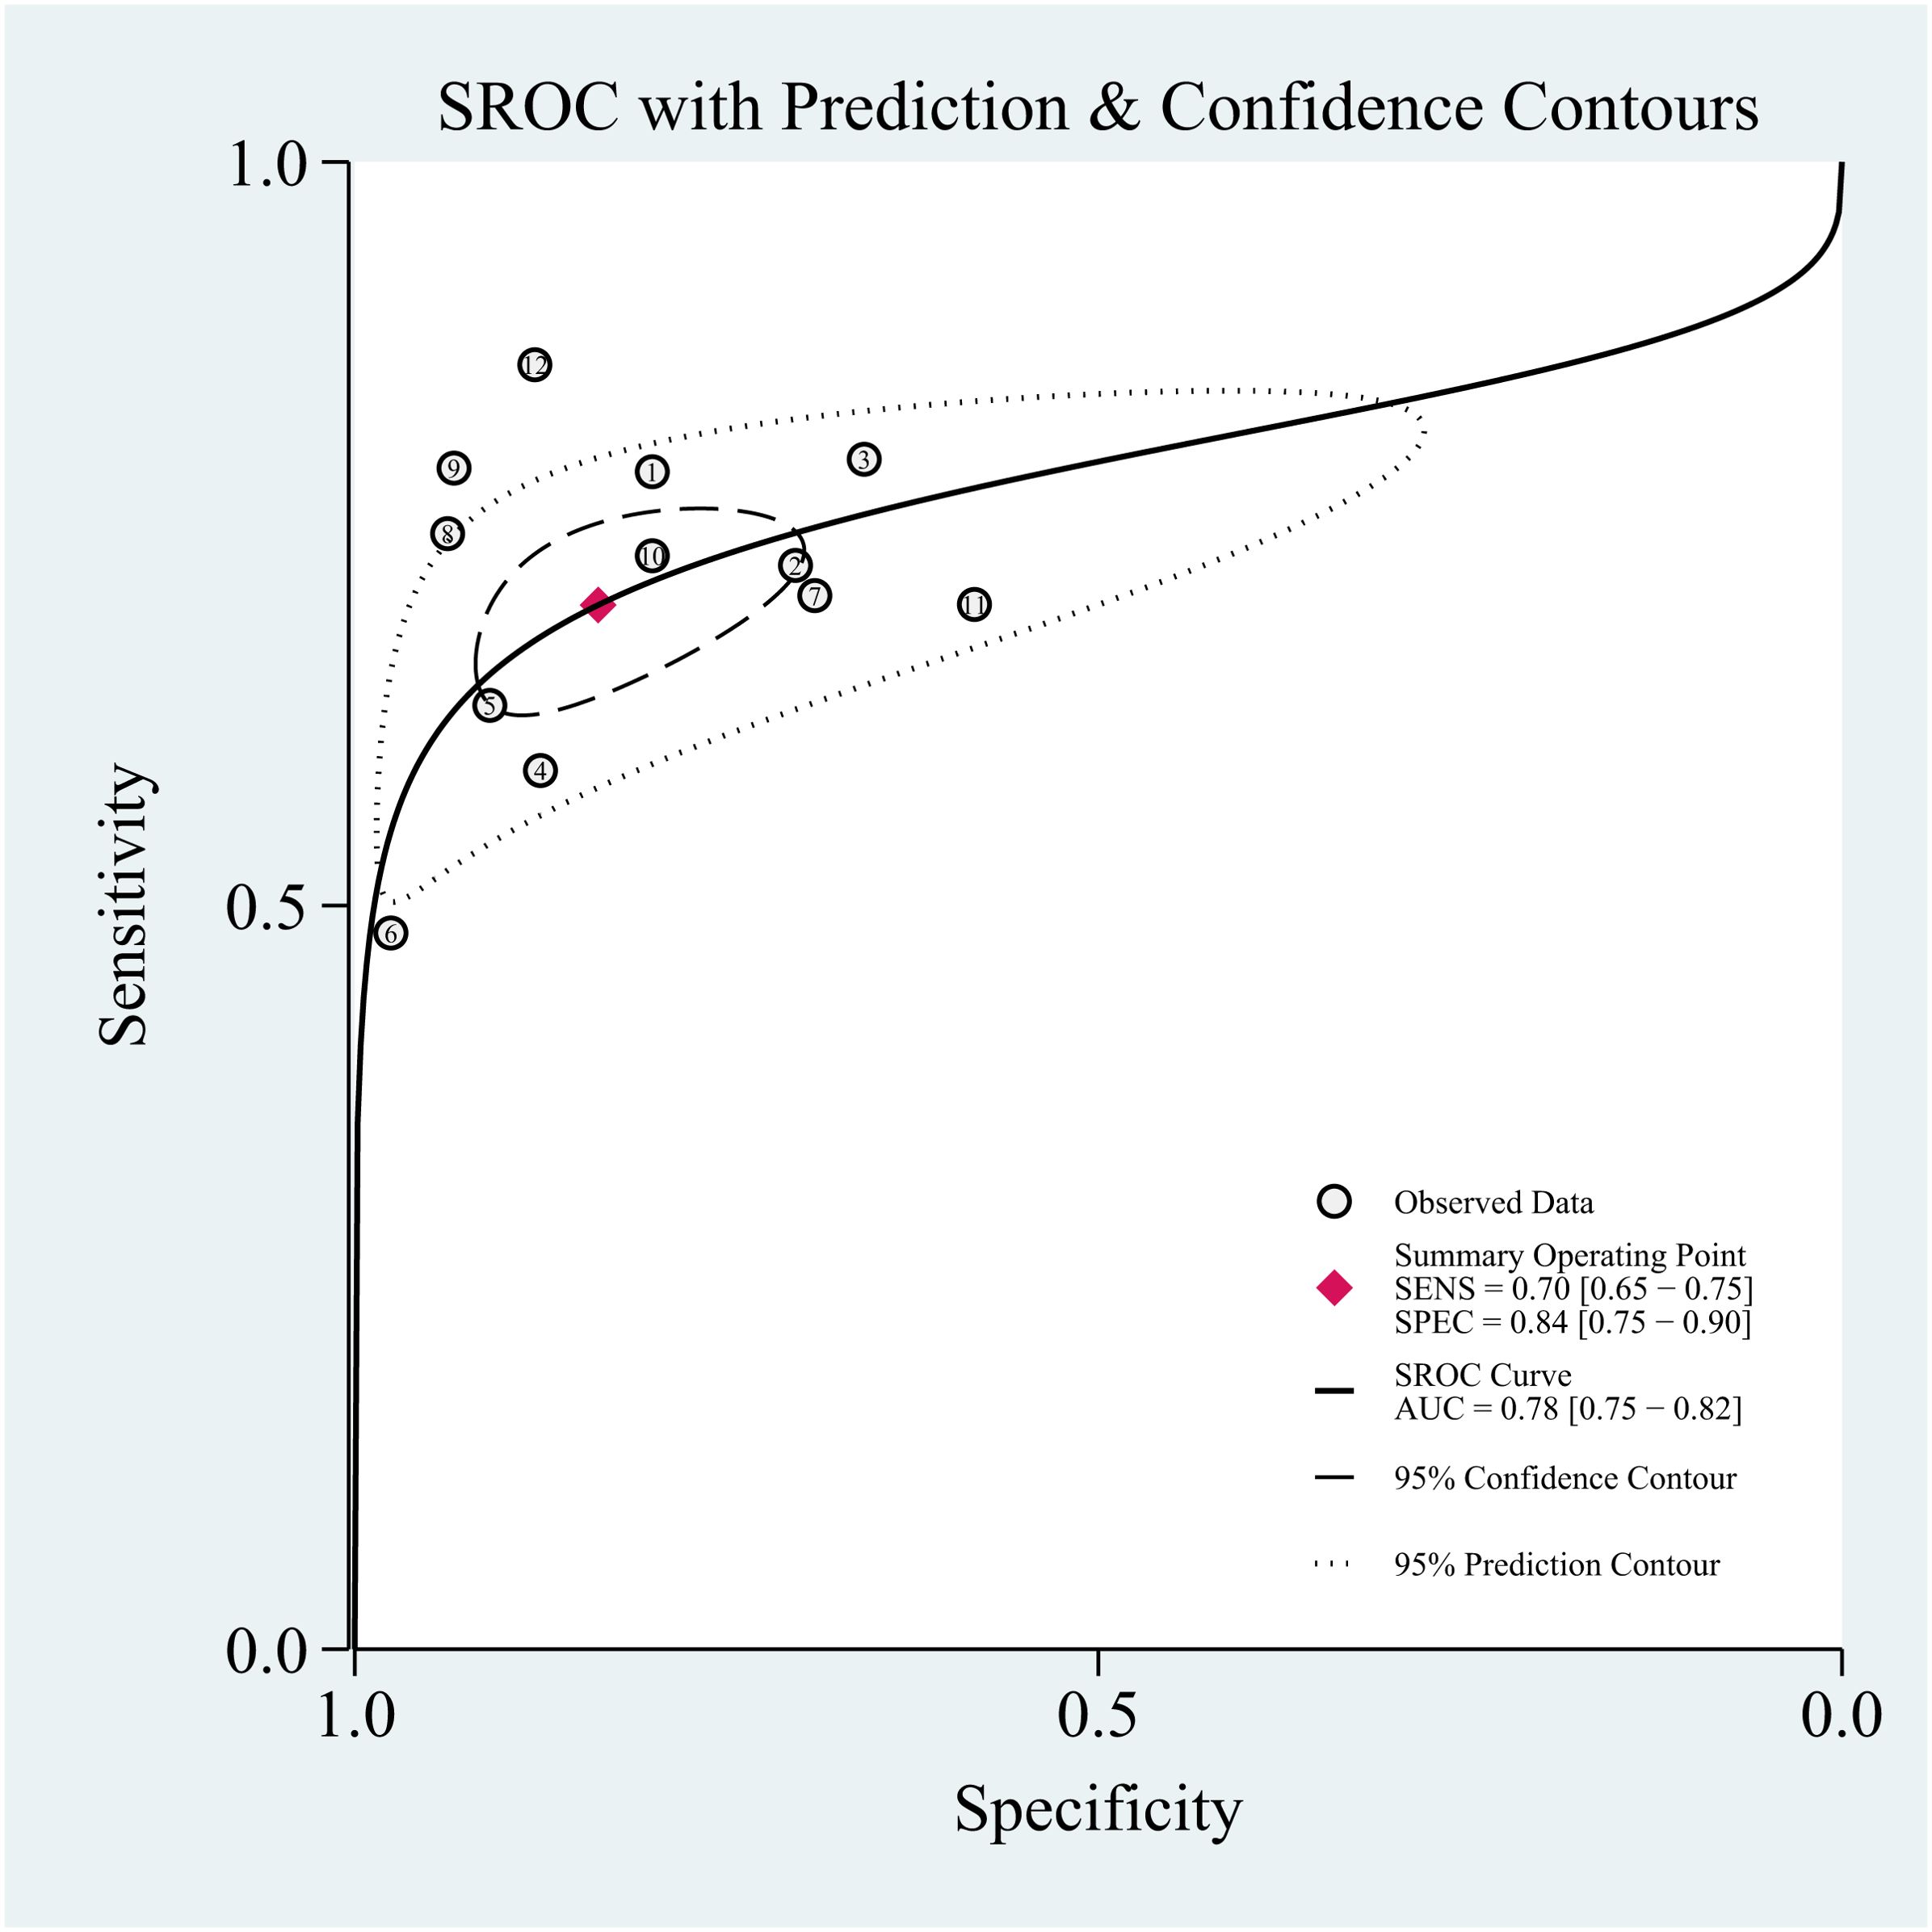
The threshold effect was assessed by the SROC curve plane test. Figure 3 shows the absence of the typical “shoulder arm”, representing the inexistence of the threshold effect. This implies that there is no apparent trend of sensitivity that first increases and then decreases with specificity across different thresholds. Then, the differences in sensitivity and specificity among different studies can be attributed primarily to factors such as study design, sample size, and detection methods, rather than being caused by variations in the threshold. The area under the SROC curve (AUC) was 0.78 [95% CI (0.75–0.82)], indicating a moderate diagnostic value of T2 mapping.
Pre-test probability, LR, and post-test probability
The relationship among the prior probability, the PLR, the NLR, and the posterior probability were performed in the Fagan graph. The post-test probabilities were calculated using the Stata software. Setting the pre-test probability as 50% previously, the post-test probability of TAO was 75%. Moreover, the positive likelihood ratio (PLR) was less than 10 (PLR = 4), and the negative likelihood ratio (NLR) was >0.1 (NLR = 0.36), indicating that the diagnosis could neither be confirmed nor excluded (see Figure 4).
Meta-regression and subgroup analysis
Some factors, including prospective design (prodesign), partial verification bias (fulverif), and adequate description of study participants (subjdescr), are reported, and whether the test results were assessed by a blind method might be relevant to heterogeneity among these T2 mapping studies. The meta-regression analysis of the above-mentioned factors indicated that prodesign, fulverif, and blind could affect the heterogeneity of sensitivity, but less affect the heterogeneity of specificity, as plotted in Supplementary Figure 3.
Dixon against TAO
A random-effects model was applied when the heterogeneity was greater than 50%. The combined sensitivity of Dixon assessing the disease activity of the TAO patients was 0.74 [95% CI (0.58–0.85)], specificity was 0.80 [95% CI (0.58–0.93)], PLR was 3.78 [95% CI (1.65–8.68)], NLR was 0.32 [95% CI (0.20–0.53)], and DOR was 11.66, indicating that Dixon had a moderate value in the assessment of the TAO patients’ disease activity (Figures 5A–C).
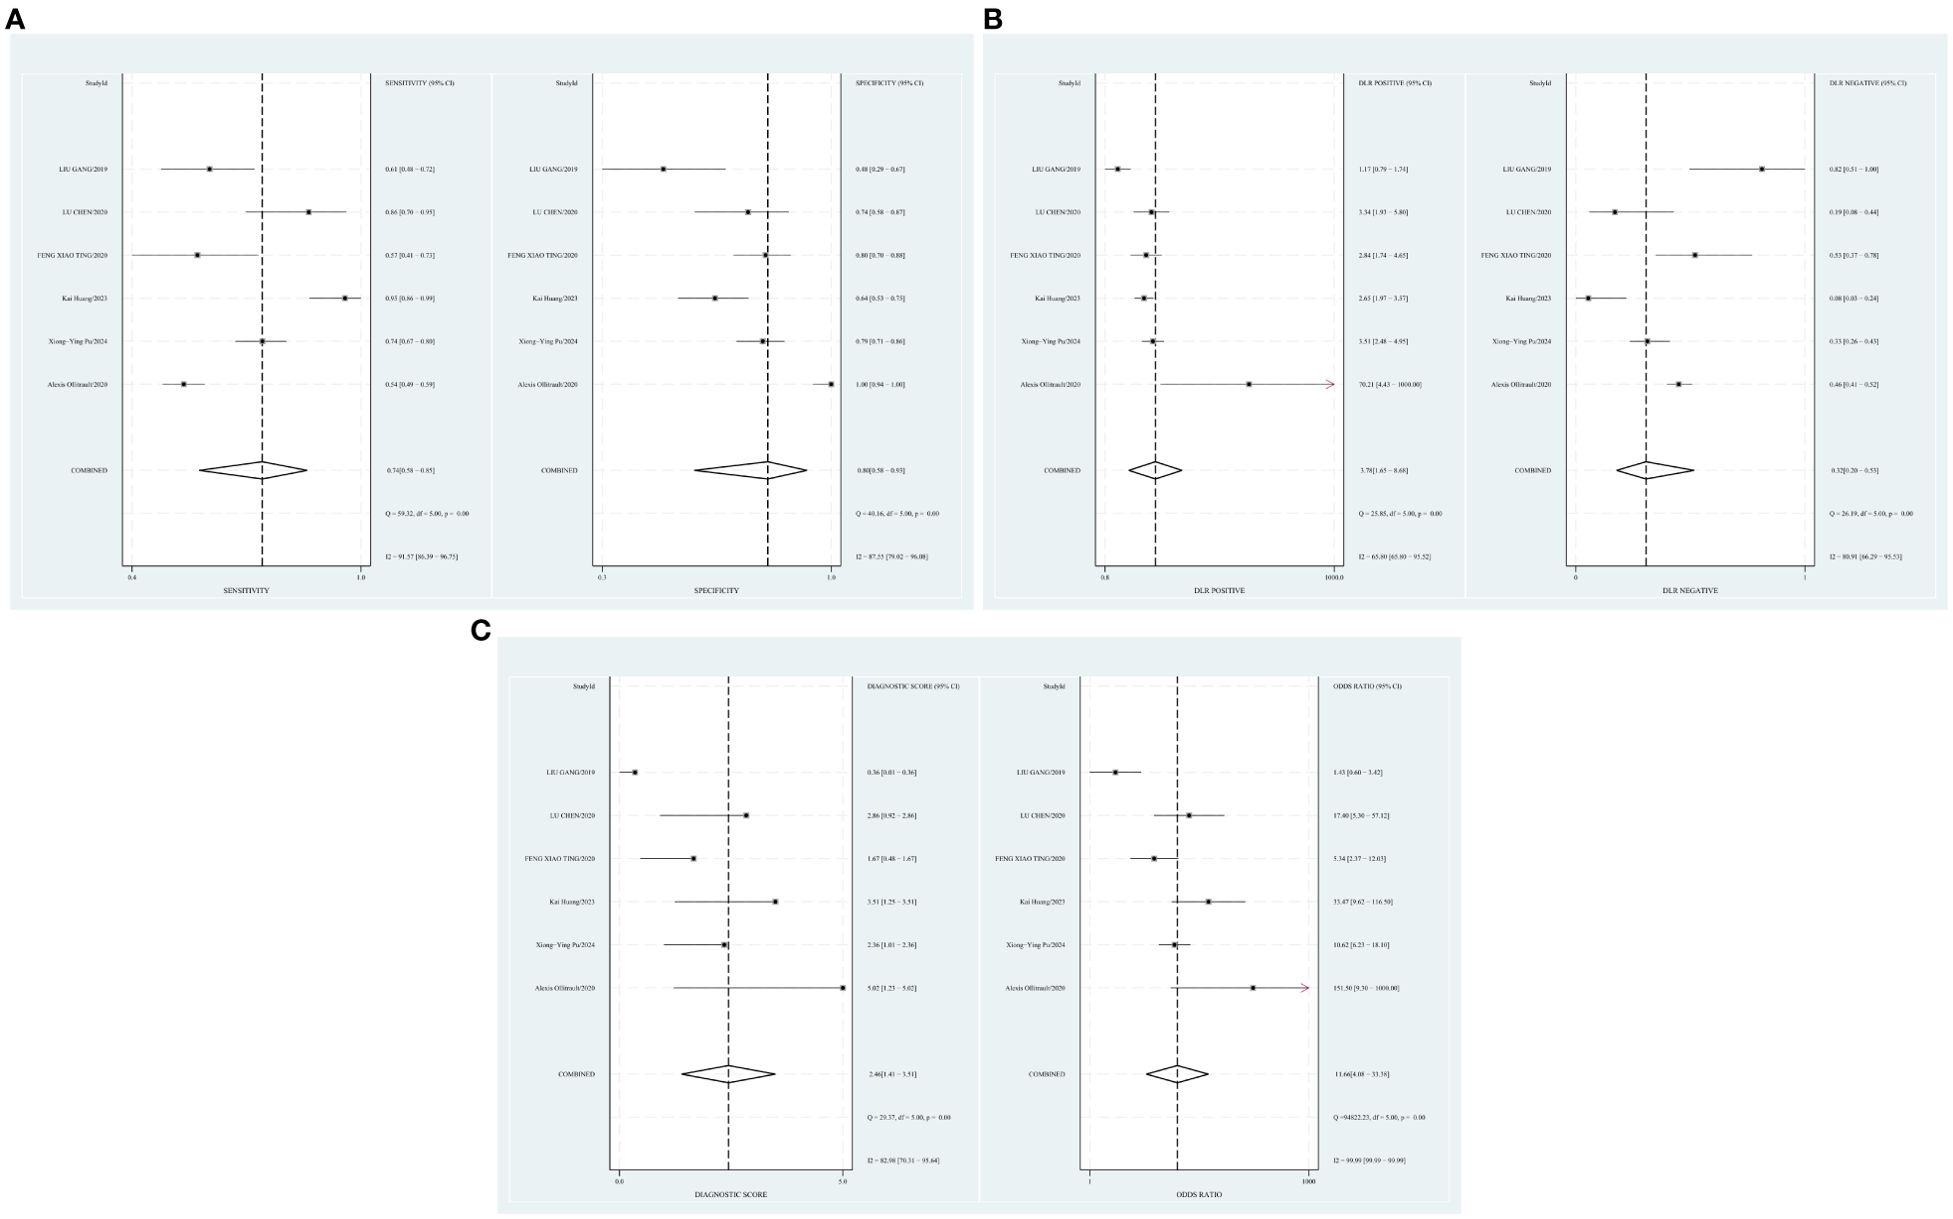
Figure 5. (A) Forest plot of sensitivity and specificity of Dixon in the diagnosis of TAO. (B) Forest plot of diagnosis likelihood ratio (DLR) of Dixon in the diagnosis of TAO. (C) Forest plot of the diagnostic odds ratio (DOR) of Dixon in the diagnosis of TAO.
Publication bias and heterogeneity
A p-value of 0.20 (p > 0.05) (Supplementary Figure 4) indicated the absence of publication bias. There was one study outside of the border, representing heterogeneity among the included studies (see Supplementary Figure 5).
Threshold effect
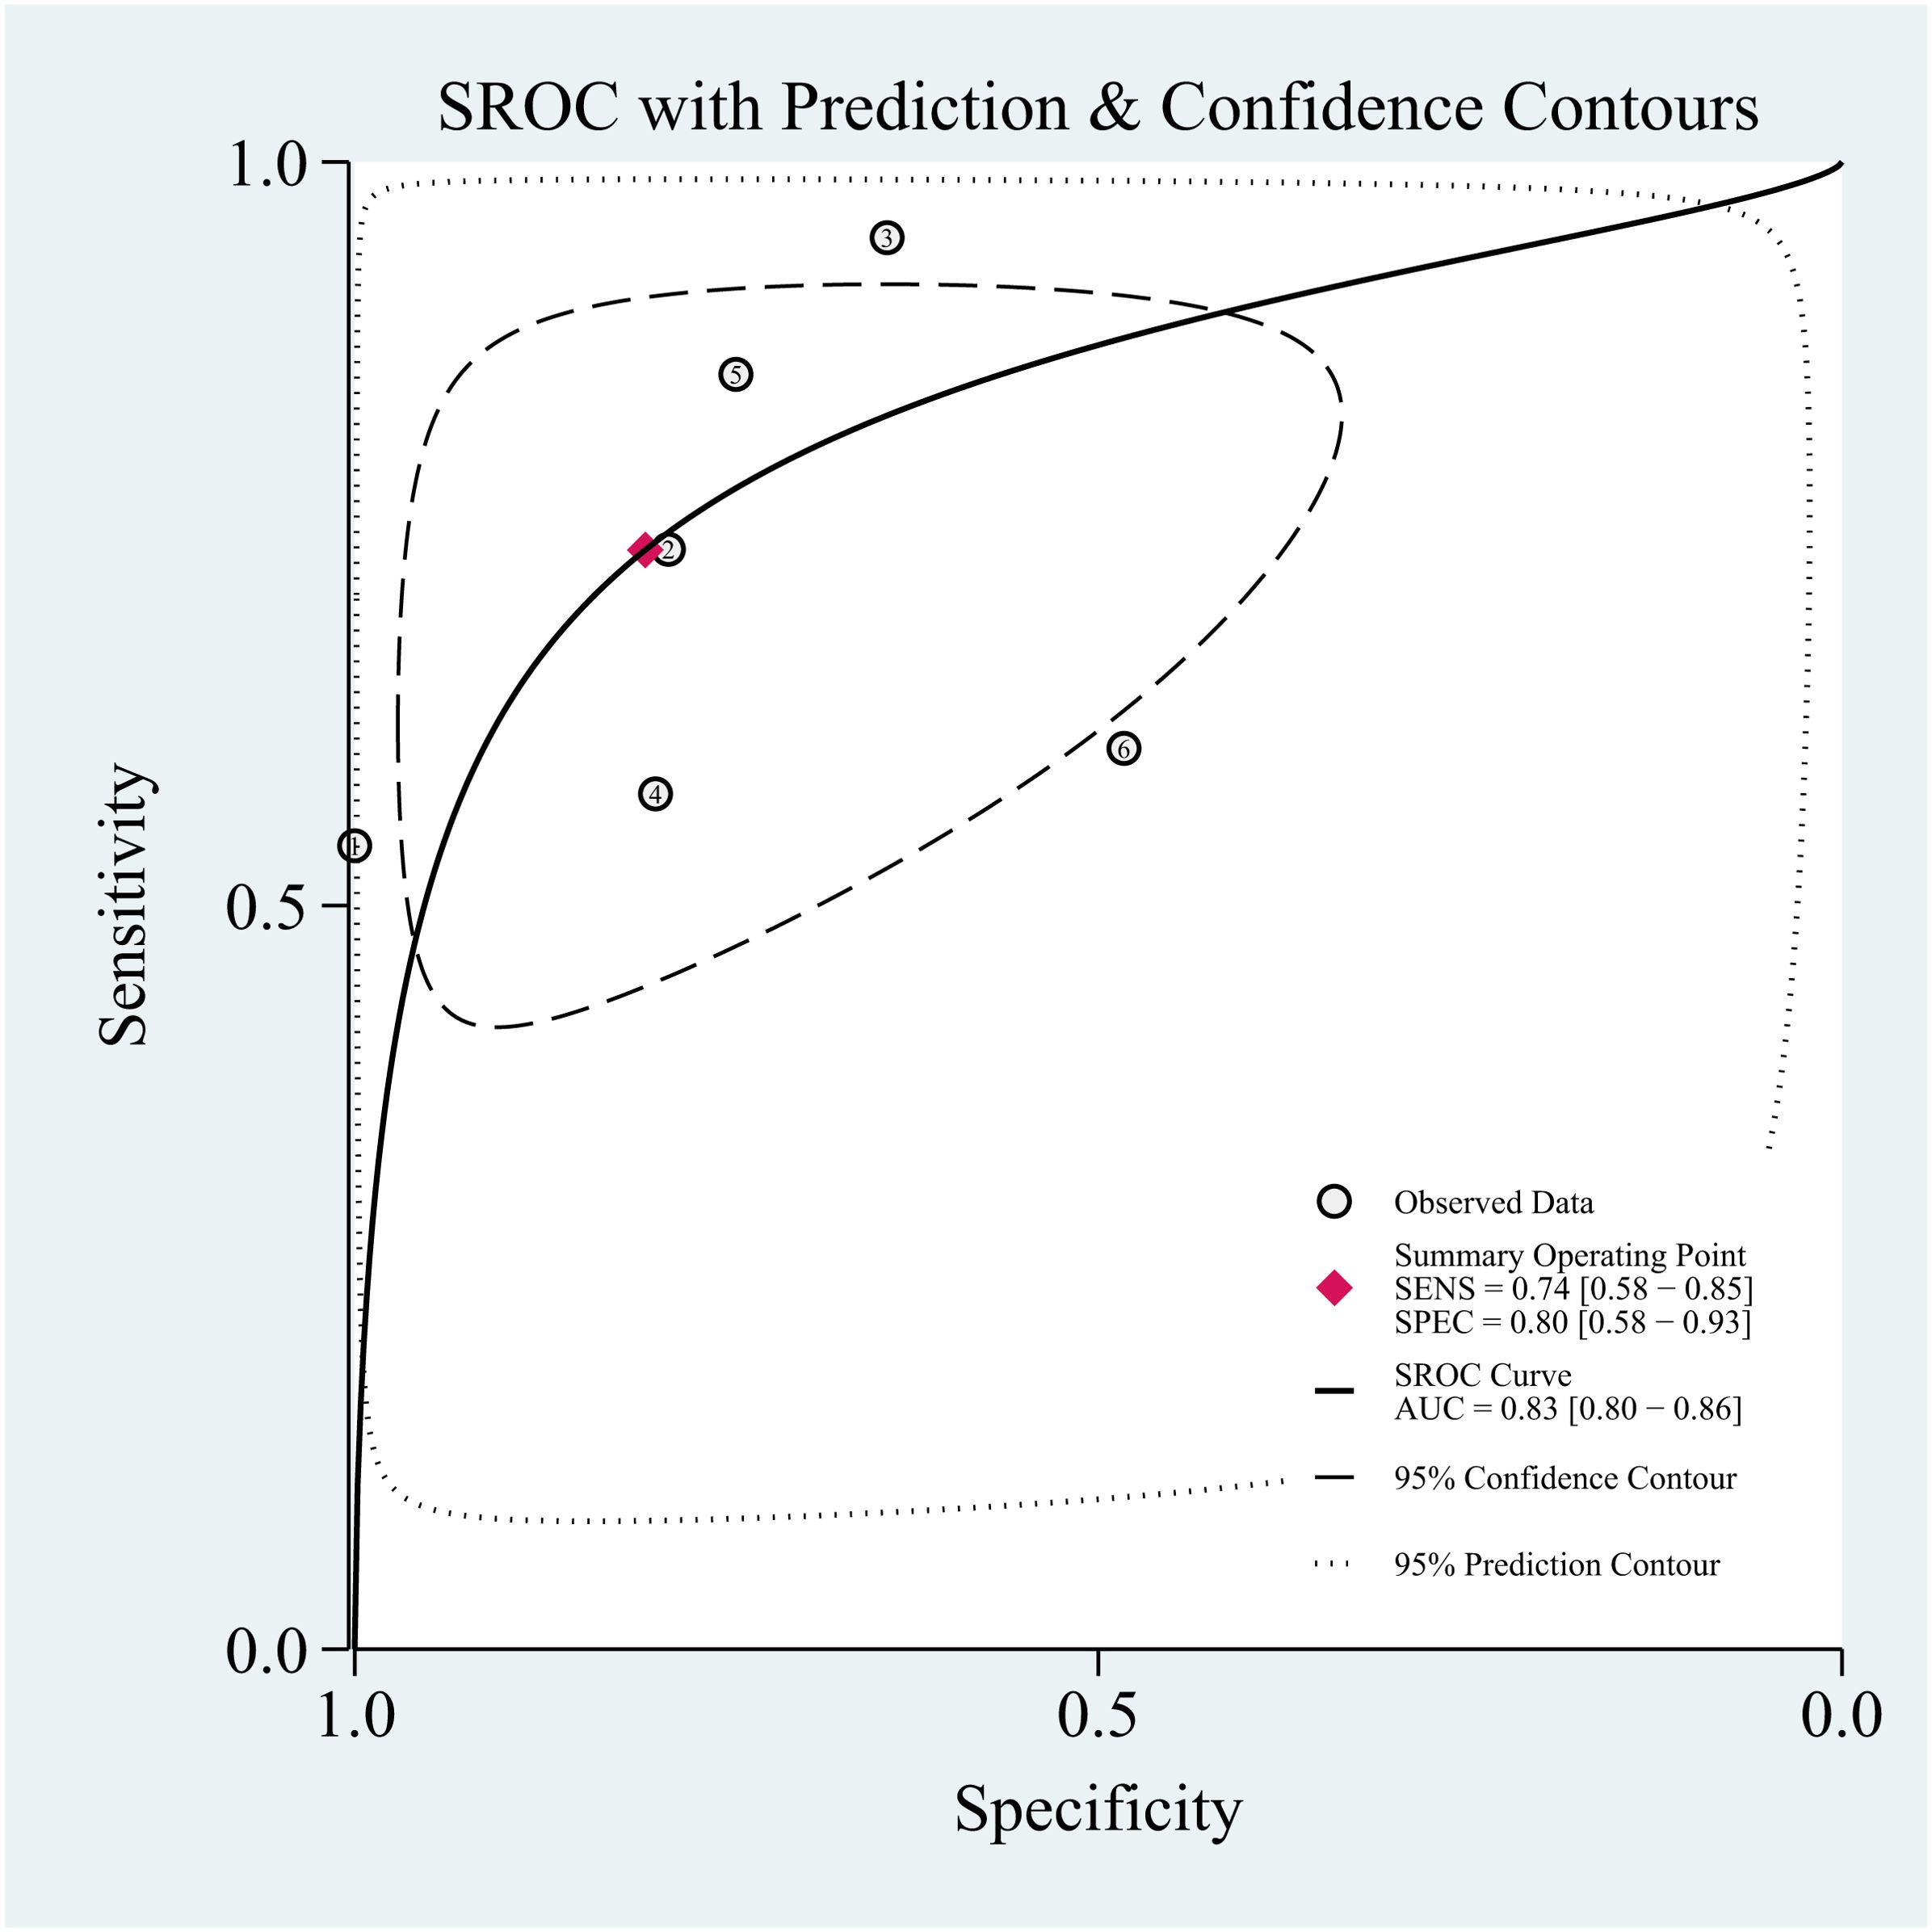
The threshold effect was assessed by the SROC curve plane test. The typical “shoulder arm” was not revealed in Figure 6, representing the inexistence of a threshold effect. The AUC was 0.83 [95% CI (0.80–0.86)], indicating a moderate diagnostic value of Dixon.
Pre-test probability, LR, and post-test probability
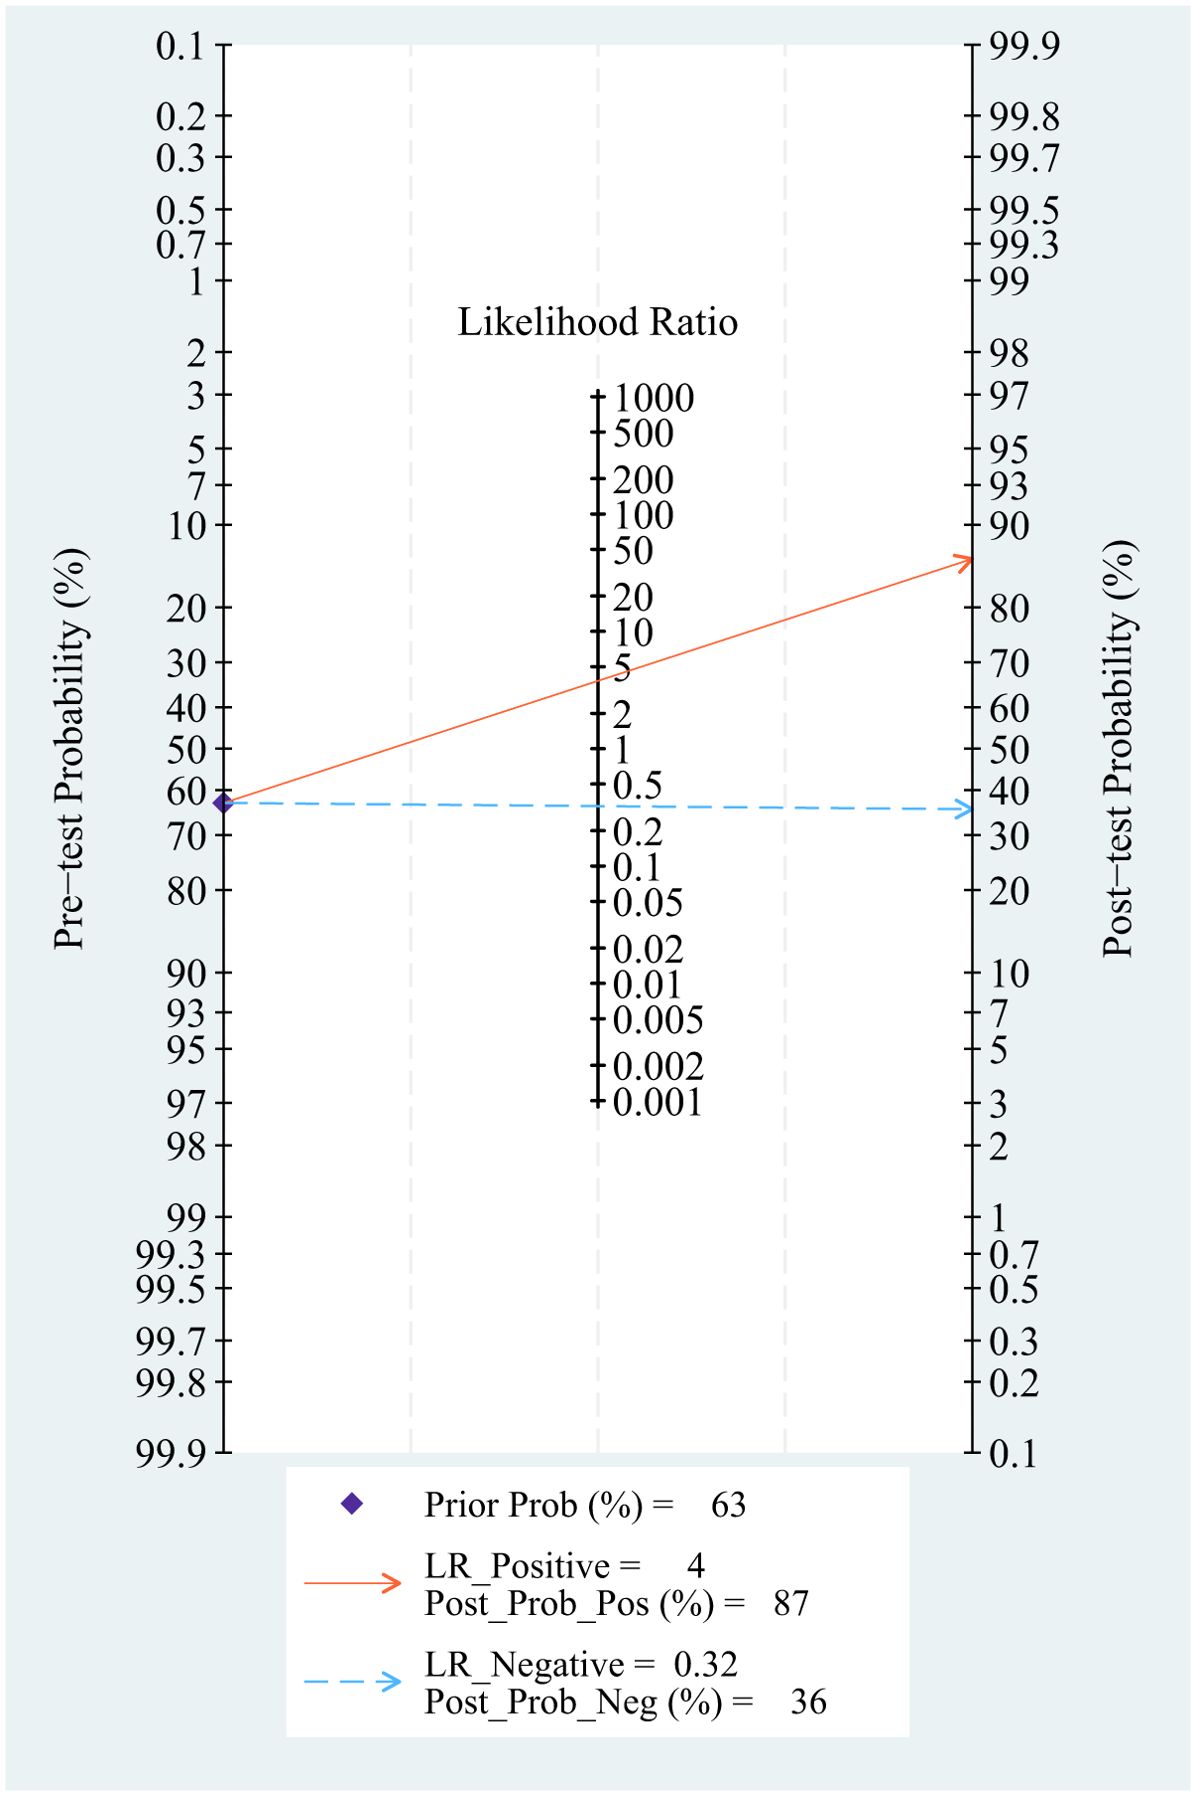
Setting the pre-test probability as 63% in advance, the post-test probability of TAO patients was 87%. The post-test probabilities were also calculated. Moreover, the PLR was less than 10 (PLR = 3.8), and the NLR was greater than 0.1 (NLR = 0.32). The value of diagnosis and excluded of Dixon against TAO disease were both limited (see Figure 7).
Meta-regression and subgroup analysis
The meta-regression analysis indicated that the factors including fulverif are blinded and did not affect the heterogeneity of sensitivity and specificity (see Supplementary Figure 6).
Comparison of T2 mapping and Dixon
The comparison between T2 mapping and Dixon was demonstrated by ROC, sensitivity, and specificity analyses. Between T2 mapping and Dixon, the latter presented a better diagnostic value among AUC, sensitivity, and specificity (see Table 2 for details).
Discussion
Currently, there is still a lack of accurate diagnostic methods for TAO activity. Early diagnosis can significantly improve treatment. Therefore, the diagnosis of TAO activity is of great clinical significance. This systematic review and meta-analysis assessed the diagnostic efficiency of T2 mapping and Dixon in TAO. In brief, 17 studies were included, involving 1,455 samples. Two diagnostic methods have moderate value for DOR as an active diagnosis for evaluation. Meanwhile, Dixon has a higher sensitivity and higher ROC than T2 mapping. Studies have found that many patients with a CAS of 1 or 2 show a significant response to immunosuppressive therapy, and they suggest that the CAS cutoff of 3 points as stated by the European panel may not be appropriate for Asian populations (8). Thus, finding a valuable index to distinguish the stage of TAO patients in Asian populations remains a great challenge.
Dixon can quantitatively measure the water–fat content of tissues. It presents the advantages of short scanning time and good fat suppression. CAS is often used to evaluate the activity of TAO. However, CAS has strong subjectivity, low sensitivity, and low specificity. For example, Son’s study showed that all but one water map equals the fat suppression sequence. Dixon-T2WI can also generate fat maps, allowing quantitative analysis of fat content, and with higher signal values in the edematous fraction, Dixon-T2WI was shown to improve the sensitivity and specificity of the diagnosis (42). Regarding Dixon, six studies that exhibited heterogeneity in diagnosing the activity of TAO patients due to their different choice of effect measures were included. Kai Huang (39) and Lu Chen (23) utilized the signal intensity ratio of extraocular muscles (SIR-EOM). Liu Gang (41) selected the fat fraction (FF) as his parameter. Feng Xiaoting (40) incorporated both SIR-EOM and FF in her analysis. Alexis Ollitrault (37) chose EOM inflammation as his primary parameter. On the other hand, Xiong-Ying Pu (38) combined the EOM-SIR, the Lacrimal Glands-SIR (LG-SIR), and the LG-FF. Among these, the study by Alexis Ollitraul (37) and his team exhibited the highest sensitivity of 100%, which may be attributed to its prospective nature, the inclusion of 206 patients, and the implementation of a second reading session for imaging analysis 8 weeks later to assess intra-observer agreement. Conversely, Feng Xiaoting’s study (40) had the lowest sensitivity of 56.1%, which may be related to the lack of blinding and consistent validation methods. In Liu Gang’s study (41), the small sample size may have inevitably led to bias in data collection.
T2 mapping is a quantitative MRI technique. T2RT is tissue-specific, which can reflect the subtle changes of disease evolution and treatment, and achieve non-invasive quantification of histopathological changes. For example, Luo’s study disclosed that by using the T2RT, orbital MRI not only detects the presence or absence of swollen tissue, but also objectively and quantitatively evaluates the inflammatory activity of the orbital tissue in TAO patients (43). In T2 mapping, we included 11 studies, namely, 5 retrospective studies and 6 prospective studies. Each study included a large number of subjects and had a satisfactory description of the indicators, a statistical description of the trial, an adequate description of the study subjects, satisfactory reporting of the results, and strict design and execution criteria. However, only five articles mentioned the use of blinding, and three articles did not use the same method of verification.
Both T2 mapping and Dixon had a similar diagnostic performance for TAO, with a DOR of 12 and 11.66, respectively. Dixon was slightly superior to T2 mapping in the diagnosis of active TAO (0.74 vs. 0.70). The diagnostic efficacy of T2 mapping in the diagnosis of inactive patients was slightly higher than that of Dixon (0.84 vs. 0.80), but the AUC under the ROC curve of Dixon was slightly higher than that of T2. In clinical practice, Dixon is mainly used for the evaluation of liver fat deposition and breast MRI to eliminate the interference of high fat signal, inflammation, and edema. The basic pathological features of TAO include the infiltration of immune cells in the orbit, the deposition of hydrophilic substances, and the enlargement of EOM and orbital adipose tissue, and the main pathological changes in the active stage are the infiltration of inflammatory cells and inflammatory edema in the orbital tissue. Therefore, Dixon presented much better diagnostic efficiency than T2 mapping.
Dixon and T2 mapping also have their own limitations in the terms of diagnostic value. At present, T2 mapping technology is mainly used to judge the activity of EOM. There are few studies on the judgment of lacrimal gland and orbital fat that need to be further validated. The Dixon technique is mainly based on long echo sequences, and it is sensitive to motion. It has certain limitations in TAO patients, whose eyeballs could not remain still during the examination.
Conclusion
The use of Dixon showed higher sensitivity and AUC for detecting the activity of TAO than T2 mapping. Dixon is expected to further improve the diagnostic accuracy of the activity of TAO.
Limitation
Firstly, most of the studies included were from Asia, especially China, which may cause research bias due to the largest disease population. Secondly, the EUGOGO CAS score, generated from Europe and America, was based on Caucasian populations. The lower incidence of eyelid redness and swelling in Asians than in Caucasians (5.13%–10.26% vs. 53.5%) may lead to lower sensitivity in the CAS score. Finally, Dixon is an emerging diagnostic method for TAO, and more lines of evidence need to be further collected.
Data availability statement
The original contributions presented in the study are included in the article/Supplementary Material. Further inquiries can be directed to the corresponding authors.
Author contributions
FZ: Data curation, Formal Analysis, Writing – original draft. PW: Data curation, Writing – original draft. CC: Formal Analysis, Writing – review & editing. XP: Formal Analysis, Writing – original draft. TZ: Writing – review & editing. MF: Conceptualization, Writing – review & editing. YG: Conceptualization, Writing – review & editing.
Funding
The author(s) declare financial support was received for the research, authorship, and/or publication of this article. This study was supported by the National Science Foundation of China (No.82103729), the China Baoyuan Research Project (CBYI202101), School joint funding 23LHPDZYB08, 416 Hospital funding (SYL2024ZC014) and Natural science funding of Chengdu Medical College (CYZYB23—07).
Acknowledgments
We thank Prof. Huang Min and Prof Fan Xu from Public Health of Chengdu medical college for providing valuable suggestions and concept of proof.
Conflict of interest
The authors declare that the research was conducted in the absence of any commercial or financial relationships that could be construed as a potential conflict of interest.
Generative AI statement
The author(s) declare that no Generative AI was used in the creation of this manuscript.
Publisher’s note
All claims expressed in this article are solely those of the authors and do not necessarily represent those of their affiliated organizations, or those of the publisher, the editors and the reviewers. Any product that may be evaluated in this article, or claim that may be made by its manufacturer, is not guaranteed or endorsed by the publisher.
Supplementary material
The Supplementary Material for this article can be found online at: https://www.frontiersin.org/articles/10.3389/fendo.2024.1502296/full#supplementary-material
Supplementary Figure 1 | Deeks’ funnel plot.
Supplementary Figure 2 | Bivariate boxplot.
Supplementary Figure 3 | T2-Multiple univariate meta-regression and subgroup analysis. Prospective design: prodesign; fulverif: partial verification bias; subjdescr: adequate description of study participants
Supplementary Figure 4 | Deeks’ funnel plot.
Supplementary Figure 5 | Bivariate boxplot.
Supplementary Figure 6 | Dixon-Multiple univariate meta-regression and subgroup analysis. Fulverif: partial verification bias; subjdescr.
References
1. Bartalena L, Kahaly GJ, Baldeschi L, Dayan CM, Eckstein A, Marcocci C, et al. The 2021 European Group on Graves' Orbitopathy (Eugogo) Clinical Practice Guidelines for the Medical Management of Graves' Orbitopathy. Eur J Endocrinol. (2021) 185:G43–g67. doi: 10.1530/eje-21-0479
2. Chen L, Chen W, Chen HH, Wu Q, Xu XQ, Hu H, et al. Radiological Staging of Thyroid-Associated Ophthalmopathy: Comparison of T1 Mapping with Conventional Mri. Int J Endocrinol. (2020) 2020:2575710. doi: 10.1155/2020/2575710
3. Huang Y, Fang S, Li D, Zhou H, Li B, Fan X. The Involvement of T Cell Pathogenesis in Thyroid-Associated Ophthalmopathy. Eye (Lond). (2019) 33:176–82. doi: 10.1038/s41433-018-0279-9
4. Rachmasari KN, Hamadi D, Thapa P, Bradley EA, Stan MN. The Epidemiology of Thyroid Eye Disease in Olmsted County, Minnesota, 2005-2020. Thyroid. (2024). doi: 10.1089/thy.2024.0304
5. Men CJ, Kossler AL, Wester ST. Updates on the Understanding and Management of Thyroid Eye Disease. Ther Adv Ophthalmol. (2021) 13:25158414211027760. doi: 10.1177/25158414211027760
6. Mourits MP, Koornneef L, Wiersinga WM, Prummel MF, Berghout A, van der Gaag R. Clinical Criteria for the Assessment of Disease Activity in Graves' Ophthalmopathy: A Novel Approach. Br J Ophthalmol. (1989) 73:639–44. doi: 10.1136/bjo.73.8.639
7. Drui D, Du Pasquier Fediaevski L, Vignal Clermont C, Daumerie C. Graves' Orbitopathy: Diagnosis and Treatment. Ann Endocrinol (Paris). (2018) 79:656–64. doi: 10.1016/j.ando.2018.08.005
8. Tachibana S, Murakami T, Noguchi H, Noguchi Y, Nakashima A, Ohyabu Y, et al. Orbital Magnetic Resonance Imaging Combined with Clinical Activity Score Can Improve the Sensitivity of Detection of Disease Activity and Prediction of Response to Immunosuppressive Therapy for Graves' Ophthalmopathy. Endocr J. (2010) 57:853–61. doi: 10.1507/endocrj.k10e-156
9. Feeney C, Lingam RK, Lee V, Rahman F, Nagendran S. Non-Epi-Dwi for Detection, Disease Monitoring, and Clinical Decision-Making in Thyroid Eye Disease. AJNR Am J Neuroradiol. (2020) 41:1466–72. doi: 10.3174/ajnr.A6664
10. Lee SH, Lee YH, Song HT, Suh JS. Quantitative T(2) Mapping of Knee Cartilage: Comparison between the Synthetic Mr Imaging and the Cpmg Sequence. Magn Reson Med Sci. (2018) 17:344–9. doi: 10.2463/mrms.tn.2017-0121
11. Ran J, Yin C, Liu C, Li Y, Hou B, Morelli JN, et al. The Diagnostic Value of Mr Ivim and T2 Mapping in Differentiating Autoimmune Myositis from Muscular Dystrophy. Acad Radiol. (2021) 28:e182–e8. doi: 10.1016/j.acra.2020.04.022
12. Bruno F, Marrelli A, Tommasino E, Martinese G, Gagliardi A, Pertici L, et al. Advanced Mri Imaging of Nerve Roots in Lumbar Radiculopathy Due to Discoradicular Conflict: Dwi, Dti, and T2 Mapping with Clinical and Neurophysiological Correlations. Radiol Med. (2022) 127:1270–6. doi: 10.1007/s11547-022-01550-0
13. Ferrero G, Sconfienza LM, Fiz F, Fabbro E, Corazza A, Dettore D, et al. Effect of Intra-Articular Injection of Intermediate-Weight Hyaluronic Acid on Hip and Knee Cartilage: In-Vivo Evaluation Using T2 Mapping. Eur Radiol. (2018) 28:2345–55. doi: 10.1007/s00330-017-5186-0
14. Bencikova D, Han F, Kannengieser S, Raudner M, Poetter-Lang S, Bastati N, et al. Evaluation of a Single-Breath-Hold Radial Turbo-Spin-Echo Sequence for T2 Mapping of the Liver at 3t. Eur Radiol. (2022) 32:3388–97. doi: 10.1007/s00330-021-08439-y
15. Bustin A, Hua A, Milotta G, Jaubert O, Hajhosseiny R, Ismail TF, et al. High-Spatial-Resolution 3d Whole-Heart Mri T2 Mapping for Assessment of Myocarditis. Radiology. (2021) 298:578–86. doi: 10.1148/radiol.2021201630
16. He Y, Mu K, Liu R, Zhang J, Xiang N. Comparison of Two Different Regimens of Intravenous Methylprednisolone for Patients with Moderate to Severe and Active Graves' Ophthalmopathy: A Prospective, Randomized Controlled Trial. Endocr J. (2017) 64:141–9. doi: 10.1507/endocrj.EJ16-0083
17. Liu P, Chen L, Wang QX, Luo B, Su HH, Yuan G, et al. Histogram Analysis of T2 Mapping for Detecting Early Involvement of Extraocular Muscles in Patients with Thyroid-Associated Ophthalmopathy. Sci Rep. (2020) 10:19445. doi: 10.1038/s41598-020-76341-6
18. Hou K, Ai T, Hu WK, Luo B, Wu YP, Liu R. Three Dimensional Orbital Magnetic Resonance T2-Mapping in the Evaluation of Patients with Graves' Ophthalmopathy. J Huazhong Univ Sci Technolog Med Sci. (2017) 37:938–42. doi: 10.1007/s11596-017-1831-8
19. Kirchgesner T, Stoenoiu M, Michoux N, Durez P, Vande Berg B. Comparison between 3-Point Dixon- and Chess-Based Omeract-Recommended Mri Protocols in Hands of Patients with Suspicion of Early Rheumatoid Arthritis. Eur J Radiol. (2021) 134:109412. doi: 10.1016/j.ejrad.2020.109412
20. Dixon WT. Simple Proton Spectroscopic Imaging. Radiology. (1984) 153:189–94. doi: 10.1148/radiology.153.1.6089263
21. Sun J, Xing Z, Chen J, Zha T, Cao Y, Zhang D, et al. Fat Status Detection and Histotypes Differentiation in Solid Renal Masses Using Dixon Technique. Clin Imaging. (2018) 51:12–22. doi: 10.1016/j.clinimag.2018.01.012
22. Kox LS, Kraan RBJ, Mazzoli V, Mens MA, Kerkhoffs G, Nederveen AJ, et al. It's a Thin Line: Development and Validation of Dixon Mri-Based Semi-Quantitative Assessment of Stress-Related Bone Marrow Edema in the Wrists of Young Gymnasts and Non-Gymnasts. Eur Radiol. (2020) 30:1534–43. doi: 10.1007/s00330-019-06446-8
23. Chen L, Hu H, Chen HH, Chen W, Wu Q, Wu FY, et al. Usefulness of Two-Point Dixon T2-Weighted Imaging in Thyroid-Associated Ophthalmopathy: Comparison with Conventional Fat Saturation Imaging in Fat Suppression Quality and Staging Performance. Br J Radiol. (2021) 94:20200884. doi: 10.1259/bjr.20200884
24. Whiting PF, Rutjes AW, Westwood ME, Mallett S, Deeks JJ, Reitsma JB, et al. Quadas-2: A Revised Tool for the Quality Assessment of Diagnostic Accuracy Studies. Ann Intern Med. (2011) 155:529–36. doi: 10.7326/0003-4819-155-8-201110180-00009
25. Page MJ, McKenzie JE, Bossuyt PM, Boutron I, Hoffmann TC, Mulrow CD, et al. The Prisma 2020 Statement: An Updated Guideline for Reporting Systematic Reviews. J Clin Epidemiol. (2021) 134:178–89. doi: 10.1016/j.jclinepi.2021.03.001
26. Wang LFY, Long J, Zhang M-Q, Liu C. Value of Evaluating Graves Ophthalmopathy Motiliny by Mri T2-Mapping. Chin PLA Med J. (2024) 49:70–4. doi: 10.11855/j.issn.0577-7402.1757.2023.0619
27. Qing Z. Clinical Application of Mri T2 Mapping、Stir Sequences in Activity Evaluation and Efficacy Evaluation of Thyroid-Associated Ophthalmopathy. Southern Medical University, Guangdong (2020). doi: 10.27003/d.cnki.gojyu.2020.000400
28. Li D, Li H, Jiang J. Clinical Study of Intravoxel Incoherent Motion Diffusion-Weighted Imaging and T2 Mapping in Evaluating the Activity of Thyroid-Associated Ophthalmopathy. magnetic resonance Imaging. (2021) 12:66–9+73. doi: 10.12015/issn.1674-8034.2021.10.015
29. Jiang H, Yan F, Xian J, Ai L. T2 Mapping Mri in Prediction of Graves Ophthalmopathy Activity. Chin J Radiol. (2018) 52:655–9. doi: 10.3760/cma.j.issn.1005-1201.2018.09.002
30. Li Z, Luo Y, Feng X, Zhang Q, Zhong Q, Weng C, et al. Application of Multiparameter Quantitative Magnetic Resonance Imaging in the Evaluation of Graves' Ophthalmopathy. J Magn Reson Imaging. (2023) 58:1279–89. doi: 10.1002/jmri.28642
31. Cheng J, Zhang X, Lian J, Piao Z, Zhou L, Gou X, et al. Evaluation of Activity of Graves' Orbitopathy with Multiparameter Orbital Magnetic Resonance Imaging (Mri). Quant Imaging Med Surg. (2023) 13:3040–9. doi: 10.21037/qims-22-814
32. Feiyun CWHHXXSGCHW. Clinical Value of Quantitative Measurements of Extraocular Muscles with T2 Mapping in the Diagnosis and Staging of Thyroid⁃Associated Ophthalmopathy. Acta Univ Med Nanjing. (2019) 39:141–4. doi: 10.7655/NYDXBNS20190129
33. Chen W, Hu H, Chen HH, Su GY, Yang T, Xu XQ, et al. Utility of T2 Mapping in the Staging of Thyroid-Associated Ophthalmopathy: Efficiency of Region of Interest Selection Methods. Acta Radiol. (2020) 61:1512–9. doi: 10.1177/0284185120905032
34. Lu-yan WY-x SU, Lin-qi. Correlation between Mri Parameters GUO. and Activity of Patients with Graves Ophthalmopathy. Chin J CT MRI. (2022) 20:52–4. doi: 10.3969/j.issn.1672-5131.2022.11.020
35. Yang L, Dai X, Su J, Yang S, Zheng Y, Ma M, et al. Performance of T2 Mapping in the Staging of Graves' Ophthalmopathy Based on Different Region of Interest Selection Methods. Acta Radiol. (2024) 65:835–40. doi: 10.1177/02841851241248640
36. Li D, Guo X, Zeng J, Feng H, Zhu T, Li H. T2 Relaxation Time in Extraocular Muscles of Patients with Mild Thyroid- Associated Ophthalmopathy: Comparing T2 Mapping with and without Fat Suppression Using Different Measurement Methods. Curr Med Imaging. (2024) 20:e15734056299907. doi: 10.2174/0115734056299907240404064636
37. Ollitrault A, Charbonneau F, Herdan ML, Bergès O, Zuber K, Giovansili L, et al. Dixon-T2wi Magnetic Resonance Imaging at 3 tesla Outperforms Conventional Imaging for Thyroid Eye Disease. Eur Radiol. (2021) 31:5198–205. doi: 10.1007/s00330-020-07540-y
38. Pu XY, Chen L, Hu H, Wu Q, Jiang WH, Lu JL, et al. Dixon Mri-Based Quantitative Parameters of Extraocular Muscles, Intraorbital Fat, and Lacrimal Glands for Staging Thyroid-Associated Ophthalmopathy. Insights Imaging. (2024) 15:136. doi: 10.1186/s13244-024-01693-w
39. Huang K, Lin X, Luo Y, Hu Q, Guo B, Ouyang F, et al. Image Quality and Evaluation Ability of Magnetic Resonance Imaging Techniques for Thyroid-Associated Ophthalmopathy: Dixon Fat-Suppression Technique Vs. Spectral Attenuated Inversion Recovery. Front Med (Lausanne). (2023) 10:1154828. doi: 10.3389/fmed.2023.1154828
40. Feng XT. Clinical Data Analysis of 225 Patients with Thyroid Associated Ophthalmopathy and the Exploration on Clinical Application of Mri Fat Quantification in Evaluating Disease. Southern Medical University, Guangdong (2019). doi: 10.27003/d.cnki.gojyu.2019.000163
41. Liu G, Zhu RR, Sheng XL, Jiao HJ, Ha RS. Evaluation of Thyroid-Associated Ophthalmopathy Activity by Using Magnetic Resonance Fat Quantification Technology. Chin J Of Exp Ophthalmol. (2019) 37:6. doi: 10.3760/cma.j.issn.2095-0160.2019.12.008
42. Song C, Luo Y, Yu G, Chen H, Shen J. Current Insights of Applying Mri in Graves' Ophthalmopathy. Front Endocrinol (Lausanne). (2022) 13:991588. doi: 10.3389/fendo.2022.991588
Keywords: thyroid-associated ophthalmopathy, Dixon, T2 mapping, diagnosis, meta-analysis
Citation: Zhang F, Wang P, Cao C, Pan X, Zhang T, Fan M and Guan Y (2024) The diagnostic performance comparison between T2 mapping and Dixon against the activity of thyroid-associated ophthalmopathy: a systematic review and meta-analysis. Front. Endocrinol. 15:1502296. doi: 10.3389/fendo.2024.1502296
Received: 26 September 2024; Accepted: 20 November 2024;
Published: 12 December 2024.
Edited by:
Dhiraj Kumar, National Eye Institute (NIH), United StatesReviewed by:
Zinia Mohanta, Johns Hopkins University, United StatesDia Advani, Mohammed Bin Rashid University of Medicine and Health Sciences, United Arab Emirates
Copyright © 2024 Zhang, Wang, Cao, Pan, Zhang, Fan and Guan. This is an open-access article distributed under the terms of the Creative Commons Attribution License (CC BY). The use, distribution or reproduction in other forums is permitted, provided the original author(s) and the copyright owner(s) are credited and that the original publication in this journal is cited, in accordance with accepted academic practice. No use, distribution or reproduction is permitted which does not comply with these terms.
*Correspondence: Meng Fan, ZmFubWVuZ0BjbWMuZWR1LmNu; Yu Guan, NjkzNTk0MTcxQHFxLmNvbQ==
†These authors have contributed equally to this work
 Fuyi Zhang
 Pengcheng Wang2†
 Tao Zhang
