- Department of Orthopaedics, The first people’s hospital of Zhaoqing, Zhaoqing, China
Background: Remnant cholesterol (RC) is a novel lipid metabolism indicator; however, its relationship with sarcopenia has not been clearly established. This study was conducted to explore the association between RC and sarcopenia.
Methods: An analysis was performed utilizing cross-sectional data from the NHANES 2011–2018. The variable RC was subjected to a logarithmic transformation to address its skewness. Logistic regression studies were conducted to examine the association between RC and sarcopenia. This study used restricted cubic spline (RCS) and threshold saturation techniques to investigate nonlinear connections. Subgroup, sensitivity, and additional analyses were performed to assess the robustness and validity of the findings.
Results: The study included 4636 participants. Participants with sarcopenia had significantly higher RC levels. Logistic regression demonstrated a substantial positive association between the prevalence of sarcopenia and log RC (OR=1.69, 95% CI=1.32-2.17). RCS analysis revealed a nonlinear relationship, identifying a threshold at RC=25. When the RC is below this threshold, every one-unit increase in RC increases the chance of sarcopenia by 7% (OR=1.07, 95% CI=1.04-1.10); above this threshold, changes in RC were not significant. Subgroup analysis confirmed that RC was an independent risk factor for sarcopenia. The sensitivity and supplementary analyses supported the main findings.
Conclusion: This study demonstrates a significant positive association between RC levels and the prevalence of sarcopenia in U.S. adults, offering novel evidence that RC may serve as a valuable indicator for sarcopenia assessment.
1 Introduction
The progressive loss of skeletal muscle mass and strength is the hallmark of sarcopenia, which typically results in a decline in physical function and a lower quality of life (1, 2). It is significantly linked to functional impairment, disability, and increased mortality, and it increases the risk of accidents and fractures (3, 4). Although primarily associated with aging, sarcopenia has also been reported in younger populations (5). Studies indicate that sarcopenia affects 10–16% of elderly individuals worldwide (3). It is anticipated that the prevalence of sarcopenia will increase as the global population ages, which could result in a substantial increase in healthcare expenses and present substantial obstacles for public health systems. Recently, an increasing number of studies have focused on sarcopenia, and identifying the factors that contribute to the prevalence of sarcopenia is critical to improving health and quality of life (6–8).
Recently, remnant cholesterol (RC) has gained attention as a novel indicator of lipid metabolism (9). Traditional lipid testing primarily focuses on low-density lipoprotein cholesterol (LDL-C) and high-density lipoprotein cholesterol (HDL-C). RC is a triglyceride-rich lipoprotein, and a number of previous studies have confirmed the strong association between RC and health conditions (10–12). One study indicated that RC is negatively correlated with total spine bone mineral density (BMD) in American adults, highlighting the importance of RC in bone health (13). Similarly, another study showed a significant positive association between RC values and hypertension, type 2 diabetes, and their coexisting risks, and may be mediated by inflammatory responses (14). Previous studies have shown that elevated RC levels are strongly associated with chronic inflammation and oxidative stress, which play an important role in the development of sarcopenia (14–17). However, there is a lack of current systematic research on the association of RC with sarcopenia, and filling this gap could help to understand the potential role of RC in muscle health. Assuming that RC is positively associated with the prevalence of sarcopenia, this finding will help expand the field of sarcopenia research and provide new indicators for identifying populations at high risk for sarcopenia.
2 Methods
2.1 Survey description
The National Health and Nutrition Examination Survey (NHANES) is a cross-sectional study that assesses the health and nutritional status of the U.S. population through the use of a complex stratified multistage sampling design with data covering physical examination results, laboratory data, and questionnaires on lifestyle and nutritional status. To guarantee the accuracy and representativeness of the sample, this investigation implements a multistage probability sampling methodology. The ethics review board approved the study, and all participants provided written informed consent. NHANES was recently used for sarcopenia evaluation in different studies (18–20).
2.2 Study population
Data from the NHANES 2011–2018 cycles, which span four cycles, were used in this study. The following criteria were used to determine inclusion: (1) participants were over 20 years old and pregnant, (2) participants had full data on sarcopenia, and (3) participants had complete data on RC. As the sarcopenia measurement data covered participants aged between 8 and 59 years, the final age range of the sample included in this study after passing the screening criteria was 20-59 years, an age range that makes the findings more generalizable and population-specific.
2.3 Calculation of RC
The RC concentration was calculated using a formula from previous studies that incorporated anthropometric data and blood biomarkers. The formula used was RC (mg/dL) = TC (mg/dL) - HDL (mg/dL) - LDL (mg/dL).
2.4 Definition of sarcopenia
Different definitions of sarcopenia exist. We used one from the Osteoarthritis Research Society International (OARSI), which defines sarcopenia as having a sarcopenia index (SMI) below 0.789 for males and 0.512 for females, according to their standards (21, 22). In NHANES, dual-energy X-ray absorptiometry (DEXA) is used to measure attached skeletal muscle mass (ASM). where ASM did not include bone mineral content (BMC) to avoid interference of BMD in the assessment of sarcopenia. The SMI was calculated as the ratio of total ASM (kg) to BMI (kg/m²).
2.5 Covariates
This study considered various covariates, including demographic characteristics, lifestyle factors, health status, and dietary habits. The demographic characteristics included age, sex, race, poverty index ratio (PIR), and education level. Lifestyle factors included smoking behavior and physical activity level. Smoking behavior was determined by a questionnaire, defining smokers as those who had smoked more than 100 cigarettes during their lifetime. Metabolic equivalents (MET) were employed to determine physical activity levels, and individuals with MET values below 600 (minutes/week) were classified as inactive. Health status was determined by physician diagnoses or self-reports, including diabetes, hypertension, hypercholesterolemia, and chronic kidney disease. Dietary habits included daily intake of energy, protein, carbohydrates, total sugar, dietary fiber, and total fat.
2.6 Statistical analysis
This study used data from the NHANES database from 2011 to 2018, covering four survey cycles, and to ensure that the sample was nationally representative, a weighted approach was used to correct for sampling bias by adjusting the data according to the sample weights provided by NHANES (WTMEC2YR). Data processing included the exclusion of missing data for the primary exposure variable and the outcome variable, whereas missing data for covariates were retained to maximize sample size. The baseline characteristics of the final participants were categorized by sarcopenia status in the descriptive analysis. The RC variable was log-transformed to reduce the effect of skewness and to bring it closer to a normal distribution. Logistic regression analysis was used to investigate the association between RC and sarcopenia, while accounting for numerous variables. The robustness of the results was improved by dividing RC into four categories to further investigate the association trends between sarcopenia and various RC levels. The study used restricted cubic spline (RCS) analysis to ascertain the nonlinear association between RC and sarcopenia. Additionally, threshold effect analysis was utilized to identify the crucial points. Subgroup analyses were conducted to examine the possible influence of stratification variables on the relationship between RC and sarcopenia. Ultimately, sensitivity and supplemental analyses were performed to assess the strength and reliability of the findings. The analyses were performed using R software (version 4.2.3), and statistical significance was defined as P < 0.05.
3 Results
3.1 Baseline characteristics
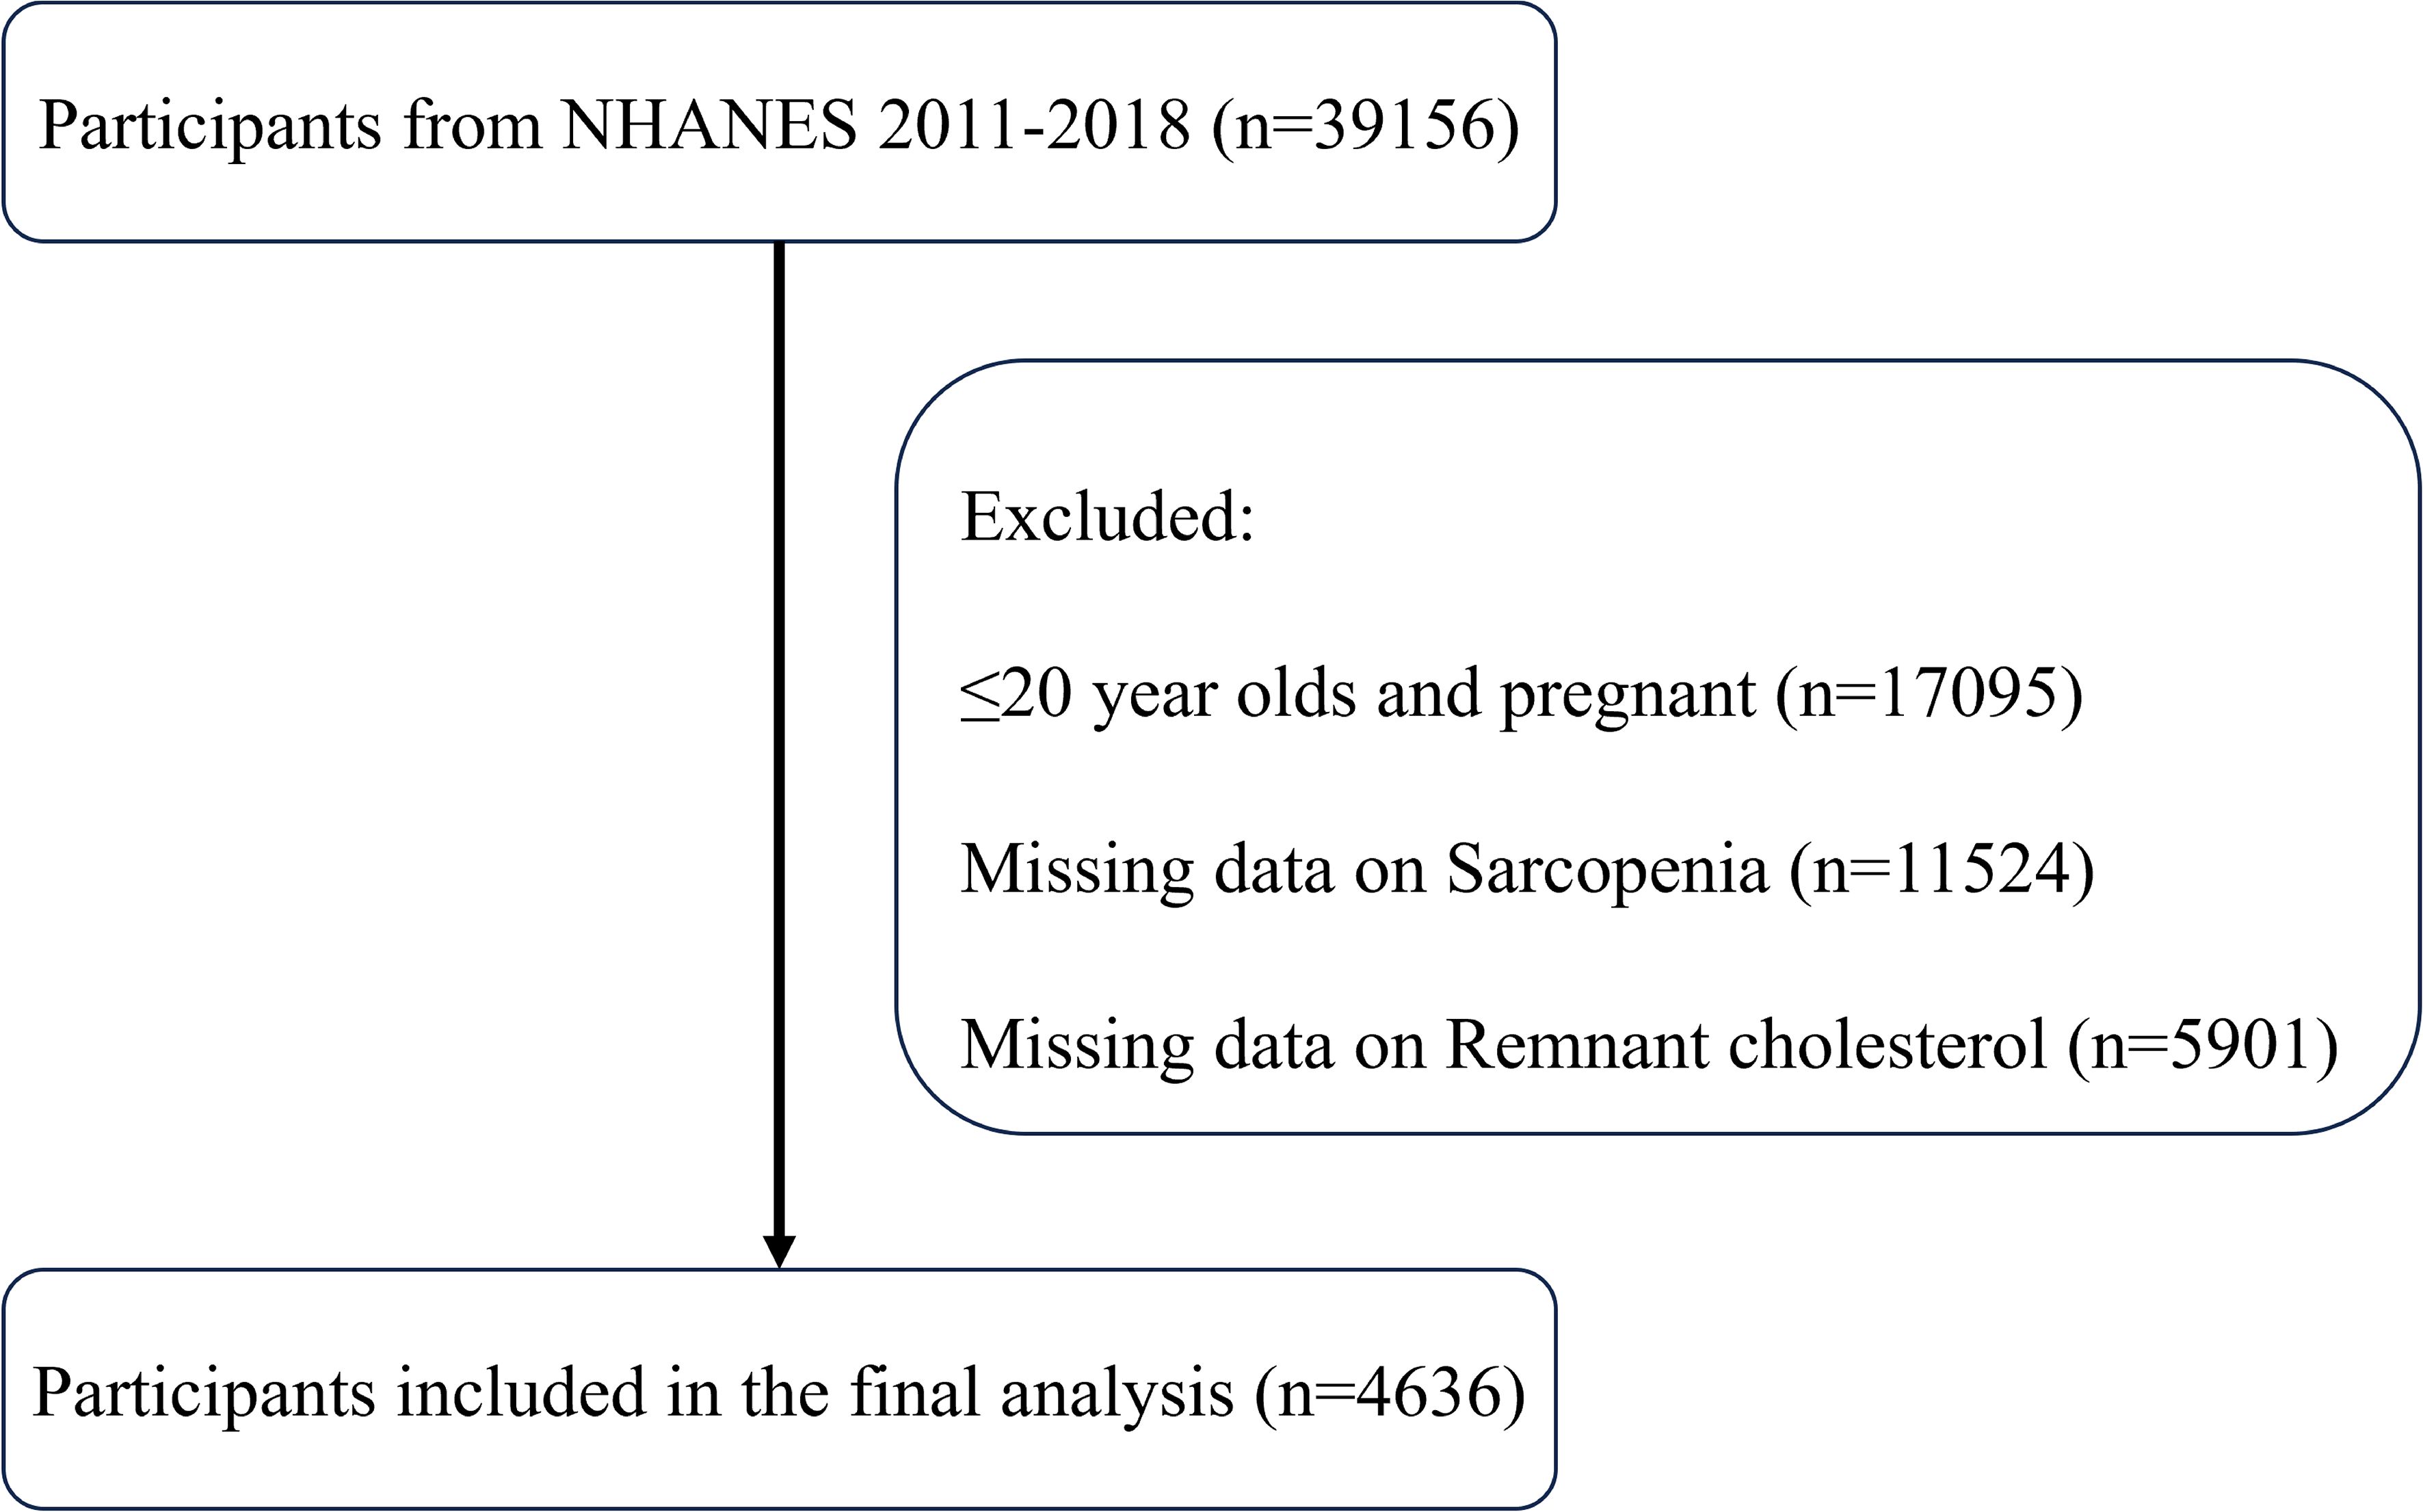
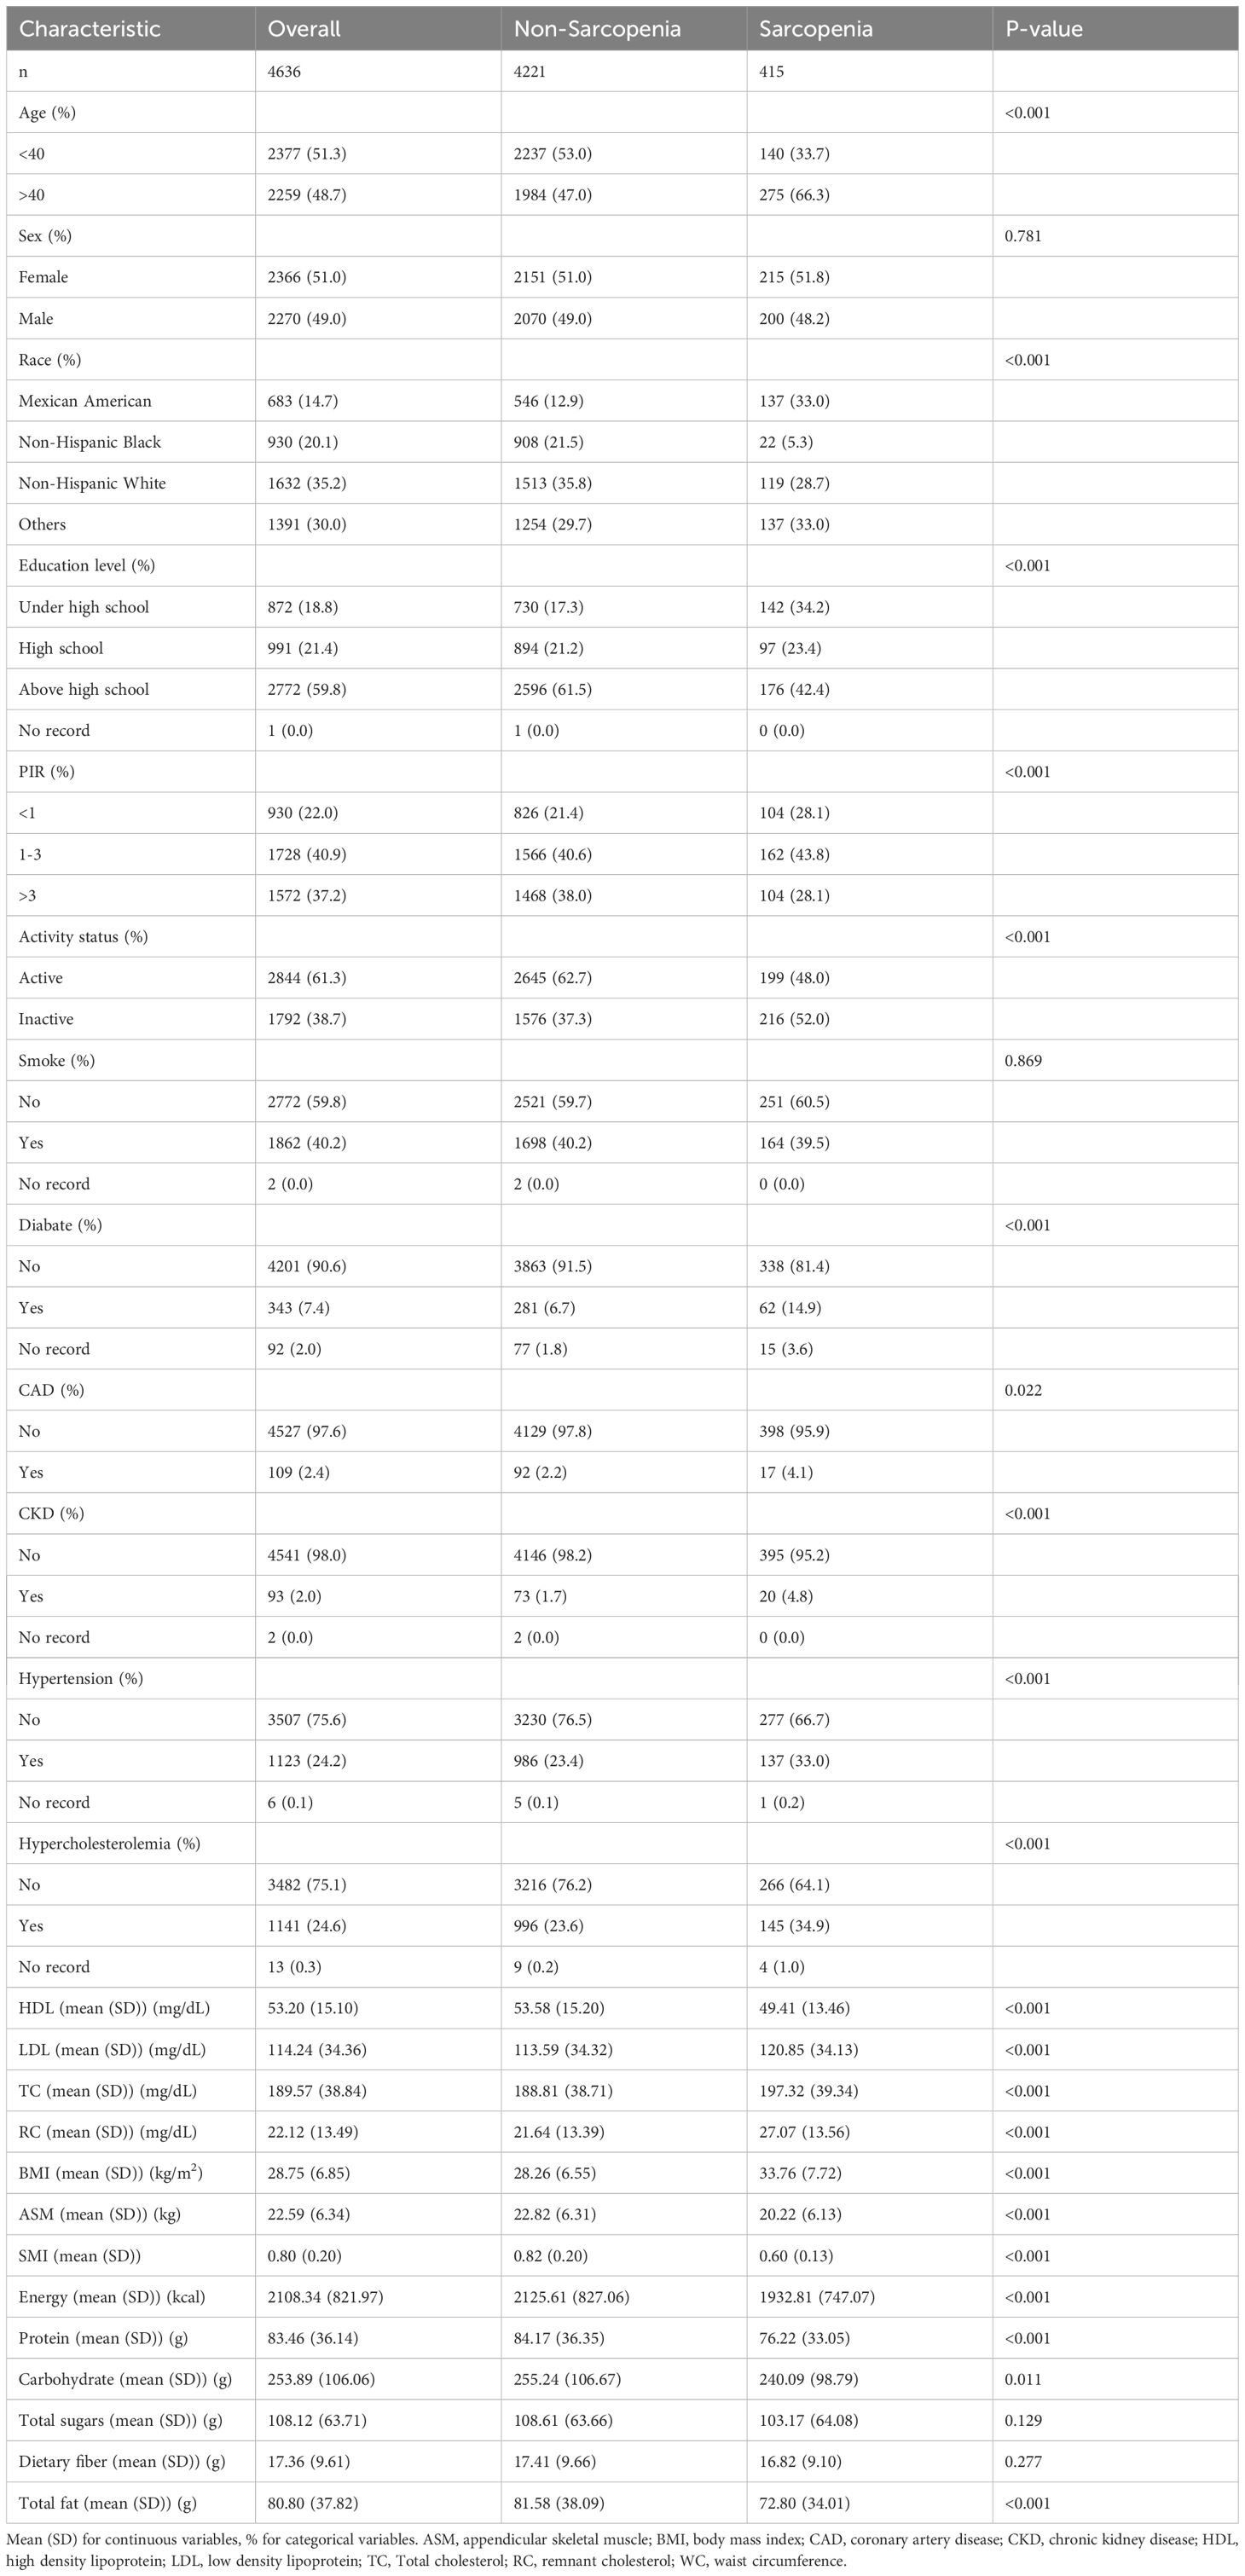
As shown in Figure 1, this study initially included all participants in the NHANES data from 2011 to 2018, totaling 39,156 participants. First, 17,095 participants in the ≤20-year-old and pregnant populations were excluded, and next, 11,524 participants with missing sarcopenia measurements and 5,901 participants with missing RC data were excluded, respectively. Ultimately, the study sample included 4636 participants who met the inclusion criteria for this analysis. Table 1 displays the initial characteristics of the individuals categorized by sarcopenia status. The study included 4221 non-sarcopenia and 415 sarcopenia participants. Participants with sarcopenia were generally older, had lower education levels and incomes and were more likely to be of Mexican descent. These participants had less physical activity, higher BMI and total cholesterol levels, and lower intakes of energy, protein, carbohydrates, and total fat. Additionally, individuals with sarcopenia were more likely to have diabetes, coronary heart disease, chronic kidney disease, hypertension, and hypercholesterolemia. Notably, these participants had higher RC levels, suggesting a potential link between RC and sarcopenia.
3.2 Association between RC and sarcopenia prevalence
Logarithmic transformation of RC was performed to correct the left-skewed data. The logistic regression analysis of the relationship between RC and sarcopenia incidence is illustrated in Table 2. According to Model 1, the incidence of sarcopenia was significantly positively correlated with the log RC (OR=2.32, 95% CI=1.92-2.80). After accounting for several factors, Model 3 demonstrated that for each unit increase in log RC, the occurrence of sarcopenia increased by 69% (OR=1.69, 95% CI=1.32-2.17). After converting RC into four categorical variables, the relationship between RC levels and sarcopenia was studied. Compared with the lowest quartile, an increase in the incidence of sarcopenia was significantly correlated with higher RC levels (P for trend<0.001). Even after adjusting for all covariates, this trend remained significant for the highest RC level (OR=2.60, 95% CI=1.61-4.20), indicating a robust positive association between RC and sarcopenia.
3.3 Nonlinear relationship and threshold effect analysis
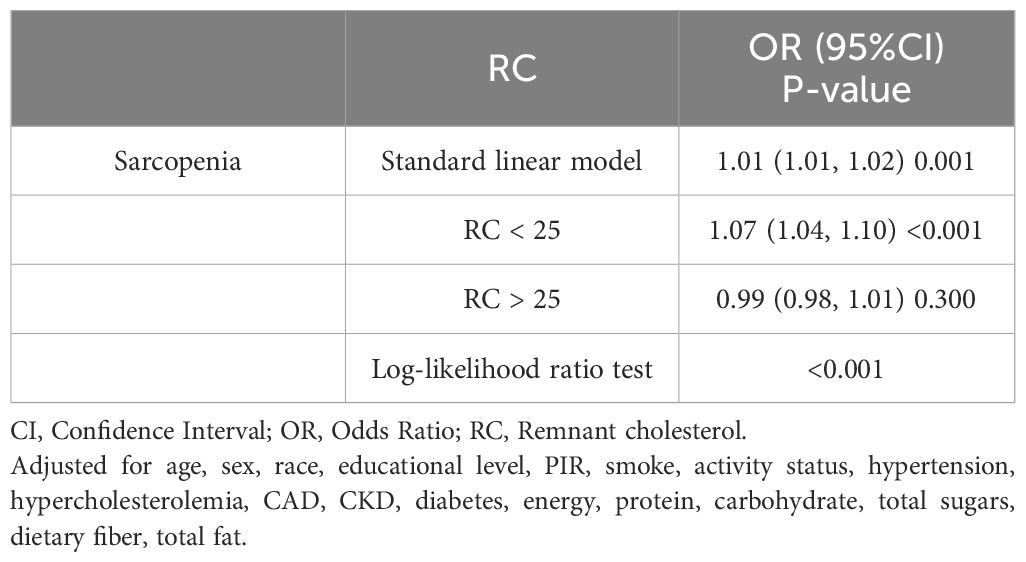
Analysis using RCS demonstrated a significant nonlinear relationship between RC and the occurrence of sarcopenia (P-nonlinear<0.0001), which took the form of an inverted U-shape (Figure 2). The findings demonstrated a positive association between the increase in RC and the progressive increase in the prevalence of sarcopenia, which may eventually plateau after surpassing a certain threshold. An examination of the threshold effect showed that there was a point of inflection at RC=25. Table 3 presents the segmented logistic regression analysis of the impact on sarcopenia incidence before and after the inflection point. The results indicated that on the left side of the inflection point (RC<25), each unit increase in RC significantly increased the probability of sarcopenia (OR=1.07, 95% CI=1.04-1.10). However, when RC>25, changes in RC had no statistically significant impact on the incidence of sarcopenia (P=0.7).
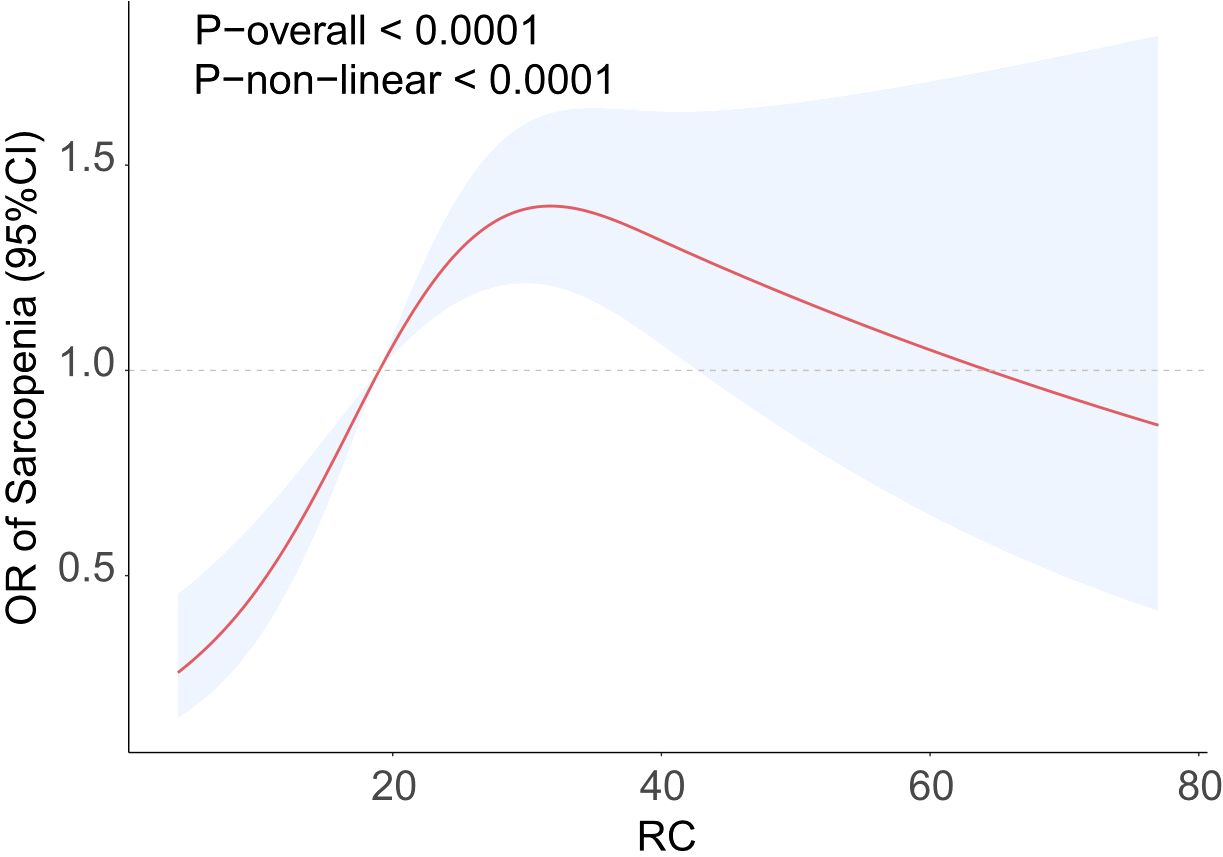
Figure 2. RCS curve fits the Association of RC with Sarcopenia. Adjusted for age, sex, race, educational level, PIR, smoke, activity status, hypertension, hypercholesterolemia, CAD, CKD, diabetes, energy, protein, carbohydrate, total sugars, dietary fiber, total fat.
3.4 Subgroup analysis
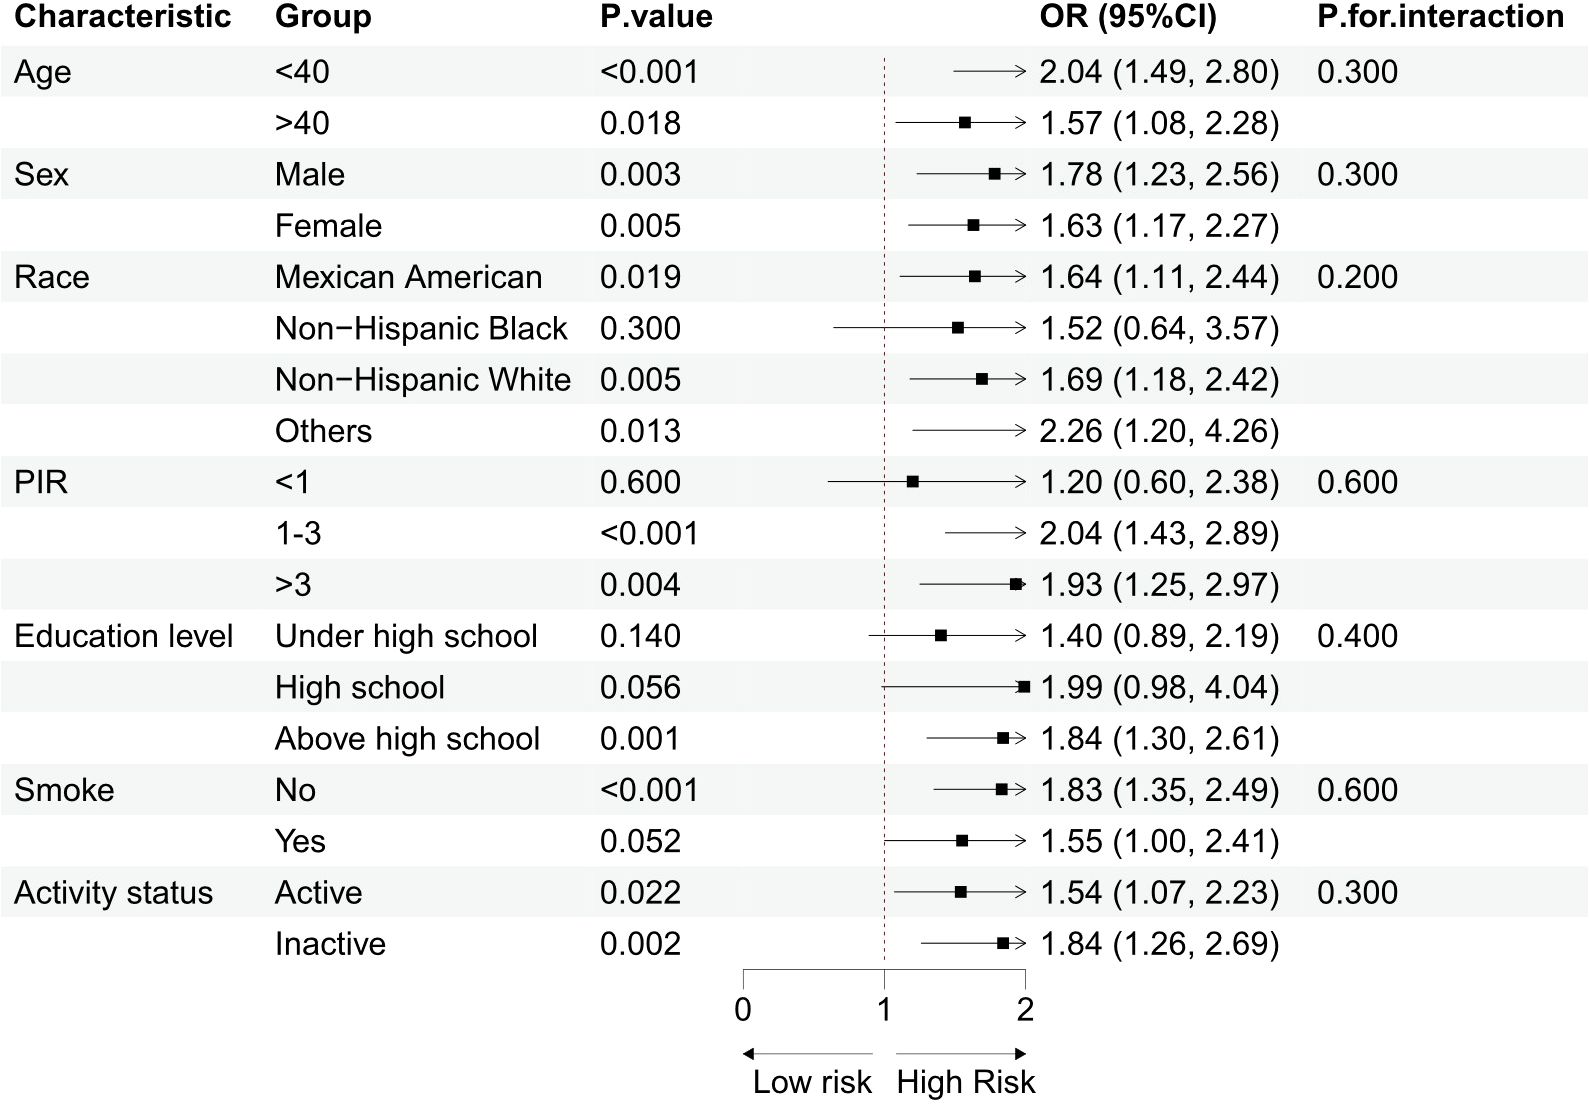
Subgroup analyses were performed based on demographic and lifestyle factors, and sample size information for each subgroup has been provided in Table 1, enabling a clearer assessment of the statistical efficacy of each subgroup. The results, as shown in Figure 3, demonstrated that the positive association between log RC and the occurrence of sarcopenia remained consistent across the different groups. The interaction test results indicated no significant interaction between demographic/lifestyle factors and log RC in relation to sarcopenia, supporting the potential of RC as an independent risk factor for sarcopenia.
3.5 Sensitivity and supplementary analyses
A sensitivity analysis was conducted by excluding extreme values beyond RC ± 3SD, resulting in a final sample of 4,544 participants, including 4,140 non-sarcopenic participants and 404 sarcopenic participants. After fully adjusting for covariates, the positive association between log RC and sarcopenia remained stable (OR=1.73, 95% CI=1.33-2.24). After converting RC into categorical variables, the results showed that the significant positive association between RC and sarcopenia incidence remained consistent (Supplementary Table 1). Additionally, supplementary analyses were conducted to verify the robustness of the study results. Supplementary Table 2 shows the linear regression analysis results between RC and the SMI, revealing a stable and significant negative association between them. Supplementary Figure 1 illustrates the nonlinear relationship between the RC and the SMI, indicating that the RC has a more significant impact on the SMI within a specific range. These supplementary analysis findings were consistent with the main study results, further supporting the conclusion of a positive association between RC and sarcopenia.
4 Discussion
This research used data from the 2011–2018 NHANES to establish a substantial and favorable association between RC and the prevalence of sarcopenia in adults in the United States. The findings revealed a nonlinear association between RC and sarcopenia, with a crucial threshold discovered at RC=25. The findings were further shown to be strong and consistent using sensitivity and additional analysis. These data indicate that monitoring RC levels might be beneficial for promptly detecting and evaluating sarcopenia.
Recently, the connection between lipid metabolism disorders and sarcopenia has garnered increasing attention. Previous research has consistently shown a link between lipid metabolism problems and sarcopenia (23–25). A study revealed that there is a positive association between the TG/HDL ratio and the prevalence of sarcopenia in older males (26). Similarly, a higher TG/HDL ratio is negatively correlated with muscle mass in patients with T2DM (27). This research demonstrated that RC is a distinct risk factor for sarcopenia. Subgroup analysis further confirmed the RC-sarcopenia association in different age and sex groups, with this association being significant across all strata, suggesting that RC is a universal indicator for assessing sarcopenia.
This study demonstrates a significant association between RC and sarcopenia, suggesting that lipid metabolism disorders may adversely impact muscle health through a series of intricate molecular pathways. Elevated RC levels have been implicated in the initiation of systemic inflammation and oxidative stress, key processes driving muscle protein degradation and impaired synthesis (28, 29). In particular, triglyceride-rich lipoproteins within RC activate monocytes and macrophages, inducing the release of pro-inflammatory cytokines (e.g., TNF-α and IL-6), which accelerate muscle protein breakdown (30, 31). Additionally, the pro-inflammatory environment induced by elevated RC augments oxidative stress, which increases free radical production, damaging muscle cell membranes and mitochondrial function, and disrupting intracellular calcium homeostasis, thereby exacerbating muscle protein degradation and apoptosis (32, 33). Elevated RC has also been closely linked to insulin resistance, a condition characterized by restricted protein synthesis, mobilization of fatty acids, and intensified lipid oxidation, collectively worsening oxidative damage in muscle cells (34, 35). This ultimately impairs energy supply to muscle cells, increasing risks of fibrosis and apoptosis. Collectively, these mechanisms highlight the non-linear association observed between RC and sarcopenia, where an RC threshold of 25 mg/dL may represent a “saturation point” for the deleterious effects of RC. Below this level, increases in RC substantially enhance inflammation and oxidative stress, whereas above this threshold, compensatory mechanisms may partially mitigate the additional negative effects of RC. Similar nonlinear effects have been reported in other metabolic diseases; specifically, the impact of RC on NAFLD disease progression stabilizes beyond a certain threshold, a finding consistent with our results (36). This study suggests that elevated RC levels may increase the prevalence of sarcopenia, highlighting the potential utility of RC level control in the prevention and treatment of sarcopenia. Existing evidence supports the efficacy of both pharmacological and lifestyle interventions in effectively reducing RC levels (37, 38). Future research should prioritize validating the long-term efficacy of these interventions, thereby strengthening the scientific basis for clinical application of RC monitoring and regulation in sarcopenia management.
This study has several strengths. First, the weighted analysis selected a nationally representative sample, accurately reflecting the U.S. population. Second, subgroup analysis was conducted to explore potential impacts in different populations. Third, sensitivity and supplementary analyses further increased the reliability of the study’s conclusions. Nevertheless, this research is subject to many constraints. The use of a cross-sectional design restricts the ability to establish cause-and-effect relationships between RC and sarcopenia. Second, although this study adjusted the model for various covariates, other potential confounding factors, such as the use of lipid-lowering medications, may still exist. Future studies should incorporate medication data to further assess these effects. In addition, this study used the definition criteria of the OARSI, which, unlike the criteria of the European Working Group on Sarcopenia in Older People (EWGSOP), does not include assessments of muscle strength and physical function. Future research could further validate the broader impact of RC on sarcopenia by incorporating parameters of muscle strength and physical function.
5 Conclusion
This study demonstrates a significant positive association between RC levels and the prevalence of sarcopenia in U.S. adults, offering novel evidence that RC may serve as a valuable indicator for sarcopenia assessment.
Data availability statement
Publicly available datasets were analyzed in this study. This data can be found here: https://www.cdc.gov/nchs/nhanes/nhanes_products.htm.
Ethics statement
The studies involving humans were approved by Research Ethics Assessment Committee of the National Center for Health Statistics. The studies were conducted in accordance with the local legislation and institutional requirements. The participants provided their written informed consent to participate in this study.
Author contributions
JL: Conceptualization, Data curation, Formal analysis, Methodology, Writing – original draft, Writing – review & editing. YL: Conceptualization, Data curation, Resources, Writing – review & editing.
Funding
The author(s) declare that no financial support was received for the research, authorship, and/or publication of this article.
Acknowledgments
We are grateful to the National Center for Health Statistics of the CDC for providing access to the National Health and Nutrition Examination Surve.
Conflict of interest
The authors declare that the research was conducted in the absence of any commercial or financial relationships that could be construed as a potential conflict of interest.
Publisher’s note
All claims expressed in this article are solely those of the authors and do not necessarily represent those of their affiliated organizations, or those of the publisher, the editors and the reviewers. Any product that may be evaluated in this article, or claim that may be made by its manufacturer, is not guaranteed or endorsed by the publisher.
Supplementary material
The Supplementary Material for this article can be found online at: https://www.frontiersin.org/articles/10.3389/fendo.2024.1461961/full#supplementary-material
References
1. Chen LK, Woo J, Assantachai P, Auyeung TW, Chou MY, Iijima K, et al. Kim S et al: Asian Working Group for Sarcopenia: 2019 Consensus Update on Sarcopenia Diagnosis and Treatment. J Am Med Directors Assoc. (2020) 21:300–307.e302. doi: 10.1016/j.jamda.2019.12.012
2. Sayer AA, Cruz-Jentoft A. Sarcopenia definition, diagnosis and treatment: consensus is growing. Age Ageing. (2022) 51:afac220. doi: 10.1093/ageing/afac220
3. Yuan S, Larsson SC. Epidemiology of sarcopenia: Prevalence, risk factors, and consequences. Metabolism: Clin Exp. (2023) 144:155533. doi: 10.1016/j.metabol.2023.155533
4. Benz E, Pinel A, Guillet C, Capel F, Pereira B, De Antonio M, et al. Topinkova E et al: Sarcopenia and Sarcopenic Obesity and Mortality Among Older People. JAMA network Open. (2024) 7:e243604. doi: 10.1001/jamanetworkopen.2024.3604
5. Jung HN, Jung CH, Hwang YC. Sarcopenia in youth. Metabolism: Clin Exp. (2023) 144:155557. doi: 10.1016/j.metabol.2023.155557
6. Guo B, Liu X, Si Q, Zhang D, Li M, Li X, et al. Liu Y et al: Associations of CBC-Derived inflammatory indicators with sarcopenia and mortality in adults: evidence from Nhanes 1999 ∼ 2006. BMC geriatrics. (2024) 24:432. doi: 10.1186/s12877-024-05012-2
7. Zhang Z, Chen X, Jiang N. The triglyceride glucose related index is an indicator of Sarcopenia. Sci Rep. (2024) 14:24126. doi: 10.1038/s41598-024-75873-5
8. Pan X, Liu S, Chen B, Yu Z, Hao W, Tang X, et al. Correlation analysis of exercise volume and musculoskeletal disorders in people with income level differences: research based on the 2011-2018 NHANES dataset. BMC Public Health. (2024) 24:2811. doi: 10.1186/s12889-024-20179-4
9. Stürzebecher PE, Katzmann JL, Laufs U. What is 'remnant cholesterol'? Eur Heart J. (2023) 44:1446–8. doi: 10.1016/j.heliyon.2023.e16323
10. Wang Y, Shen R. Association of remnant cholesterol with depression among US adults. BMC Psychiatry. (2023) 23:259. doi: 10.1186/s12888-023-04770-4
11. Yao L, Yang P. Relationship between remnant cholesterol and risk of kidney stones in U.S. Adults: a 2007-2016 NHANES analysis. Ann Med. (2024) 56:2319749. doi: 10.1080/07853890.2024.2319749
12. Heo JH, Jo SH. Triglyceride-rich lipoproteins and remnant cholesterol in cardiovascular disease. J Korean Med Sci. (2023) 38:e295. doi: 10.3346/jkms.2023.38.e295
13. Xiao P, Wang Z, Lu Z, Liu S, Huang C, Xu Y, et al. The association between remnant cholesterol and bone mineral density in US adults: the National Health and Nutrition Examination Survey (NHANES) 2013-2018. Lipids Health Dis. (2024) 23:148. doi: 10.1186/s12944-024-02145-6
14. Wu Y, Wei Q, Li H, Yang H, Wu Y, Yu Y, et al. Association of remnant cholesterol with hypertension, type 2 diabetes, and their coexistence: the mediating role of inflammation-related indicators. Lipids Health Dis. (2023) 22:158. doi: 10.1186/s12944-023-01915-y
15. Elías-López D, Doi T, Nordestgaard BG, Kobylecki CJ. Remnant cholesterol and low-grade inflammation jointly in atherosclerotic cardiovascular disease: implications for clinical trials. Curr Opin Clin Nutr Metab Care. (2024) 27:125–35. doi: 10.1097/MCO.0000000000000999
16. Bale BF, Doneen AL, Leimgruber PP, Vigerust DJ. The critical issue linking lipids and inflammation: Clinical utility of stopping oxidative stress. Front Cardiovasc Med. (2022) 9:1042729. doi: 10.3389/fcvm.2022.1042729
17. Zhang H, Qi G, Wang K, Yang J, Shen Y, Yang X, et al. Qi L et al: Oxidative stress: Roles in skeletal muscle atrophy. Biochem Pharmacol. (2023) 214:115664. doi: 10.1016/j.bcp.2023.115664
18. Santos LP, Gonzalez MC, Orlandi SP, Bielemann RM, Barbosa-Silva TG, Heymsfield SB. New prediction equations to estimate appendicular skeletal muscle mass using calf circumference: results from NHANES 1999-2006. JPEN J parenteral enteral Nutr. (2019) 43:998–1007. doi: 10.1002/jpen.v43.8
19. Buccheri E, Dell'Aquila D, Russo M, Chiaramonte R, Musumeci G, Vecchio M. Can artificial intelligence simplify the screening of muscle mass loss? Heliyon. (2023) 9:e16323. doi: 10.1016/j.heliyon.2023.e16323
20. Buccheri E, Dell'Aquila D, Russo M, Chiaramonte R, Vecchio M. Appendicular skeletal muscle mass in older adults can be estimated with a simple equation using a few zero-cost variables. J geriatric Phys Ther (2001). (2024) 47:E149–e158. doi: 10.1519/JPT.0000000000000420
21. Batsis JA, Mackenzie TA, Jones JD, Lopez-Jimenez F, Bartels SJJCN. Sarcopenia, sarcopenic obesity and inflammation: Results from the 1999–2004 National Health and Nutrition Examination Survey. Clin Nutr. (2016) 35(6):1472–83. doi: 10.1016/j.clnu.2016.03.028
22. Huang Q, Wan J, Nan W, Li S, He B, Peng Z. Association between manganese exposure in heavy metals mixtures and the prevalence of sarcopenia in US adults from NHANES 2011-2018. J hazardous materials. (2024) 464:133005. doi: 10.1016/j.jhazmat.2023.133005
23. Bi B, Dong X, Yan M, Zhao Z, Liu R, Li S, et al. Dyslipidemia is associated with sarcopenia of the elderly: a meta-analysis. BMC geriatrics. (2024) 24:181. doi: 10.1186/s12877-024-04761-4
24. Matsumoto Y, Sugioka Y, Tada M, Okano T, Mamoto K, Inui K, et al. Change in skeletal muscle mass is associated with lipid profiles in female rheumatoid arthritis patients -TOMORROW study. Clin Nutr (Edinburgh Scotland). (2021) 40:4500–6. doi: 10.1016/j.clnu.2020.12.028
25. Mo C, Du Y, O'Connell TM. Applications of lipidomics to age-related musculoskeletal disorders. Curr osteoporosis Rep. (2021) 19:151–7. doi: 10.1007/s11914-021-00656-0
26. Huang Y, Liao J, Liu Y. Triglyceride to high-density lipoprotein cholesterol ratio was negatively associated with relative grip strength in older adults: a cross-sectional study of the NHANES database. Front Public Health. (2023) 11:1222636. doi: 10.3389/fpubh.2023.1222636
27. Fu Q, Zhang Z, Hu W, Yang Y. The correlation of triglyceride/high-density lipoprotein cholesterol ratio with muscle mass in type 2 diabetes patients. BMC endocrine Disord. (2023) 23:93. doi: 10.1186/s12902-023-01349-8
28. Cafaro G, Perricone C, Gerli R, Bartoloni E. Comment on: “Gluten or no gluten for rheumatic diseases?” Joint Bone Spine. (2023) 90(1):105471. doi: 10.1016/j.jbspin.2022.105471
29. Kraaijenhof J, Kerkvliet M, Nurmohamed N, Grefhorst A, Kroon J, Reeskamp L, et al. Remnant cholesterol and systemic inflammation: Unraveling their association with cardiovascular disease. Atherosclerosis. (2024) 396:118532. doi: 10.1016/j.atherosclerosis.2024.118321
30. Vassiliou E, Farias-Pereira R. Impact of lipid metabolism on macrophage polarization: implications for inflammation and tumor immunity. Int J Mol Sci. (2023) 24. doi: 10.3390/ijms241512032
31. Vogel A, Brunner JS, Hajto A, Sharif O, Schabbauer G. Lipid scavenging macrophages and inflammation. Biochim Biophys Acta Mol Cell Biol Lipids. (2022) 1867:159066. doi: 10.1016/j.bbalip.2021.159066
32. Chen Y, Guo X, Zeng Y, Mo X, Hong S, He H, et al. Oxidative stress induces mitochondrial iron overload and ferroptotic cell death. Sci Rep. (2023) 13:15515. doi: 10.1038/s41598-023-42760-4
33. Miranda ER, Shahtout JL, Funai K. Chicken or egg? Mitochondrial phospholipids and oxidative stress in disuse-induced skeletal muscle atrophy. Antioxidants Redox Signaling. (2023) 38:338–51. doi: 10.1089/ars.2022.0151
34. Hu X, Liu Q, Guo X, Wang W, Yu B, Liang B, et al. The role of remnant cholesterol beyond low-density lipoprotein cholesterol in diabetes mellitus. Cardiovasc Diabetol. (2022) 21:117. doi: 10.1186/s12933-022-01554-0
35. Vargas-Vázquez A, Fermín-Martínez CA, Antonio-Villa NE, Fernández-Chirino L, Ramírez-García D, Dávila-López G, et al. Insulin resistance potentiates the effect of remnant cholesterol on cardiovascular mortality in individuals without diabetes. Atherosclerosis. (2024) 395:117508. doi: 10.1016/j.atherosclerosis.2024.117508
36. Chen J, Su Y, Su X, Luo F. Remnant cholesterol has a non-linear association with non-alcoholic fatty liver disease. Diabetes Res Clin Pract. (2023) 201:110733. doi: 10.1016/j.diabres.2023.110733
37. Gomez-Delgado F, Raya-Cruz M, Katsiki N, Delgado-Lista J, Perez-Martinez P. Residual cardiovascular risk: When should we treat it? Eur J Internal Med. (2024) 120:17–24. doi: 10.1016/j.ejim.2023.10.013
Keywords: remnant cholesterol, lipid, cholesterol, sarcopenia, NHANES
Citation: Li J and Lin Y (2024) Association between residual cholesterol and sarcopenia in American adults. Front. Endocrinol. 15:1461961. doi: 10.3389/fendo.2024.1461961
Received: 09 July 2024; Accepted: 11 November 2024;
Published: 28 November 2024.
Edited by:
Claudia Loreti, Agostino Gemelli University Polyclinic (IRCCS), ItalyReviewed by:
Botang Guo, Harbin Medical University, ChinaEnrico Buccheri, Università di Catania, Italy
Mansour Alotaibi, Northern Border University, Saudi Arabia
Copyright © 2024 Li and Lin. This is an open-access article distributed under the terms of the Creative Commons Attribution License (CC BY). The use, distribution or reproduction in other forums is permitted, provided the original author(s) and the copyright owner(s) are credited and that the original publication in this journal is cited, in accordance with accepted academic practice. No use, distribution or reproduction is permitted which does not comply with these terms.
*Correspondence: Jianzhao Li, MTM0MTM2OTAwMTdAMTYzLmNvbQ==
 Jianzhao Li
 Yuning Lin