- 1School of Physical Education and Sports, Central China Normal University, Wuhan, China
- 2Department of Physical Education, Central South University, Changsha, China
Background: Metabolic syndrome (MetS) has a close association with cardiovascular diseases. Few studies have investigated the association of Life’s Essential 8 (LE8), the updated measurement of cardiovascular health (CVH), with MetS.
Methods: The National Health and Nutrition Examination Survey (2005–2018) data was extracted. The LE8 comprised 4 health behaviors (diet, physical activity, nicotine exposure, and sleep health) and 4 health factors [body mass index (BMI), blood lipids, blood glucose, and blood pressure (BP)]. The total LE8 score is the average of 8 metric scores (0-100), categorized into low (0–49), moderate (50–79), and high CVH (80–100) levels. Multivariable logistic regression models, restricted cubic spline models and stratified analyses were performed to examine the relationship between LE8 and MetS.
Results: In this study, a total of 21,543 participants represented 146.6 million non-institutionalized U.S. adults. Following adjustment for various potential covariates, participants who attained a moderate [adjusted odds ratio (AOR) = 0.234, 95% CI: 0.209, 0.262] or a high CVH level (AOR = 0.026, 95% CI: 0.021, 0.032) exhibited an inverse correlation with MetS risks when comparing those with a low CVH level. An inverse linear dose-response relationship between LE8 scores and MetS risks was also identified (P for nonlinearity > 0.05).
Conclusions: LE8 was inversely associated with the risk of MetS. Adhering to LE8 guidelines to sustain a higher CVH level may be beneficial for preventing MetS.
1 Introduction
Metabolic syndrome (MetS) represents a group of multiple cardiometabolic factors that include central obesity, hypertension, hyperglycemia, and dyslipidemia (1). The incidence of MetS has risen to epidemic levels, with an estimated 1.5 billion people worldwide yearly (2). About one-third of the U.S. population is affected by MetS (3). The MetS exhibits a close association with an increased risk for cardiovascular disease (CVD), nonalcoholic fatty liver disease, and diabetes mellitus (DM) (1, 4). Additionally, other comorbid conditions of MetS have been increasingly recognized, such as cancer and cognitive degenerative disease (5, 6). Individuals with MetS had a twofold increased risk of developing CVD (7), representing the main mortality cause worldwide (8). Therefore, it is necessary to prevent MetS to minimize the adverse impacts on individual health and medical burden.
In 2022, the American Heart Association (AHA) proposed the Life’s Essential 8 (LE8) as a measurement to assess cardiovascular health (CVH) (9). The LE8 comprised 4 health behaviors [diet, physical activity (PA), sleep and smoking] and 4 health factors [body mass index (BMI), blood lipids, blood pressure (BP), and blood glucose] (9, 10). Since the introduction of LE8, it has spurred research interest. Several studies have found that LE8 was significantly associated with reduced all-cause mortality, cardiovascular mortality as well as a lower risk of multiple chronic diseases (11, 12). Furthermore, Yang and his colleagues discussed the correlation between LE8 scores and metabolic unhealth (MUH) and demonstrated that MUH can be considered as an alternative indicator for LE8 (13). However, little is known concerning the relationship between LE8 and MetS. Given the tight links between the components of LE8 and MetS, improving LE8-evaluated CVH levels may be an appropriate prevention strategy for reducing the burden of MetS.
Despite previous studies exploring the association between CVH and MetS, several limitations are below. First, prior studies included a limited sample size and focused on specific populations. For example, one study only included 517 Atahualpa residents aged ≥ 40 years (14), which confined generalizing the findings to the general population. Second, alcohol consumption and energy intake impact on MetS have been demonstrated (15, 16). However, to our knowledge, only a few researchers have considered these factors, which restricts the capacity to compare and apply their findings to other situations. Third, a majority of prior studies used Life’s Simple 7 (LS7) to assess CVH. Nevertheless, compared with LE8, the LS7-evaluated CVH levels were less sensitive to interindividual differences as well as intraindividual change (9). To compensate for these limitations, based on the National Health and Nutrition Examination Surveys (NHANES) data, we aimed to explore the relationship of the CVH using LE8 scores and MetS in a nationally representative U.S. adult population.
2 Methods
2.1 Study population
The NHANES is a continuous cross-sectional program conducted by the National Centers for Disease Control and Prevention. Its purpose is to examine the nutritional status, healthy behaviors, and PA outcomes of the non-institutionalized U.S. civilian population (17). The U.S. National Center for Health Statistics' Ethics Review Board granted approval for all NHANES protocols, with all participants signing informed consent to participate in the survey (18).
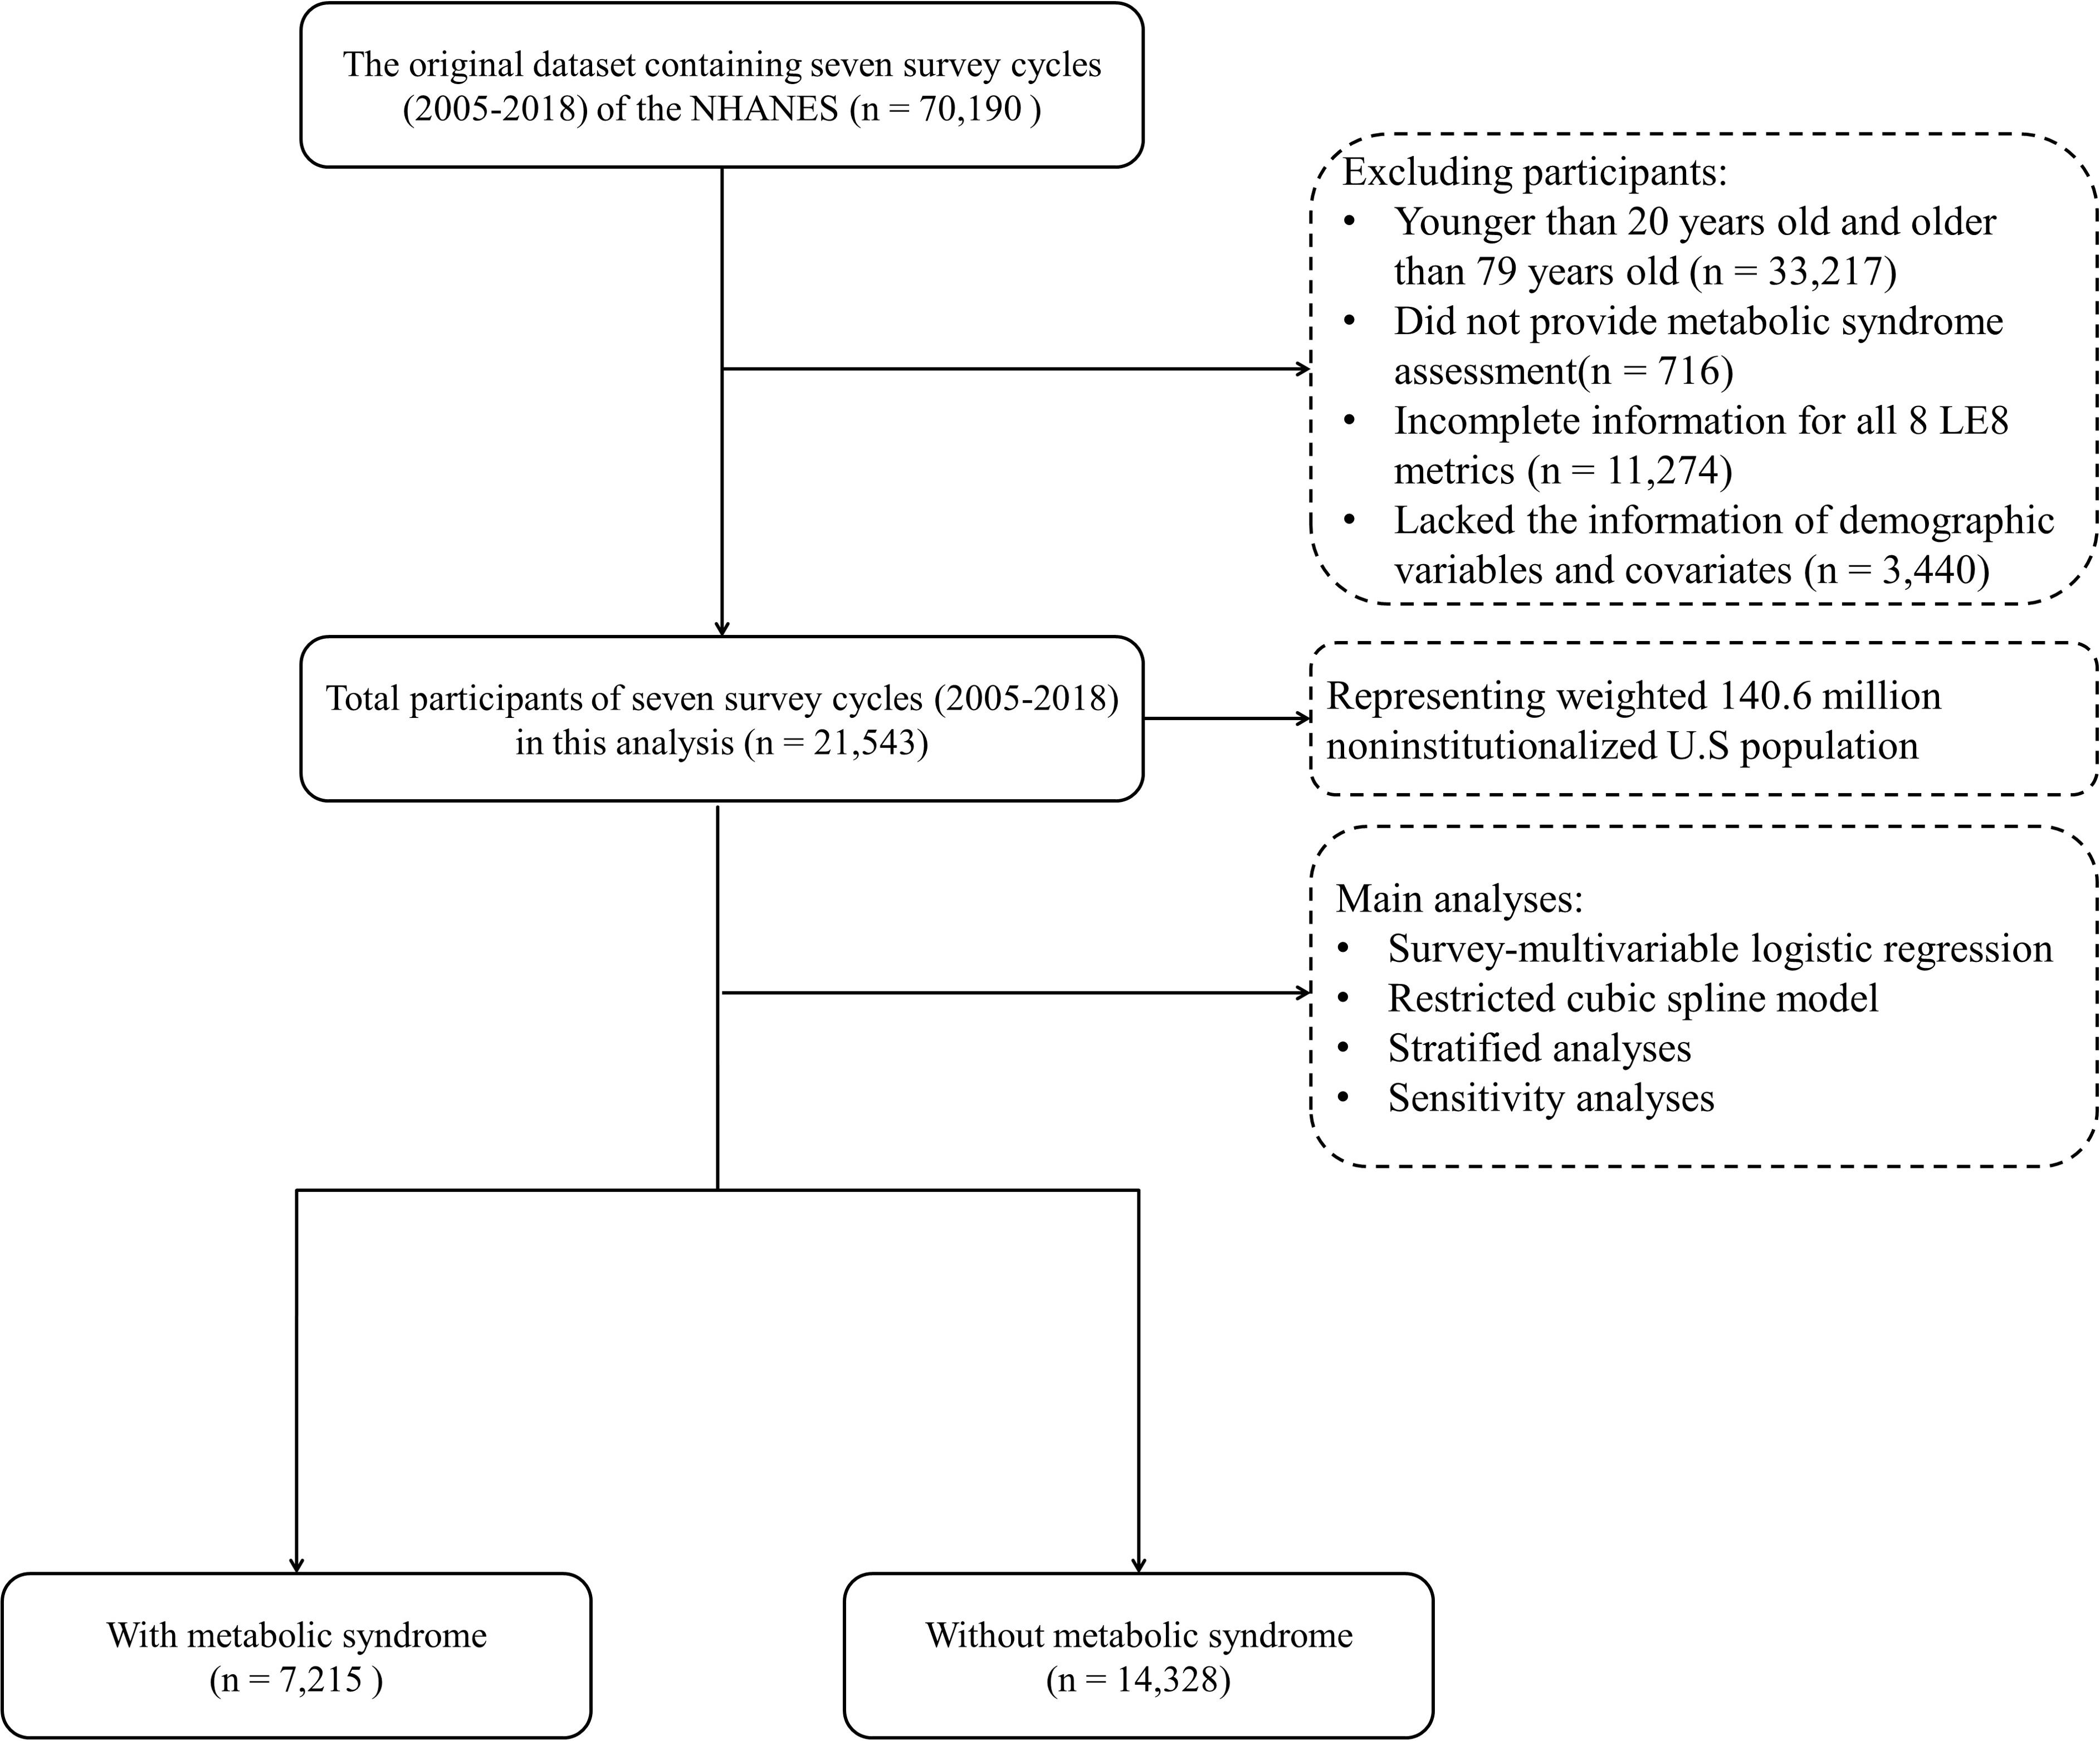
Herein, we deployed data from several NHANES cycles (2005–2018). First, we excluded participants younger than 20 years and older than 79 years (N = 33,217). Then, this analysis excluded the necessary unavailable covariates (N = 3,440). Participants who did not undergo MetS evaluation (N = 716) and those with inadequate information for all 8 LE8 metrics (N = 11,274) were also eliminated. The final analysis included 21,543 participants. Figure 1 depicts the participant selection process.
2.2 Assessment of LE8
The LE8 scoring algorithm has 8 metrics, including 4 healthy behaviors (diet, PA, nicotine exposure, and sleep health) as well as 4 health factors (BMI, blood lipids and glucose, and BP). Each metric scores were 0–100 points, calculating the total LE8 score as the unweighted average of all 8 metric scores. As the AHA recommended, the LE8 score was assigned to three levels: low (0–49), moderate (50–79), and high CVH (80–100) (9).
The Healthy Eating Index (HEI)-2015 was deployed to evaluate diet metrics (19). The PA, smoking, and sleeping duration data were gathered by self-report questionnaires. In addition, the physical examination included measuring BP, height, and weight. The BMI was computed by dividing the weight (kg) by the height (m2). Blood samples were obtained and dispatched to laboratories for analyzing blood lipids, plasma glucose, and hemoglobin A1c levels. Additional comprehensive techniques for computing each metric LE8 score through NHANES data have been officially released (Supplementary Table S1) (9, 20).
2.3 Assessment of MetS
This study employed the National Cholesterol Education Program’s Adult Treatment Panel III report to define MetS (21). Individuals with MetS had three or more of these five criteria: 1) waist circumference ≥ 88 cm in women and ≥ 102 cm in men; 2) triglyceride ≥ 150 mg/dL or using drug treatment for elevated triglyceride; 3) high-density lipoprotein (HDL)-cholesterol level < 50 mg/dL for women and < 40 mg/dL for men or receiving drug for reduced HDL-cholesterol; 4) systolic blood pressure (SBP) ≥ 130 mmHg or diastolic blood pressure (DBP) ≥ 85 mmHg, or using drug for low HDL cholesterol; 5) fasting glucose ≥ 100 mg/dL or using antihypertensive medication.
2.4 Assessment of covariates
According to previous studies (22), several potential confounding variables were selected: age (20–39, 40–59, and 60–79); gender (male or female); race/ethnicity [non-Hispanic White, non-Hispanic Black, Mexican American, and other races (multi-racial and other Hispanic)]; education level (< 9th grade, 9th–11th grade (including 12th grade with no diploma), high school graduate (general educational development or equivalent), college graduate or above, and some college or associate’s degree); poverty income ratio (PIR; calculated as the ratio of monthly family income to poverty levels defined by Department of Health and Human Services guidelines: < 1.3, 1.3–3.5, and > 3.5); marital status (never married, widowed/divorced/separated, and married/living with partner). In addition, lifestyle and health variables were collected: alcohol consumption (never, former, and current) and energy intake (the total energy intake was expressed in quartiles), hypertension (an average SBP ≥ 140 mmHg and DBP ≥ 90 mmHg in 3 consecutive tests), CVD (a self-reported history of coronary heart disease, myocardial infarction, stroke, or angina by a trained health professional prior to the survey), depression, and DM (fasting plasma glucose ≥ 126 mg/dL, 2-h plasma glucose ≥ 200 mg/dL, hemoglobin A1c ≥ 6.5%, or self-reported DM by a professional doctor).
2.5 Statistical analyses
Due to the NHANES methodology, all the conducted statistical analyses were subject to weighting. One-way ANOVA analysis was deployed for comparing continuous variables by assessing their mean values together with their standard errors (SE). The chi-square test was utilized to examine counts and percentages of categorical data. The Pearson correlation coefficients were deployed for evaluating the pairwise correlation between 8 LE8 metrics. A survey-multivariable logistic regression model was employed to estimate the adjusted odds ratio (AOR) and 95% confidence interval (CI) for LE8 score associations with MetS (low CVH levels as the reference). Specifically, we used three different models: non-adjusted crude model, adjusted model 1 for age, gender, and race/ethnicity, and additionally adjusted model 2 for education level, marital status, PIR, and alcohol consumption. When the association of each LE8 metric score with MetS was evaluated, the remaining 7 LE8 components were further adjusted in model 2. In addition, our study deployed a restricted cubic spline model for examining the exposure-response relationship between LE8 scores and MetS. Furthermore, stratified analyses were conducted according to different demographic characteristics. To identify our findings’ robustness, we performed sensitivity analyses: 1) identifying LE8 score association with MetS in male and female populations; 2) adding covariates of survey cycle, DM, hypertension, CVD, depression, and total energy intake, respectively, to minimize their influences on the outcome; 3) setting high CVH (80–100) as the reference. Here, we conducted the statistical analyses in R language (X64 Version 4.3.1, R Foundation for Statistical Computing), with two-sided P < 0.05 representing statistical significance.
3 Results
3.1 Population characteristics
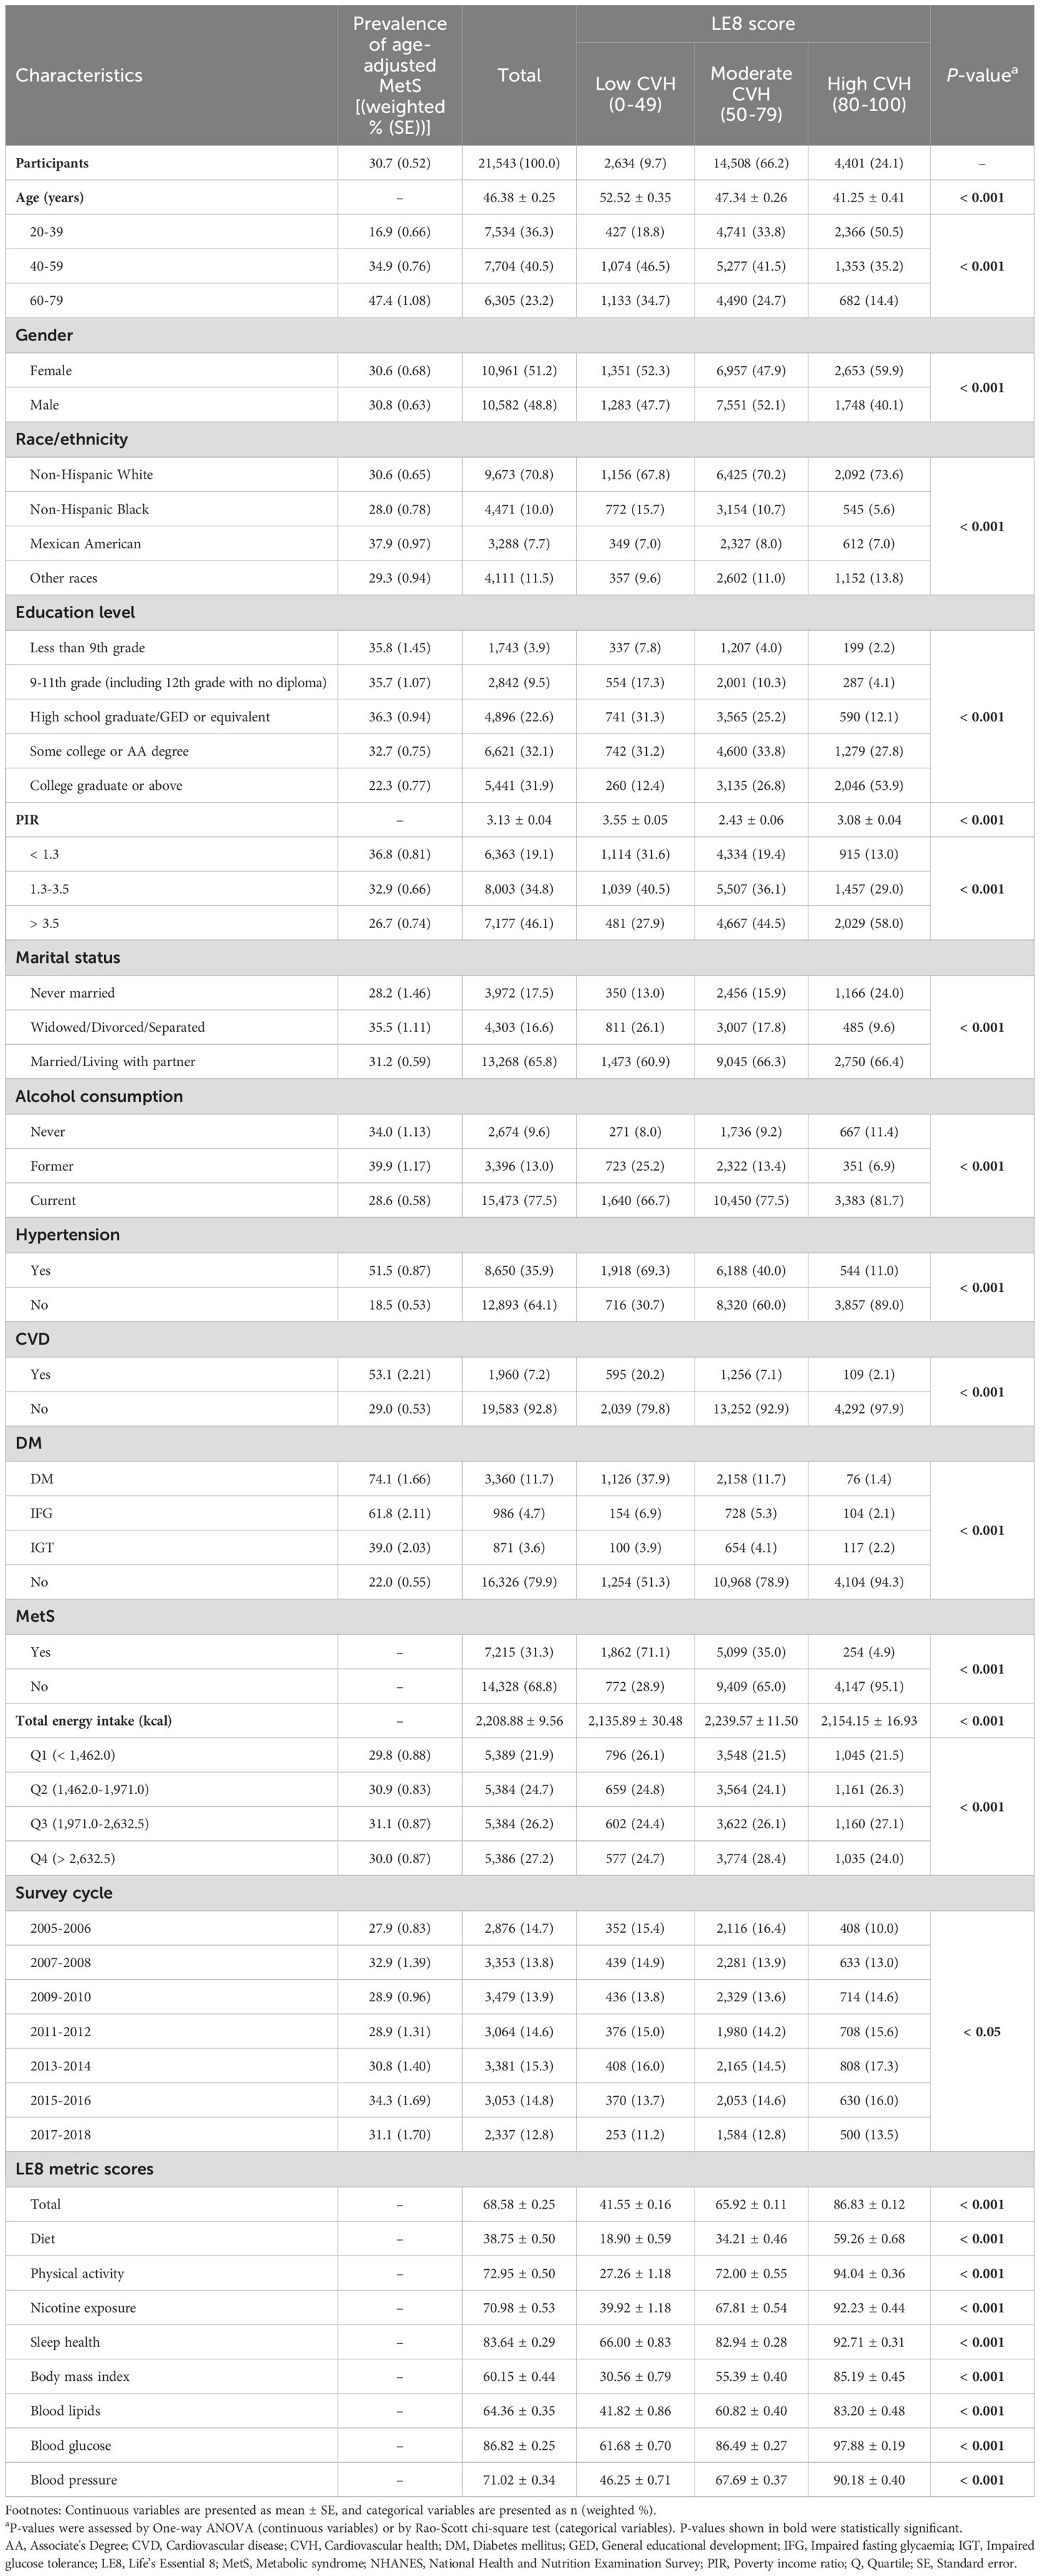
Table 1 summarizes included participants’ characteristics by different CVH levels, as measured by LE8. The results showed that in seven survey cycles (2005–2018), a total of 21,543 sample represented 146.6 million non-institutionalized U.S. population at the age of 20–79 (Figure 1), with a weighted mean age of 46.38 (0.25) years and 10,961 (51.2%) being females. The total age-adjusted prevalence of MetS was 30.7% (0.52), with a higher prevalence among participants aged 60–79 years [47.4% (1.02)]. Furthermore, widowed/divorced/separated participants and those with a low PIR level (< 1.3) had a greater prevalence of MetS. The LE8 score of the participants was 68.58 (0.25) on average, and among them, 2,634 (9.7%), 14,508 (66.2%), and 4,401 (24.1%) had low, moderate, and high LE8-measured CVH, respectively. Participants with a higher LE8 score more likely to be younger, female, having a higher education level and income (PIR > 3.5), and married (all the P < 0.001), compared with those with a low CVH level. The results of pairwise correlation analysis showed a mild to moderate correlation among 8 LE8 metrics (Supplementary Table S2). There was no statistically significant correlation between nicotine exposure and blood glucose and BP. Supplementary Tables S3–S5 present participants’ characteristics by gender, race/ethnicity, and MetS, respectively.
3.2 Association between LE8 and MetS
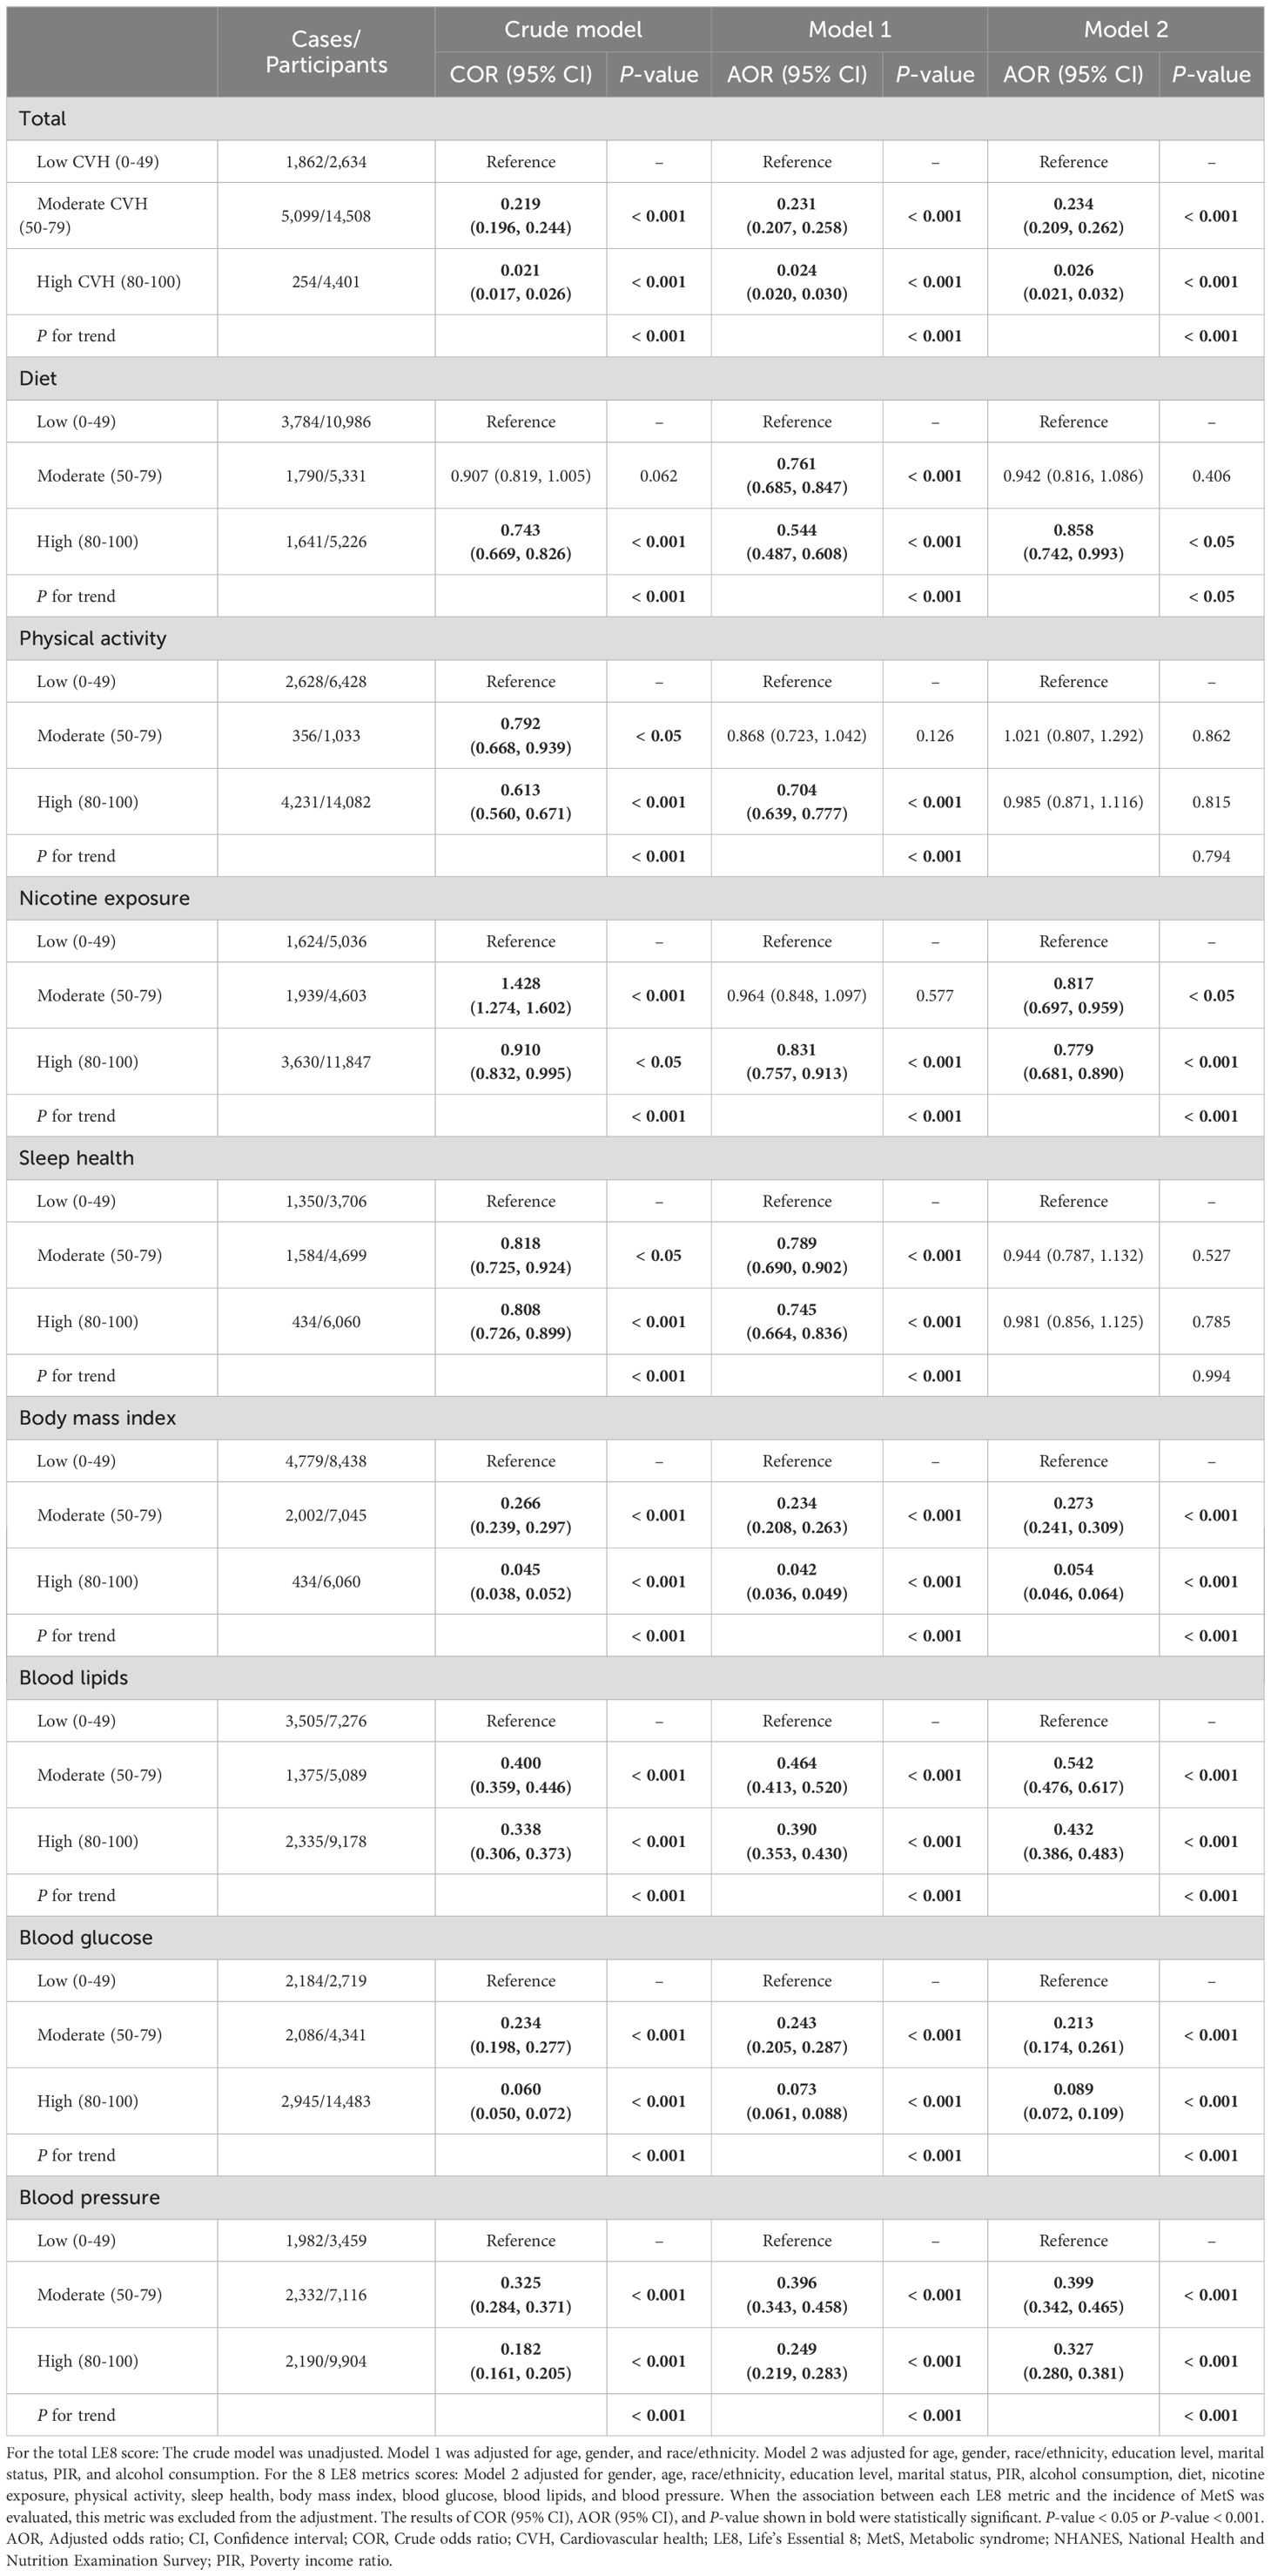
Table 2 shows that participants who achieved a moderate (AOR = 0.234, 95% CI: 0.209, 0.262) or high LE8-evaluated CVH level (AOR = 0.026, 95% CI: 0.021, 0.032) had a lower risk of MetS after adjustment for potential covariates in comparison with those with a low CVH level. Furthermore, the total LE8 score and the odds ratio of MetS exhibited an inverse linear dose-response relationship (Figure 2; P for nonlinearity > 0.05). Similar trends (P for trend < 0.05) toward reduced risk of MetS were observed for participants with higher LE8 metric scores of diet (AOR = 0.858, 95% CI: 0.742, 0.993), nicotine exposure (AOR = 0.779, 95% CI: 0.681, 0.890), BMI (AOR = 0.054, 95% CI: 0.046, 0.064), blood lipids (AOR = 0.432, 95% CI: 0.386, 0.483), blood glucose (AOR = 0.089, 95% CI: 0.072, 0.109), and BP (AOR = 0.327, 95% CI: 0.280, 0.381). The LE8 metric scores of PA (AOR = 0.985, 95% CI: 0.871, 1.116) and sleep health (AOR = 0.981, 95% CI: 0.856, 1.125) did not have a significant inverse association with MetS.
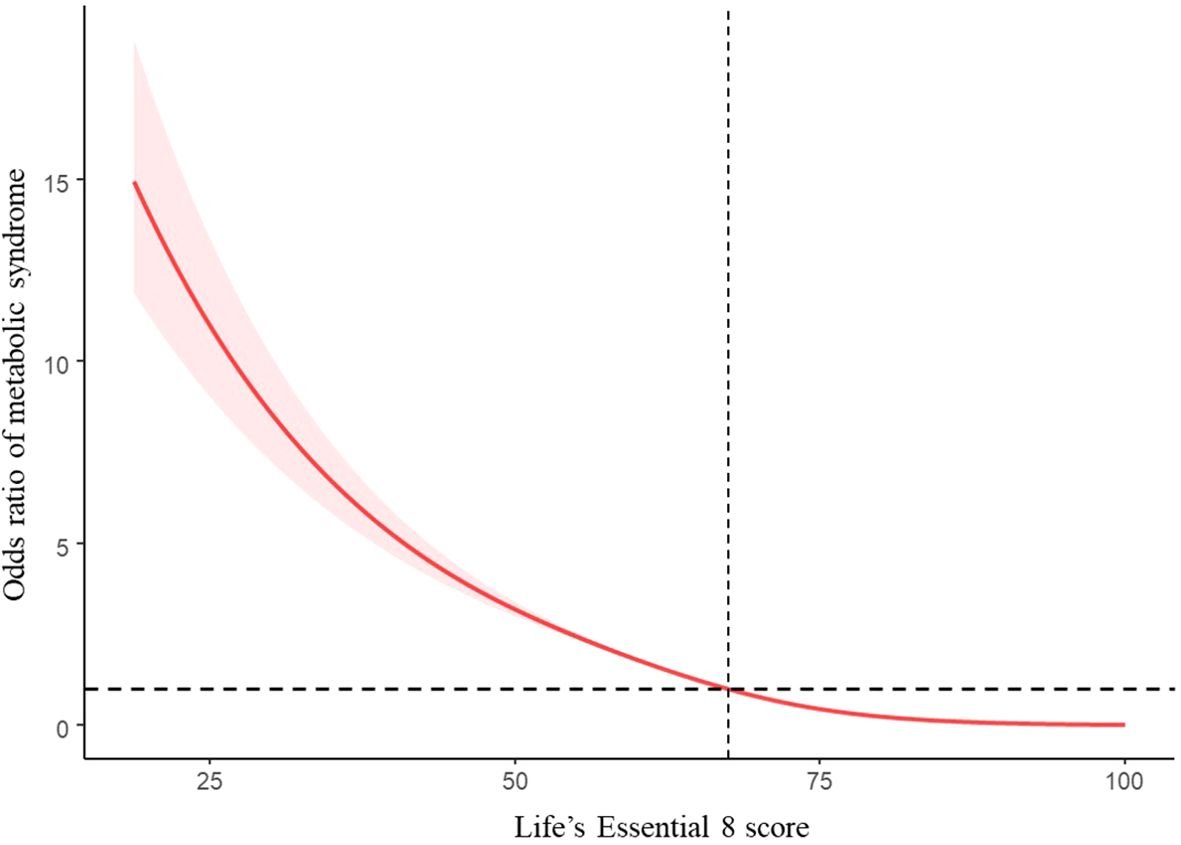
Figure 2. Restricted cubic spline and 95% CI between LE8 score and odd ratio of MetS, NHANES 2005–2018 (n = 21,354). The model adjusted for age, gender, race/ethnicity, education level, marital status, PIR, and alcohol consumption.
3.3 Stratified and sensitivity analysis
Table 3 represents the stratified analysis results. In our stratified analysis by gender, age, race/ethnicity, education level, PIR, marital status, and alcohol consumption, participants who achieved a moderate or high LE8-evaluated CVH levels in all subgroups showed the decreased risk of MetS relative to those with a low CVH level. Moreover, we observed a significant interaction between gender, marital status, and LE8 (P for interaction < 0.05).
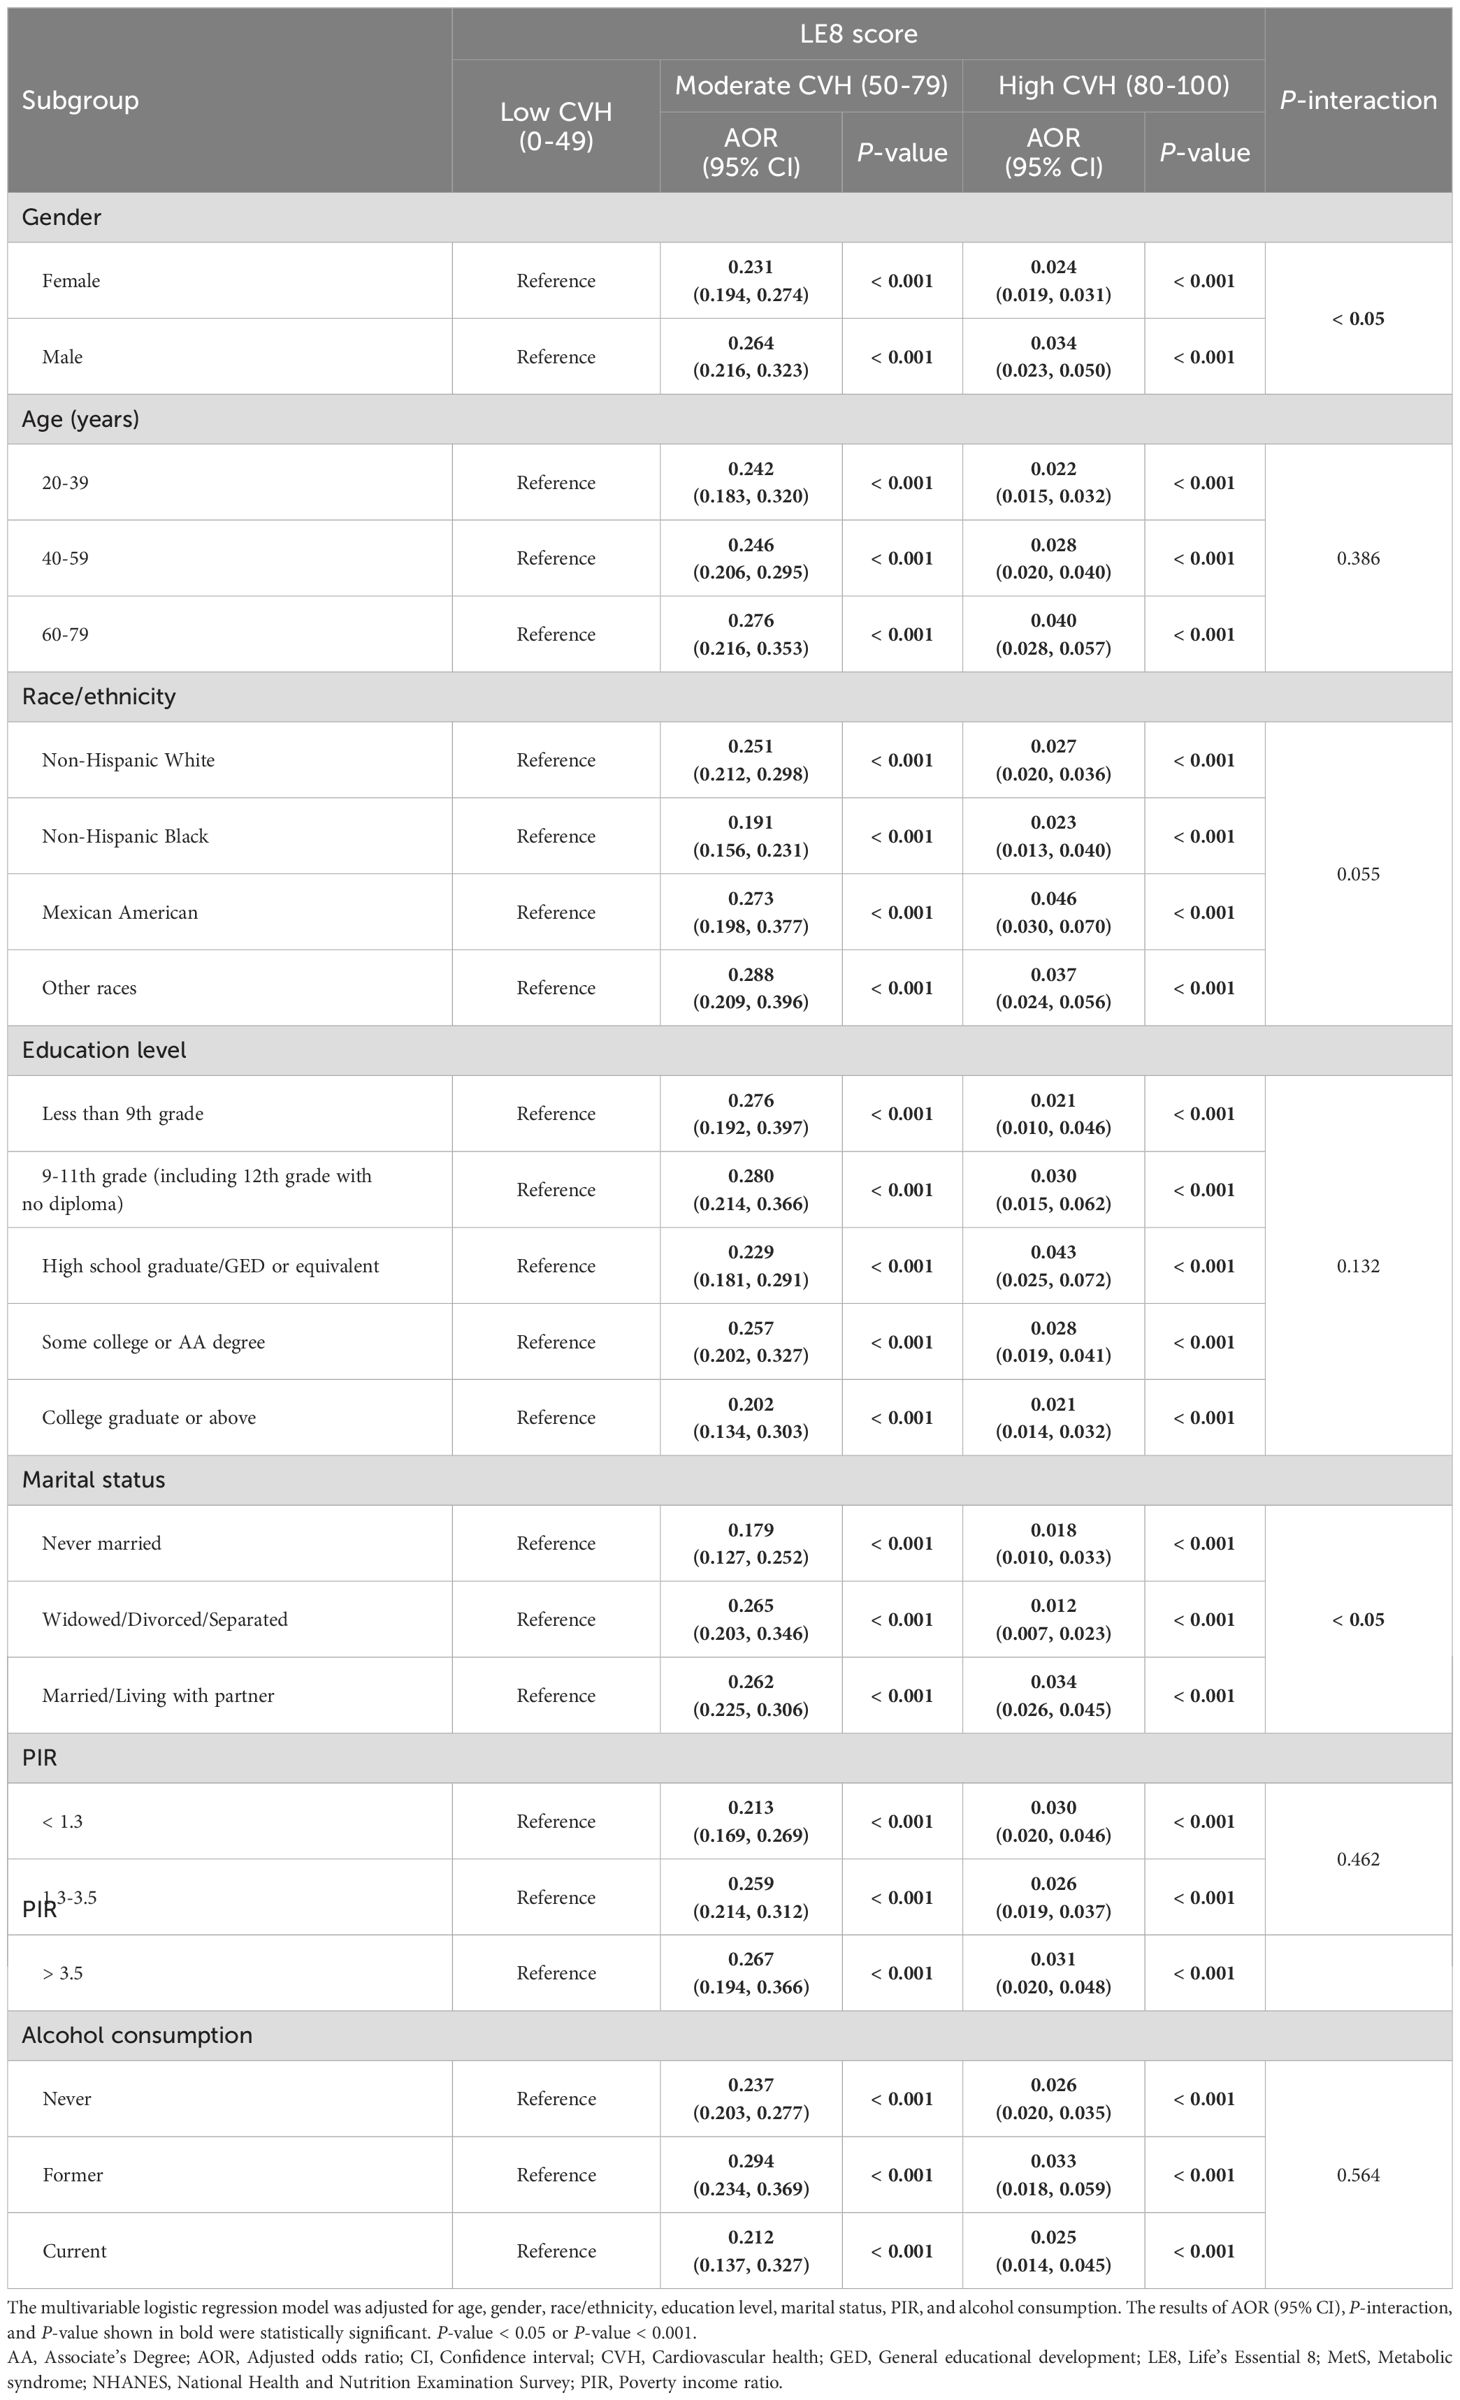
Table 3. Association of LE8 score with risk of MetS in stratified analyses, NHANES 2005-2018 (n = 21,543).
The results of the sensitivity analysis aligned with our results. Supplementary Tables S6, S7 demonstrate that the association between LE8-evaluated CVH and decreased risks of MetS in both male and female populations remained robust. Moreover, even after additional adjustments for the survey cycle, DM, hypertension, CVD, depression, and total energy intake, the high CVH level was still significantly related to a lower risk of MetS (Supplementary Table S8). Finally, when the high CVH group was used as the reference, participants with a low CVH had a higher risk of MetS (Supplementary Table S9).
4 Discussion
This nationally representative study of the U.S. population showed that LE8 and its metric scores had an inverse association with MetS. Our results remained robust after stratified and sensitivity analyses. These findings suggested that the potential beneficial impacts of maintaining a higher CVH level on preventing and managing MetS. Given the modifiable nature of several LE8 components, the LE8 guidelines may serve as a plausible prevention approach for MetS, which provides significant insights for caregivers and clinical staff. Moreover, LE8 as a comprehensive indicator, may be helpful for the risk assessment of MetS and the screening of potential high‐risk populations.
Our study found that individuals with a higher LE8 score exhibited a substantially diminished risk of MetS in comparison to those with a low CVH level, consistent with relevant prior studies. A study has revealed a statistically significant disparity in the presence of MetS among individuals with LS7-measured poor, intermediate, and ideal CVH in terms of MetS presence (P < 0.001). Moreover, the poor [hazard ratio (HR): 1.83, 95 % CI: 1.08–3.10] and intermediate CVH (HR: 1.57, 95% CI: 1.34–1.84) individuals with MetS exhibited a higher CVD risk (23). Another prospective study of 341,331 participants from the UK Biobank has demonstrated that the ideal CVH group, in comparison to the poor CVH group, mitigated the mortality risk associated with cardiometabolic diseases by approximately 62% for males and 53% for females (24). Despite there are some limitations of LS7 (10), the findings indicated that individuals with ideal CVH status may have lower risks of MetS and CVD (23, 24). One study compromising 170,726 participants from the UK Biobank has estimated the LE8-evaluated CVH association and the risk of 44 common non-communicable chronic diseases (25). In comparison with the low CVH group, the high CVH group had an 84% decreased risk of non-communicable chronic diseases in metabolic systems (HR: 0.16, 95% CI: 0.15–0.18) (25). Several potential mechanisms may explain the inverse association between LE8 and MetS. First, sustaining a better CVH and preventing MetS share common influencing factors related to the health behaviors of LE8, as well as health factors that are determinants of MetS (26–31). For instance, engaging in adequate and regular PA could improve the levels of cytokines related to MetS, including CRP, TNF-α, and IL-8/10 (32), and mitigate systemic inflammation by promoting anti-inflammatory adipokine release to reduce MetS risk (33, 34). Furthermore, the protective effects of LE8 in mitigating the risk of MetS could be explained by the physiological mechanism that appropriate weight reduction lowered free fatty acids and improved insulin resistance status, preventing MetS development (35). After controlling confounding and potential variables, including DM, hypertension, CVD, depression, and total energy intake, the results remained stable, indicating a higher LE8 score had potential protective impacts on MetS. Accordingly, our study exhibited lower heterogeneity besides representing more reliable main findings that individuals with a higher LE8 score were at a lower MetS risk.
Our study also found that, in addition to health factors, single nicotine exposure or diet metric scores of LE8 were significantly associated with the risk of MetS, in line with previous studies (36, 37). The pathophysiological mechanism shows that smoking can potentially stimulate lipolysis, releasing free fatty acids that may detrimentally impact fasting blood sugar levels through the impairment of pancreatic cells (37). In addition, an unhealthy diet may cause mitochondrial dysfunction, which can result in oxidative stress, bioenergy depletion, protein accumulation, and cell death. All these factors are related to MetS pathogenesis (38). Nonetheless, not all the LE8 metrics were involved in the risk of MetS. This study did not observe significantly inverse associations between PA, sleep health, and MetS, which inconsistent with previous studies (27, 28). Several reasons might explain the discrepancy. First, the PA and sleep duration measurements were obtained through self-report rather than objective measurement, which may have caused measurement errors that affected the reliability of relationships between PA, sleep metrics and MetS. Second, in addition to sleep duration, sleep quality also plays an important role in MetS that was not covered by LE8 (39). Further works are required to understand better the mechanism of the PA, sleep and MetS risks.
To our knowledge, this is the first research to examine the association between LE8 and MetS in representative general adults. Although, Yang et al. examined the association of MUH with LE8 (13). However, in that study, adults with one of the four MetS components were classified as MUH, which was different from the definition of MetS and could not fully reflect metabolic health. Additionally, we further explored the dose-response relationship in associations between LE8 scores and MetS. However, this study has some constraints. First, due to the of cross-sectional study design, we were unable to conclude a causal relationship between LE8 and MetS. However, the health factors of LE8 partly overlap the diagnostic criteria of MetS, implying that reverse causality is less likely to occur in our study. Therefore, high-quality prospective studies should be conducted to verify this causal relationship in the future. Second, health behavior metrics were measured by self-report questionnaires, which are subject to recall and social desirability biases and may have some impacts on the presented study results. Third, four metrics in the LE8 are components of MetS, which may affect the validity of the relationship between a low LE8-evaluated CVH level and MetS. It is, therefore, necessary to interpret with caution the association of a low LE8-evaluated CVH level with MetS. Finally, although we adjusted several potential confounders, such as energy intake, CVD, and so on, and conducted sensitivity analyses, it is undeniable that there are some unknown potential confounding factors (genetic factors, etc.) that have not been accounted.
5 Conclusions
In summary, LE8 was inversely associated with the risk of MetS among a national, large sample of U.S. adults. Adhering to LE8 guidelines to sustain a higher CVH level may be beneficial for preventing MetS. Future studies are required to further examine this causal relationship.
Data availability statement
Publicly available datasets were analyzed in this study. This data can be found here: https://doi.org/10.6084/m9.figshare.26927497.v4.
Ethics statement
The studies involving humans were approved by The National Center for Health Statistics Research Committee. The studies were conducted in accordance with the local legislation and institutional requirements. The participants provided their written informed consent to participate in this study.
Author contributions
YL: Writing – original draft, Visualization, Methodology, Formal analysis, Data curation, Conceptualization. JT: Writing – review & editing, Supervision, Project administration, Funding acquisition. SG: Writing – review & editing, Validation, Supervision, Project administration, Formal analysis, Conceptualization.
Funding
The author(s) declare financial support was received for the research, authorship, and/or publication of this article. This work was supported by the Humanities and Social Sciences Youth Foundation, Ministry of Education (No. 22YJC890029).
Acknowledgments
The authors thank the staff and participants of the National Health and Nutrition Examination Survey for their valuable contributions. Thanks to Zhang Jing (Second Department of Infectious Disease, Shanghai Fifth People's Hospital, Fudan University) for his work on the NHANES database.
Conflict of interest
The authors declare that the research was conducted in the absence of any commercial or financial relationships that could be construed as a potential conflict of interest.
Publisher’s note
All claims expressed in this article are solely those of the authors and do not necessarily represent those of their affiliated organizations, or those of the publisher, the editors and the reviewers. Any product that may be evaluated in this article, or claim that may be made by its manufacturer, is not guaranteed or endorsed by the publisher.
Supplementary material
The Supplementary Material for this article can be found online at: https://www.frontiersin.org/articles/10.3389/fendo.2024.1449930/full#supplementary-material
References
1. Jha BK, Sherpa ML, Imran M, Mohammed Y, Jha LA, Paudel KR, et al. Progress in understanding metabolic syndrome and knowledge of its complex pathophysiology. Diabetology. (2023) 4:134–59. doi: 10.3390/diabetology4020015
2. O'Neill S, O'Driscoll L. Metabolic syndrome: a closer look at the growing epidemic and its associated pathologies. Obes Rev. (2015) 16:1–12. doi: 10.1111/obr.12229
3. Hirode G, Wong RJ. Trends in the prevalence of metabolic syndrome in the United States, 2011-2016. JAMA. (2020) 323:2526–8. doi: 10.1001/jama.2020.4501
4. Powell EE, Wong VW, Rinella M. Non-alcoholic fatty liver disease. Lancet. (2021) 397:2212–24. doi: 10.1016/S0140-6736(20)32511-3
5. Mariani M, Sassano M, Boccia S. Metabolic syndrome and gastric cancer risk: a systematic review and meta-analysis. Eur J Cancer Prev. (2021) 30:239–50. doi: 10.1097/CEJ.0000000000000618
6. Frisardi V, Solfrizzi V, Seripa D, Capurso C, Santamato A, Sancarlo D, et al. Metabolic-cognitive syndrome: a cross-talk between metabolic syndrome and Alzheimer's disease. Ageing Res Rev. (2010) 9:399–417. doi: 10.1016/j.arr.2010.04.007
7. Ford ES. Risks for all-cause mortality, cardiovascular disease, and diabetes associated with the metabolic syndrome: a summary of the evidence. Diabetes Care. (2005) 28:1769–78. doi: 10.2337/diacare.28.7.1769
8. GBD 2017 Causes of Death Collaborators. Global, regional, and national age-sex-specific mortality for 282 causes of death in 195 countries and territories, 1980-2017: a systematic analysis for the Global Burden of Disease Study. Lancet. (2018) 392:1736–88. doi: 10.1016/S0140-6736(18)32203-7
9. Lloyd-Jones DM, Allen NB, Anderson CAM, Black T, Brewer LC, Foraker RE, et al. Life's essential 8: updating and enhancing the american heart association's construct of cardiovascular health: A presidential advisory from the american heart association. Circulation. (2022) 146:e18–43. doi: 10.1161/CIR.0000000000001078
10. Lloyd-Jones DM, Hong Y, Labarthe D, Mozaffarian D, Appel LJ, Van Horn L, et al. Defining and setting national goals for cardiovascular health promotion and disease reduction: the American Heart Association's strategic Impact Goal through 2020 and beyond. Circulation. (2010) 121:586–613. doi: 10.1161/CIRCULATIONAHA.109.192703
11. Yi J, Wang L, Guo X, Ren X. Association of Life's Essential 8 with all-cause and cardiovascular mortality among US adults: A prospective cohort study from the NHANES 2005-2014. Nutr Metab Cardiovasc Dis. (2023) 33:1134–43. doi: 10.1016/j.numecd.2023.01.021
12. Zhang Y, Ning N, Fan X, Huang R, Ye Y, He Y, et al. Age-dependent interaction between Life's Essential 8 and chronic kidney disease: A national cross-sectional analysis. Prev Med. (2023) 177:107763. doi: 10.1016/j.ypmed.2023.107763
13. Yang T, Yi J, Shao M, Linlin Z, Wang J, Huang F, et al. Associations between life's essential 8 and metabolic health among us adults: insights of NHANES from 2005 to 2018. Acta Diabetol. (2024) 61:963–74. doi: 10.1007/s00592-024-02277-2
14. Del Brutto OH, Zambrano M, Peñaherrera E, Montalván M, Pow-Chon-Long F, Tettamanti D. Prevalence of the metabolic syndrome and its correlation with the cardiovascular health status in stroke- and ischemic heart disease-free Ecuadorian natives/mestizos aged ≥40 years living in Atahualpa: a population-based study. Diabetes Metab Syndr. (2013) 7:218–22. doi: 10.1016/j.dsx.2013.10.006
15. Sun K, Ren M, Liu D, Wang C, Yang C, Yan L. Alcohol consumption and risk of metabolic syndrome: a meta-analysis of prospective studies. Clin Nutr. (2014) 33:596–602. doi: 10.1016/j.clnu.2013.10.003
16. Azadbakht L, Haghighatdoost F, Keshteli AH, Larijani B, Esmaillzadeh A. Consumption of energy-dense diets in relation to metabolic syndrome and inflammatory markers in Iranian female nurses. Public Health Nutr. (2017) 20:893–901. doi: 10.1017/S1368980016002822
17. Liang JH, Huang S, Pu YQ, Zhao Y, Chen YC, Jiang N, et al. Whether weekend warrior activity and other leisure-time physical activity pattern reduce the risk of depression symptom in the representative adults? A population-based analysis of NHANES 2007-2020. J Affect Disord. (2023) 340:329–39. doi: 10.1016/j.jad.2023.07.113
18. NCHS Ethics Review Board (ERB) approval* . Centers for Disease Control and Prevention. Available online at: https://www.cdc.gov/nchs/nhanes/irba98.htm (Accessed 2023-12-01).
19. Krebs-Smith SM, Pannucci TE, Subar AF, Kirkpatrick SI, Lerman JL, Tooze JA, et al. Update of the Healthy Eating Index: HEI-2015 [published correction appears in J Acad Nutr Diet. J Acad Nutr Diet. (2018) 118:1591–602. doi: 10.1016/j.jand.2018.05.021
20. Lloyd-Jones DM, Ning H, Labarthe D, Brewer L, Sharma G, Rosamond W, et al. Status of Cardiovascular Health in US Adults and Children Using the American Heart Association's New "Life's Essential 8" Metrics: Prevalence Estimates From the National Health and Nutrition Examination Survey (NHANES), 2013 Through 2018 [published correction appears in Circulation. Circulation. (2022) 146:822–35. doi: 10.1161/CIRCULATIONAHA.122.060911
21. Grundy SM, Cleeman JI, Daniels SR, Donato KA, Eckel RH, Franklin BA, et al. Diagnosis and management of the metabolic syndrome: an American Heart Association/National Heart, Lung, and Blood Institute Scientific Statement. Circulation. (2005) 112:2735–52. doi: 10.1161/CIRCULATIONAHA.105.169404
22. Yang C, Jia X, Wang Y, Fan J, Zhao C, Yang Y, et al. Trends and influence factors in the prevalence, intervention, and control of metabolic syndrome among US adults, 1999-2018. BMC Geriatr. (2022) 22:979. doi: 10.1186/s12877-022-03672-6
23. Hosseinpour-Niazi S, Afaghi S, Hadaegh P, Mahdavi M, Farhadnejad H, Tohidi M, et al. The association between metabolic syndrome and insulin resistance with risk of cardiovascular events in different states of cardiovascular health status. J Diabetes Investig. (2024) 15:208–18. doi: 10.1111/jdi.14101
24. Xu C, Zhang P, Cao Z. Cardiovascular health and healthy longevity in people with and without cardiometabolic disease: A prospective cohort study. EClinicalMedicine. (2022) 45:101329. doi: 10.1016/j.eclinm.2022.101329
25. Yu Y, Sun Y, Yu Y, Wang Y, Chen C, Tan X, et al. Life's Essential 8 and risk of non-communicable chronic diseases: Outcome-wide analyses. Chin Med J (Engl). (2024) 137:1553–62. doi: 10.1097/CM9.0000000000002830
26. Cena H, Tesone A, Niniano R, Cerveri I, Roggi C, Turconi G. Prevalence rate of Metabolic Syndrome in a group of light and heavy smokers. Diabetol Metab Syndr. (2013) 5:28. doi: 10.1186/1758-5996-5-28
27. Kim YJ, Hwang JY, Kim H, Park S, Kwon O. Diet quality, physical activity, and their association with metabolic syndrome in Korean adults. Nutrition. (2019) 59:138–44. doi: 10.1016/j.nut.2018.08.009
28. Lich Smiley A, King D, Bidulescu A. The association between sleep duration and metabolic syndrome: the NHANES 2013/2014. Nutrients. (2019) 11:2582. doi: 10.3390/nu11112582
29. Hu EA, Steffen LM, Coresh J, Appel LJ, Rebholz CM. Adherence to the healthy eating index-2015 and other dietary patterns may reduce risk of cardiovascular disease, cardiovascular mortality, and all-cause mortality. J Nutr. (2020) 150:312–21. doi: 10.1093/jn/nxz218
30. Benowitz NL, Liakoni E. Tobacco use disorder and cardiovascular health. Addiction. (2022) 117:1128–38. doi: 10.1111/add.15703
31. German C, Makarem N, Fanning J, Redline S, Elfassy T, McClain A, et al. Sleep, sedentary behavior, physical activity, and cardiovascular health: MESA. Med Sci Sports Exerc. (2021) 53:724–31. doi: 10.1249/MSS.0000000000002534
32. Alizaei Yousefabadi H, Niyazi A, Alaee S, Fathi M, Mohammad Rahimi GR. Anti-inflammatory effects of exercise on metabolic syndrome patients: A systematic review and meta-analysis. Biol Res Nurs. (2021) 23:280–92. doi: 10.1177/1099800420958068
33. Golbidi S, Laher I. Exercise induced adipokine changes and the metabolic syndrome. J Diabetes Res. (2014) 2014:726861. doi: 10.1155/2014/7268612016;22(5):32-36
34. Valenzuela PL, Ruilope LM, Santos-Lozano A, Wilhelm M, Kränkel N, Fiuza-Luces C, et al. Exercise benefits in cardiovascular diseases: from mechanisms to clinical implementation. Eur Heart J. (2023) 44:1874–89. doi: 10.1093/eurheartj/ehad170
35. Eckel RH, Grundy SM, Zimmet PZ. The metabolic syndrome. Lancet. (2005) 365:1415–28. doi: 10.1016/S0140-6736(05)66378-7
36. Choi HI, Lee SJ, Kang JG, Lee SH, Kim BS, Kim BJ. Association of environmental tobacco smoke exposure with metabolic syndrome: A longitudinal Cohort Study of 71,055 never smokers. Nutr Metab Cardiovasc Dis. (2022) 32:2534–43. doi: 10.1016/j.numecd.2022.07.009
37. Jowshan MR, Rafraf M, Hashemi AH, Hajjarzadeh S, Asghari-Jafarabadi M, Asghari S. Association between healthy eating index-2015 scores and metabolic syndrome among Iranian women: a cross-sectional study. BMC Womens Health. (2024) 24:30. doi: 10.1186/s12905-023-02876-1
38. Kim SW, Kim HJ, Min K, Lee H, Lee SH, Kim S, et al. The relationship between smoking cigarettes and metabolic syndrome: A cross-sectional study with non-single residents of Seoul under 40 years old. PloS One. (2021) 16:e0256257. doi: 10.1371/journal.pone.0256257
Keywords: Life’s Essential 8, cardiovascular health, metabolic syndrome, NHANES, cross-sectional study
Citation: Liu Y, Tang J and Gao S (2024) The inverse relationship between Life’s Essential 8 and risk of metabolic syndrome: evidence from NHANES 2005-2018. Front. Endocrinol. 15:1449930. doi: 10.3389/fendo.2024.1449930
Received: 04 July 2024; Accepted: 08 October 2024;
Published: 28 October 2024.
Edited by:
Carsten Grötzinger, Charité University Medicine Berlin, GermanyReviewed by:
Dario Rahelic, Merkur University Hospital, CroatiaMuthu Raj Salaikumaran, Baylor College of Medicine, United States
Jaideep Menon, Amrita Vishwa Vidyapeetham University, India
Kaijian Hou, Shantou University, China
Copyright © 2024 Liu, Tang and Gao. This is an open-access article distributed under the terms of the Creative Commons Attribution License (CC BY). The use, distribution or reproduction in other forums is permitted, provided the original author(s) and the copyright owner(s) are credited and that the original publication in this journal is cited, in accordance with accepted academic practice. No use, distribution or reproduction is permitted which does not comply with these terms.
*Correspondence: Siyao Gao, Z2Fvc2l5YW9AY3N1LmVkdS5jbg==
 Yuhang Liu
 Jialing Tang
 Siyao Gao