 Madison Hamby
 David E. Stec
 Emily Hildebrandt1
 Heather A. Drummond
94% of researchers rate our articles as excellent or good
Learn more about the work of our research integrity team to safeguard the quality of each article we publish.
Find out more
ORIGINAL RESEARCH article
Front. Endocrinol., 19 August 2024
Sec. Cardiovascular Endocrinology
Volume 15 - 2024 | https://doi.org/10.3389/fendo.2024.1449344
This article is part of the Research TopicHypertension in Obese Women: Gender-Specific Challenges and SolutionsView all 6 articles
Introduction: Degenerin proteins, such as βENaC and ASIC2, have been implicated in cardiovascular function. However, their role in metabolic syndrome have not been studied. To begin to assess this interaction, we evaluated the impact of a high fat diet (HFD) on mice lacking normal levels of ASIC2 (ASIC2-/-) and βENaC (βENaCm/m).
Methods: Twenty-week-old male and female mice were placed on a 60% HFD for 12 weeks. Body weight was measured weekly, and body composition by non-invasive ECHO MRI and fasting blood glucose were measured at 0, 4, 8 and 12 weeks. A glucose tolerance test was administered after 12 weeks. Differences between ASIC2-/-/βENaCm/m and WT groups were compared using independent t-tests or ANOVA where appropriate within each sex. Data are presented as mean ± SEM and ASIC2-/-/βENaCm/m vs. WT.
Results: At 20 weeks of age, ASIC2-/-/βENaCm/m mice (n=9F/10M) weighed less and gained less weight than WT (n=12F/16M). Total body fat and lean body masses were reduced in female and male ASIC2-/-/βENaCm/m mice. Total body fat and lean body masses as % control were identical at the end of 12 weeks. Fasting blood glucoses were lower in female and male ASIC2-/-/βENaCm/m vs. WT mice after 12 weeks HFD. The area under the curve for the glucose tolerance test was reduced in female and tended (p=.079) to decrease in male ASIC2-/-/βENaCm/m. Plasma leptin and insulin were reduced in female and male ASIC2-/-/βENaCm/m vs. WT mice. Plasma insulin in female ASIC2-/-/βENaCm/m mice remained unchanged throughout the HFD period. Liver and liver fat masses, as well as percent liver fat, were reduced in both female and male ASIC2-/-/βENaCm/m mice after HFD. Plasma triglycerides, cholesterol, LDL- and HDL-cholesterols were markedly improved in male and/or female ASIC2-/-/βENaCm/m following the HFD.
Discussion: These novel findings suggest that loss of ASIC2 and βENaC offer a significant protection against HFD-induced metabolic syndrome.
Metabolic syndrome is a combination of pathologies that together increase the risk of cardiovascular diseases such as hypertension, stroke, and heart disease (1). The diagnostic criteria for metabolic syndrome include a waist circumference of 40 inches for men and 35 inches for women, reduced HDL of less than 40 mg/dL for men and 50 mg/dL for women, triglycerides of 150 mg/dL or greater, elevated fasting blood glucose of 100 mg/dL or greater, and elevated blood pressure above 135 mmHg systolic or 85 mmHg diastolic (1–3). With the total prevalence of metabolic syndrome rising to over 40% of the general population in recent years (3), it is imperative to understand the mechanisms underlying this disease.
Degenerin proteins are a family of ion channels expressed in a variety of cell types that participate in cardiometabolic control including central and peripheral neurons, smooth muscle cells, immune cells, and epithelial regulation of salt and water transport in the kidney and colon (4–11). While the degenerin channels are expressed in cell types affected by metabolic syndrome and obesity, their role in disease development has never been examined.
The degenerin protein family includes two subfamilies: acid-sensing ion channels (ASICs) and epithelial Na+ channels (ENaC). The ASIC subfamily is encoded by five genes: ACCN1, ACCN2, ACCN3, ACCN4, and ACCN5. ASIC channels form homo- and heteromeric inward cation channels that are gated by rapid drops in extracellular pH. ASICs were initially identified in central and peripheral neurons but have also been identified in smooth muscle cells and immune cells (7–10, 12–17). Notably, ASIC2 is expressed in the arcuate nucleus and ventromedial hypothalamus, two areas involved in feeding and satiety (18–20). Our laboratory and others have shown that (1) pressure-induced constriction in small renal arteries and renal afferent arterioles is attenuated, (2) renal autoregulation blood flow is disrupted, and (3) blood pressure is elevated in the ASIC2 global knockout mouse. Taken together, these findings support an important role for ASIC2 in neural and local control of cardiovascular function (12, 21–25).
The epithelial Na+ channel (ENaC) subfamily is encoded by four genes (SCNN1a, SCNN1b, SCNN1g, and SCNN1d) and forms heterotrimeric, non-voltage gated, amiloride-sensitive sodium channels predominantly expressed in renal, colon, and lung epithelia and maintains sodium and water homeostasis (6, 26). ENaC subunits have also been identified in sensory neurons, endothelial cells, choroid plexus, select central nervous system neurons, immune cells, small intestinal enterocytes, and vascular smooth muscle cells. The classical ENaC channel is a heterotrimer formed by α, β, and γ subunits. The delta subunit is specific to humans and can form a channel with βγENaC (26–30). Our laboratory has focused on the importance of βENaC in the cardiovascular system due to its expression in sensory neurons and vascular smooth muscle cells. Gain of function mutations associated with βENaC include Liddle’s syndrome, characterized by severe hypertension due to excess salt and water retention in the distal nephron (31). Loss of function mutations are associated with autosomal recessive pseudohyperaldosteronism type I, characterized by renal salt and water wasting (26, 32). Due to the importance of ENaC in salt and water homeostasis, few animal models of gain or loss of function are available. Because of this, our laboratory uses a mouse hypomorphic βENaC model (βENaCm/m) developed by the Hummler laboratory (32). In addition to salt wasting under severe dietary Na+ restriction, our laboratory has shown that βENaC hypomorphic mice also have attenuated (1) pressure-induced constriction in small renal arteries and renal afferent arterioles, (2) autoregulation of renal blood flow, and (3) arterial baroreflex control of blood pressure, leading to elevated arterial blood pressure and enhanced blood pressure variability (25, 27–29, 33).
What evidence suggests that ASIC2 or βENaC might contribute to the metabolic syndrome and obesity? As noted above, ASIC2 and βENaC are expressed in many cell types involved in the pathology including adipocytes, hepatocytes, central neurons, endothelial cells, vascular smooth muscle cells, and immune cells (4–7, 13, 20, 22, 23, 26, 27, 29, 30, 34–39). Along with its involvement in neural and local vascular control of cardiovascular function, βENaC may also be a target for the treatment of systemic metabolic dysfunction (6, 27, 29, 36, 37). It is known that ENaCs are regulated by insulin, and sodium influx into the cell allows for the activation of other ion channels and signaling cascades (6, 37). Loss of function of at least two degenerin proteins, ASIC2 or βENaC, leads to disrupted cardiovascular function including arterial baroreceptor, myogenic regulation of cerebral and renal blood flow, and hypertension (22, 24, 27). More compelling, ASIC2, and βENaC to a lesser extent, is expressed throughout the hypothalamus, specifically in hypothalamic and nucleus tractus solitarius areas important in the homeostasis of feeding, satiety, and blood pressure regulation (15, 16, 18–20, 40, 41). The potential importance of degenerin proteins ASIC2/βENaC in the development of metabolic syndrome has not been previously explored. In the current investigation, we provide evidence that male and female mice lacking normal levels of ASIC2 and βENaC are protected from metabolic dysfunction and hepatic steatosis associated with a high-fat diet.
All animal works were done under the Association for Assessment and Accreditation of Laboratory Animal Care (AAALAC) and the University of Mississippi Medical Center (UMMC) Institutional Animal Care and Use Committee (IACUC). The model was generated by crossing ASIC2 global knockout mice (ASIC2-/-; RRID: IMSR_JAX:013126) mice onto the hypomorphic βENaC strain (βENaCm/m, RRID: IMSR_EM:04574) as described previously (25). The animals were maintained as homozygous mating pairs. The mice were maintained under a 12-h light/12-h dark light cycle and permitted food and water ad libitum. Male and female mice were used in this study. There were no exclusion criteria. After analysis, genotypes were confirmed in all animals using liver DNA. All protocols were approved by the Institutional Animal Care and Use Committee at UMMC.
At 20 weeks of age, male and female wild-type and ASIC2-/-/βENaCm/m mice were placed on a high-fat diet (HFD; 60% kcal from fat, 21% kcal from carbohydrate, Envigo, cat. #TD.0644) or remained on a normal chow (NFD; 14% kcal fat, 54% kcal carbohydrate, Envigo, cat. #TD.8604) for 12 weeks (n = 6–16/group). During this period, the mice were housed in home cages. Body mass was obtained weekly. Body composition was assessed at weeks 0, 4, 8, and 12 of NFD or HFD using Echo MRI (4-in-1 EchoMRI-900TM, Echo Medical System, Houston, TX, USA). Additionally, a 6-h fasting blood sample was collected via retro-orbital eye bleed for analysis of glucose, insulin, and leptin. At 12 weeks, a glucose tolerance test was performed on a group of HFD animals. Upon completion of the study, the mice were fasted and their organs were collected, weighed, then snap-frozen in liquid nitrogen, and stored at -70°C, except the livers.
For the glucose tolerance test, the mice were injected with 1 mg glucose/kg body mass intra-peritoneally, and blood samples were collected at 15, 30, 45, 60, and 90 min after injection. Blood glucose was assessed using an Accu-check glucose meter.
Plasma leptin (R&D Systems, cat. #MOB00B) and insulin (Crystal Chem, cat. #90080) were assessed by ELISA through the Analytical and Assay Core in the Department of Physiology and Biophysics at UMMC. The Analytical and Assay Core uses a standardized approach and internal standards to provide a repeatable and reliable assessment. Plasma lipids were assessed through 1H nuclear magnetic resonance (NMR) spectroscopy using the Bruker Biospin IVDr platform in the Center for Structural Biology NMR Core Facility at Vanderbilt University as previously described (42–44).
To obtain body length data, we measured the distance between the tip of the nose to the base of the tail using a ruler (mm). To obtain tibial length data, we measured the distance from the ankle to the knee using a ruler (mm).
Livers were assessed for fat content using EchoMRI and then fractioned for fixation in 4% paraformaldehyde for Oil Red O staining in cryosections through the Histology Core in the Department of Physiology and Biophysics at UMMC (44, 45). The remaining liver samples were stored at -70°C.
Liver cryosections (20 µm) were stained with rat anti-F4/80 (Biorad, cat. #MCA497, RRID AB_2098196) to label macrophages. Tissue sections were rinsed with PBS, permeabilized with 0.1% Triton X-100 (Thermo, cat. #28314), blocked with 5% normal donkey serum (NDS, Jackson Immuno, cat. #017-000-121), incubated with primary antibody (1:25–1:100) overnight in 5% NDS, rinsed again, incubated with donkey anti-rat Cy3 (1:250, Jackson Immuno, cat. #712-165-153, RRID AB_2340667) for 1 h, then rinsed, and cover-slipped. Liver macrophage localization was visualized using a Leica SP8 laser scanning confocal microscope. The samples were imaged under identical conditions using a ×63 objective and prepared identically for publication in Adobe Photoshop. Negative control samples lacking primary antibody were run in parallel and used to establish baseline fluorescence signal. Violin plots representing the quantification of liver macrophages are representative of 15 fields of view from n = 2 animals per group.
Data were preliminarily analyzed in Excel and then transferred to GraphPad Prism for statistical analysis. Data are presented as mean ± standard error mean, except for immunofluorescence quantitation data which are presented as violin plots with median and quartiles. Data were analyzed using multiple approaches including repeated-measures ANOVA, two-way, or one-way ANOVA where appropriate, followed by Holm’s Sidak post hoc analysis. Male and female groups were analyzed separately due to unequal sample sizes precluding a three-way ANOVA analysis in Prism. Lipid profile data were analyzed using dependent, two-tailed t-tests with the Bonferroni correction. Figures and figure legends identify sample sizes, specific statistical and post hoc analyses, and significance notations or p-values.
To determine the role of ASIC2/βENaC on HFD-induced body mass gain, we measured the body weight of ASIC2-/-/βENaCm/m and WT mice every 4 weeks while on NFD (Figure 1A) and HFD (Figure 1B). As shown in Figure 1A, ASIC2-/-/βENaCm/m male mice on the NFD gain mass similar to WT controls, while ASIC2-/-/βENaCm/m female mice gain less body mass compared to WT controls. When fed a HFD, both male and female ASIC2-/-/βENaCm/m mice have a significantly lower body mass at 4, 8, and 12 weeks compared to WT mice (Figure 1B). P-values for the two-way ANOVA are provided in the tables immediately below Figures 1A, B. Percent weight gain values for NFD and HFD groups over the 12-week period are shown in Figures 1C, D, respectively. The percent weight gain tended to be lower in ASIC2-/-/βENaCm/m female mice vs. WT mice on NFD, while ASIC2-/-/βENaCm/m male mice gained a similar relative amount of body mass over 12 weeks on NFD (Figure 1C). The percent body mass gain in male and female ASIC2-/-/βENaCm/m groups on HFD trends toward lower body mass gains following the 12-week HFD compared to WT mice (Figure 1D).
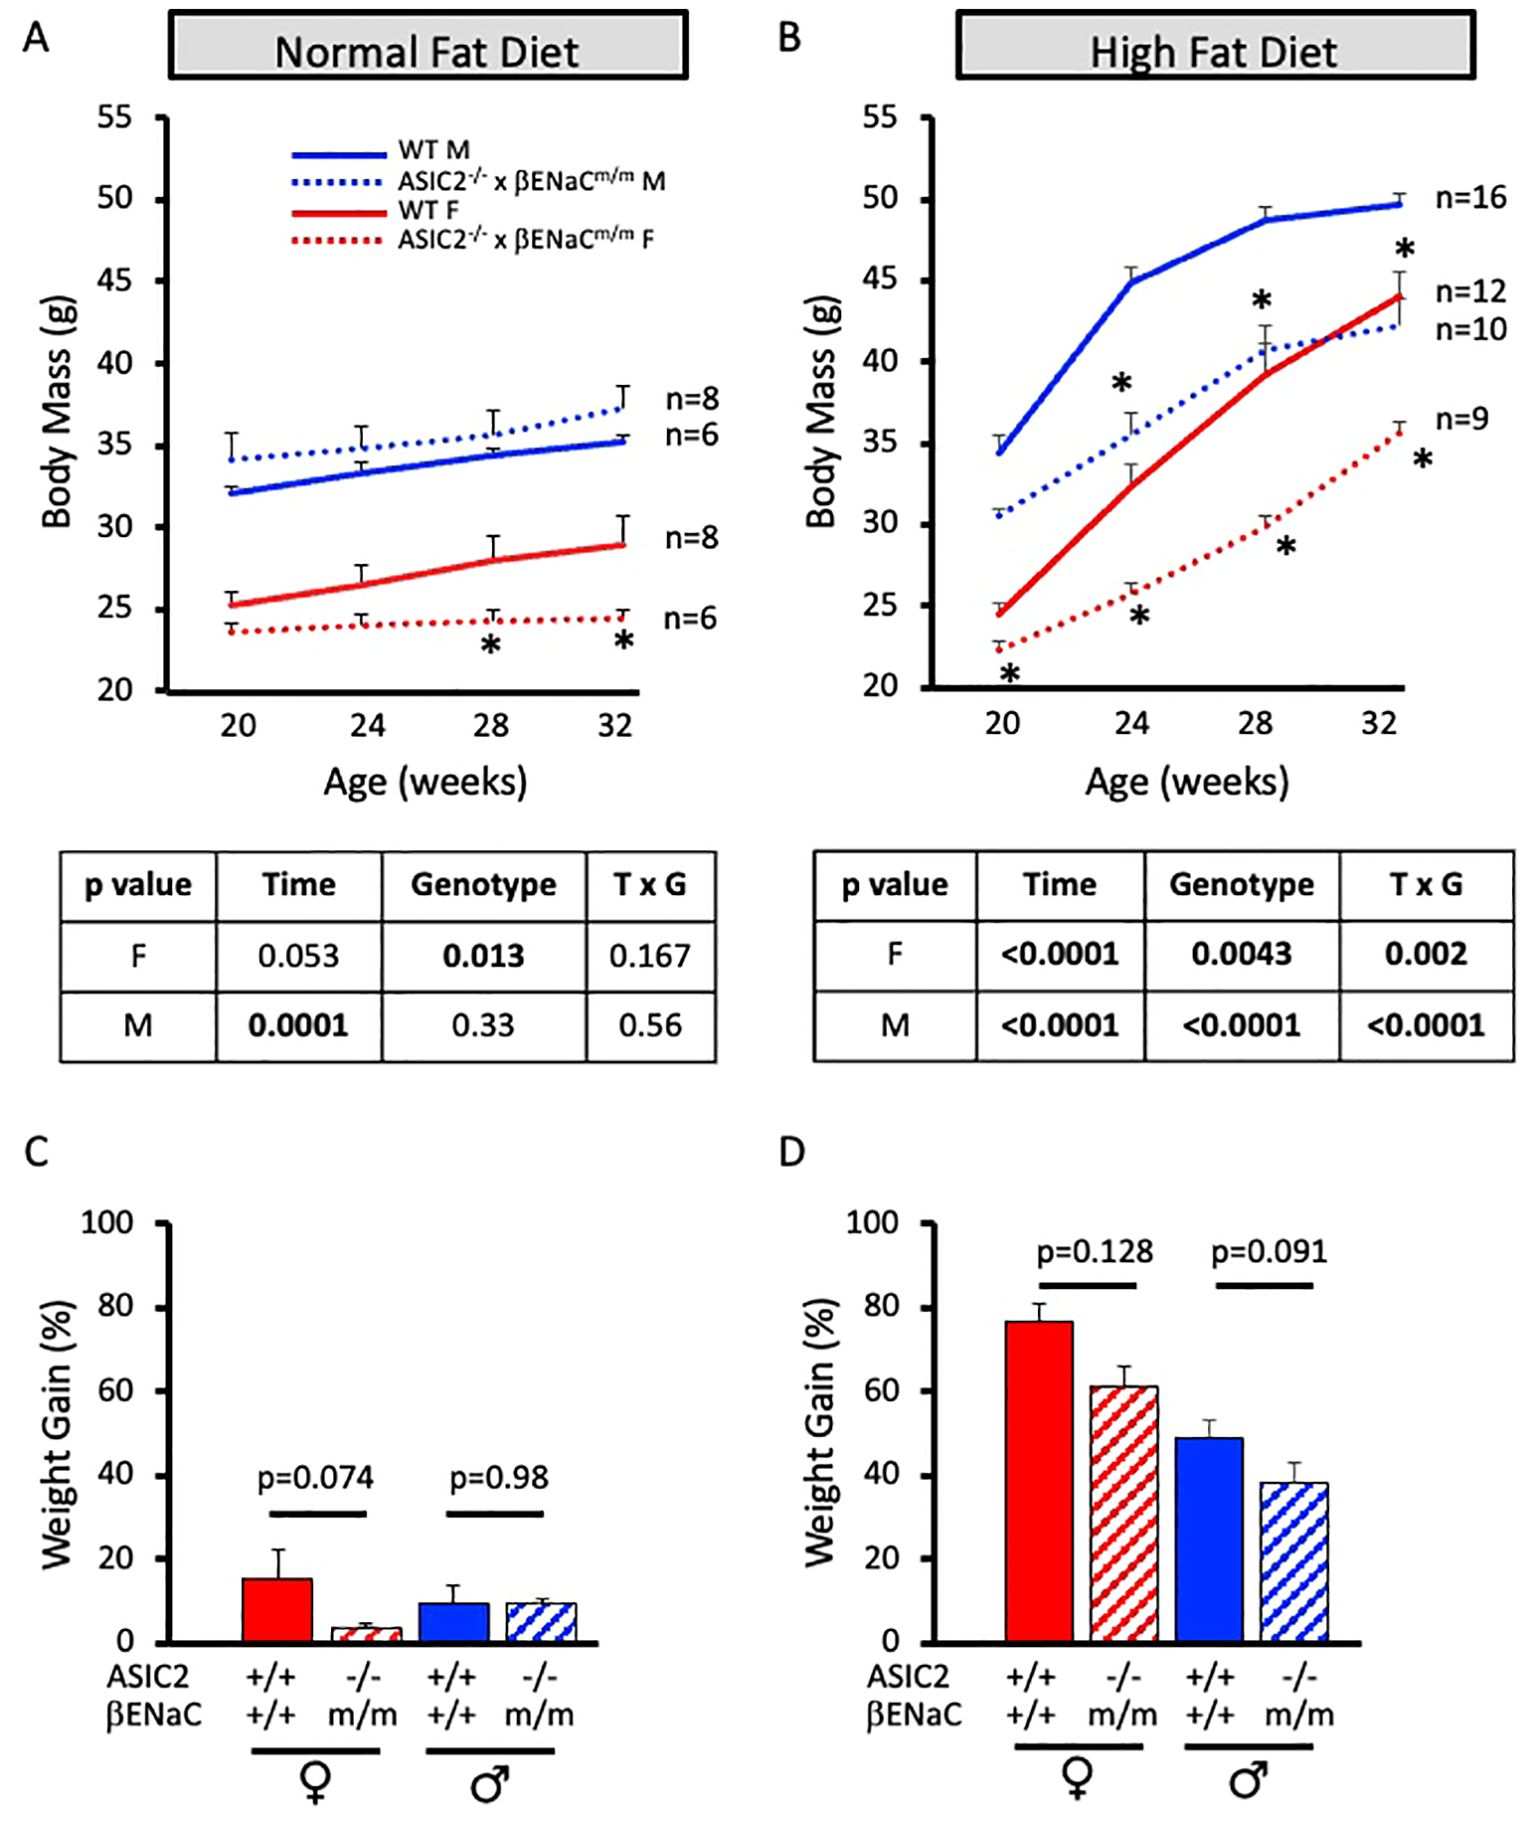
Figure 1. ASIC2-/-/βENaCm/m mice gain less body mass with 60% high-fat diet (HFD) from 20 weeks of age to 32 weeks of age. (A) Body mass change in normal-fat diet (NFD) ASIC2-/-/βENaCm/m and wild-type (WT) control animals. (B) Body mass change in HFD-fed ASIC2-/-/βENaCm/m and WT control animals. (C, D) Weight gain over the 12-week period in NFD- and HFD-fed groups. Red lines/columns represent female individuals; blue lines/bars represent male individuals. Solid lines and columns represent the WT group. Dashed lines and hatched columns represent ASIC2-/-/βENaCm/m. Sample sizes are shown in (A, B). Data in (A, B) were analyzed using repeated-measures ANOVA within sex, followed by Holm’s Sidak post hoc analysis. The asterisk denotes being significantly different from WT at a given time point at p <0.05. Data in (C, D) were analyzed using independent t-tests within sex; p-values are provided on the graph.
We used non-invasive ECHO MRI to determine the body composition changes in NFD and HFD animals. We measured lean mass, fat mass, and total body water of ASIC2-/-/βENaCm/m and WT mice every 4 weeks while on diet. On the NFD, there were no significant differences in absolute and normalized lean or fat body masses or total body water (Figures 2A–E). After 12 weeks of HFD, lean and fat body masses were significantly lower in female and male ASIC2-/-/βENaCm/m mice at 4, 8, and 12 weeks compared to WT mice (Figures 2F, H); however, normalized lean and fat body masses were similar at the end of the 12-week HFD period (Figures 2G, I). Total body water content was lower in male and female ASIC2-/-/βENaCm/m mice on HFD but not the NFD group, which was likely associated with their lower absolute lean body mass (Figure 2J).
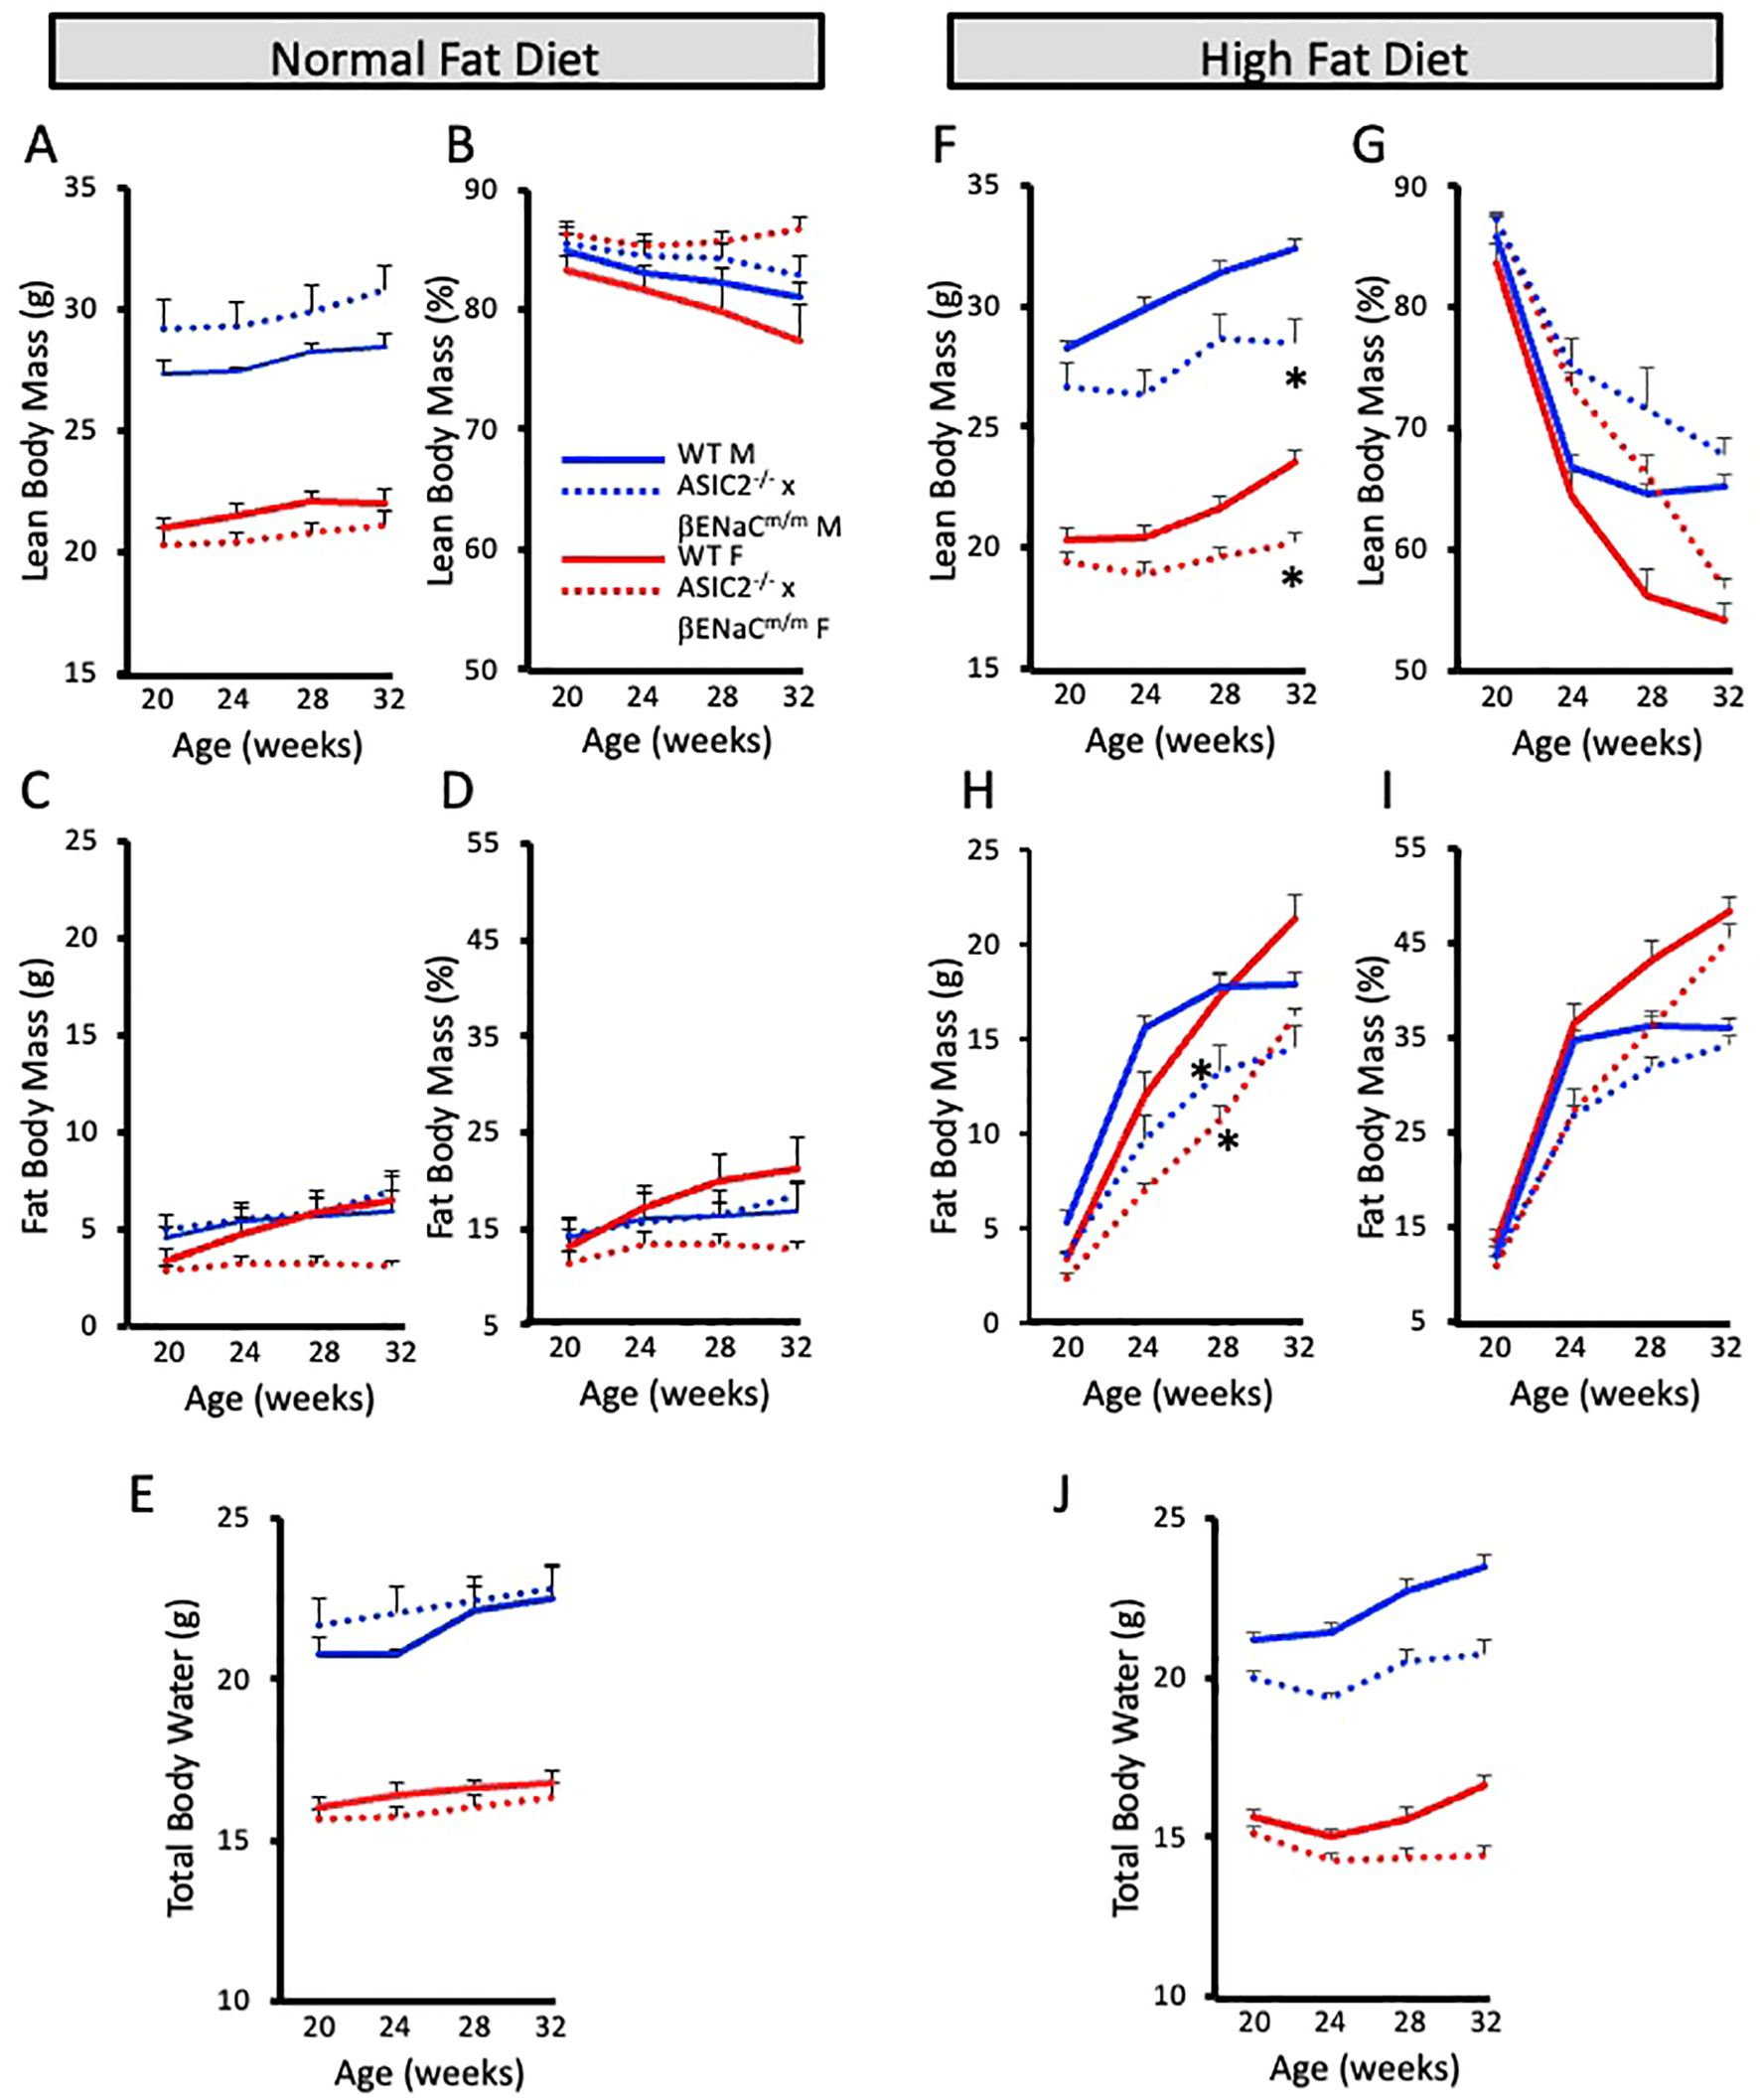
Figure 2. Body composition is similar, but not identical, in ASIC2-/-/βENaCm/m and wild-type (WT) mice on a 60% high-fat diet (HFD) from 20 weeks of age to 32 weeks of age. (A, B) Absolute and normalized lean body mass in normal-fat diet (NFD) mice. (C, D) Absolute and normalized fat body mass in NFD mice. (E) Total body water content in NFD mice. (F, G) Absolute and normalized lean body mass in HFD mice. (H, I) Absolute and normalized fat body mass in HFD mice. (J) Total body water content in HFD mice. Red lines/bars represent female individuals; blue lines/bars represent male individuals. Solid lines represent the WT group, and dashed lines represent ASIC2-/-/βENaCm/m. * Significantly different from control at respective time point.
Fasting blood glucose levels were obtained at 0, 4, 8, and 12 weeks for the NFD (Figures 3A, B) and HFD (Figures 3C, D) groups via retro-orbital eye bleed using an Accu-check glucometer. Female and male ASIC2-/-/βENaCm/m and WT mice fed a NFD for 12 weeks have no significant changes in fasting blood glucose levels (Figures 3A, B). However, both female and male ASIC2-/-/βENaCm/m mice fed a HFD have significantly reduced fasting blood glucose levels at each 4-week timepoint tested compared to their WT counterparts (Figures 3C, D).
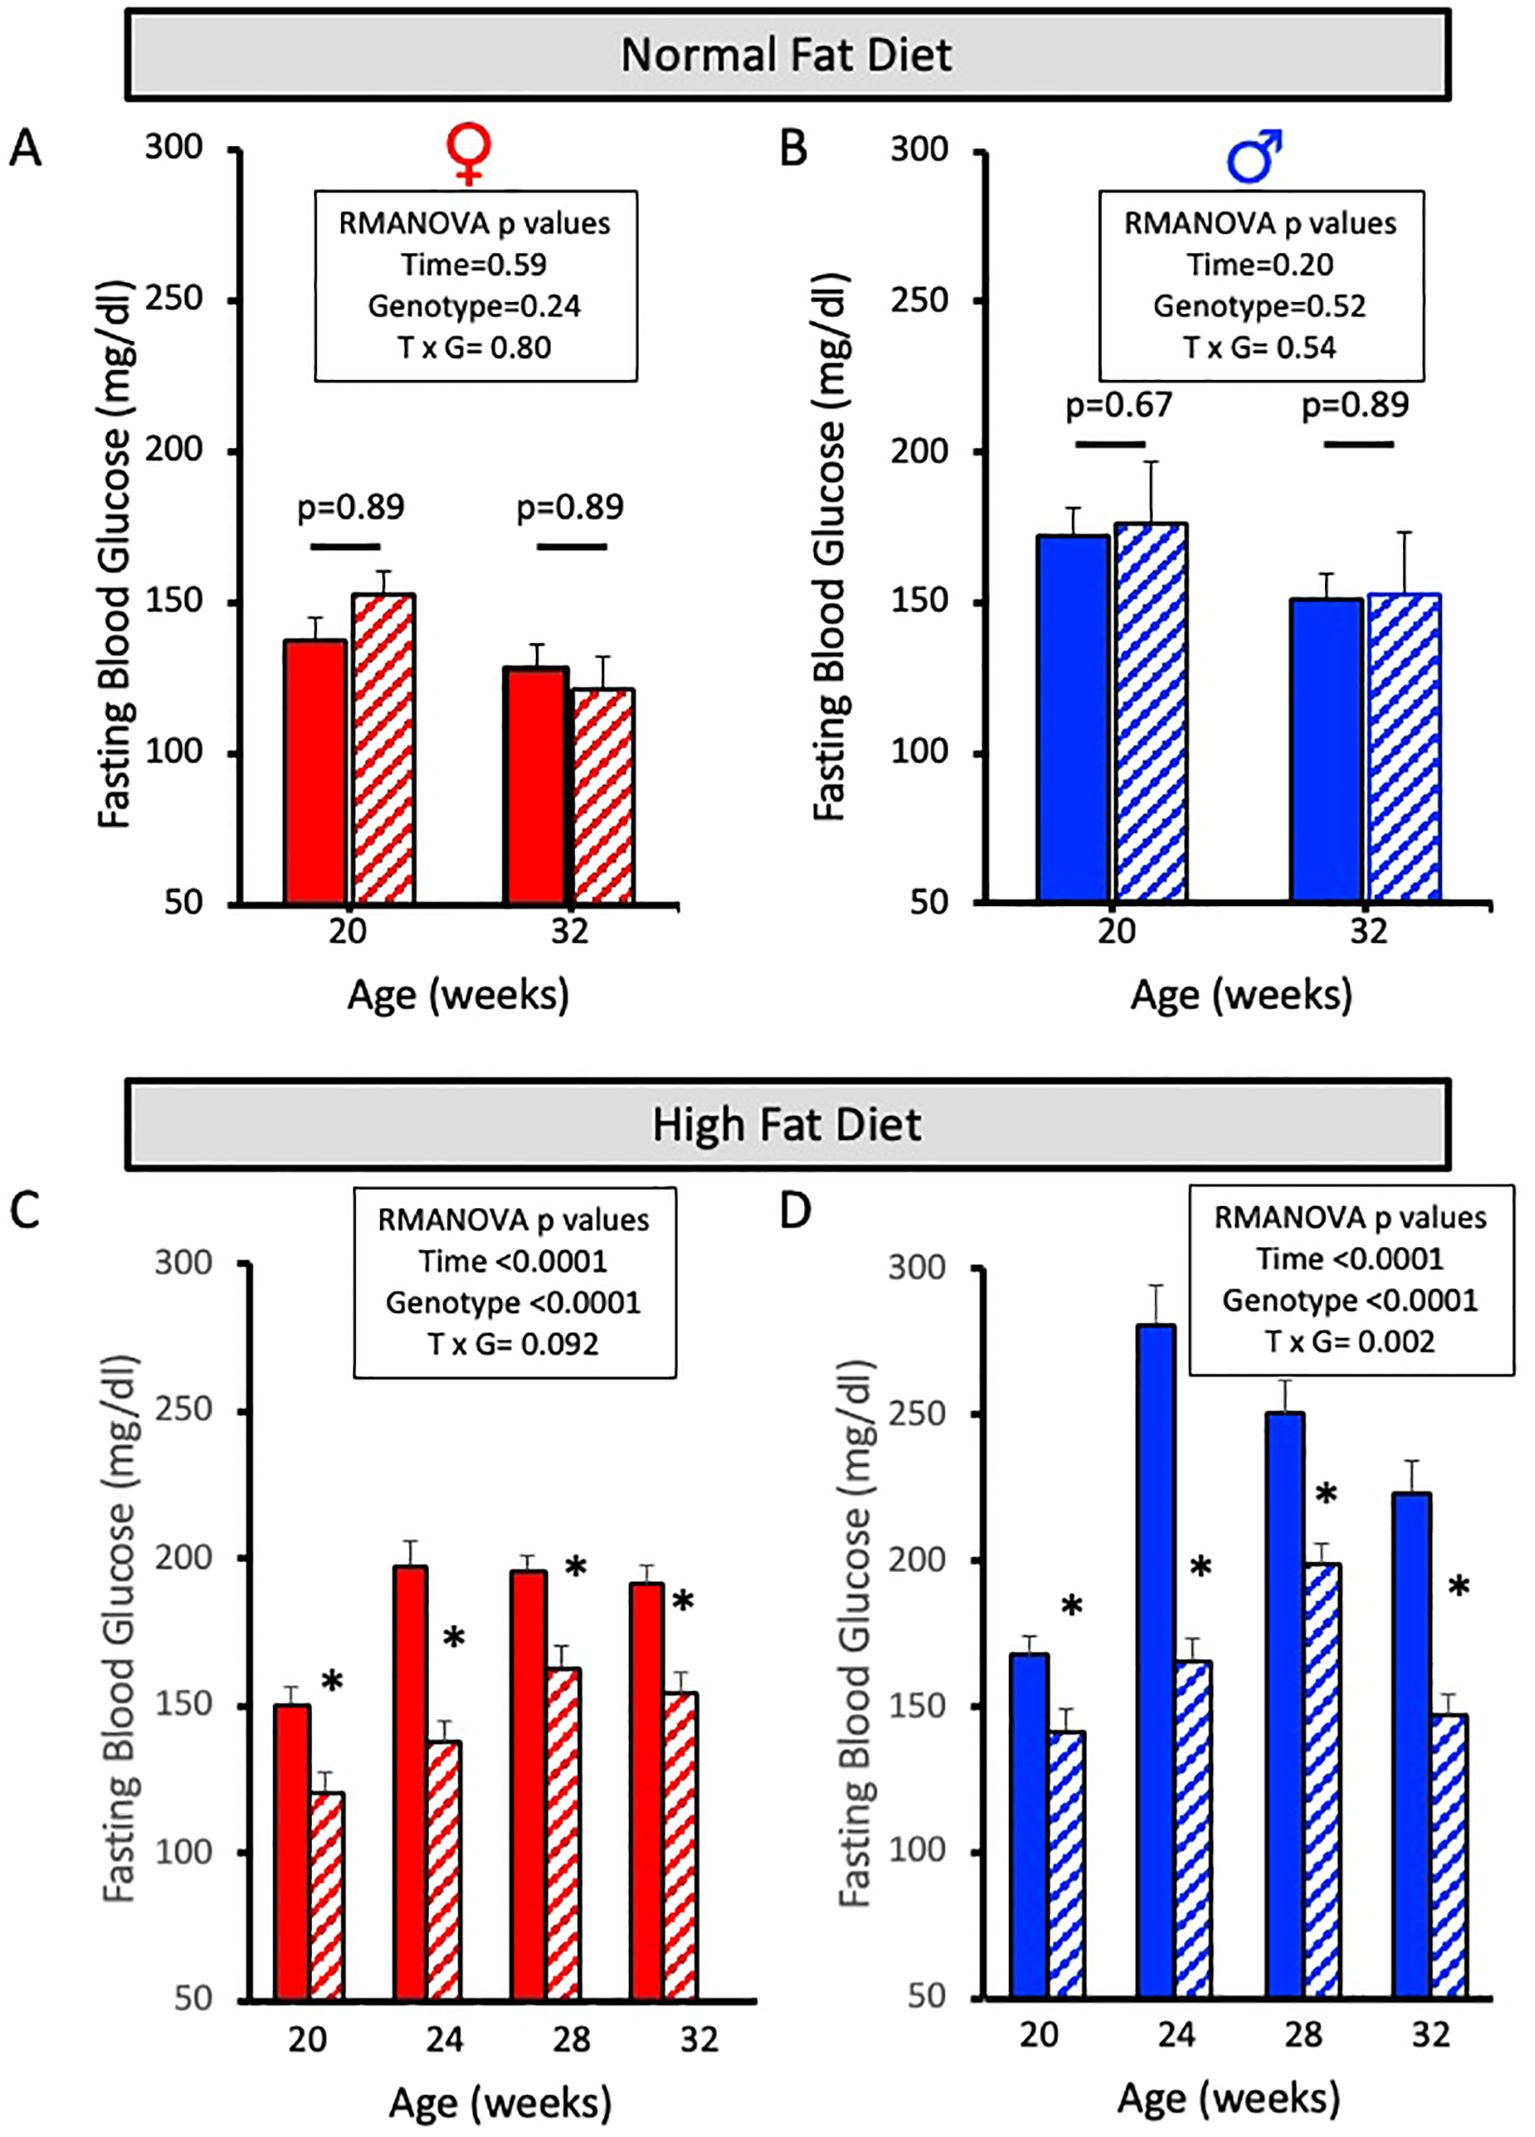
Figure 3. Fasting blood glucose is lower in female and male ASIC2-/-/βENaCm/m mice fed a high-fat diet (HFD) for 12 weeks. (A, B) Fasting blood glucose in normal-fat diet (NFD) female and male ASIC2-/-/βENaCm/m and wild-type (WT) mice at 20 and 32 weeks of age. (C, D) Fasting blood glucose in HFD female and male ASIC2-/-/βENaCm/m and WT mice at 20 and 32 weeks of age. Red columns represent female individuals; blue columns represent male individuals. Solid columns represent the WT group, and hatched columns represent the ASIC2-/-/βENaCm/m group. Data in all panels were analyzed using repeated-measures ANOVA (p-values shown on the graph), followed by Holm’s Sidak post hoc test. Post hoc P-values shown in A/B. The asterisk denotes being significantly different than WT at a given time point at p <0.05.
Glucose tolerance tests were performed after a 12-week HFD. Changes in plasma glucose were measured at 0, 15, 30, 45, 60, and 90 min post-glucose bolus using retro-orbital eye bleed samples. Male ASIC2-/-/βENaCm/m and WT mice exhibited similar increases in blood glucose response time course, while ASIC2-/-/βENaCm/m female mice showed a rapid decline in plasma glucose compared to WT mice (Figure 4A). The areas under the curve for male ASIC2-/-/βENaCm/m trended lower, and the WT mice were not significantly different. The female ASIC2-/-/βENaCm/m mice had a significantly reduced area under the curve compared to WT animals (Figure 4B).
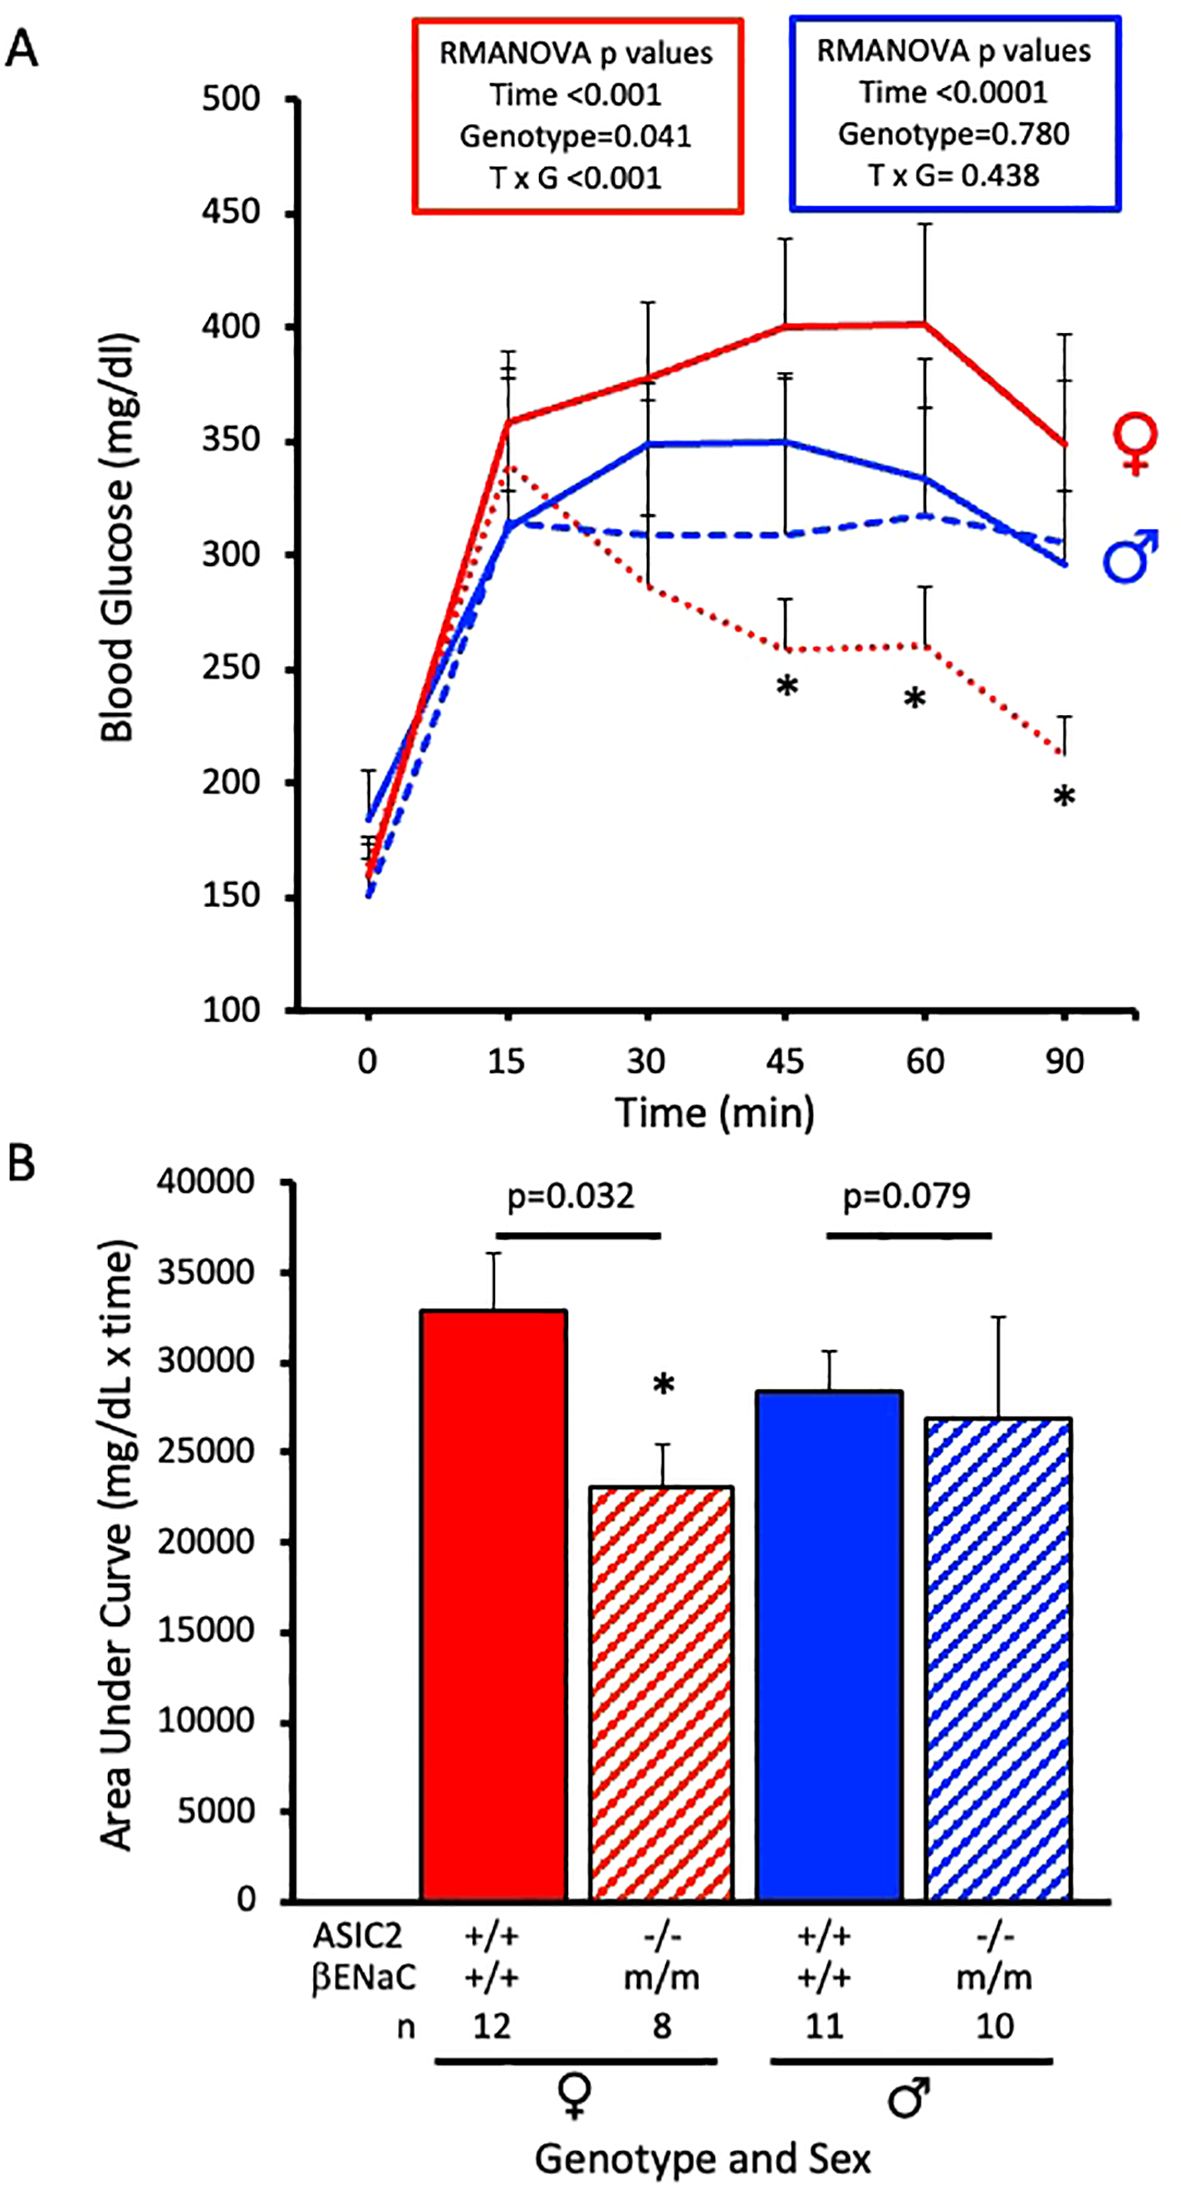
Figure 4. Glucose tolerance is improved in ASIC2-/-/βENaCm/m female mice fed a high-fat diet (HFD) for 20 weeks. (A) Changes in plasma glucose following a bolus IP injection of glucose in female and male ASIC2-/-/βENaCm/m and wild-type (WT) mice. The data in (A) were analyzed using repeated-measures analysis of variance for each sex (p-values shown on the graph), followed by Holm’s Sidak post hoc test. The asterisk denotes being significantly different from WT at a respective time point, p < 0.05. (B) Area under the curve for HFD female and male ASIC2-/-/βENaCm/m and WT mice. Data in (B) were analyzed using two-tailed, independent t-tests with p-values shown on the graph. Red lines/columns represent female individuals; blue lines/columns represent male individuals. Solid lines/columns represent the WT group; dashed lines/hatched columns represent the ASIC2-/-/βENaCm/m group.
Next, we wanted to examine circulating hormones that play a role in glucose homeostasis. Plasma insulin and leptin levels were determined by ELISA using samples collected at diet initiation day, 8 weeks on diet, and 12 weeks on diet. Male and female WT mice exhibit expected HFD-induced increases in plasma insulin and leptin (Figures 5A, B, solid lines). Male and female ASIC2-/-/βENaCm/m mice show reduced circulating insulin and leptin at 12 weeks on HFD (Figures 5A, B, dotted lines). Notably, plasma insulin was stable in female ASIC2-/-/βENaCm/m mice throughout the study.
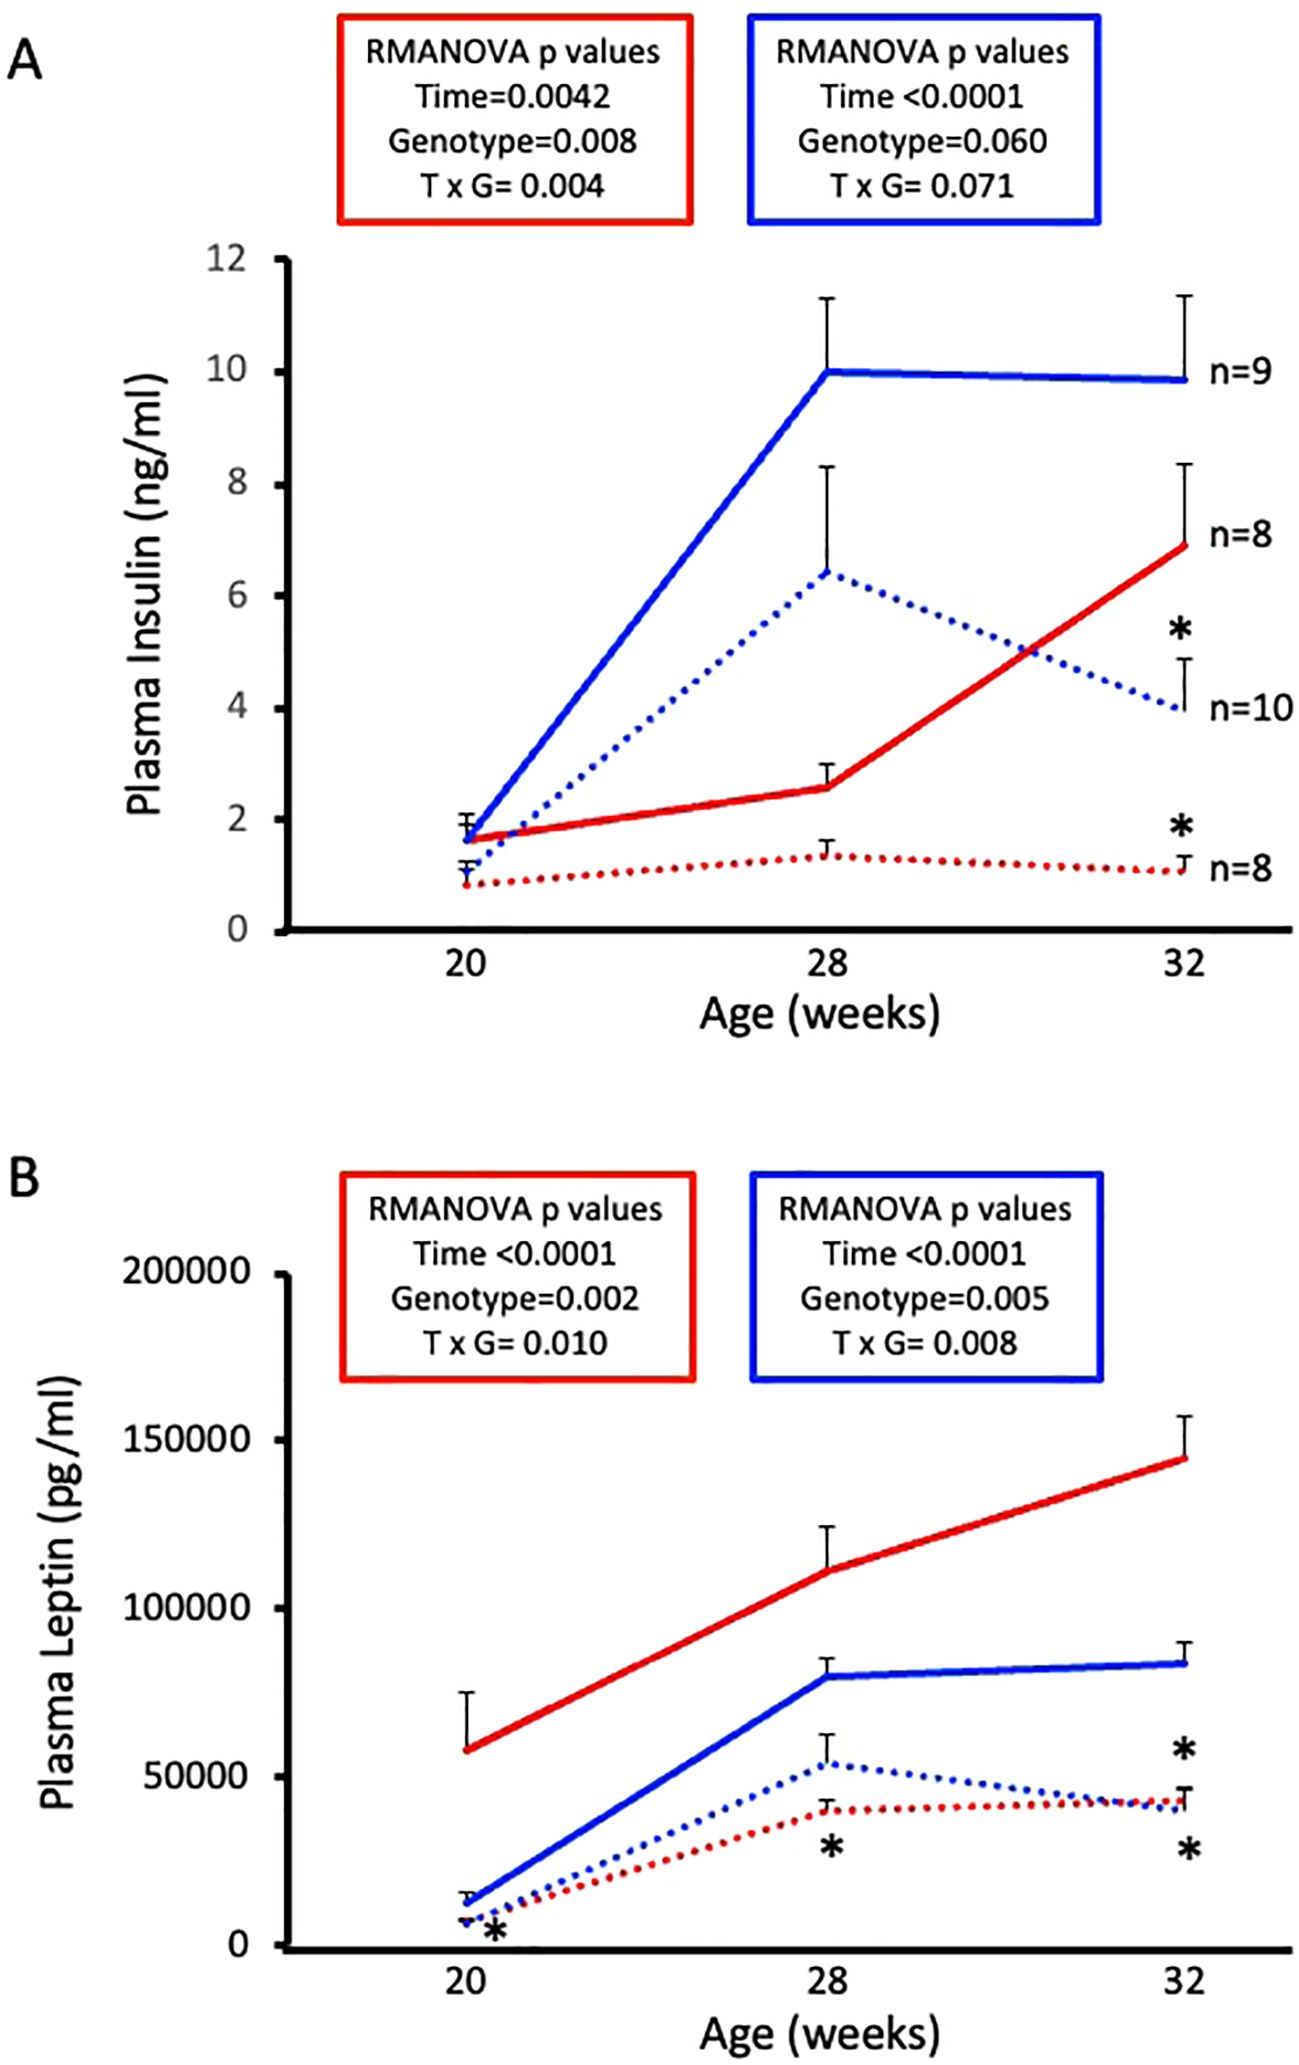
Figure 5. High-fat diet (HFD)-induced increases in plasma insulin and leptin are attenuated in female and male ASIC2-/-/βENaCm/m mice. (A) Plasma insulin of HFD female and male ASIC2-/-/βENaCm/m and wild-type (WT) mice. (B) Plasma leptin of HFD female and male ASIC2-/-/βENaCm/m and WT mice. Data were analyzed using repeated-measures analysis of variance followed by Holm’s Sidak post hoc test. P-values for main and interacting effects of time and genotype are provided on the graphs. The asterisk denotes being significantly different from WT control at a respective time point. Red lines represent female individuals; blue lines represent male individuals. Solid lines represent the WT group; dashed lines represent the ASIC2-/-/βENaCm/m group.
Anthropomorphic measurements were performed before (20 weeks old) and after (32 weeks old) 12 weeks on HFD (Table 1). Female and male ASIC2-/-/βENaCm/m and WT mice fed a NFD for 12 weeks have no significant differences in body mass, body length, or tibial length. However, ASIC2-/-/βENaCm/m mice fed a HFD had lower body masses, body length (female mice only), and tibial length. Select differences in organ masses were also noted in ASIC2-/-/βENaCm/m animals—for example, in both female and male ASIC2-/-/βENaCm/m mice fed a NFD, the heart, kidney, liver, pelvic fat, and visceral fat mass metrics are similar, with a few sporadic exceptions, with normalization. In contrast, ASIC2-/-/βENaCm/m mice fed a HFD have significantly reduced liver mass, intra-abdominal fat, and visceral fat masses following 12 weeks of HFD compared to WT. Interestingly, normalized heart mass is also lower in female ASIC2-/-/βENaCm/m mice after HFD compared to WT controls. Similar to our current investigation, we previously found normalized heart mass in 13-week-old, NFD-fed male ASIC2-/-/βENaCm/m mice, which was identical to control animals despite an 8-mmHg increase in mean arterial blood pressure (25). We did not measure blood pressure in the current investigation.
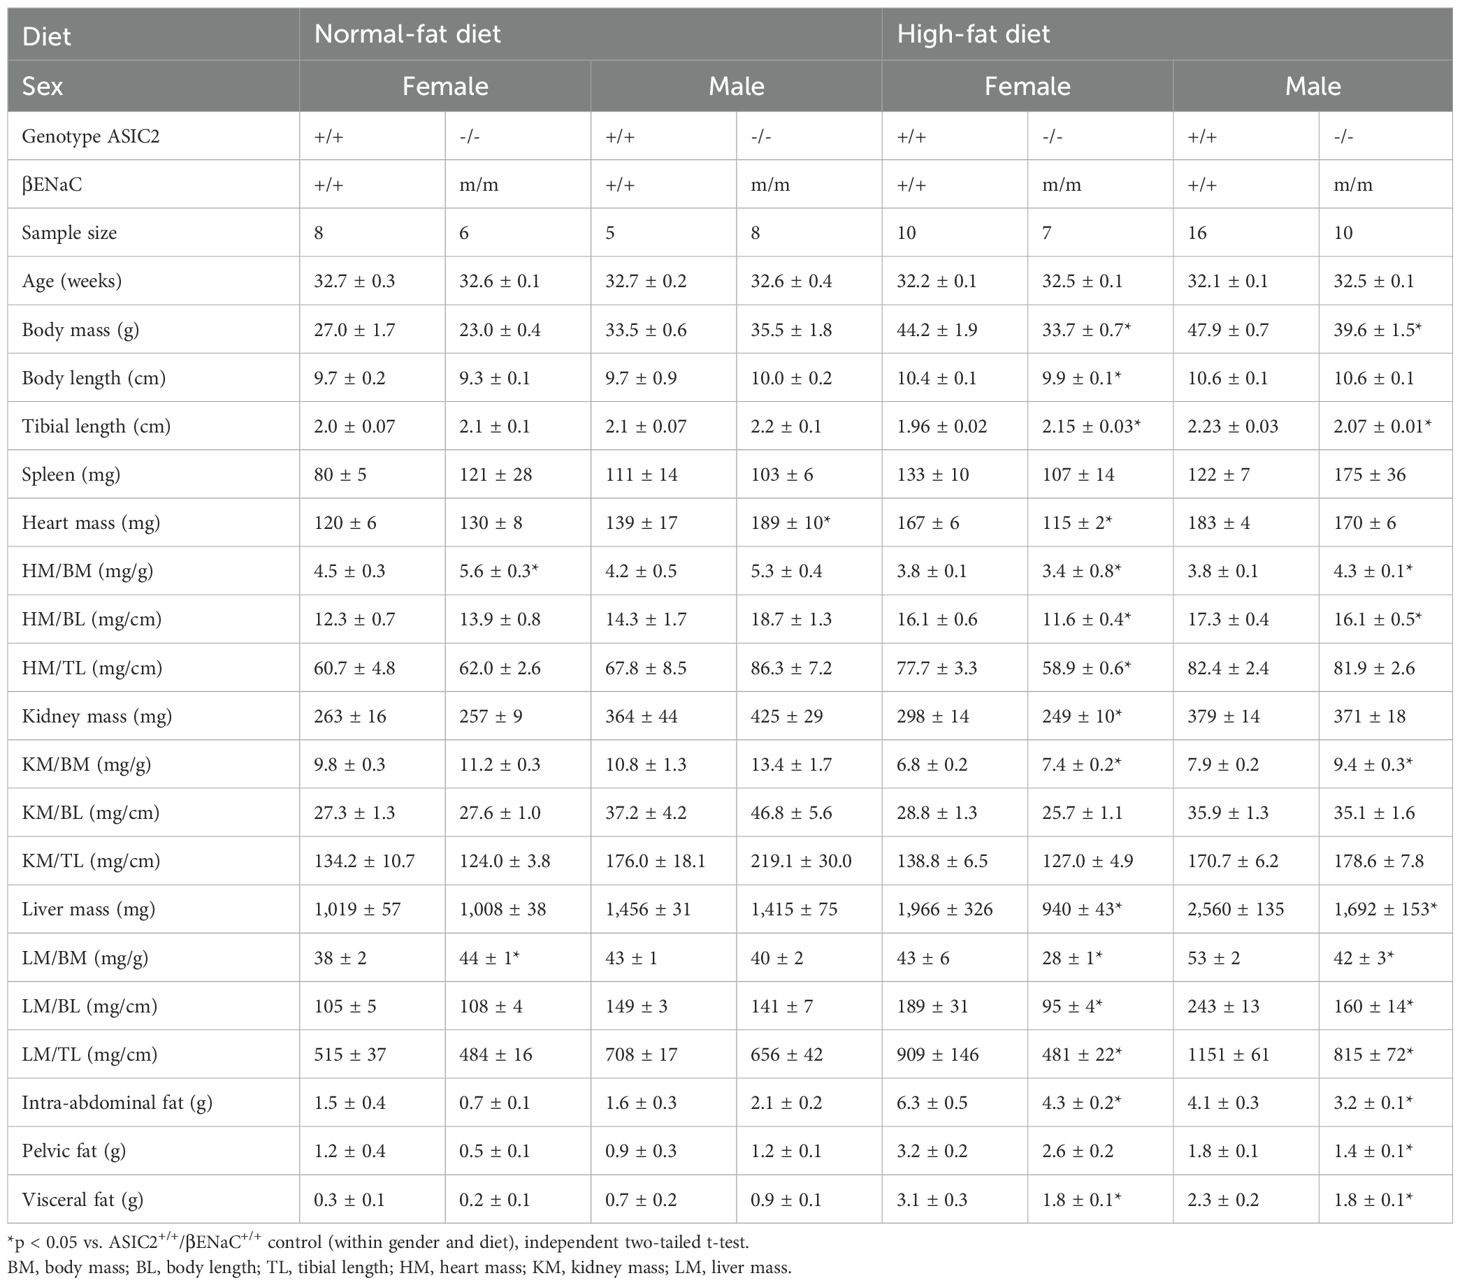
Table 1. Morphometrics of ASIC2+/+/βENaC+/+ and ASIC2-/-/βENaCm/m mice before (20 weeks old) and after (32 weeks old) a 12-week high-fat diet.
To examine fat accumulation in the liver, we examined liver weight and liver fat and lean masses using ECHO MRI and Oil Red O staining of liver tissue. Liver mass, liver lean mass, and liver fat mass were identical in ASIC2-/-/βENaCm/m and WT mice fed a NFD (Figures 6A–C). In contrast, male and female ASIC2-/-/βENaCm/m mice on HFD had a lower liver mass (Figure 6D) as well as lower absolute lean and fat masses (Figure 6E) and percent liver fat (Figure 6F) compared to their WT counterparts (Figures 6D–F). As a secondary approach to assess liver fat content, we used Oil Red O staining of frozen liver sections. The quantitative group data and representative images in Figures 6G, H show the lower liver fat content in female, but not male, ASIC2-/-/βENaCm/m mice. Representative quantitation revealed a reduced staining percent of image area in female ASIC2-/-/βENaCm/m mice compared to female WT mice (Figures 6G, H). Our model uses lard as the primary source of fat in the HFD. Lard is a common source of animal fat and is widely used in animal studies for this reason (42–45).
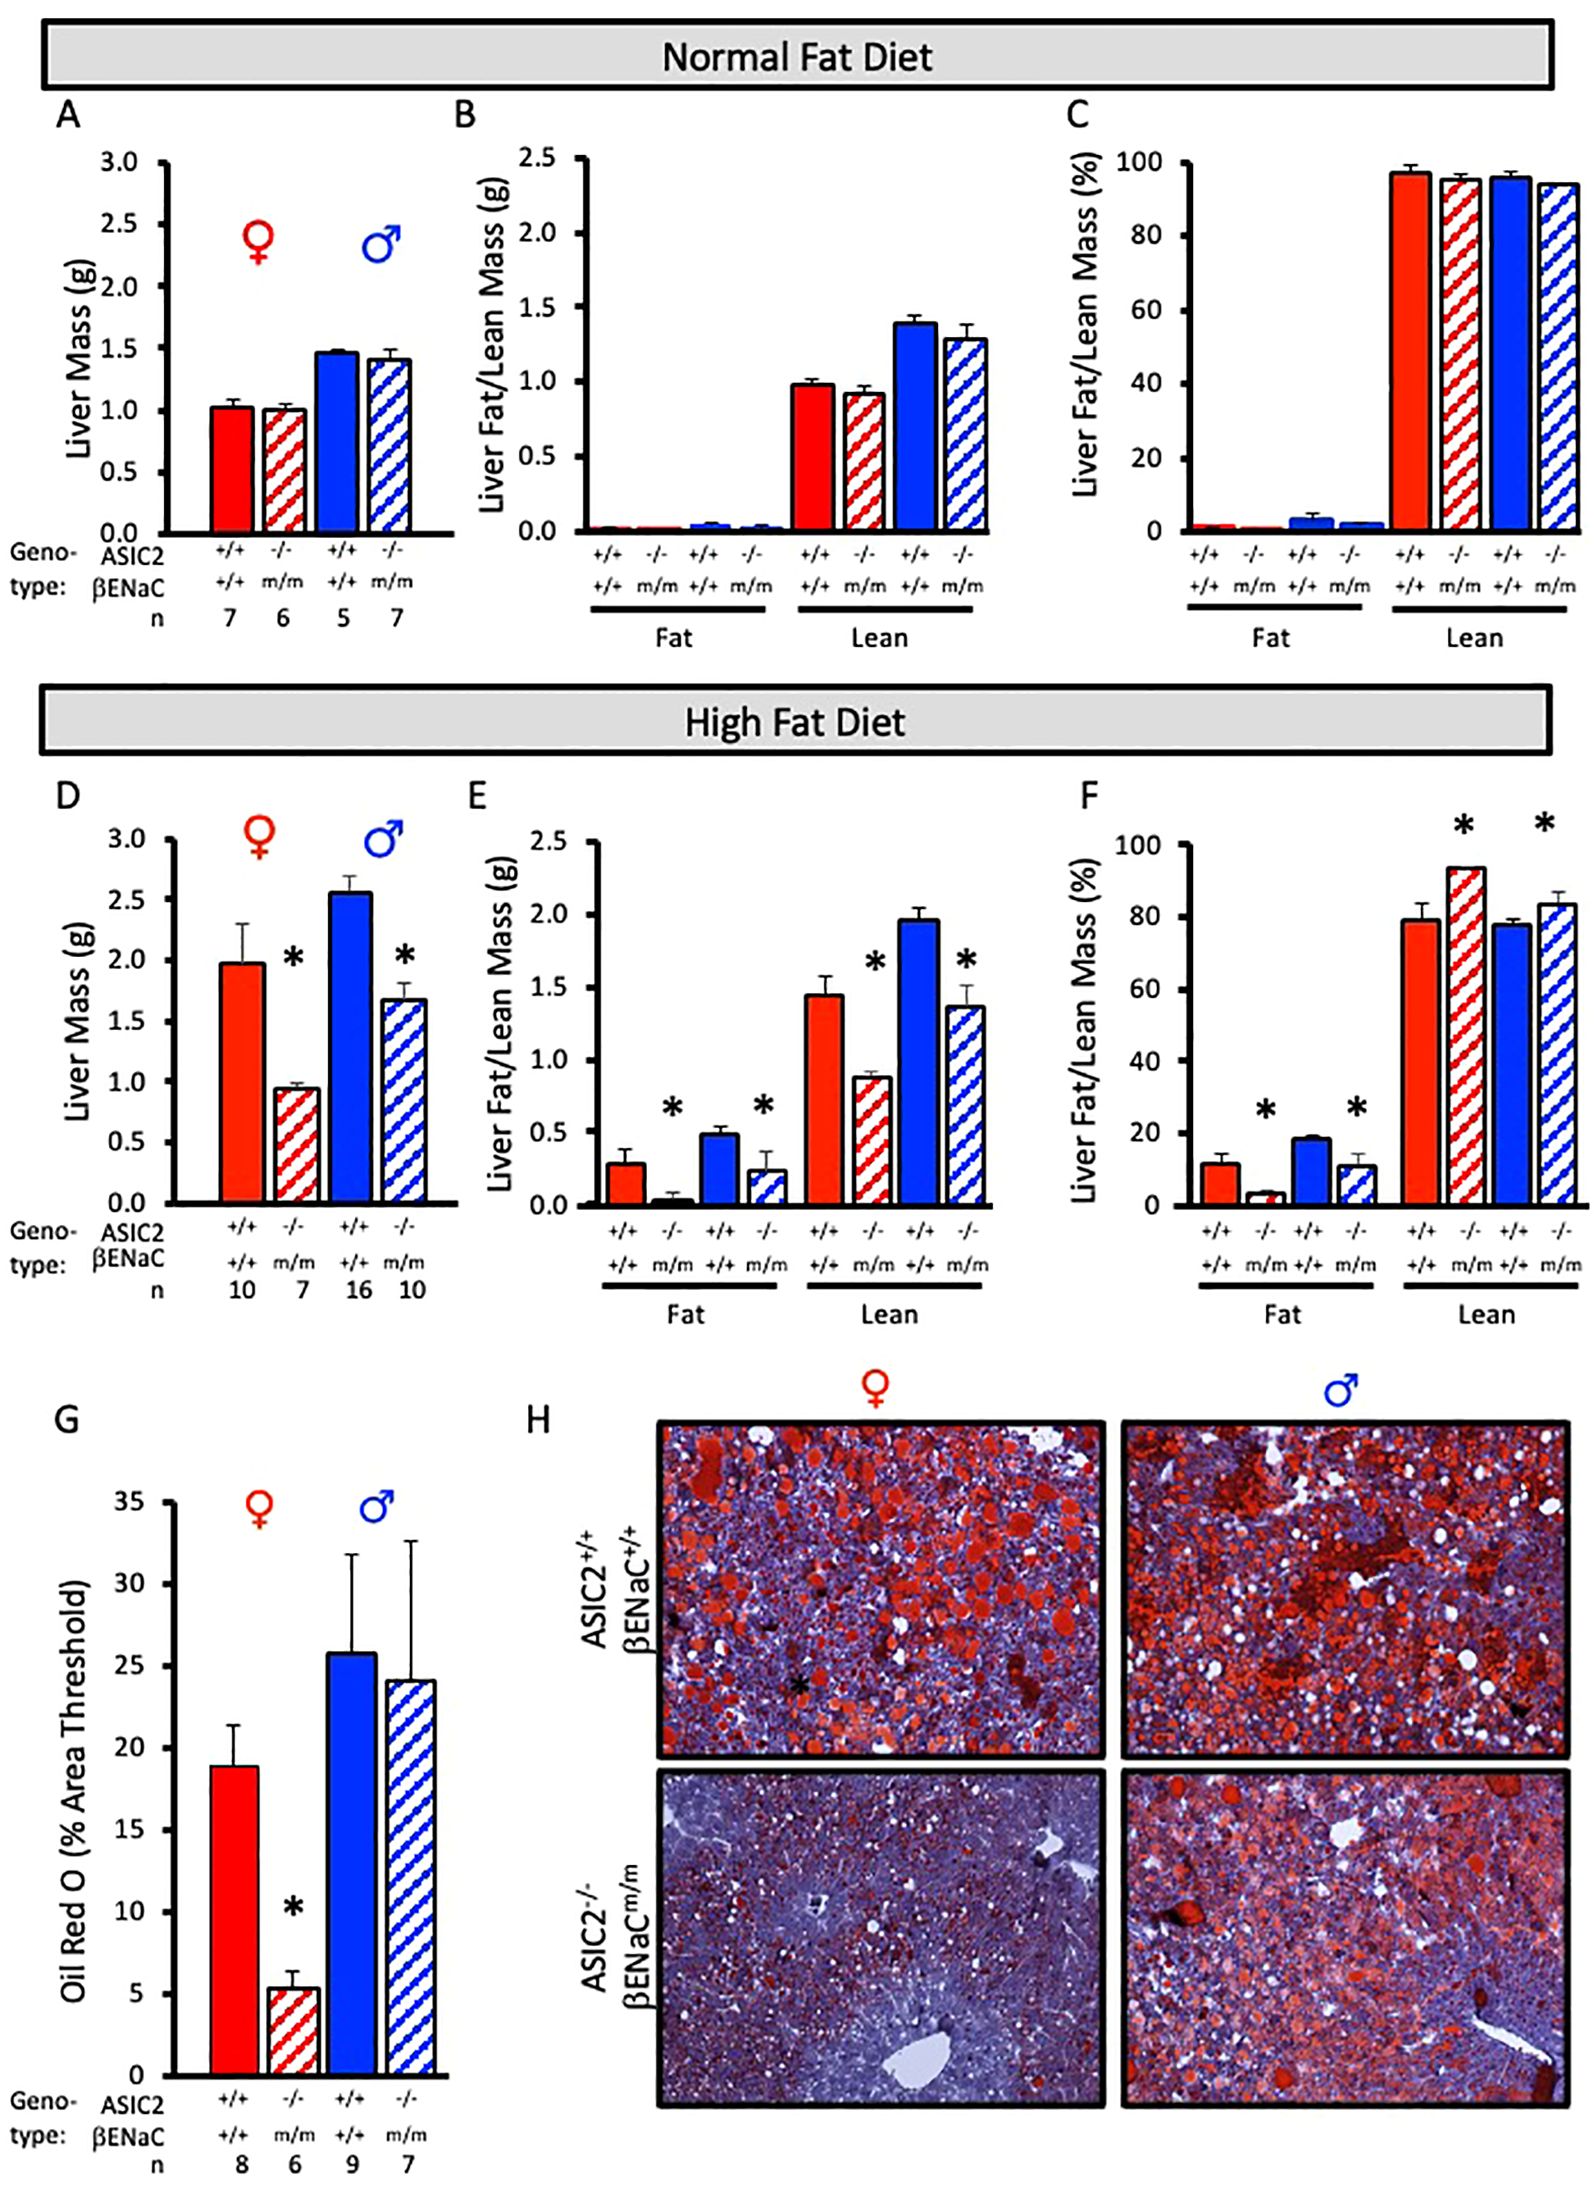
Figure 6. Liver mass and fat mass are reduced in ASIC2-/-/βENaCm/m fed a high-fat diet (HFD) for 20 weeks. (A-C) Total liver, liver lean, and liver fat masses in normal-fat diet (NFD) ASIC2-/-/βENaCm/m and wild-type (WT) mice. (D–F) Total liver, liver lean, and liver fat masses in HFD ASIC2-/-/βENaCm/m vs. WT mice. (G) Group data showing quantitative Oil Red O staining as percent of image area. (H) Representative images of Oil Red O staining in WT (top row) vs. ASIC2-/-/βENaCm/m (bottom row) NFD mice. Female individuals (left column) and male individuals (right column). All data were analyzed using a two-tailed, independent t-test for each sex. The asterisk denotes being significantly different from the WT group, p < 0.05. Solid columns represent the WT group, and hatched columns represent the ASIC2-/-/βENaCm/m group.
We used immunofluorescence to assess macrophage infiltration using F4/80 labeling in frozen liver sections. Fat pockets are easily identifiable as large holes. Numerous macrophages are visible in male and female WT and male, but not female, ASIC2-/-/βENaCm/m mouse sections (Figures 7A, B). An enlarged image of female WT and ASIC2-/-/βENaCm/m samples is shown (Figure 7C). Quantitative immunolabeling indicates a profound reduction in the number of liver macrophages (Figure 7D).
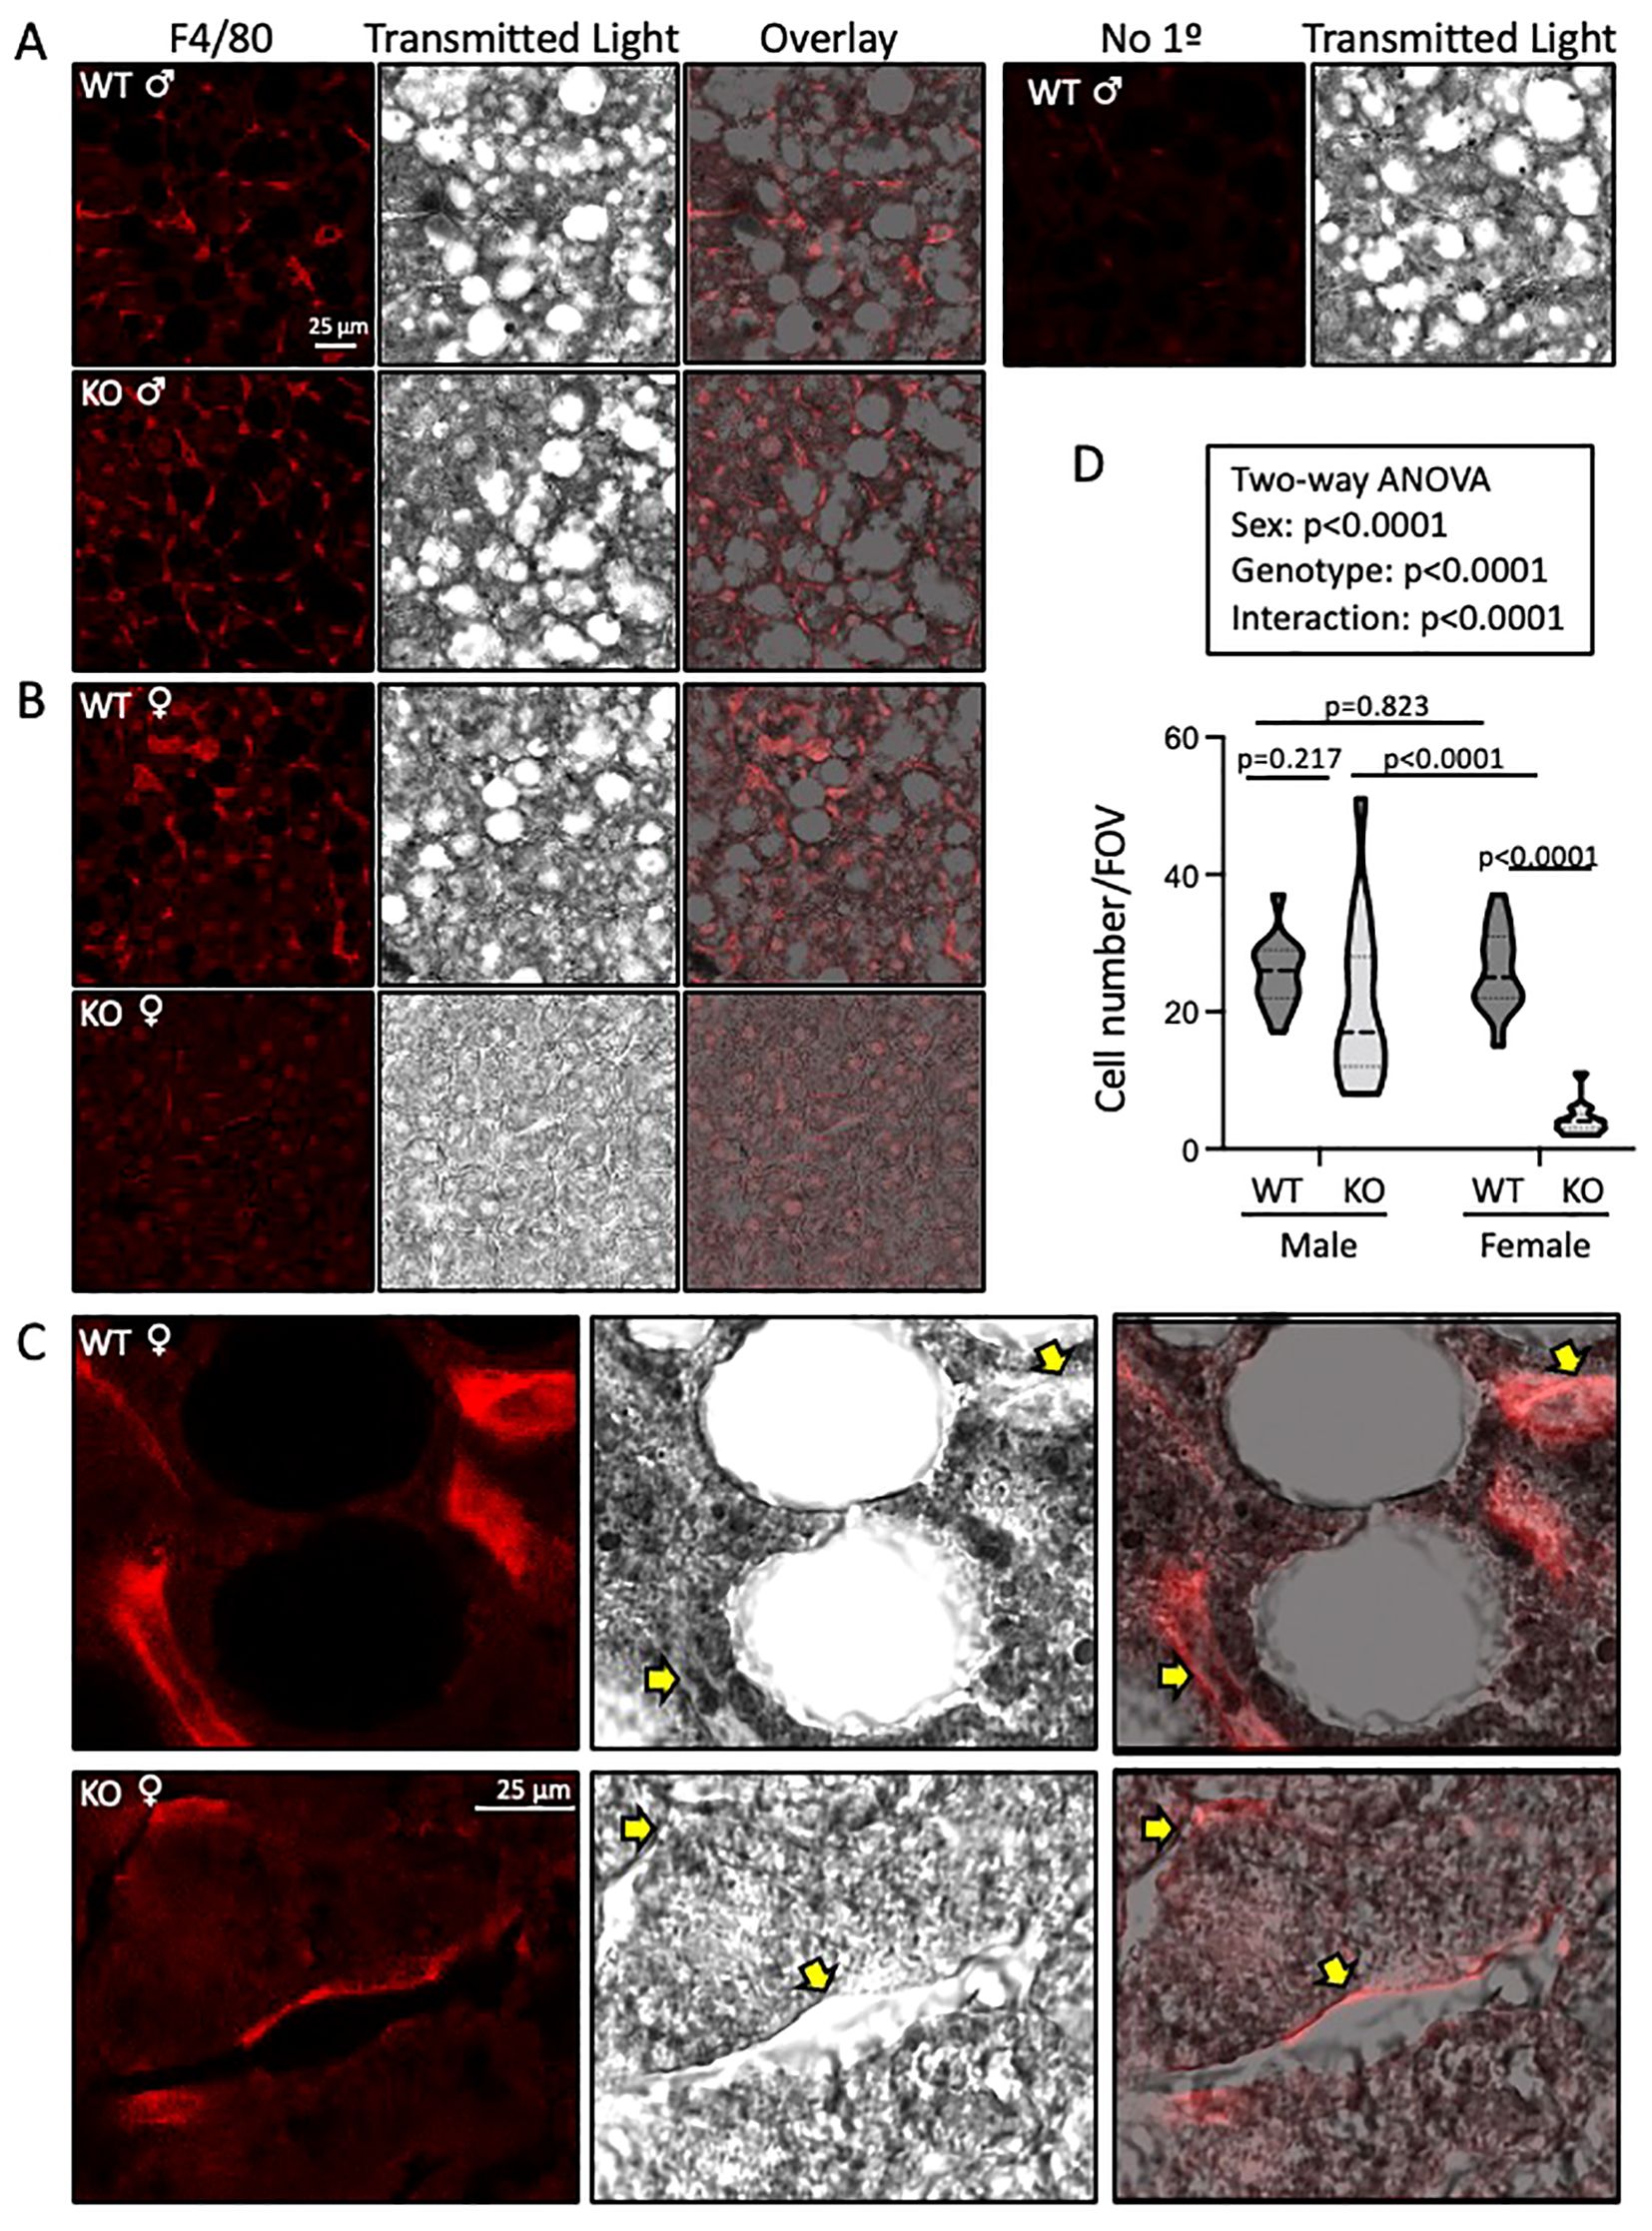
Figure 7. Liver macrophage localization (F4/80 labeling) is reduced in ASIC2-/-/βENaCm/m high-fat diet (HFD) female mice. (A-C) Representative images of F4/80-labeled macrophages (red, left), transmitted light (middle, gray scale), and an overlay (right). (A, B) Images were obtained at ×63. Macrophage number and F4/80 intensity were observed in wild-type (WT; top panels) versus ASIC2-/-/βENaCm/m (bottom panels) liver sections. A negative control sample lacking the F4/80 antibody is shown in the top row, right-hand side. (C) High magnification (×63 objective plus ×3 optical zoom), images of F4/80-labeled cells in WT and ASIC2-/-/βENaCm/m female mice’ livers. (D) The truncated violin plot represents group data showing the number of F4/80-positive cells (15 fields of view at ×63 from one section from two different animals/group). Data, presented as median and quartiles, were analyzed using two-way analysis of variance, followed by Holm’s Sidak post hoc test. P-values are provided on graph.
We measured plasma triglycerides, cholesterol, LDL cholesterol, and HDL cholesterol and their metabolites before (20 weeks of age) and after (32 weeks of age) HFD. The effect of HFD on the main lipid components in ASIC2-/-/βENaCm/m are shown in Figure 8. Baseline measurements at 20 weeks indicate that plasma triglyceride, cholesterol, and LDL- and HDL-cholesterol levels are identical between WT and ASIC2-/-/βENaCm/m mice (Figures 8A, B). In contrast, ASIC2-/-/βENaCm/m mice were protected from the 12-week HFD-induced increases in total cholesterol, LDL cholesterol, and HDL cholesterol (Figures 8A, B).
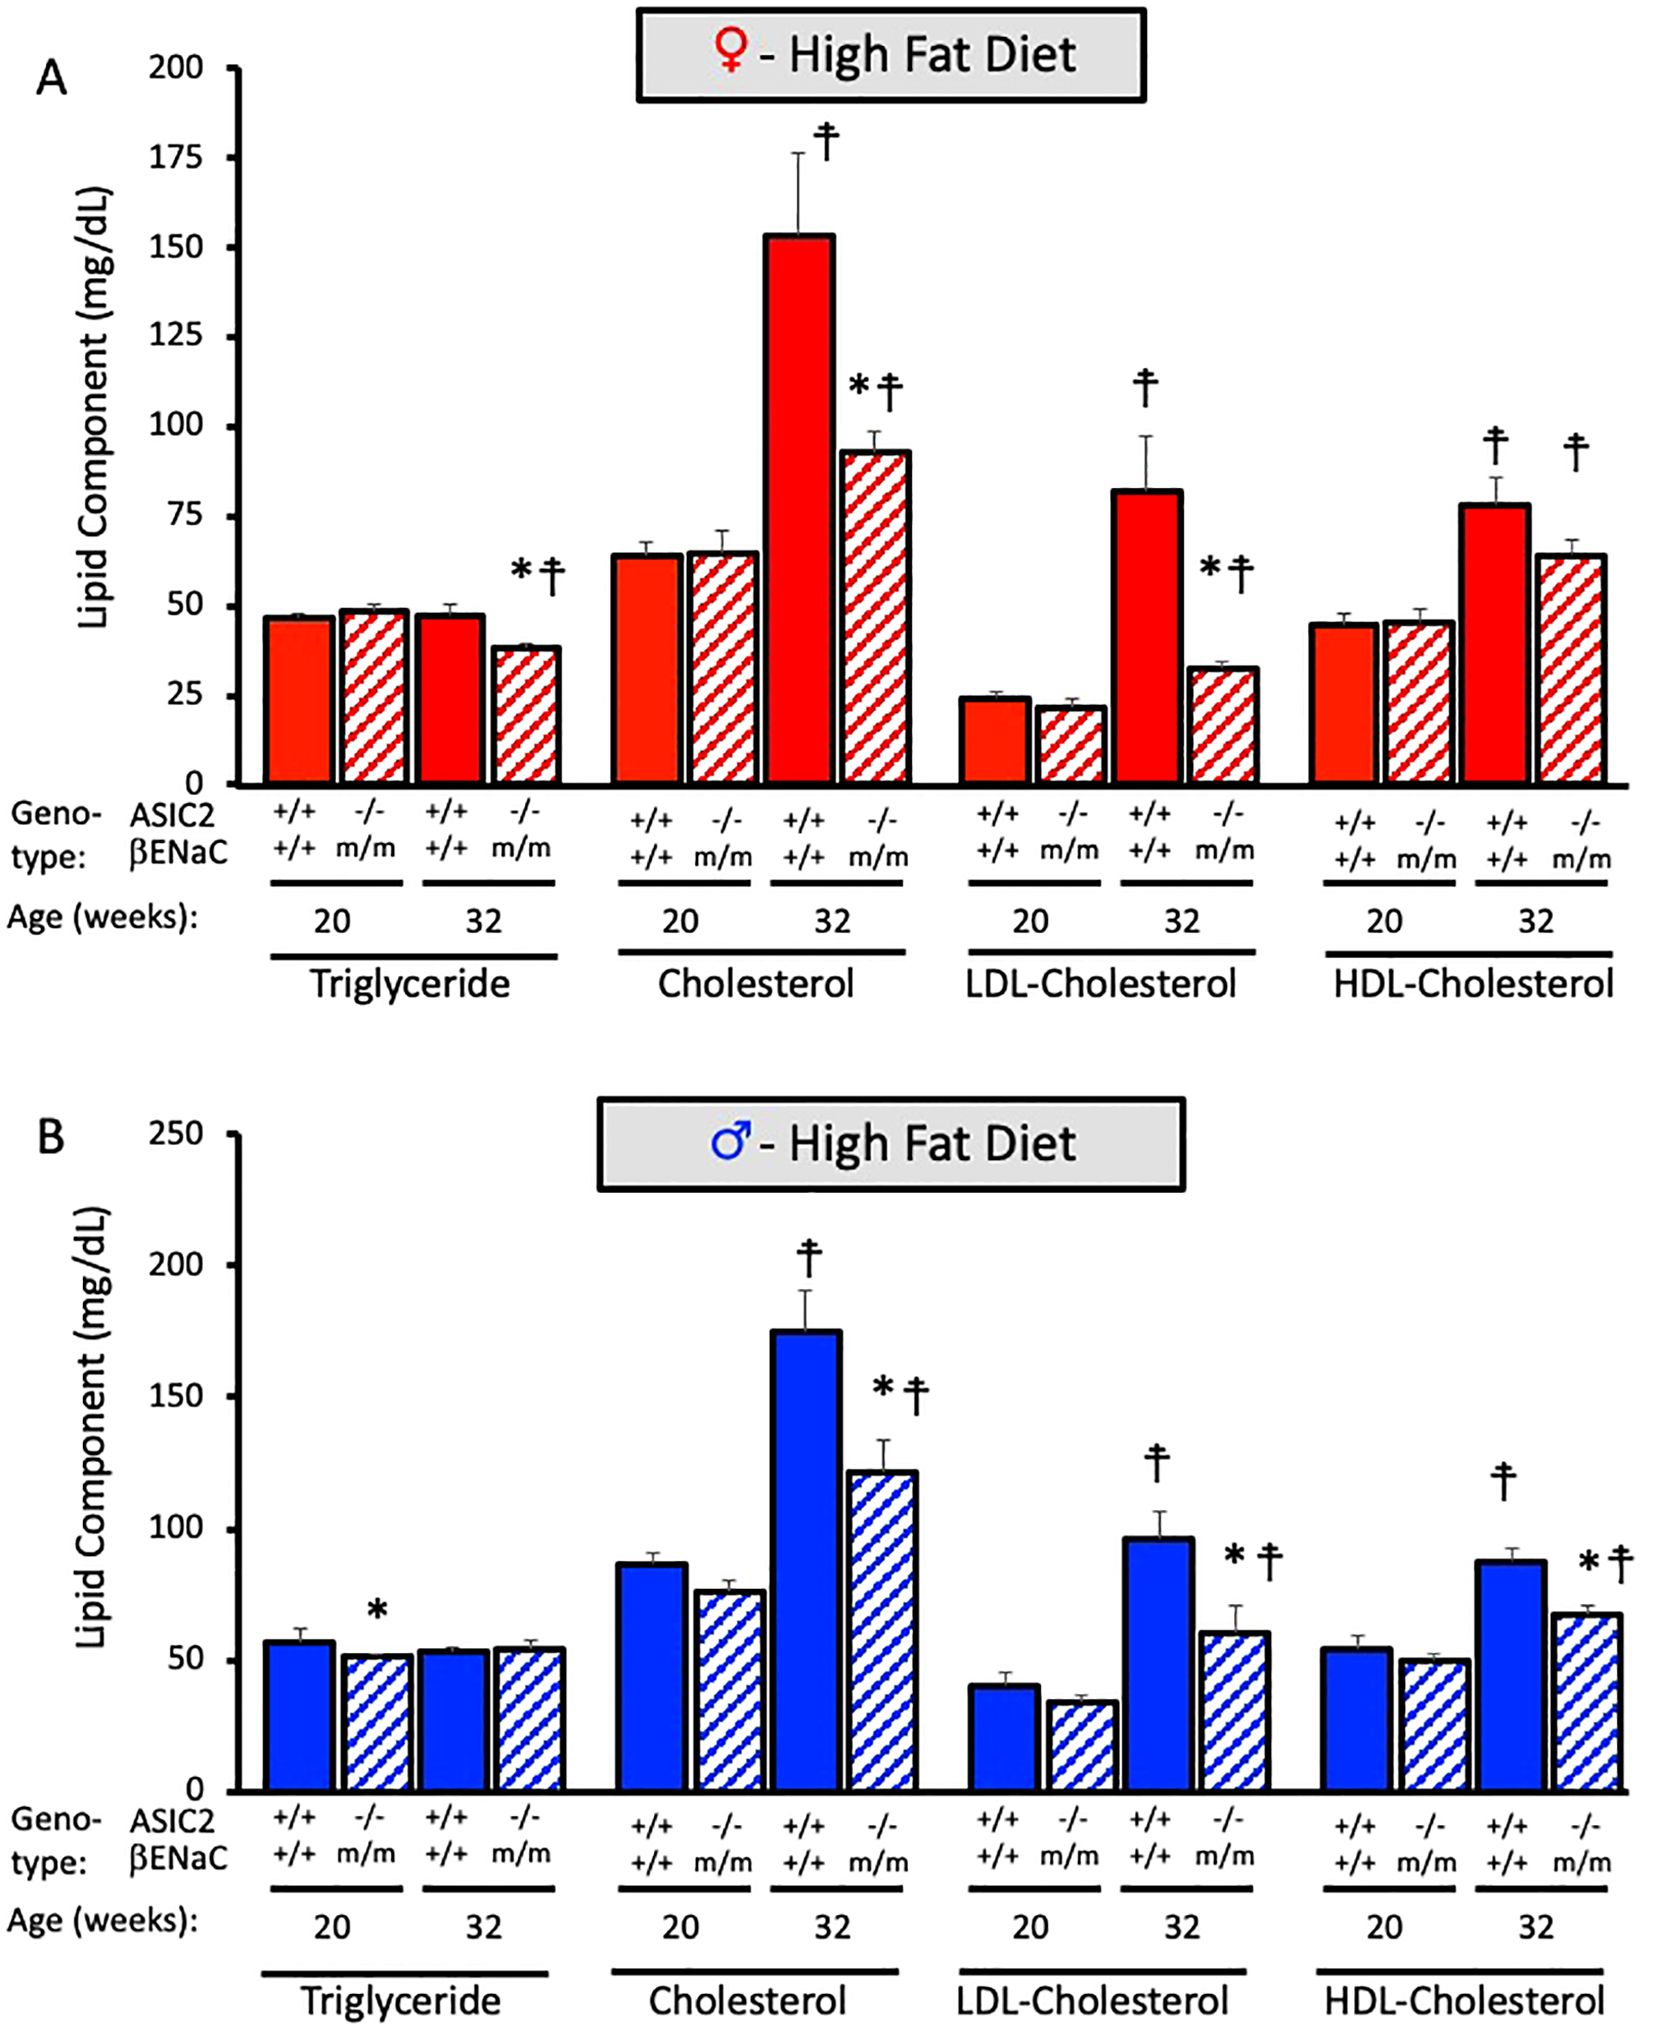
Figure 8. Plasma lipid profile is improved in ASIC2-/-/βENaCm/m fed a high-fat diet (HFD) for 20 weeks. (A) Triglyceride, cholesterol, LDL, and HDL cholesterols are in HFD female ASIC2-/-/βENaCm/m and wild-type (WT) mice. (B) Triglyceride, cholesterol, LDL, and HDL cholesterols are in HFD male ASIC2-/-/βENaCm/m and WT mice. Red columns represent female individuals; blue columns represent male individuals. Solid columns represent the WT group, and hatched columns represent the ASIC2-/-/βENaCm/m group. Statistical analysis included dependent, two-tailed t-tests with the Bonferroni correction. Sample sizes n = 8–9. The asterisk denotes being significantly different from WT control at a respective age, p < 0.025. Modified cross denote being significantly different within genotype at 20 weeks, < 0.025.
Obesity prevalence is continuing to rise globally, and with this comes a need to understand the pathophysiological mechanisms of obesity-related metabolic disease. Genetically modified mouse models have been used for decades to better understand metabolic disease progression. Degenerin proteins are expressed in multiple cell types involved in the pathology of metabolic syndrome, including but not limited to hypothalamic neurons, peripheral neurons, renal and colon epithelia, and endothelial, smooth muscle, and immune cells (4–11, 21, 30, 41, 46–48). In these cell types, degenerins contribute to the neural regulation of autonomic nerve activity, extracellular fluid homeostasis, and blood pressure control (6, 23, 36, 37). To determine if degenerins play an important role in cardiovascular function, we questioned whether mice lacking ASIC2-/-/βENaCm/m might have an exaggerated phenotypic response to a high-fat diet. We chose this model for our inaugural study because ASIC2 and βENaC are expressed in many of the cell types listed above and participate in the regulation of blood pressure. Additionally, we rationalized that using a model lacking more than one could exacerbate any phenotype from the loss of the important protein family. Our study provides a novel, yet unexpected, finding: loss of ASIC2 and βENaC leads to remarkable protection against HFD-induced weight gain, intrabdominal fat accumulation, hepatic steatosis, insulin resistance, and plasma lipid profile changes.
Interestingly, we found that loss of ASIC2/βENaC afforded greater protection in female mice. ASIC2-/-/βENaCm/m female mice have better glucose tolerance test performance, almost no increase in plasma insulin levels, and minimal fat and macrophage accumulation in the liver in response to chronic HFD. Our findings are consistent with the role of estrogen acting as a preventative factor against metabolic syndrome in our control animals (49, 50). However, whether estrogen enhances the protective response in our ASIC2-/-/βENaCm/m mice is unclear.
The most impressive finding in the present study is reduced fat storage in the livers of ASIC2-/-/βENaCm/m mice. ECHO MRI assessment indicates 50%–90% less fat content in male and female mice, respectively. The results of the Oil Red O staining demonstrate almost no hepatic lipid accumulation in female ASIC2-/-/βENaCm/m mice after 12 weeks of HFD, while significant lipid accumulation is present in the livers of WT female mice. In male mice, the area of Oil Red O staining is similar in male WT and ASIC2-/-/βENaCm/m mice; however, the intensity of Oil R O staining is reduced in male ASIC2-/-/βENaCm/m mice compared to WT mice (Figure 6H, lower right panel) consistent with a lower fat content.
There are several potential mechanisms which could account for this dramatic decrease in hepatic lipid accumulation observed in ASIC2-/-/βENaCm/m female and male mice, including increases in hepatic fatty acid oxidation and decreases in hepatic fatty acid uptake. It is possible that alterations in fat absorption from the gastrointestinal system could result in lower levels of hepatic lipid accumulation as well as lower plasma levels of triglycerides and cholesterol. Dietary fat is absorbed through the small intestine and then passes through the liver where it is stored and/or metabolized. While βENaC and ASIC2 messages are not abundantly expressed in healthy human small colon or liver tissue under normal conditions (34, 35), there are several lines of evidence that show that inflammatory pathology may alter the expression of ASIC molecules. First, ASIC expression in certain cells is upregulated by inflammation, which HFDs evoke (17, 46, 48, 51, 52). Second, at least ASIC1a transcript and protein are expressed in rat liver and cultured primary hepatic stellate cells and contribute to the activation of hepatic stellate cells (39, 53). Third, ASIC2 is undetectable in normal hepatocytes but is expressed in a population of injured liver hepatocytes and hepatic stellate cells (34). Hepatic stellate cells are critical mediators of HFD-induced liver fibrosis and injury (38). The importance of ASIC2 in hepatic cell activation has not been addressed and may represent a potential mechanism contributing to HFD-induced liver inflammation. ASIC2 is also expressed in some macrophages and dendritic cell preparations and may contribute to the hepatic inflammatory response (8, 10). Previous studies have shown that loss of peroxisome proliferator-activated receptor alpha (PPARα) in the liver results in inflammation and hyperlipidemia in response to HFD (44, 45), and PPARα agonists are approved for the treatment of dyslipidemia (54). It is possible that PPARα may inhibit the activity of a degenerin channel, possibly ASIC2 or a hybrid ENaC–ASIC channel, that has yet to be identified in hepatic cells, and disruption of this regulatory system in the liver may be a driver for metabolic syndrome development (55). It is unclear how gastrointestinal ENaC may contribute to the metabolic syndrome phenotype; however, ENaC is regulated by insulin (6, 37) and thus may contribute to intracellular signaling affecting glucose utilization within the gut.
The CNS signaling pathway of feeding–satiety–energy expenditure could also play a role in protecting ASIC2-/-/βENaCm/m mice from HFD-induced metabolic syndrome. ASIC2 is widely expressed in the brain, including the hypothalamus (20, 40, 41). Data available from the HypoMap single cell expression atlas concentrates ASIC2 expression in the ventromedial hypothalamus and arcuate nucleus, two areas important in metabolic homeostasis (18–20). βENaC is weakly expressed in a disperse population of these neurons (20). Within the arcuate nucleus, both POMC and AgRP neurons express ASIC2 (20). POMC neurons promote energy expenditure and suppress the drive for food consumption, while AgRP neurons function in an opposite manner (18, 20). Whether ASIC2 or βENaC contribute to feeding and/or motor activity is unclear. A recent publication suggests that distance traveled, as a measure of motor activity, is unchanged in ASIC2-/- mice (56). The importance of βENaC in motor activity, energy expenditure, and hunger–satiety has not been studied. Future studies will focus on determining the contribution of the single genotypes (ASIC2-/- or βENaCm/m) to the phenotype and will guide our examination of the importance of the central pathways in feeding–satiety–energy expenditure and the small intestine–liver–immune axis.
Our findings indicate that the degenerin proteins ASIC2 and βENaC are involved in the progression of metabolic syndrome. Animals lacking normal levels of ASIC2 and βENaC display reduced HFD-induced body mass gain, fasting blood glucose, plasma insulin and leptin profiles, liver mass and fat content, macrophage localization to the liver, and pathological circulating lipid profile. Additionally, loss of ASIC2 and βENaC confers a greater protection against the development of insulin resistance and hepatic steatosis in female mice as compared to male mice. The specific underlying mechanisms that contribute to this protection are unclear but will be the focus of future studies. It is possible that agents blocking these signaling pathways could be novel candidates for the treatment of metabolic disease in humans.
The data are available via figshare doi: 10.6048/m9.figshare.26042863.
The animal study was approved by University of Mississippi Medical Center IACUC. The study was conducted in accordance with the local legislation and institutional requirements.
MH: Visualization, Writing – review & editing, Writing – original draft. DES: Writing – review & editing, Writing – original draft, Resources, Methodology, Investigation, Conceptualization. EH: Writing – review & editing, Writing – original draft, Formal analysis, Data curation. DFS: Writing – review & editing, Writing – original draft, Resources, Formal analysis, Data curation. HD: Writing – review & editing, Writing – original draft, Visualization, Validation, Supervision, Resources, Project administration, Methodology, Investigation, Funding acquisition, Formal analysis, Data curation, Conceptualization.
The author(s) declare financial support was received for the research, authorship, and/or publication of this article. Research reported in this publication was supported by the NIH P30GM149404, P20GM104357, P20GM121334, which help support the Histology, Imaging, and Analytic and Assay Core Facilities at the University of Mississippi Medical Center used in the completion of this work and R01DK137167 (HD), and R01DK121748 (DES).
The authors declare that the research was conducted in the absence of any commercial or financial relationships that could be construed as a potential conflict of interest.
The author(s) declared that they were an editorial board member of Frontiers, at the time of submission. This had no impact on the peer review process and the final decision.
All claims expressed in this article are solely those of the authors and do not necessarily represent those of their affiliated organizations, or those of the publisher, the editors and the reviewers. Any product that may be evaluated in this article, or claim that may be made by its manufacturer, is not guaranteed or endorsed by the publisher.
1. Swarup S, Ahmed I, Grigorova Y, Zeltser R. Metabolic Syndrome. Treasure Island (FL: StatPearls (2024).
2. Alberti KG, Zimmet P, Shaw J, Group IDFETFC. The metabolic syndrome–a new worldwide definition. Lancet. (2005) 366:1059–62. doi: 10.1016/S0140-6736(05)67402-8
3. Liang X, Or B, Tsoi MF, Cheung CL, Cheung BMY. Prevalence of metabolic syndrome in the United States National Health and Nutrition Examination Survey 2011-18. Postgrad Med J. (2023) 99:985–92. doi: 10.1093/postmj/qgad008
4. Barbaro NR, Foss JD, Kryshtal DO, Tsyba N, Kumaresan S, Xiao L, et al. Dendritic cell amiloride-sensitive channels mediate sodium-induced inflammation and hypertension. Cell Rep. (2017) 21:1009–20. doi: 10.1016/j.celrep.2017.10.002
5. Ertuglu LA, Pitzer Mutchler A, Jamison S, Laffer CL, Elijovich F, Saleem M, et al. Eicosanoid-regulated myeloid ENaC and isolevuglandin formation in human salt-sensitive hypertension. Hypertension. (2024) 81:516–29. doi: 10.1161/HYPERTENSIONAHA.123.21285
6. Kellenberger S, Schild L. Epithelial sodium channel/degenerin family of ion channels: a variety of functions for a shared structure. Physiol Rev. (2002) 82:735–67. doi: 10.1152/physrev.00007.2002
7. Nemeth Z, Hildebrandt E, Parsa N, Fleming AB, Wasson R, Pittman K, et al. Epithelial sodium channels in macrophage migration and polarization: role of proinflammatory cytokines TNFalpha and IFNgamma. Am J Physiol Regul Integr Comp Physiol. (2022) 323:R763–R75. doi: 10.1152/ajpregu.00207.2022
8. Ni L, Fang P, Hu ZL, Zhou HY, Chen JG, Wang F, et al. Identification and function of acid-sensing ion channels in RAW 264. 7 Macrophage Cells Curr Med Sci. (2018) 38:436–42. doi: 10.1007/s11596-018-1897-y
9. Storozhuk M, Cherninskyi A, Maximyuk O, Isaev D, Krishtal O. Acid-sensing ion channels: focus on physiological and some pathological roles in the brain. Curr Neuropharmacol. (2021) 19:1570–89. doi: 10.2174/1570159X19666210125151824
10. Tong J, Wu WN, Kong X, Wu PF, Tian L, Du W, et al. Acid-sensing ion channels contribute to the effect of acidosis on the function of dendritic cells. J Immunol. (2011) 186:3686–92. doi: 10.4049/jimmunol.1001346
11. Zha XM. Acid-sensing ion channels: trafficking and synaptic function. Mol Brain. (2013) 6:1. doi: 10.1186/1756-6606-6-1
12. Akopian AN, Chen CC, Ding Y, Cesare P, Wood JN. A new member of the acid-sensing ion channel family. Neuroreport. (2000) 11:2217–22. doi: 10.1097/00001756-200007140-00031
13. Chen CH, Hsu YT, Chen CC, Huang RC. Acid-sensing ion channels in neurones of the rat suprachiasmatic nucleus. J Physiol. (2009) 587:1727–37. doi: 10.1113/jphysiol.2008.166918
14. Sjostedt E, Zhong W, Fagerberg L, Karlsson M, Mitsios N, Adori C, et al. An atlas of the protein-coding genes in the human, pig, and mouse brain. Science. (2020) 367. doi: 10.1126/science.aay5947
15. Tsang AH, Nuzzaci D, Darwish T, Samudrala H, Blouet C. Nutrient sensing in the nucleus of the solitary tract mediates non-aversive suppression of feeding via inhibition of AgRP neurons. Mol Metab. (2020) 42:101070. doi: 10.1016/j.molmet.2020.101070
16. Wald HS, Chandra A, Kalluri A, Ong ZY, Hayes MR, Grill HJ. NTS and VTA oxytocin reduces food motivation and food seeking. Am J Physiol Regul Integr Comp Physiol. (2020) 319:R673–R83. doi: 10.1152/ajpregu.00201.2020
17. Wei S, Qiu CY, Jin Y, Liu TT, Hu WP. TNF-alpha acutely enhances acid-sensing ion channel currents in rat dorsal root ganglion neurons via a p38 MAPK pathway. J Neuroinflamm. (2021) 18:92. doi: 10.1186/s12974-021-02151-w
18. Belgardt BF, Okamura T, Bruning JC. Hormone and glucose signalling in POMC and AgRP neurons. J Physiol. (2009) 587:5305–14. doi: 10.1113/jphysiol.2009.179192
19. Lavoie O, Michael NJ, Caron A. A critical update on the leptin-melanocortin system. J Neurochem. (2023) 165:467–86. doi: 10.1111/jnc.15765
20. Steuernagel L, Lam BYH, Klemm P, Dowsett GKC, Bauder CA, Tadross JA, et al. HypoMap-a unified single-cell gene expression atlas of the murine hypothalamus. Nat Metab. (2022) 4:1402–19. doi: 10.1038/s42255-022-00657-y
21. Drummond HA. What evolutionary evidence implies about the identity of the mechanoelectrical couplers in vascular smooth muscle cells. Physiol (Bethesda). (2021) 36:292–306. doi: 10.1152/physiol.00008.2021
22. Gannon KP, McKey SE, Stec DE, Drummond HA. Altered myogenic vasoconstriction and regulation of whole kidney blood flow in the ASIC2 knockout mouse. Am J Physiol Renal Physiol. (2015) 308:F339–48. doi: 10.1152/ajprenal.00572.2014
23. Lopez-Ramirez O, Gonzalez-Garrido A. The role of acid sensing ion channels in the cardiovascular function. Front Physiol. (2023) 14:1194948. doi: 10.3389/fphys.2023.1194948
24. Lu Y, Ma X, Sabharwal R, Snitsarev V, Morgan D, Rahmouni K, et al. The ion channel ASIC2 is required for baroreceptor and autonomic control of the circulation. Neuron. (2009) 64:885–97. doi: 10.1016/j.neuron.2009.11.007
25. Lu Y, Stec DE, Liu R, Ryan M, Drummond HA. betaENaC and ASIC2 associate in VSMCs to mediate pressure-induced constriction in the renal afferent arteriole. Am J Physiol Renal Physiol. (2022) 322:F498–511. doi: 10.1152/ajprenal.00003.2022
26. Hanukoglu I, Hanukoglu A. Epithelial sodium channel (ENaC) family: Phylogeny, structure-function, tissue distribution, and associated inherited diseases. Gene. (2016) 579:95–132. doi: 10.1016/j.gene.2015.12.061
27. Drummond HA. betaENaC is a molecular component of a VSMC mechanotransducer that contributes to renal blood flow regulation, protection from renal injury, and hypertension. Front Physiol. (2012) 3:341. doi: 10.3389/fphys.2012.00341
28. Drummond HA, Grifoni SC, Abu-Zaid A, Gousset M, Chiposi R, Barnard JM, et al. Renal inflammation and elevated blood pressure in a mouse model of reduced beta-ENaC. Am J Physiol Renal Physiol. (2011) 301:F443–9. doi: 10.1152/ajprenal.00694.2010
29. Drummond HA, Stec DE. betaENaC acts as a mechanosensor in renal vascular smooth muscle cells that contributes to renal myogenic blood flow regulation, protection from renal injury and hypertension. J Nephrol Res. (2015) 1:1–9. doi: 10.17554/j.issn.2410-0579.2015.01.12
30. Zhang J, Yuan HK, Chen S, Zhang ZR. Detrimental or beneficial: Role of endothelial ENaC in vascular function. J Cell Physiol. (2022) 237:29–48. doi: 10.1002/jcp.30505
31. Mubarik A, Anastasopoulou C, Aeddula NR. Liddle Syndrome (Pseudohyperaldosteronism). Treasure Island (FL: StatPearls (2024).
32. Pradervand S, Barker PM, Wang Q, Ernst SA, Beermann F, Grubb BR, et al. Salt restriction induces pseudohypoaldosteronism type 1 in mice expressing low levels of the beta-subunit of the amiloride-sensitive epithelial sodium channel. Proc Natl Acad Sci U.S.A. (1999) 96:1732–7. doi: 10.1073/pnas.96.4.1732
33. Grifoni SC, Chiposi R, McKey SE, Ryan MJ, Drummond HA. Altered whole kidney blood flow autoregulation in a mouse model of reduced beta-ENaC. Am J Physiol Renal Physiol. (2010) 298:F285–92. doi: 10.1152/ajprenal.00496.2009
34. Andrews TS, Nakib D, Perciani CT, Ma XZ, Liu L, Winter E, et al. Single-cell, single-nucleus, and spatial transcriptomics characterization of the immunological landscape in the healthy and PSC human liver. J Hepatol. (2024) 80:730–43. doi: 10.1016/j.jhep.2023.12.023
35. Burclaff J, Bliton RJ, Breau KA, Ok MT, Gomez-Martinez I, Ranek JS, et al. A proximal-to-distal survey of healthy adult human small intestine and colon epithelium by single-cell transcriptomics. Cell Mol Gastroenterol Hepatol. (2022) 13:1554–89. doi: 10.1016/j.jcmgh.2022.02.007
36. Busst CJ. Blood pressure regulation via the epithelial sodium channel: from gene to kidney and beyond. Clin Exp Pharmacol Physiol. (2013) 40:495–503. doi: 10.1111/1440-1681.12124
37. Chen Y, Yu X, Yan Z, Zhang S, Zhang J, Guo W. Role of epithelial sodium channel-related inflammation in human diseases. Front Immunol. (2023) 14:1178410. doi: 10.3389/fimmu.2023.1178410
38. Hoffmann C, Djerir NEH, Danckaert A, Fernandes J, Roux P, Charrueau C, et al. Hepatic stellate cell hypertrophy is associated with metabolic liver fibrosis. Sci Rep. (2020) 10:3850. doi: 10.1038/s41598-020-60615-0
39. Pan CX, Wu FR, Wang XY, Tang J, Gao WF, Ge JF, et al. Inhibition of ASICs reduces rat hepatic stellate cells activity and liver fibrosis: an in vitro and in vivo study. Cell Biol Int. (2014) 38:1003–12. doi: 10.1002/cbin.10287
40. Bassilana F, Champigny G, Waldmann R, de Weille JR, Heurteaux C, Lazdunski M. The acid-sensitive ionic channel subunit ASIC and the mammalian degenerin MDEG form a heteromultimeric H+-gated Na+ channel with novel properties. J Biol Chem. (1997) 272:28819–22. doi: 10.1074/jbc.272.46.28819
41. Price MP, Gong H, Parsons MG, Kundert JR, Reznikov LR, Bernardinelli L, et al. Localization and behaviors in null mice suggest that ASIC1 and ASIC2 modulate responses to aversive stimuli. Genes Brain Behav. (2014) 13:179–94. doi: 10.1111/gbb.12108
42. Hinds TD Jr., Creeden JF, Gordon DM, Stec DF, Donald MC, Stec DE. Bilirubin nanoparticles reduce diet-induced hepatic steatosis, improve fat utilization, and increase plasma beta-hydroxybutyrate. Front Pharmacol. (2020) 11:594574. doi: 10.3389/fphar.2020.594574
43. Hinds TD Jr., Kipp ZA, Xu M, Yiannikouris FB, Morris AJ, Stec DF, et al. Adipose-specific PPARalpha knockout mice have increased lipogenesis by PASK-SREBP1 signaling and a polarity shift to inflammatory macrophages in white adipose tissue. Cells. (2021) 11. doi: 10.3390/cells11010004
44. Stec DE, Gordon DM, Hipp JA, Hong S, Mitchell ZL, Franco NR, et al. Loss of hepatic PPARalpha promotes inflammation and serum hyperlipidemia in diet-induced obesity. Am J Physiol Regul Integr Comp Physiol. (2019) 317:R733–R45. doi: 10.1152/ajpregu.00153.2019
45. Badmus OO, Kipp ZA, Bates EA, da Silva AA, Taylor LC, Martinez GJ, et al. Loss of hepatic PPARalpha in mice causes hypertension and cardiovascular disease. Am J Physiol Regul Integr Comp Physiol. (2023) 325:R81–95. doi: 10.1152/ajpregu.00057.2023
46. Gautam M, Benson CJ, Sluka KA. Increased response of muscle sensory neurons to decreases in pH after muscle inflammation. Neuroscience. (2010) 170:893–900. doi: 10.1016/j.neuroscience.2010.08.003
47. Kong X, Tang X, Du W, Tong J, Yan Y, Zheng F, et al. Extracellular acidosis modulates the endocytosis and maturation of macrophages. Cell Immunol. (2013) 281:44–50. doi: 10.1016/j.cellimm.2012.12.009
48. Voilley N, de Weille J, Mamet J, Lazdunski M. Nonsteroid anti-inflammatory drugs inhibit both the activity and the inflammation-induced expression of acid-sensing ion channels in nociceptors. J Neurosci. (2001) 21:8026–33. doi: 10.1523/JNEUROSCI.21-20-08026.2001
49. Louet JF, LeMay C, Mauvais-Jarvis F. Antidiabetic actions of estrogen: insight from human and genetic mouse models. Curr Atheroscler Rep. (2004) 6:180–5. doi: 10.1007/s11883-004-0030-9
50. Shi H, Clegg DJ. Sex differences in the regulation of body weight. Physiol Behav. (2009) 97:199–204. doi: 10.1016/j.physbeh.2009.02.017
51. Duzhyy DE, Voitenko NV, Belan PV. Peripheral inflammation results in increased excitability of capsaicin-insensitive nociceptive DRG neurons mediated by upregulation of ASICs and voltage-gated ion channels. Front Cell Neurosci. (2021) 15:723295. doi: 10.3389/fncel.2021.723295
52. Mamet J, Baron A, Lazdunski M, Voilley N. Proinflammatory mediators, stimulators of sensory neuron excitability via the expression of acid-sensing ion channels. J Neurosci. (2002) 22:10662–70. doi: 10.1523/JNEUROSCI.22-24-10662.2002
53. Wu FR, Pan CX, Rong C, Xia Q, Yuan FL, Tang J, et al. Inhibition of acid-sensing ion channel 1a in hepatic stellate cells attenuates PDGF-induced activation of HSCs through MAPK pathway. Mol Cell Biochem. (2014) 395:199–209. doi: 10.1007/s11010-014-2125-0
54. Duval C, Muller M, Kersten S. PPARalpha and dyslipidemia. Biochim Biophys Acta. (2007) 1771:961–71. doi: 10.1016/j.bbalip.2007.05.003
55. Wu J, Wang JJ, Liu TT, Zhou YM, Qiu CY, Shen DW, et al. PPAR-alpha acutely inhibits functional activity of ASICs in rat dorsal root ganglion neurons. Oncotarget. (2017) 8:93051–62. doi: 10.18632/oncotarget.v8i54
Keywords: degenerin, ENaC, ASIC, obesity, high fat diet
Citation: Hamby M, Stec DE, Hildebrandt E, Stec DF and Drummond HA (2024) Mice lacking ASIC2 and βENaC are protected from high-fat-diet-induced metabolic syndrome. Front. Endocrinol. 15:1449344. doi: 10.3389/fendo.2024.1449344
Received: 14 June 2024; Accepted: 23 July 2024;
Published: 19 August 2024.
Edited by:
Rodrigo O. Maranon, CCT CONICET Tucuman, ArgentinaReviewed by:
Stella Honoré, CONICET Higher Institute of Biological Research (INSIBIO), ArgentinaCopyright © 2024 Hamby, Stec, Hildebrandt, Stec and Drummond. This is an open-access article distributed under the terms of the Creative Commons Attribution License (CC BY). The use, distribution or reproduction in other forums is permitted, provided the original author(s) and the copyright owner(s) are credited and that the original publication in this journal is cited, in accordance with accepted academic practice. No use, distribution or reproduction is permitted which does not comply with these terms.
*Correspondence: Heather A. Drummond, aGRydW1tb25kQHVtYy5lZHU=
Disclaimer: All claims expressed in this article are solely those of the authors and do not necessarily represent those of their affiliated organizations, or those of the publisher, the editors and the reviewers. Any product that may be evaluated in this article or claim that may be made by its manufacturer is not guaranteed or endorsed by the publisher.
Research integrity at Frontiers
Learn more about the work of our research integrity team to safeguard the quality of each article we publish.