- 1Department of Critical Care Medicine, Shenzhen Second People’s Hospital, Shenzhen, Guangdong, China
- 2Department of Nephrology, Shenzhen Second People’s Hospital, Shenzhen, Guangdong, China
Objective: Previous studies have identified a positive link between the visceral adiposity index (VAI) and diabetes in specific populations. Our investigation focused on examining this association in normoglycemic adults in Japan.
Methods: A cohort study of NAGALA (NAfld in the Gifu Area Longitudinal Analysis) was undertaken from 2004 to 2015 in Japan. The link between VAI and diabetes was evaluated using multivariate Cox proportional hazards regression and restricted cubic spline (RCS) regression models. Receiver operating characteristic (ROC) curve analysis was performed to assess the predictive value of the VAI for incident diabetes.
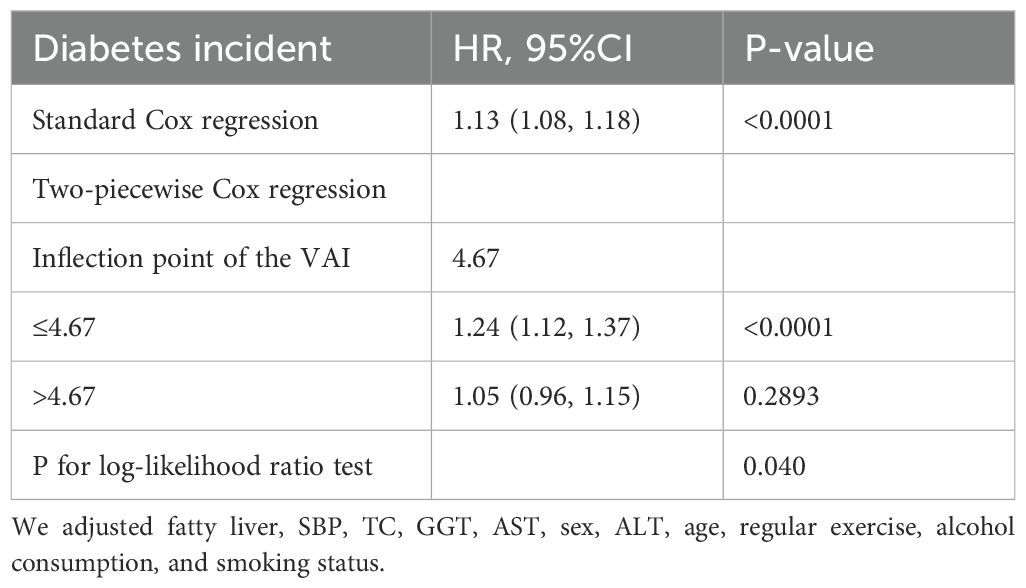
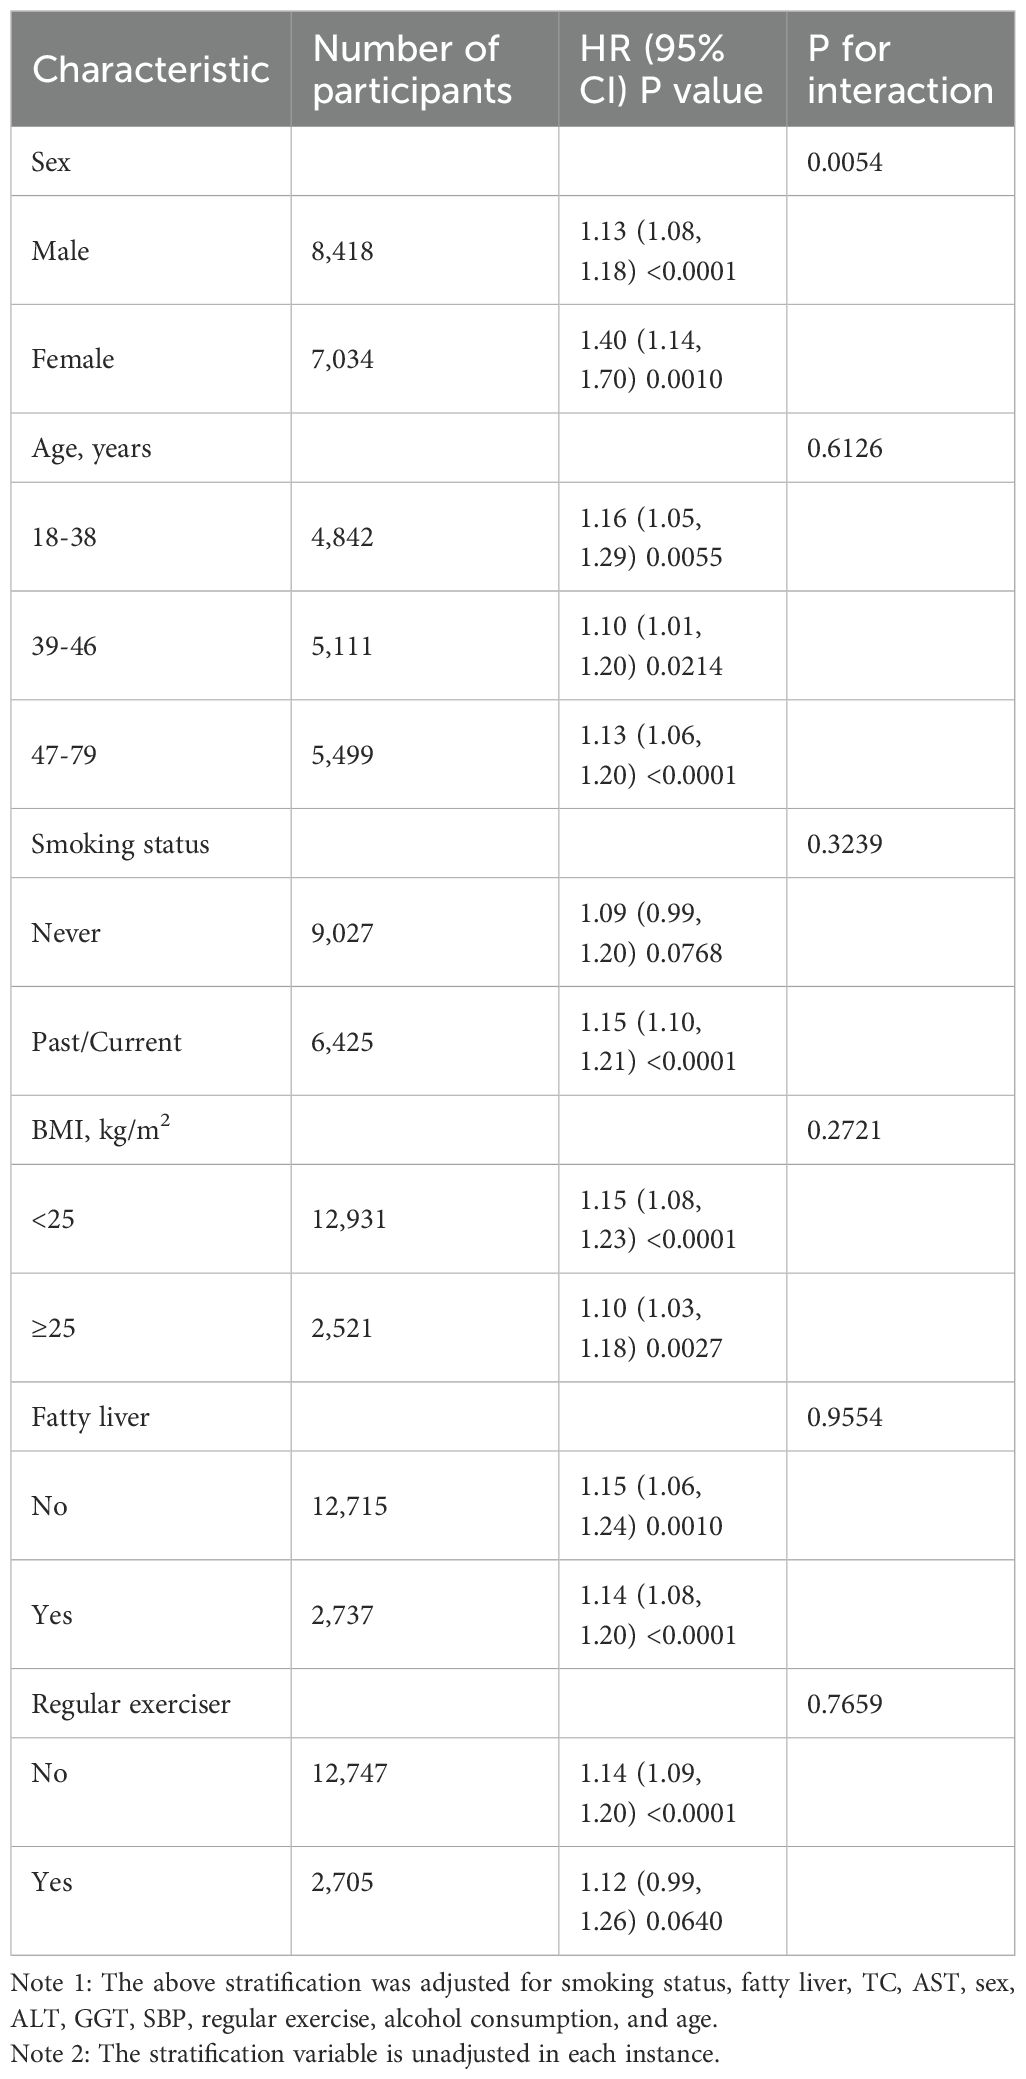
Results: Our study included 15,452 participants, with 8,418 men (54.48%) and 7,034 women (45.52%). The average age was 43.71 ± 8.90, and 373 participants (2.41%) developed diabetes. VAI was positively related to diabetes (HR=1.13, 95% CI 1.08-1.18). The inflection point of the non-linear relationship was observed at a VAI value of 4.67. For the VAI values up to 4.67, one unit increase in the VAI related to a 24% increase in new-onset diabetes (HR=1.24, 95% CI 1.12-1.37, p<0.0001). Subgroup analysis detected a more robust relationship in women (HR=1.40, 95% CI 1.14-1.70, p=0.0010). ROC analysis indicated that VAI, with an AUC of 0.7479 (95% CI: 0.7237-0.7720), had good predictive power.
Conclusion: Our cohort study validated the positive and non-linear relationship between the VAI and diabetes in normoglycemic adults in Japan. The relevance was more marked in women than in men. For those with a VAI below 4.67, a further reduction in the VAI could potentially lead to a significant decrease in diabetes risk.
1 Introduction
Globally, diabetes stands out as having extensive health effects caused by its widespread occurrence and high incidence. This condition increases the risk of physical impairments, cardiovascular ailments, and death rates (1–3). The International Diabetes Federation’s most recent survey report revealed that in 2021, the global adult population (ages 21-79) with diabetes was 536.6 million (4). This figure is expected to increase by 45.92% to 783 million by 2045 (4). Furthermore, the economic burden of diabetes is substantial and escalating, placing immense strain on both healthcare infrastructures and families (4).
Excessive or abnormal accumulation of fat, defined as obesity and overweight, poses a health risk to individuals (5). The global rise in diabetes is thought to be significantly influenced by an increase in obesity (6). Nevertheless, body mass index (BMI) alone may not adequately represent the risk of diabetes, as it does not account for the excess deposition of ectopic fat and visceral adipose tissue (7, 8). Methods utilizing waist circumference (WC) have been established to evaluate visceral fat levels (9). However, the limitation is that visceral fat cannot be distinguished from subcutaneous fat when solely using WC (10). Numerous studies indicate that visceral fat serves as a marker for atherosclerotic burden in individuals with metabolic issues, while subcutaneous fat appears to offer some protection (11, 12). It has been demonstrated in some research that visceral fat generates a higher quantity of free fatty acids, thereby increasing the likelihood of diabetes and insulin resistance (13, 14).
The visceral adiposity index (VAI) is a novel sex-specific index that is derived from measurements of triglycerides (TGs), high-density lipoprotein cholesterol (HDL-c), BMI, and WC, providing an indirect assessment of visceral fat function (15). Studies have suggested that the sensitivity of insulin and function of visceral fat are measured by VAI, with a higher score being intimately linked to cardiometabolic risk (15). Previous research has established that VAI is a reliable correlation indicator of non-alcoholic fatty liver disease (16), chronic kidney disease (17), cardiovascular disease (18), and metabolic syndrome (19). Some investigations into VAI in the context of diabetes have identified a positive correlation (20–23). However, these findings have not been validated in Japanese adults. Consequently, our investigation focused on the link between VAI and diabetes in normoglycemic adults in Japan.
2 Methods
2.1 Study data and population
The DATADRYAD database (http://www.Datadryad.org/) served as the primary source of our data. We accessed the information through the Dryad data package (https://doi.org/10.5061/dryad.8q0p192), which is accessible to all researchers at no cost. The website provides raw data that researchers can use for secondary analysis without copyright infringement.
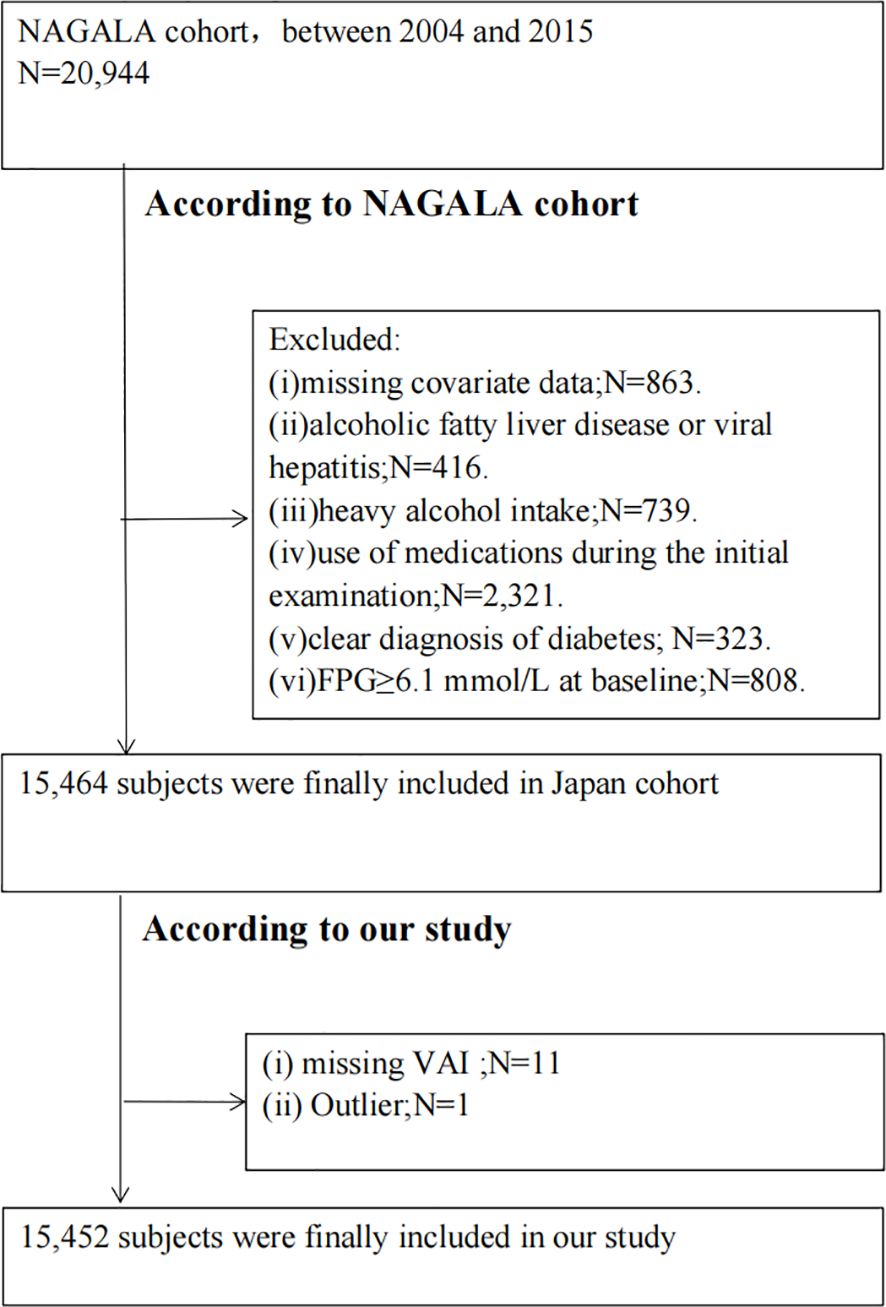
Our study involved a secondary examination of the NAGALA (NAfld in the Gifu Area, Longitudinal Analysis) database (24). The cohort study took place at the Medical Health Checkup Center of Murakami Memorial Hospital in Gifu, Japan, from 2004 to 2015 (24). In summary, the original study recruited 20,944 individuals who had undergone at least two medical examinations between 2004 and 2015 (24). The original study excluded participants based on several criteria: (i) missing covariate data; (ii) alcoholic fatty liver disease or viral hepatitis; (iii) heavy alcohol intake (over 40 g/day for women, 60 g/day for men); (iv) use of medications at the initial examination; (v) clear diagnosis of diabetes; or (vi) fasting plasma glucose (FPG) at or above 6.1 mmol/L (24). Our study additionally excluded those with missing VAI data and outliers. Ultimately, 15,452 subjects were enrolled in our study. The ethics committee of Murakami Memorial Hospital granted approval for the investigation (24). Every participant supplied signed written consent permitting the use of their data (24). A flowchart of this process is depicted in Figure 1.
2.2 Data collection and measurements
All participants’ health backgrounds and habitual influences were collected using a standardized questionnaire that they completed themselves (24). Those who routinely participated in some form of exercise at least once per week were classified as regular exercisers (24). Skilled sonographers diagnosed fatty livers according to abdominal ultrasound findings (24). Baseline data provided us with relevant data on BMI, regular exercise, sex, diastolic blood pressure (DBP), alcohol status, WC, age, smoking status, systolic blood pressure (SBP), and the presence of a fatty liver. Baseline laboratory data included hemoglobin A1c (HbA1c), triglycerides (TGs), gamma-glutamyl transferase (GGT), total cholesterol (TC), high-density lipoprotein cholesterol (HDL-c), aspartate aminotransferase (AST), fasting plasma glucose (FPG), and alanine aminotransferase (ALT).
2.3 VAI and diabetes definitions
VAI is determined using separate formulas for men and women (15).
For men, the calculation is (15).
For women, it is . Here, BMI is measured in kg/m2, WC in cm, and HDL and TG in mmol/L (15).
The onset of diabetes is identified by HbA1c at or above 6.5%, FPG at or over 7 mmol/L, or through self-report (25).
2.4 Statistical analysis
Continuous variables are depicted as either median (interquartile ranges) or as a mean (standard deviation). In contrast, categorical data are shown as quantities (proportions). To compare differences in continuous data across VAI tertiles, we employed a one-way analysis of variance (ANOVA), while chi-squared tests were applied to categorical variables.
Covariates that exhibited a variance inflation factor (VIF) exceeding 5 were identified as collinear. To address the dose-response connection between the VAI and diabetes, we employed restricted cubic splines (RCS). The relationship between the VAI and diabetes was estimated using Cox regression models. The findings are given as hazard ratios (HRs) followed by 95% confidence intervals (CIs). Crude regression estimates and those adjusted for covariates are provided. The selection of confounders was influenced by their correlation with the outcomes or whether they could shift the effect estimates by over 10%. After taking into account their clinical relevance, we made adjustments for the following covariates: AST, age, GGT, SBP, ALT, sex, TC, regular exercise fatty liver, alcohol consumption, and smoking status.
We employed a two-piecewise Cox regression model to investigate the threshold impact of the VAI on diabetes (26). The inflection for the VAI was identified using a recursive method. Ultimately, the model that best explained the link between the VAI and diabetes was chosen, building on a log-likelihood ratio test.
Considering the strong effect of exercise, hypertension, and alcohol on diabetes, we conducted sensitivity analyses in participants without regular exercise, hypertension, and alcohol consumption to ensure that our findings were robust. We investigated the possibility of unaccounted confounding factors for the link between the VAI and diabetes by determining E-values (27). These E-values measure the strength of an unseen confounder that could potentially nullify the noted VAI-diabetes connection.
Receiver operating characteristic (ROC) curve analysis was used to determine the predictive value of the VAI, BMI, and WC for incident diabetes. The two-sided alpha level was set at 0.05. EmpowerStats and R software were utilized for all statistical calculations.
3 Results
3.1 Baseline characteristics
The initial attributes of individuals participating in our research are outlined in Table 1. The study comprised 15,452 subjects, of whom 54.48% (8418) were men and 45.52% (7034) women. The participants’ mean age was 43.71 ± 8.90, and diabetes was reported in 2.41% (373) of them. The VAI values ranged between 0.03 and 21.41, with a median of 0.78 (0.39,1.58). We categorized the VAI into three tertiles: T1 (0.03-0.49), T2 (0.49-1.22), and T3 (1.22-21.41). As we moved from T1 to T3, there was a noticeable increase in the values for SBP, HbA1c, WC, ALT, BMI, AST, age, TC, GGT, TG, FPG, DBP, and in the proportion of men, current smokers, individuals with a fatty liver, and alcohol consumers. Conversely, the proportion of women, regular exercisers, and HDL-c levels showed a decreasing trend. The incidence of diabetes escalated across tertiles, with rates of 0.56% in T1, 1.73% in T2, and 4.95% in T3 (Table 1).
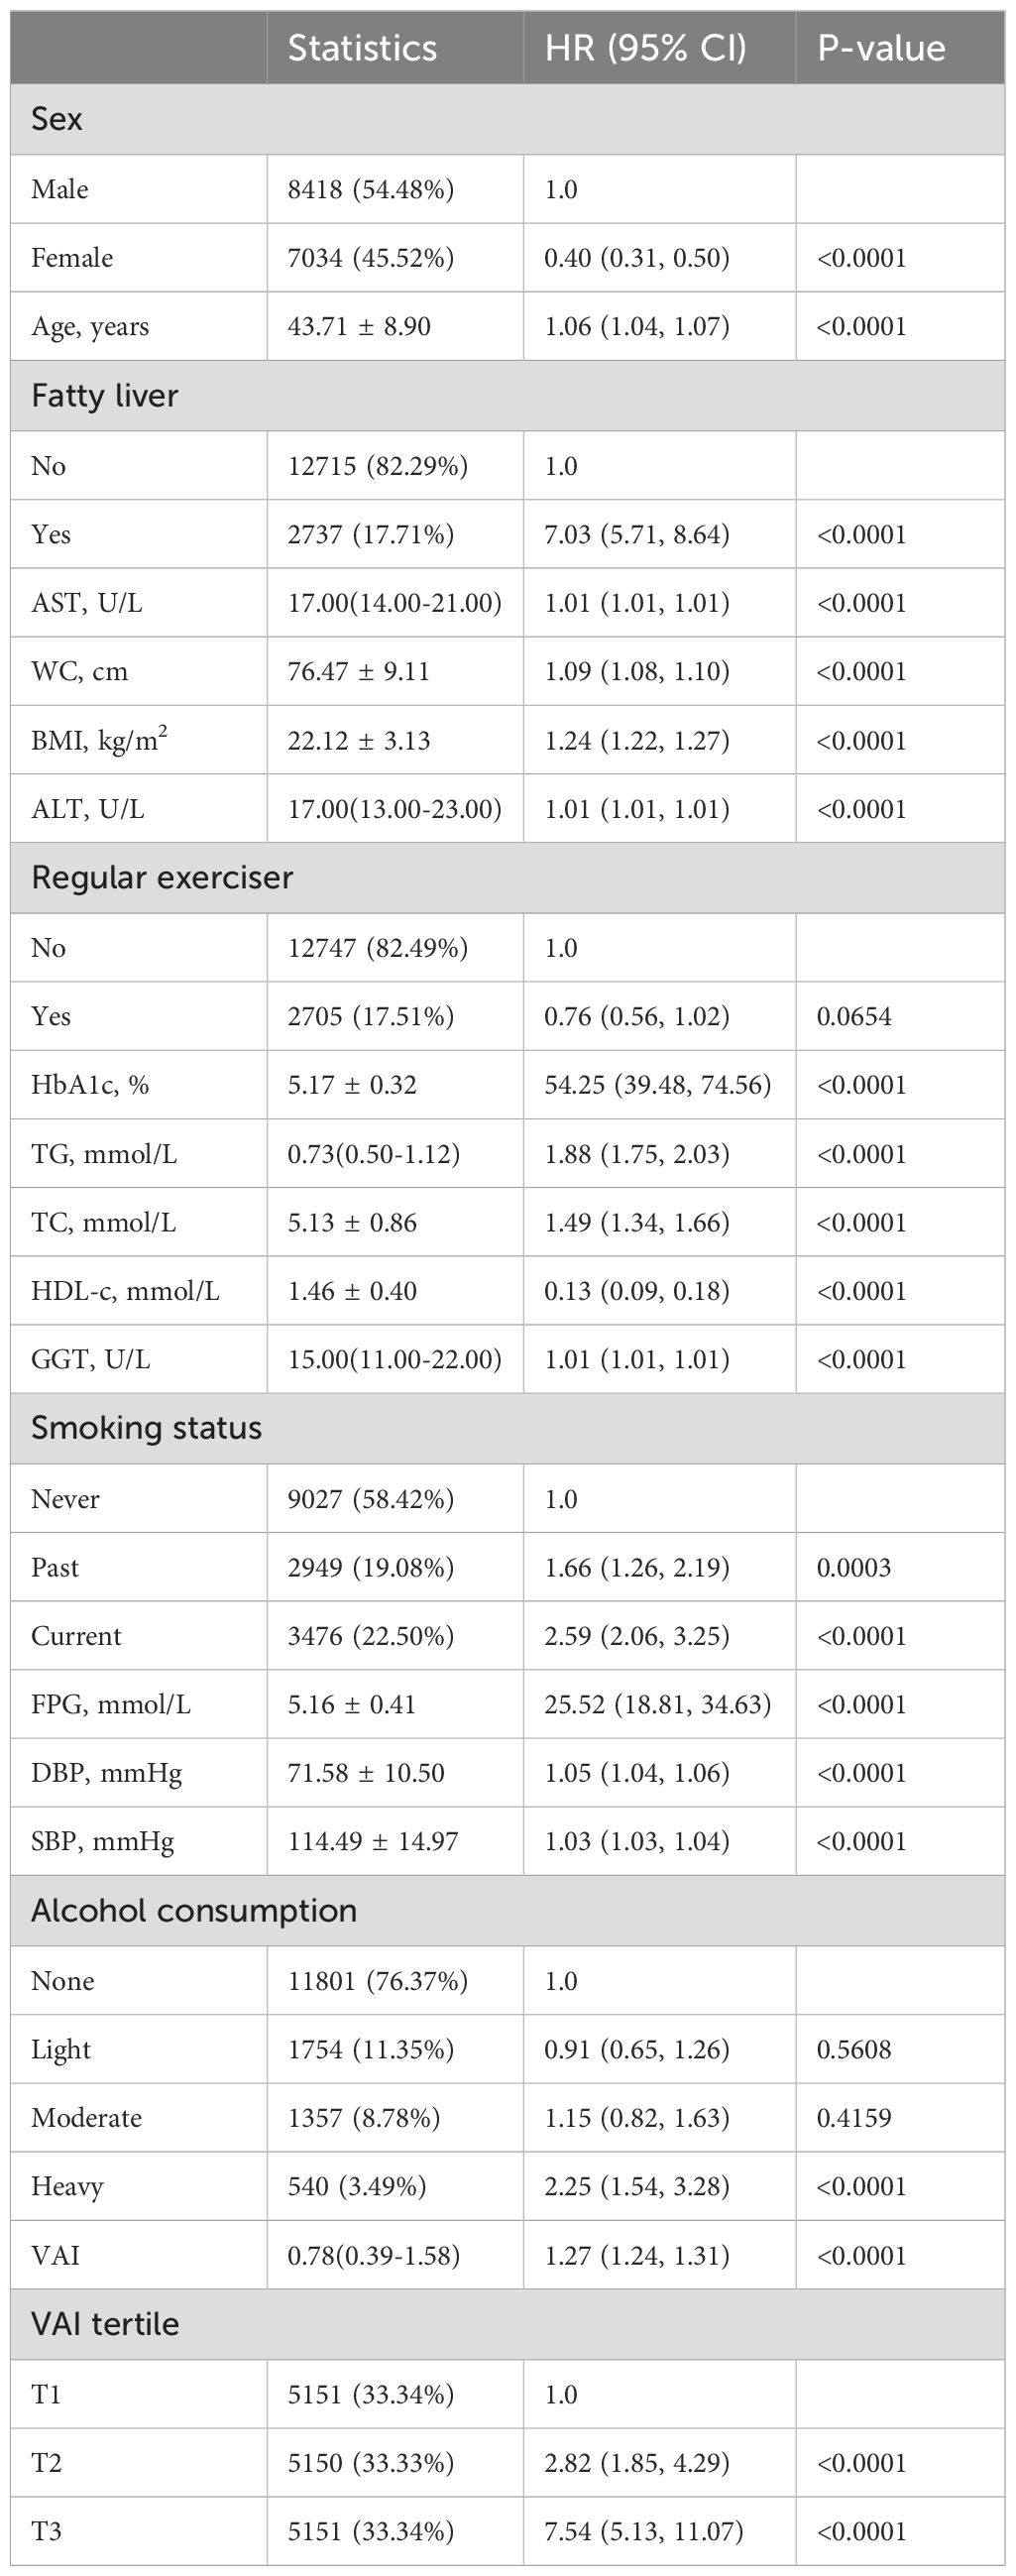
3.2 Univariate analyses
In summary, as shown in Table 2, several factors, including WC, sex, fatty liver, BMI, HDL, age, HbA1c, alcohol consumption, smoking status, FPG, and VAI were significantly associated with the outcome. Regular exercise and light-to-moderate alcohol consumption did not show a significant association. The risk generally increased with an increase in the values of these variables, except for HDL-c, where the risk decreased (Table 2).
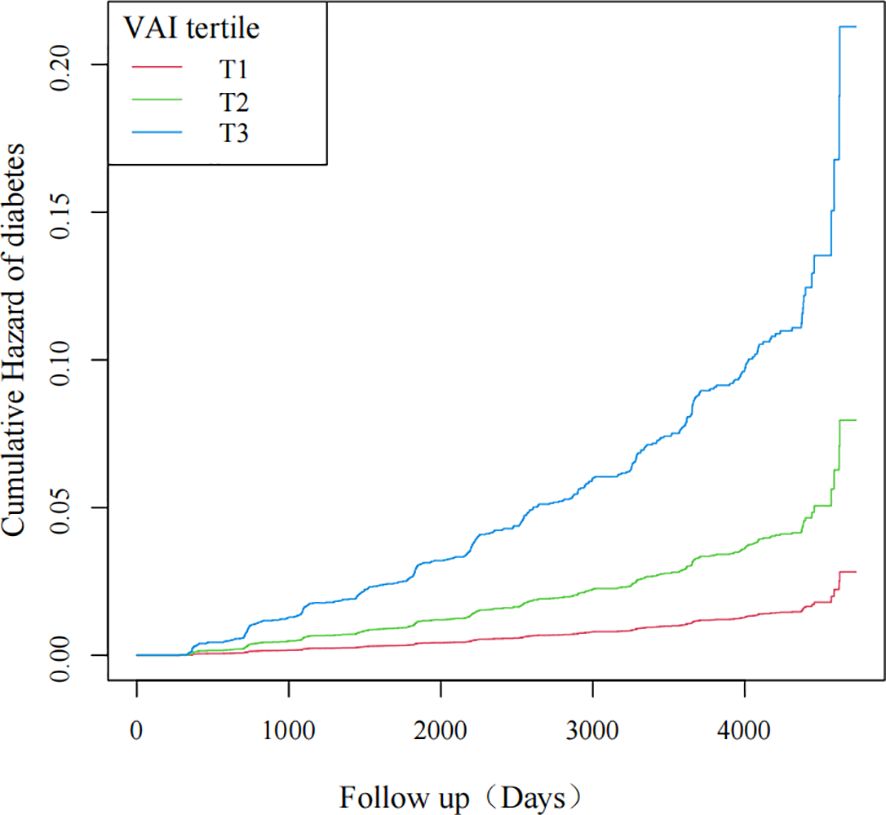
As the VAI value increased, so did the probability of diabetes, as revealed by the curves. Individuals with the highest VAI values were at the greatest risk of developing diabetes (Figure 2).
3.3 Multivariate analyses
Because of the collinearity of the DBP variable with other factors, it was excluded from the multivariate Cox proportional hazards regression analysis. The Crude Model illustrated that for each unit increment in the VAI, the risk of diabetes escalated by 27% (HR=1.27, 95% CI 1.24-1.31). In Model I, a similar unit rise in the VAI corresponded to a 24% surge in diabetes risk (HR=1.24, 95% CI 1.20-1.28). Model II indicated a 13% increase in diabetes risk for each unit increment in the VAI (HR=1.13, 95% CI 1.08-1.18). When examining VAI tertiles, the diabetes risk intensified. Specifically, T2 showed a 73% elevated risk (HR=1.73, 95% CI 1.11- 2.72) and T3 showed a 138% heightened risk (HR=2.38, 95% CI 1.46-3.87) in comparison to T1 (Table 3).
3.4 Sensitivity analyses
To validate our findings, we performed three sensitivity analyses, and all models corroborated the primary results. In Model I, one unit increment in the VAI corresponded to a 14% increase in new-onset diabetes (HR=1.14, 95%CI 1.08-1.20). Model II indicated a 12% increase in new-onset diabetes for each unit rise in the VAI (HR=1.12, 95%CI 1.06-1.19). Finally, Model III demonstrated that each unit rise in the VAI was related to a 13% increase in new-onset diabetes (HR=1.13, 95%CI 1.08-1.19) (Table 4).
An E-value was computed to evaluate the impact of unobserved confounding variables. The main outcomes remained solid, except in the presence of an unobserved confounder with an HR exceeding 1.79.
3.5 Non-linear analyses
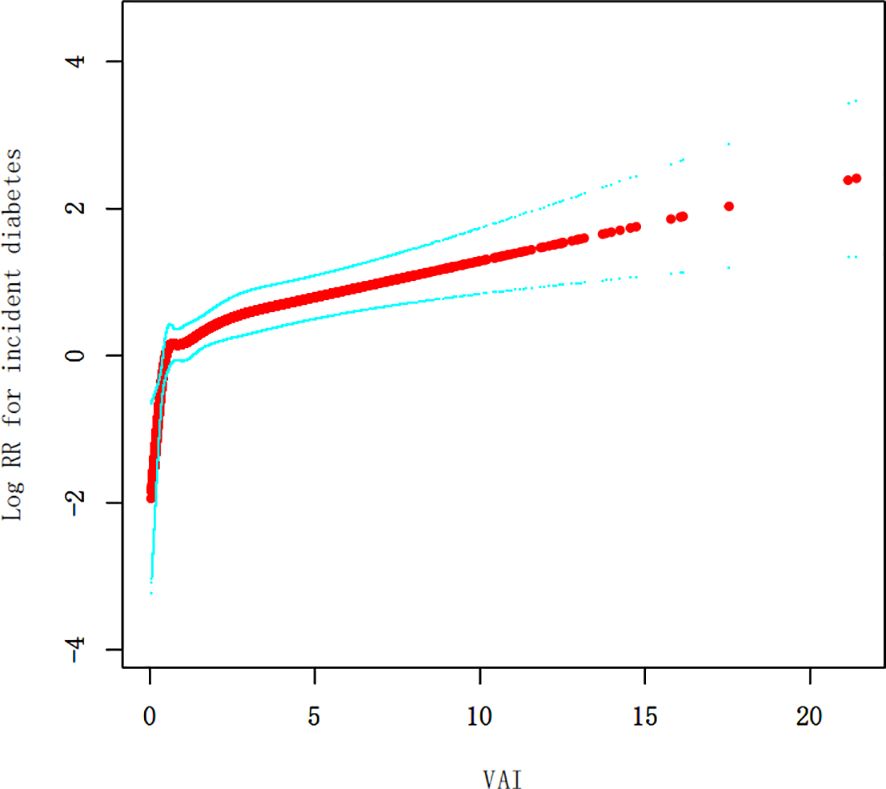
Our research identified a non-linear relationship between the VAI and diabetes (Figure 3, Table 5). The inflection point of this relationship was observed at a VAI value of 4.67. When the VAI values were less than or equal to 4.67, a unit rise in the VAI corresponded to a 24% surge in new-onset diabetes (HR=1.24, 95% CI 1.12-1.37, p<0.0001). Conversely, for the VAI values exceeding 4.67, new-onset diabetes rose by 5% for a one-unit rise in the VAI, although this correlation was not a statistically significant one (HR=1.05, 95% CI 0.96-1.15, p=0.2893).
3.6 Subgroup analyses
Analyses of various subgroups revealed no significant interactions between VAI and the onset of diabetes across age, BMI, fatty liver, smoking status, and regular exerciser strata (Table 6). The findings indicated that sex could influence the relevance of the VAI to the onset of diabetes. A more robust relation was detected in women (HR=1.40, 95% CI 1.14-1.70, p=0.0010) in comparison to men (HR=1.13, 95% CI 1.08-1.18, p<0.0001).
3.7 ROC analyses
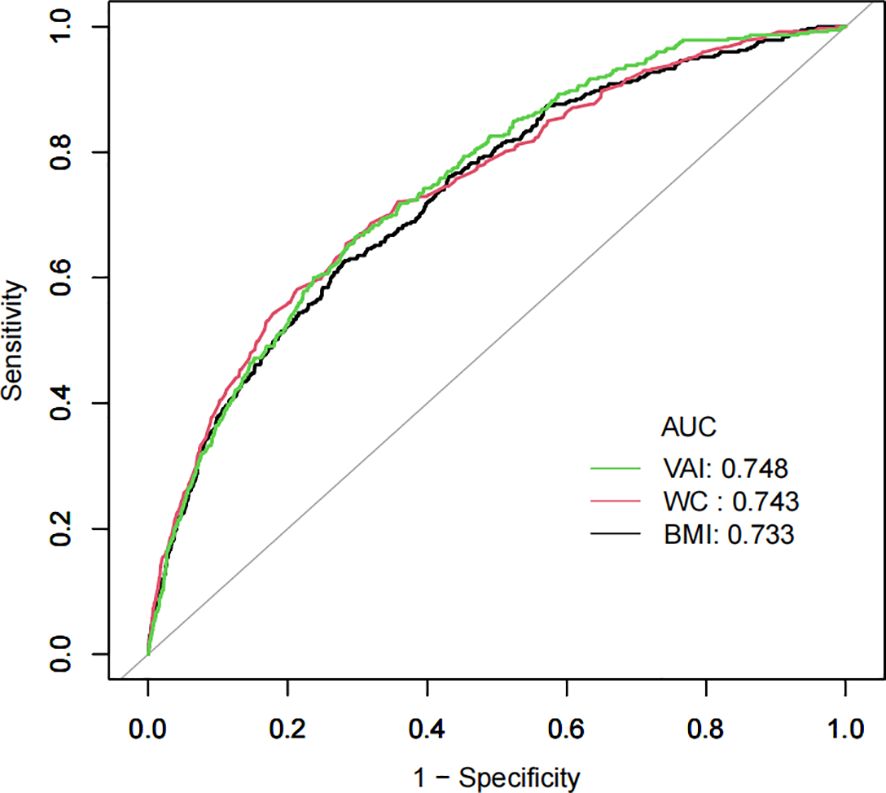
The potential of the VAI as a predictor of diabetes was evaluated using ROC analysis, as demonstrated in Table 7 and Figure 4, with an AUC of 0.7479 (95% CI: 0.7237-0.7720). Surprisingly, VAI showed the highest AUC compared with BMI and WC, showing a stronger ability to predict diabetes (70.35% specificity, 66.49% sensitivity) (Table 7).
4 Discussion
Our comprehensive longitudinal research, conducted in a Japanese cohort, revealed a positive, non-linear link between the VAI and diabetes. This relationship was consistent across all subgroups, with notable sex-based interactions. This is the first study, to the best of our understanding, that identifies a positive correlation between the VAI and the potential for diabetes in normoglycemic Japanese adults.
Studies in the U.S. have shown that the prevalence of diabetes in adults aged 20 years and older is approximately 9.6% (28). Approximately 12% of adults in Japan have diabetes (29). The prevalence of diabetes in our study was 2.41%, which was lower than the prevalence rates reported in previous literature (28, 29), most likely due to the stricter inclusion and exclusion criteria of the original study. The original study excluded patients with fatty liver disease, heavy alcohol intake, any medication use, and prediabetes, all of which are major risk factors for diabetes, resulting in a lower prevalence of the disease (30–33).
Our research corroborated earlier findings of a positive correlation between the VAI and diabetes, a relationship that has been observed in various populations. For instance, Liu conducted a cross-sectional study involving 2,754 Chinese adults aged 20 to 50, and an elevated VAI was shown to be positively connected with diabetes mellitus (20). Alkhalaqi examined a random sample of 1,103 Qatari adult residents aged over 20 years in a cross-sectional study and discovered not only an association between VAI z-scores and the onset of diabetes (OR=1.44; 95% CI 1.24-1.68) but that this relationship was more pronounced in women than in men (21). Koloverou found in a prospective cohort study of 1,049 participants from Greece (ATTICA study) with a 10-year follow-up that a higher VAI greatly increased the chances of developing diabetes by 22% (OR = 1.22; 95% CI: 1.09-1.37), with this association being particularly evident in women (22). Moreover, Zheng conducted a cross-sectional study of 18,745 American adults and observed a non-linear positive trend between the VAI and diabetes, with women showing a stronger risk than men (23). In conclusion, our cohort study not only confirmed the positive VAI and diabetes correlation in a new demographic group, Japanese adults but also revealed a non-linear relationship with a distinct inflection point.
The VAI encompasses both metabolic and physical aspects, potentially serving as an indirect indicator of some unconventional risk factors. These include changes in elevated plasma free fatty acids, enhanced lipolysis, and adipocytokine production, aspects not captured by WC, HDL-c, BMI, and TG when considered individually (34). As such, the VAI could be useful for measuring adipose tissue allocation and features (15, 34), which are related to increased diabetes risk and have an inverse relationship with insulin sensitivity (35).
The exact biological processes linking the VAI and diabetes remain somewhat unclear. One aspect involves the build-up of visceral fat, which is linked to reduced cerebral insulin sensitivity (36). A recently conducted study demonstrated that a 9-month regimen of a high-fiber and low-fat diet with heightened exercise brought about an immediate weight reduction that correlated with increased brain insulin sensitivity (36). Another factor is the inhibitory impact of fatty acid oxidation products on key enzymes involved in glucose breakdown, which means that higher free fatty acid content in plasma, common in insulin resistance and obesity, could worsen impaired glucose metabolism (36). Finally, adipose tissue failing to enlarge normally leads to abnormal fat build-up in visceral areas and even in vital organs such as the muscles, liver, and pancreas, which can disrupt their normal functioning (37).
The results of the subgroup analyses revealed that more associative correlations were observed in women when considering VAI and diabetes risk. Several potential reasons can be identified. First, estrogen, a crucial regulator of metabolic equilibrium and insulin sensitivity, can lessen oxidative stress and immune cell infiltration in adipose tissue and decrease inflammation in white adipose tissue (38, 39). This reduction can mitigate potential ectopic lipids in the liver and skeletal muscle (38, 39). In our investigation, as middle-aged and older women lost estrogen’s protective effects, they became more prone to insulin resistance compared to men. Second, Koutsari proposed that women exhibit a higher prevalence of non-oxidative free fatty acid disposal, which could potentially elevate TG levels, leading to diabetes (40–42). Finally, women, relative to men, have lower fatty acid oxidation and basal lipolysis levels, making them more susceptible to diabetes (43).
Our research suggests that a non-linear correlation exists between the VAI and diabetes, with a VAI value turning point at 4.67. Maintaining a VAI under 4.67 could notably reduce diabetes probability. Yet, once one’s VAI surpasses 4.67, a plateau effect is observed, and merely reducing it below 4.67 does not significantly impact diabetes risk. Thus, it becomes essential to control other risk elements such as smoking and hypertension. The sex-based differences in the relationship indicate a need for a heightened focus on diabetes risk in women. Crucially, managing VAI in women calls for more stringent and proactive measures.
Comparative analyses show that the VAI outperforms common metrics, including BMI and WC. Hameed et al. observed that the VAI had a higher AUC for predicting glycemic control in diabetic patients than BMI and WC, with AUC values of 0.670 for the VAI and 0.491 for BMI (44). Hulkoti et al. (45) found that the VAI had the highest AUC in diabetic microvascular issues (VAI = 0.826, WC = 0.813, BMI = 0.806). Similarly, our results strengthen these findings and clarify the unique contribution of the VAI to diabetes risk including comparisons with other adiposity measures such as BMI and WC. Its ability to integrate anthropometric and metabolic parameters provides a more nuanced understanding of an individual’s health status, making it a valuable tool in clinical practice for identifying those at risk for diabetes.
4.1 Study strengths and limitations
There are some merits to this study. First, it elucidated the connection between VAI and diabetes in normoglycemic adults in Japan. This investigation utilized a cohort study, enabling a clearer understanding of the cause-and-effect relationship between the VAI and diabetes. Second, this research treated the VAI as both a categorical and a continuous variable to reveal a non-linear association and a saturation effect. Finally, this research, being a national population-based cohort study with an extended follow-up duration, boasts broad coverage and excellent sample representativeness.
Certain limitations of this study warrant mention. First, the research is a secondary analysis of already available data and therefore, it does not include metrics related to diet and family history. Second, failure to include glucose tolerance and random blood glucose testing in the determination of diabetes may have caused the diabetes prevalence to be under-evaluated. Finally, the research demographic was comprised of Japanese adults, making the results less applicable to other ethnicities. Given the low incidence of diabetes, future studies should consider longer follow-up periods or larger sample sizes to ensure adequate numbers of events for the subgroup analyses.
5 Conclusion
Our cohort research, which involved 15,452 participants from NAGALA between 2004 and 2015, confirmed the non-linear and positive link between the VAI and diabetes in normoglycemic Japanese adults. The significantly more relevant results for women versus men suggest an increased need to concentrate on diabetes risk in women. A significant reduction in diabetes risk could potentially be achieved by keeping one’s VAI below 4.67.
Data availability statement
The original contributions presented in the study are included in the article/supplementary material. Further inquiries can be directed to the corresponding authors.
Ethics statement
The studies involving humans were approved by the ethics committee of Murakami Memorial Hospital. The studies were conducted in accordance with the local legislation and institutional requirements. The participants provided their written informed consent to participate in this study.
Author contributions
XL: Writing – review & editing, Writing – original draft, Software, Data curation, Conceptualization. ZX: Writing – review & editing, Software, Data curation. YL: Writing – review & editing, Software, Methodology, Data curation. SG: Writing – review & editing, Supervision, Methodology, Formal analysis, Data curation. HH: Writing – review & editing, Supervision, Software, Project administration, Methodology, Data curation.
Funding
The author(s) declare financial support was received for the research, authorship, and/or publication of this article. This work was supported by the Sanming Project of Medicine in Shenzhen (No. SZSM202211016), Shenzhen Fund for Guangdong Provincial High-level Clinical Key Specialties (No. SZGSP006), Shenzhen Second People’s Hospital Clinical Research Fund of Shenzhen High-level Hospital Construction Project (Grant No. 20223357008, 2023xgyj3357003).
Acknowledgments
We give our sincere gratitude to Professor Takuro Okamura and their team for the provision of the primary research data.
Conflict of interest
The authors declare that the research was conducted in the absence of any commercial or financial relationships that could be construed as a potential conflict of interest.
Publisher’s note
All claims expressed in this article are solely those of the authors and do not necessarily represent those of their affiliated organizations, or those of the publisher, the editors and the reviewers. Any product that may be evaluated in this article, or claim that may be made by its manufacturer, is not guaranteed or endorsed by the publisher.
Abbreviations
VAI, visceral adiposity index; WC, waist circumference; BMI, body mass index; DBP, diastolic blood pressure; SBP, systolic blood pressure; ALT, alanine aminotransferase; AST, aspartate aminotransferase; GGT, gamma-glutamyl transferase; HDL-c, high-density lipoprotein cholesterol; TC, total cholesterol; TG, triglycerides; FPG, fasting plasma glucose; HbA1c, hemoglobin A1c; HR, hazard ratios; CI, confidence interval.
References
1. Goldberg RB, Orchard TJ, Crandall JP, Boyko EJ, Budoff M, Dabelea D, et al. Effects of long-term metformin and lifestyle interventions on cardiovascular events in the diabetes prevention program and its outcome study. Circulation. (2022) 145:1632–41. doi: 10.1161/CIRCULATIONAHA.121.056756
2. Yu M, Zhan X, Yang Z, Huang Y. Measuring the global, regional, and national burden of type 2 diabetes and the attributable risk factors in all 194 countries. J Diabetes. (2021) 13:613–39. doi: 10.1111/1753-0407.13159
3. Wang H, Naghavi M, Allen C, Barber RM, Bhutta ZA, Carter A, et al. Global, regional, and national life expectancy, all-cause mortality, and cause-specific mortality for 249 causes of death, 1980–2015: a systematic analysis for the Global Burden of Disease Study 2015. Lancet. (2016) 388:1459–544. doi: 10.1016/S0140-6736(16)31012-1
4. Sun H, Saeedi P, Karuranga S, Pinkepank M, Ogurtsova K, Duncan BB, et al. IDF Diabetes Atlas: Global, regional and country-level diabetes prevalence estimates for 2021 and projections for 2045. Diabetes Res Clin Pract. (2022) 183. doi: 10.1016/j.diabres.2021.109119
5. Hu Frank B, Manson JoAnn E, Stampfer Meir J, Colditz G, Liu S, Solomon CG, et al. Diet, lifestyle, and the risk of type 2 diabetes mellitus in women. New Engl J Med. (2001) 345:790–7. doi: 10.1056/NEJMoa010492
6. Stefan N. Causes, consequences, and treatment of metabolically unhealthy fat distribution. Lancet Diabetes Endocrinol. (2020) 8:616–27. doi: 10.1016/S2213-8587(20)30110-8
7. Neeland IJ, Turer AT, Ayers CR, Powell-Wiley TM, Vega GL, Farzaneh-Far R, et al. Dysfunctional adiposity and the risk of prediabetes and type 2 diabetes in obese adults. JAMA. (2012) 308:1150–9. doi: 10.1001/2012.jama.11132
8. Maskarinec G, Raquinio P, Kristal BS, Franke AA, Buchthal SD, Ernst TM, et al. Body fat distribution, glucose metabolism, and diabetes status among older adults: the multiethnic cohort adiposity phenotype study. J Epidemiol. (2022) 32:314–22. doi: 10.2188/jea.JE20200538
9. Ford ES, Maynard LM, Li C. Trends in mean waist circumference and abdominal obesity among US adults, 1999-2012. JAMA. (2014) 312:1151–3. doi: 10.1001/jama.2014.8362
11. Ferreira J, Cunha P, Carneiro A, Vila I, Cunha C, Silva C, et al. Is obesity a risk factor for carotid atherosclerotic disease?—Opportunistic review. J Cardiovasc Dev Dis. (2022) 9:162. doi: 10.3390/jcdd9050162
12. Scicali R, Rosenbaum D, Di Pino A, Giral P, Cluzel P, Redheuil A, et al. An increased waist-to-hip ratio is a key determinant of atherosclerotic burden in overweight subjects. Acta Diabetol. (2018) 55:741–9. doi: 10.1007/s00592-018-1144-9
13. Boden G, Shulman GI. Free fatty acids in obesity and type 2 diabetes: defining their role in the development of insulin resistance and β-cell dysfunction. Eur J Clin Invest. (2002) 32:14–23. doi: 10.1046/j.1365-2362.32.s3.3.x
14. Fox CS, Massaro JM, Hoffmann U, Pou KM, Maurovich-Horvat P, Liu C-Y, et al. Abdominal visceral and subcutaneous adipose tissue compartments. Circulation. (2007) 116:39–48. doi: 10.1161/CIRCULATIONAHA.106.675355
15. Amato MC, Giordano C, Galia M, Criscimanna A, Vitabile S, Midiri M, et al. Visceral adiposity index. Diabetes Care. (2010) 33:920–2. doi: 10.2337/dc09-1825
16. Okamura T, Hashimoto Y, Hamaguchi M, Obora A, Kojima T, Fukui M. The visceral adiposity index is a predictor of incident nonalcoholic fatty liver disease: A population-based longitudinal study. Clinics Res Hepatol Gastroenterol. (2020) 44:375–83. doi: 10.1016/j.clinre.2019.04.002
17. Bamba R, Okamura T, Hashimoto Y, Hamaguchi M, Obora A, Kojima T, et al. The visceral adiposity index is a predictor of incident chronic kidney disease: A population-based longitudinal study. Kidney Blood Pressure Res. (2020) 45:407–18. doi: 10.1159/000506461
18. Darroudi S, Soflaee SS, Hosseini ZS, Farmad MS, Mirshafiei H, Andalibi MSS, et al. The visceral adiposity index and lipid accumulation product as predictors of cardiovascular events in normal weight subjects. Clin Nutr ESPEN. (2022) 52:190–7. doi: 10.1016/j.clnesp.2022.10.015
19. Jung JY, Ryoo J-H, Oh C-M, Choi J-M, Chung P-W, Hong HP, et al. Visceral adiposity index and longitudinal risk of incident metabolic syndrome: Korean genome and epidemiology study (KoGES). Endocrine J. (2020) 67:45–52. doi: 10.1507/endocrj.EJ19-0008
20. Liu PJ, Ma F, Lou HP, Chen Y. Visceral adiposity index is associated with pre-diabetes and type 2 diabetes mellitus in chinese adults aged 20-50. Ann Nutr Metab. (2016) 68:235–43. doi: 10.1159/000446121
21. Alkhalaqi A, Al-Naimi F, Qassmi R, Shi Z, Ganji V, Salih R, et al. Visceral adiposity index is a better predictor of type 2 diabetes than body mass index in Qatari population. Medicine. (2020) 99:e21327. doi: 10.1097/MD.0000000000021327
22. Koloverou E, Panagiotakos DB, Kyrou I, Stefanadis C, Chrysohoou C, Georgousopoulou EN, et al. Visceral adiposity index outperforms common anthropometric indices in predicting 10-year diabetes risk: Results from the ATTICA study. Diabetes/Metabolism Res Rev. (2019) 35:e3161. doi: 10.1002/dmrr.3161
23. Zheng D, Zhao C, Ma K, Ruan Z, Zhou H, Wu H, et al. Association between visceral adiposity index and risk of diabetes and prediabetes: Results from the NHANES (1999–2018). PloS One. (2024) 19:e0299285. doi: 10.1371/journal.pone.0299285
24. Okamura T, Hashimoto Y, Hamaguchi M, Obora A, Kojima T, Fukui M. Ectopic fat obesity presents the greatest risk for incident type 2 diabetes: a population-based longitudinal study. Int J Obes. (2019) 43:139–48. doi: 10.1038/s41366-018-0076-3
25. American Diabetes Association. 2. Classification and diagnosis of diabetes: standards of medical care in diabetes—2018. Diabetes Care. (2018) 41:S13–27. doi: 10.2337/dc18-S002
26. Lin L, Chen C, Yu X. The analysis of threshold effect using Empower Stats software. Zhonghua Liu Xing Bing Xue Za Zhi. (2013) 34:1139–41.
27. Haneuse S, VanderWeele TJ, Arterburn D. Using the E-value to assess the potential effect of unmeasured confounding in observational studies. JAMA. (2019) 321:602–3. doi: 10.1001/jama.2018.21554
28. Cowie CC, Rust KF, Byrd-Holt DD, Gregg EW, Ford ES, Geiss LS, et al. Prevalence of diabetes and high risk for diabetes using A1C criteria in the U.S. population in 1988-2006. Diabetes Care. (2010) 33:562–8. doi: 10.2337/dc09-1524
29. Urakami T, Kuwabara R, Yoshida K. Economic impact of diabetes in Japan. Curr Diabetes Rep. (2019) 19:2. doi: 10.1007/s11892-019-1122-9
30. Younossi ZM, Golabi P, de Avila L, Paik JM, Srishord M, Fukui N, et al. The global epidemiology of NAFLD and NASH in patients with type 2 diabetes: A systematic review and meta-analysis. J Hepatol. (2019) 71:793–801. doi: 10.1016/j.jhep.2019.06.021
31. Baliunas DO, Taylor BJ, Irving H, Roerecke M, Patra J, Mohapatra S, et al. Alcohol as a risk factor for type 2 diabetes: A systematic review and meta-analysis. Diabetes Care. (2009) 32:2123–32. doi: 10.2337/dc09-0227
32. Scherdjow A, Kiefer S, Lüske J, Althaus AE. The global threat of non-communicable diseases – cost and drivers for diabetes type 2 in Germany. Gesundheitsökonomie Qualitätsmanagement. (2022) 28: 34–0. doi: 10.1055/a-1823-2620
33. Tabák AG, Herder C, Rathmann W, Brunner EJ, Kivimäki M. Prediabetes: a high-risk state for diabetes development. Lancet. (2012) 379:2279–90. doi: 10.1016/S0140-6736(12)60283-9
34. Amato MC, Giordano C. Visceral adiposity index: an indicator of adipose tissue dysfunction. Int J Endocrinol. (2014) 2014:e730827. doi: 10.1155/2014/730827
35. Jayedi A, Soltani S, Motlagh SZ, Emadi A, Shahinfar H, Moosavi H, et al. Anthropometric and adiposity indicators and risk of type 2 diabetes: systematic review and dose-response meta-analysis of cohort studies. BMJ. (2022) 376: e067516. doi: 10.1136/bmj-2021-067516
36. Kullmann S, Valenta V, Wagner R, Tschritter O, Machann J, Häring H-U, et al. Brain insulin sensitivity is linked to adiposity and body fat distribution. Nat Commun. (2020) 11:1841. doi: 10.1038/s41467-020-15686-y
37. Dewidar B, Kahl S, Pafili K, Roden M. Metabolic liver disease in diabetes – From mechanisms to clinical trials. Metab - Clin Exp. (2020) 111: 154299. doi: 10.1016/j.metabol.2020.154299
38. Camporez JP, Lyu K, Goldberg EL, Zhang D, Cline GW, Jurczak MJ, et al. Anti-inflammatory effects of oestrogen mediate the sexual dimorphic response to lipid-induced insulin resistance. J Physiol. (2019) 597:3885–903. doi: 10.1113/JP277270
39. Nickelson KJ, Stromsdorfer KL, Pickering RT, Liu T-W, Ortinau LC, Keating AF, et al. A comparison of inflammatory and oxidative stress markers in adipose tissue from weight-matched obese male and female mice. J Diabetes Res. (2012) 2012:e859395. doi: 10.1155/2012/859395
40. Koutsari C, Basu R, Rizza RA, Nair KS, Khosla S, Jensen MD. Nonoxidative free fatty acid disposal is greater in young women than men. J Clin Endocrinol Metab. (2011) 96:541–7. doi: 10.1210/jc.2010-1651
41. Boden G, Jadali F, White J, Liang Y, Mozzoli M, Chen X, et al. Effects of fat on insulin-stimulated carbohydrate metabolism in normal men. J Clin Invest. (1991) 88:960–6. doi: 10.1172/JCI115399
42. Boden G, Chen X, Ruiz J, White JV, Rossetti L. Mechanisms of fatty acid-induced inhibition of glucose uptake. J Clin Invest. (1994) 93:2438–46. doi: 10.1172/JCI117252
43. Blaak E. Gender differences in fat metabolism. Curr Opin Clin Nutr Metab Care. (2001) 4:499. doi: 10.1097/00075197-200111000-00006
44. Hameed EK, AbdulQahar ZH. Visceral adiposity index in female with type 2 diabetic mellitus and its association with the glycemic control. Diabetes Metab Syndrome: Clin Res Rev. (2019) 13:1241–4. doi: 10.1016/j.dsx.2019.01.039
Keywords: diabetes, visceral adiposity index, non-linear, normoglycemia, cohort study
Citation: Liang X, Xing Z, Li Y, Gui S and Hu H (2024) Non-linear dose-response relationship between the visceral adiposity index and diabetes in adults with normoglycemia: a cohort study. Front. Endocrinol. 15:1441878. doi: 10.3389/fendo.2024.1441878
Received: 31 May 2024; Accepted: 13 November 2024;
Published: 04 December 2024.
Edited by:
Shaoyong Xu, Xiangyang Central Hospital, ChinaReviewed by:
Yifan Fan, Capital Medical University, ChinaDafeng Liu, Public Health and Clinical Center of Chengdu, China
Copyright © 2024 Liang, Xing, Li, Gui and Hu. This is an open-access article distributed under the terms of the Creative Commons Attribution License (CC BY). The use, distribution or reproduction in other forums is permitted, provided the original author(s) and the copyright owner(s) are credited and that the original publication in this journal is cited, in accordance with accepted academic practice. No use, distribution or reproduction is permitted which does not comply with these terms.
*Correspondence: Shuiqing Gui, Z3Vpc2h1aXFpbmdAMTYzLmNvbQ==; Haofei Hu, aHVoYW9mZWkwMzE5QDEyNi5jb20=
 Xiaomin Liang
 Zemao Xing1
 Ying Li
 Haofei Hu