- 1Department of Endocrinology, Zhejiang Integrated Traditional Chinese and Western Medicine Hospital, Hangzhou, Zhejiang, China
- 2Department of Urology, Zhejiang Integrated Traditional Chinese and Western Medicine Hospital, Hangzhou, Zhejiang, China
Background: Extensive observational evidence has suggested an association between depression and type 2 diabetes (T2D). However, the causal relationships between these two diseases require further investigation. This study aimed to evaluate the bidirectional causal effect between two types of depression and T2D using two-sample Mendelian randomization (MR).
Methods: We applied two-step MR techniques, using single-nucleotide polymorphisms (SNPs) as the genetic instruments for analysis. We utilized summary data from genome-wide association studies (GWASs) for major depression (MD), depressive status (frequency of depressed mood in the last two weeks), T2D, and other known T2D risk factors such as obesity, sedentary behavior (time spent watching television), and blood pressure. The analysis utilized inverse variance weighted (IVW), MR-Egger regression, weighted median, weighted mode, MR pleiotropy residual sum, and outlier methods to determine potential causal relationships.
Results: The study found that MD was positively associated with T2D, with an odds ratio (OR) of 1.26 (95% CI: 1.10-1.43, p = 5.6×10⁻⁴) using the IVW method and an OR of 1.21 (95% CI: 1.04-1.41, p = 0.01) using the weighted median method. Depressive status was also positively associated with T2D, with an OR of 2.26 (95% CI: 1.03-4.94, p = 0.04) and an OR of 3.62 (95% CI: 1.33-9.90, p = 0.01) using the IVW and weighted median methods, respectively. No causal effects of MD and depressive status on T2D risk factors were observed, and T2D did not influence these factors.
Conclusion: Our study demonstrates a causal relationship between depression and an increased risk of developing T2D, with both major depression and depressive status being positively associated with T2D.
Introduction
The incidence of type 2 diabetes (T2D) has risen sharply worldwide in recent years, driven by changes in environmental factors, behavior, and lifestyle (1). In 2021, the global prevalence of diabetes among adults aged 20-79 was estimated at 536.6 million, representing over 10% of the world’s adult population, with projections suggesting this number will rise to 783 million by 2045 (2). T2D, the most common form of diabetes, results from a complex interplay between genetic and environmental factors (3). Key environmental and psychological factors linked to T2D include rapid economic development, urbanization, sedentary lifestyles, unhealthy diets, and depression (4).
Depression, a prevalent psychological condition, has been identified as a significant risk factor for T2D. The World Health Organization estimates that depression will become the leading cause of disability worldwide by 2030 (5). Studies have shown a significant correlation between T2D and depression. A nationally representative cross-sectional study indicated that T2D patients have the highest incidence of depression at 17.15%, particularly among those with poor blood glucose control (6). Additionally, a retrospective cohort study in the UK and USA found an increased risk of depression among T2D patients, especially younger individuals, irrespective of other comorbidities (7). However, another study suggested a reverse causal relationship, where depression increased the incidence of T2D by 52%, with a synergistic effect with obesity (8). A meta-analysis of cohort studies also showed that there was a moderate bidirectional correlation between depression and T2D, but there is no direct causal evidence (9).
The causality between T2D and depression remains contentious. Mendelian randomization (MR) offers a robust method to infer causality, using genetic variants as instrumental variables. Genome-wide association studies (GWASs) were conducted in European and Asian populations, and more than 600 new loci regulating T2D risk were identified (10). Previous MR studies have explored this relationship, but findings have been inconsistent, particularly after adjusting for confounders such as body mass index (BMI) (11). With the emergence of new genetic databases and advanced GWASs, our study seeks to re-examine the causal relationship between T2D and depression using updated data and refined methodologies. The purpose of this study was to investigate the bidirectional causal relationship between depression and T2D using two-sample MR. We hypothesized that both major depression and depressive status would have a causal impact on the risk of developing T2D, and conversely, that T2D would influence the risk of depression.
Methods
Overall study design
We used a two-step two-sample MR with publicly available datasets that provide genome-wide association results for major depression (MD), depressive status, T2D, and other known T2D risk factors, such as obesity, sedentary behavior (time spent watching television), and blood pressure. First, we used two sets of data to test the causal effects of MD and depressive status on T2D, and then the causal effects on T2D risk factors. Finally, we identified the causal effects of T2D on depression.
Data sources
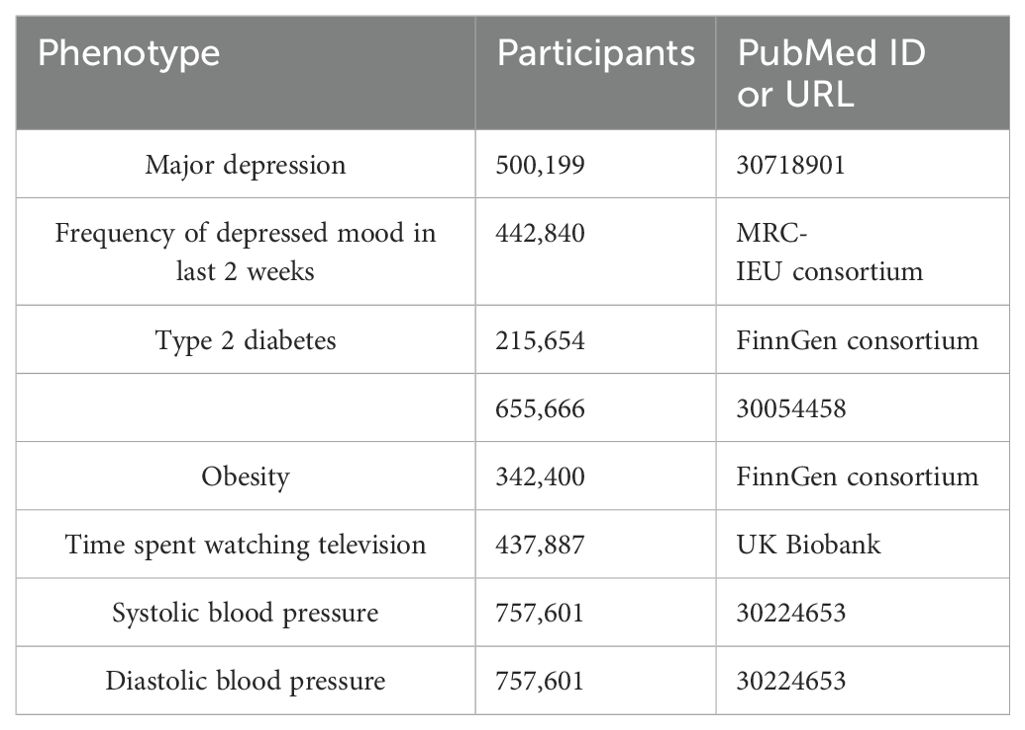
The genetic associations were estimated using data from several meta-analyses, the FinnGen consortium (https://www.finngen.fi/en), and the UK Biobank (UKBB) (https://www.ukbiobank.ac.uk). The details can be found in Table 1. Genetic variants for MD were obtained from the largest GWAS meta-analysis which included 170,756 cases and 329,443 control cases (12). To avoid confounding from the variation of depression severity, we constructed another set of genetic instruments based on the depressive status of a recent GWAS from the Medical Research Council-Integrative Epidemiology Unit (MRC-IEU) consortium which included 442,840 cases who experienced a particular frequency of depressed mood over 2 weeks. The GWAS summary data for T2D were obtained from a meta-analysis (13) and the FinnGen consortium. There were 62,892 T2D cases and 596,424 control cases in the meta-analysis and 32,469 T2D cases and 183,185 control cases in the FinnGen study. The GWAS summary data for T2D risk factors, including obesity, time spent watching television, systolic blood pressure, and diastolic blood pressure, were extracted from the FinnGen study, the UK Biobank, and the International Consortium of Blood Pressure (14) separately. Individuals who had withdrawn consent were excluded from all data sources. All cases and control cases in these studies had European ancestry and there was no significant overlap between GWAS populations.
Instrumental variable selection
In this study, single nucleotide polymorphisms (SNPs) were chosen as the instrumental variables (IVs) to investigate the causal relationships between depression (MD and depressive status) and T2D. The MD and depressive status served as the exposure, whereas T2D served as the outcome. The SNPs should satisfy three assumptions: Relevance—the SNPs should have a strong association with the exposure variable; Independence—the SNPs are unrelated to any potential confounders; Exclusion—the impact of the SNPs on the outcome is solely through the exposure variable and does not affect the outcome via any other pathways (15). First, the SNPs that were significantly related to the exposure were selected as the IVs. The selected SNPs that served as IVs had a threshold less than the genome-wide statistical significance threshold (5×10⁻⁸). Second, there was no linkage disequilibrium (LD) among the SNPs (R2 < 0.01 and clumping distance=10,000 kb). Third, the SNPs that were related to any potential confounders were removed to satisfy the independence assumption. Fourth, to ensure that the effects of the SNPs on exposure corresponded to the same allele as the effects on the outcome, palindromic SNPs with ambiguous allele frequencies were removed.
Statistical analyses
In this study, multiple methods including inverse variance weighted (IVW) (16), MR-Egger regression (17), weighted median (18), weighted mode (19), and MR pleiotropy residual sum and outlier (MR-PRESSO) (20) were used to examine whether there was a causal association between depression and T2D. The IVW method is reported to be more powerful than the others under certain conditions, so we used the IVW method as the main statistical model (16, 18), and the other methods were used to complement the IVW results. The weighted median method can generate consistent causal estimates assuming that at least 50% of the SNPs are valid. The MR-Egger regression can detect possible violations of instrumental variable assumptions due to directional horizontal pleiotropy, and a p-value of the intercept > 0.05 indicates no horizontal pleiotropic effects. Cochran’s Q test from the IVW approach tests the heterogeneity (21). In addition, a “leave-one-out” analysis was performed by sequentially omitting each instrumental SNP to discover potential heterogeneous SNPs. After removing the corresponding outliers, the MR-PRESSO method can detect outliers and provide a causal estimate from IVW. F-statistics were calculated to estimate the strength of the IVs and an F-statistic >10 suggested a sufficiently strong instrument (22). The results are presented as odds ratios (OR) and 95% confidence intervals (CI). All analyses were performed using the TwoSampleMR (23), MendelianRandomization (24), and MR-PRESSO packages (20) in R software (version 4.2.3).
Results
The causal effect of MD on T2D
Genetically predicted MD was positively associated with T2D in the meta-analysis and the FinnGen study. According to the IV selection criteria, 31 SNPs were used as IVs in the meta-analysis and 36 SNPs were selected in the FinnGen study. Figure 1 shows the scatter plots and Figure 2 shows the leave-one-out sensitivity tests for MR analysis. These 31 SNPs explained 1.1% of the variability in MD and the F-statistics of the IVs ranged from 140.24 to 249.48, indicating that the instruments had a strong potential to predict MD. Our IVW results showed strong evidence of a potential causal effect of MD on T2D with statistical significance (OR=1.26, 95%CI=1.10-1.43, p=5.6×10⁻⁴). Furthermore, similar risk estimates were gained using the weighted median method (OR=1.21, 95% CI=1.04-1.41, p=0.01), while the results were not statistically significant using the MR-Egger approach (OR=1.05, 95%CI=0.36-3.20, p=0.93) and weighted mode method (OR=1.15, 95% CI=0.82-1.61, p=0.43). However, heterogeneity was observed with a Cochran Q-test with a p-value of 0.03 for IVW. MR-PRESSO also presented a similar result (the p-value in the global heterogeneity test=0.04). However, there was no significant directional horizontal pleiotropy according to the results of the MR-Egger regression intercept analysis (intercept=0.005; SE=0.01. p=0.74). In the FinnGen study, we found weak evidence of a potential causal effect of MD on T2D at statistical significance (OR=1.19, 95% CI=1.01-1.40, p=0.037). These 36 SNPs explained 1.2% of the variability in MD and the F-statistics of the IVs ranged from 137.79 to 249.48. The results were not statistically significant using the MR-Egger approach (OR=1.17, 95%CI=0.39-3.54, p=0.79), the weighted median method (OR=1.18, 95% CI=0.97-1.43, p=0.10), or the weighted mode method (OR=1.97, 95% CI=0.83-1.73, p=0.35). Meanwhile, heterogeneity was observed with a Cochran Q-test derived p-value of 0.02 for IVW. MR-PRESSO also presented a similar result (p-value in the global heterogeneity test=0.02). However, there was no evidence of a significant intercept (intercept=0.0004; SE=0.02; p=0.98), indicating that there was no observed directional pleiotropy. Among the two T2D databases, the IVW method showed that MD significantly increased the risk for T2D, and no pleiotropy was observed. Although some other methods had no statistical significance and heterogeneity existed, MD was positively associated with T2D (Table 2).
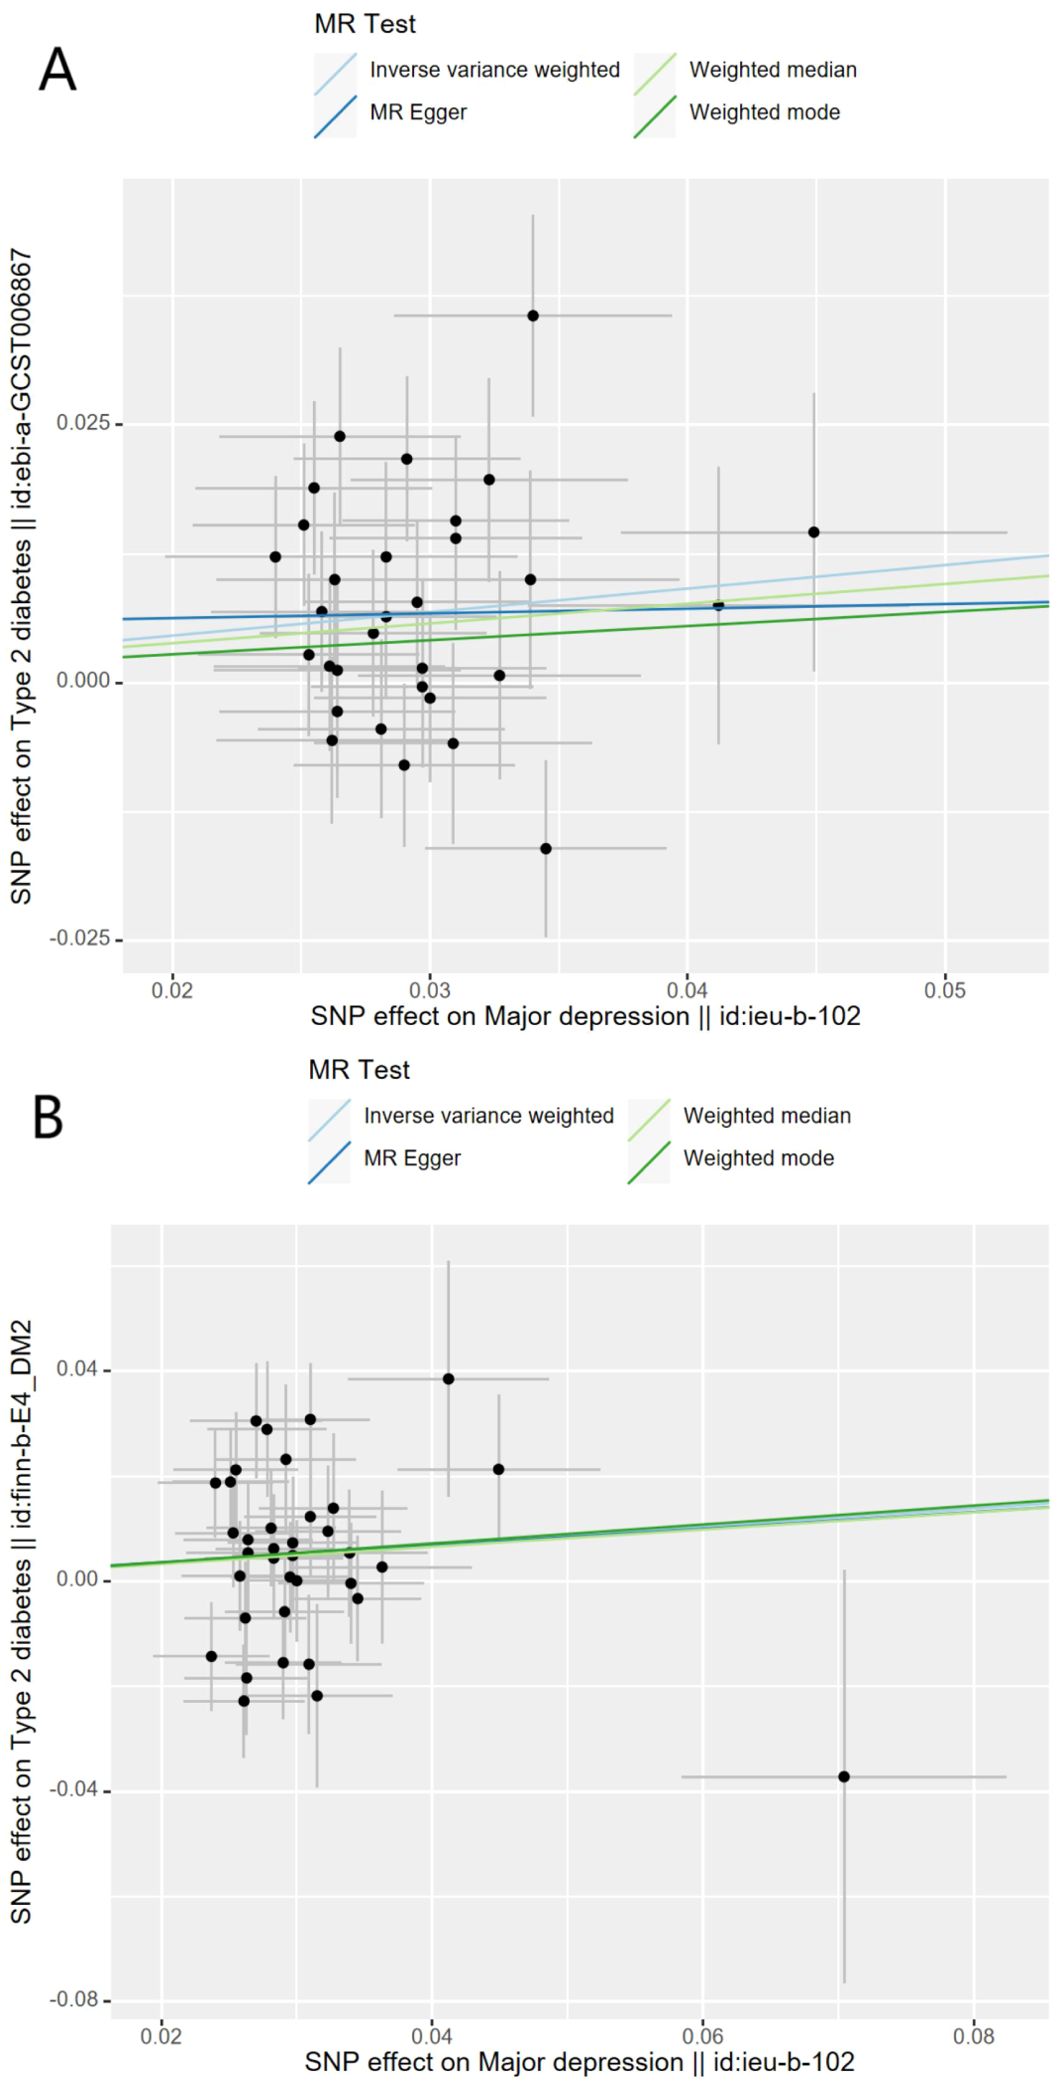
Figure 1. Scatter plots for Mendelian randomization analysis of major depression and the risk of type 2 diabetes. (A) Associations in the meta-analysis, (B) associations in FinnGen. Horizontal axis: SNPs’ association with major depression. Vertical axis: SNPs’ association with type 2 diabetes. The gradient of each line represents the MR estimate for the corresponding model.
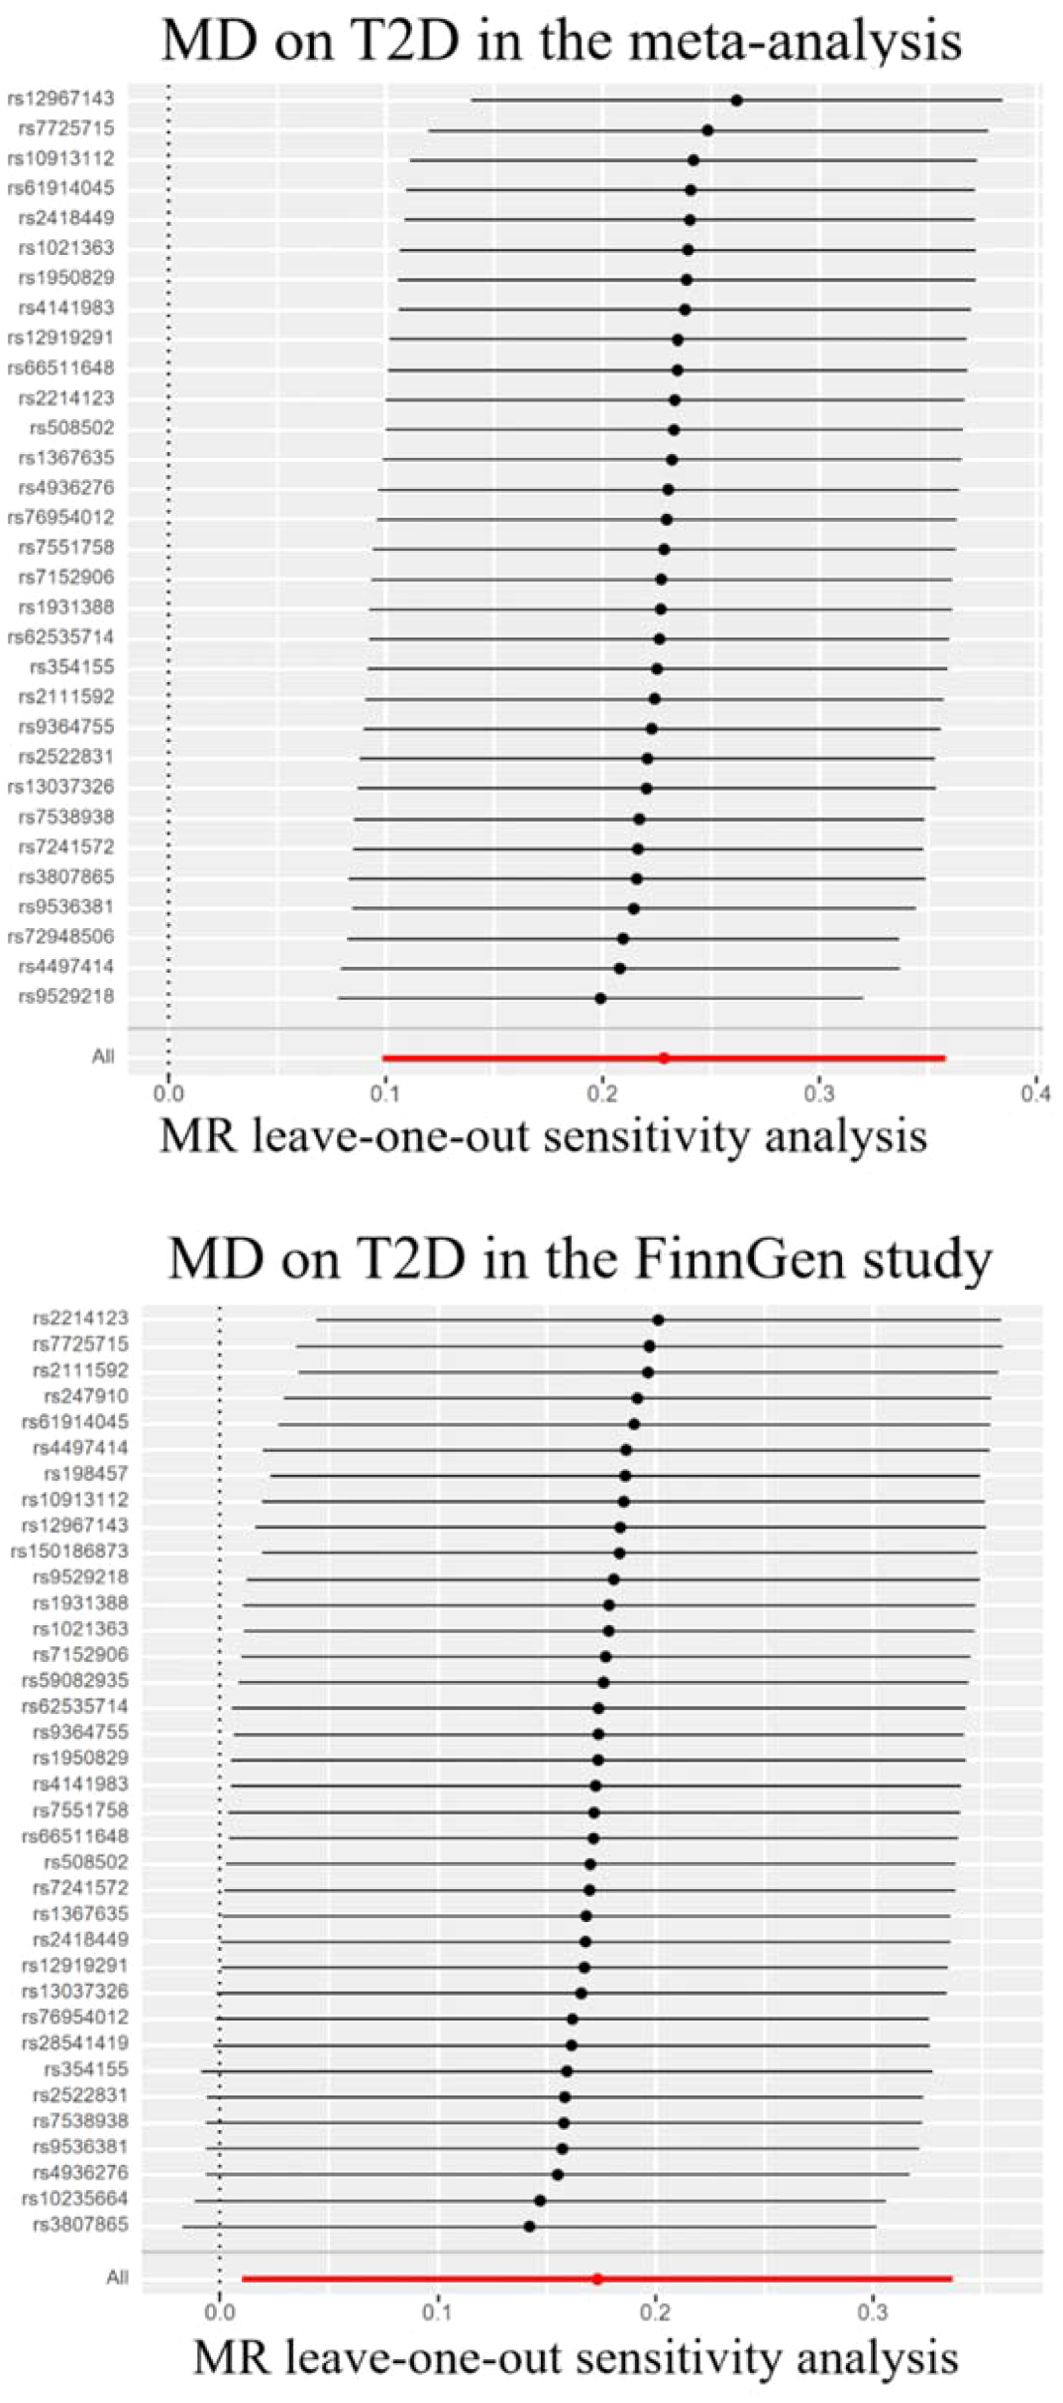
Figure 2. Leave-one-out sensitivity tests. We calculated the MR results of the remaining IVs after removing the IVs one by one. MD, major depression; T2D, type 2 diabetes.
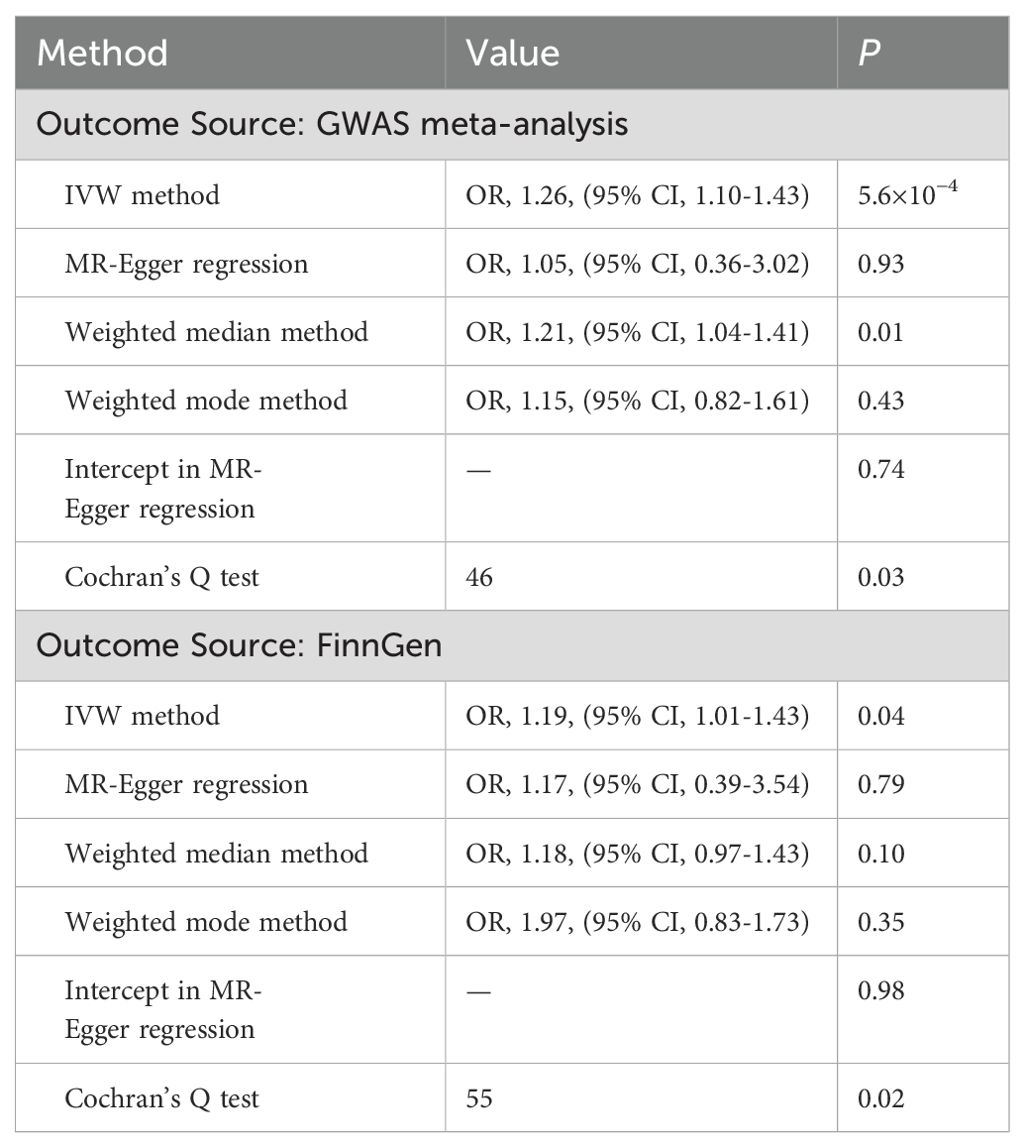
Table 2. Association of genetically predicted major depression with type 2 diabetes in sensitivity analyses.
The causal effect of depressive status on T2D
Genetically predicted depressive status was positively associated with T2D in the FinnGen study but had no causality on T2D in the meta-analysis. In the FinnGen study, 11 SNPs were significantly and independently associated with depressive status and explained 0.03% of the variability, and the F-statistics were all >10. Figure 3 shows the scatter plots and Figure 4 shows the leave-one-out of sensitivity tests for the MR analysis. The result of IVW indicated that depressive status was positively associated with T2D (OR=2.26, 95% CI =1.03-4.94, p=0.04) and there was no horizontal pleiotropy (p=0.96) or heterogeneity (p=0.64). MR-PRESSO also presented a similar result (p-value in the global heterogeneity test=0.78). Similar risk estimates were gained using the weighted median method (OR=3.62, 95% CI=1.33-9.90, p=0.01), while the results were not statistically significant using the MR-Egger approach (OR=1.90, p=0.85) or the weighted mode method (OR=4.41, p=0.08). In the meta-analysis, 14 SNPs were significantly associated with depressive status. The IVW result indicated that depressive status had no causality on T2D (OR=1.41, 95% CI =0.83-2.39, p=0.19) (Table 3).

Figure 3. Scatter plots for Mendelian randomization analysis of depressive status and risk of type 2 diabetes. (A) Associations in the meta-analysis, (B) associations in FinnGen. Horizontal axis: SNPs’ association with frequency of depressed mood in last 2 weeks. Vertical axis: SNPs’ association with type 2 diabetes. The gradient of each line represents the MR estimate for the corresponding model.
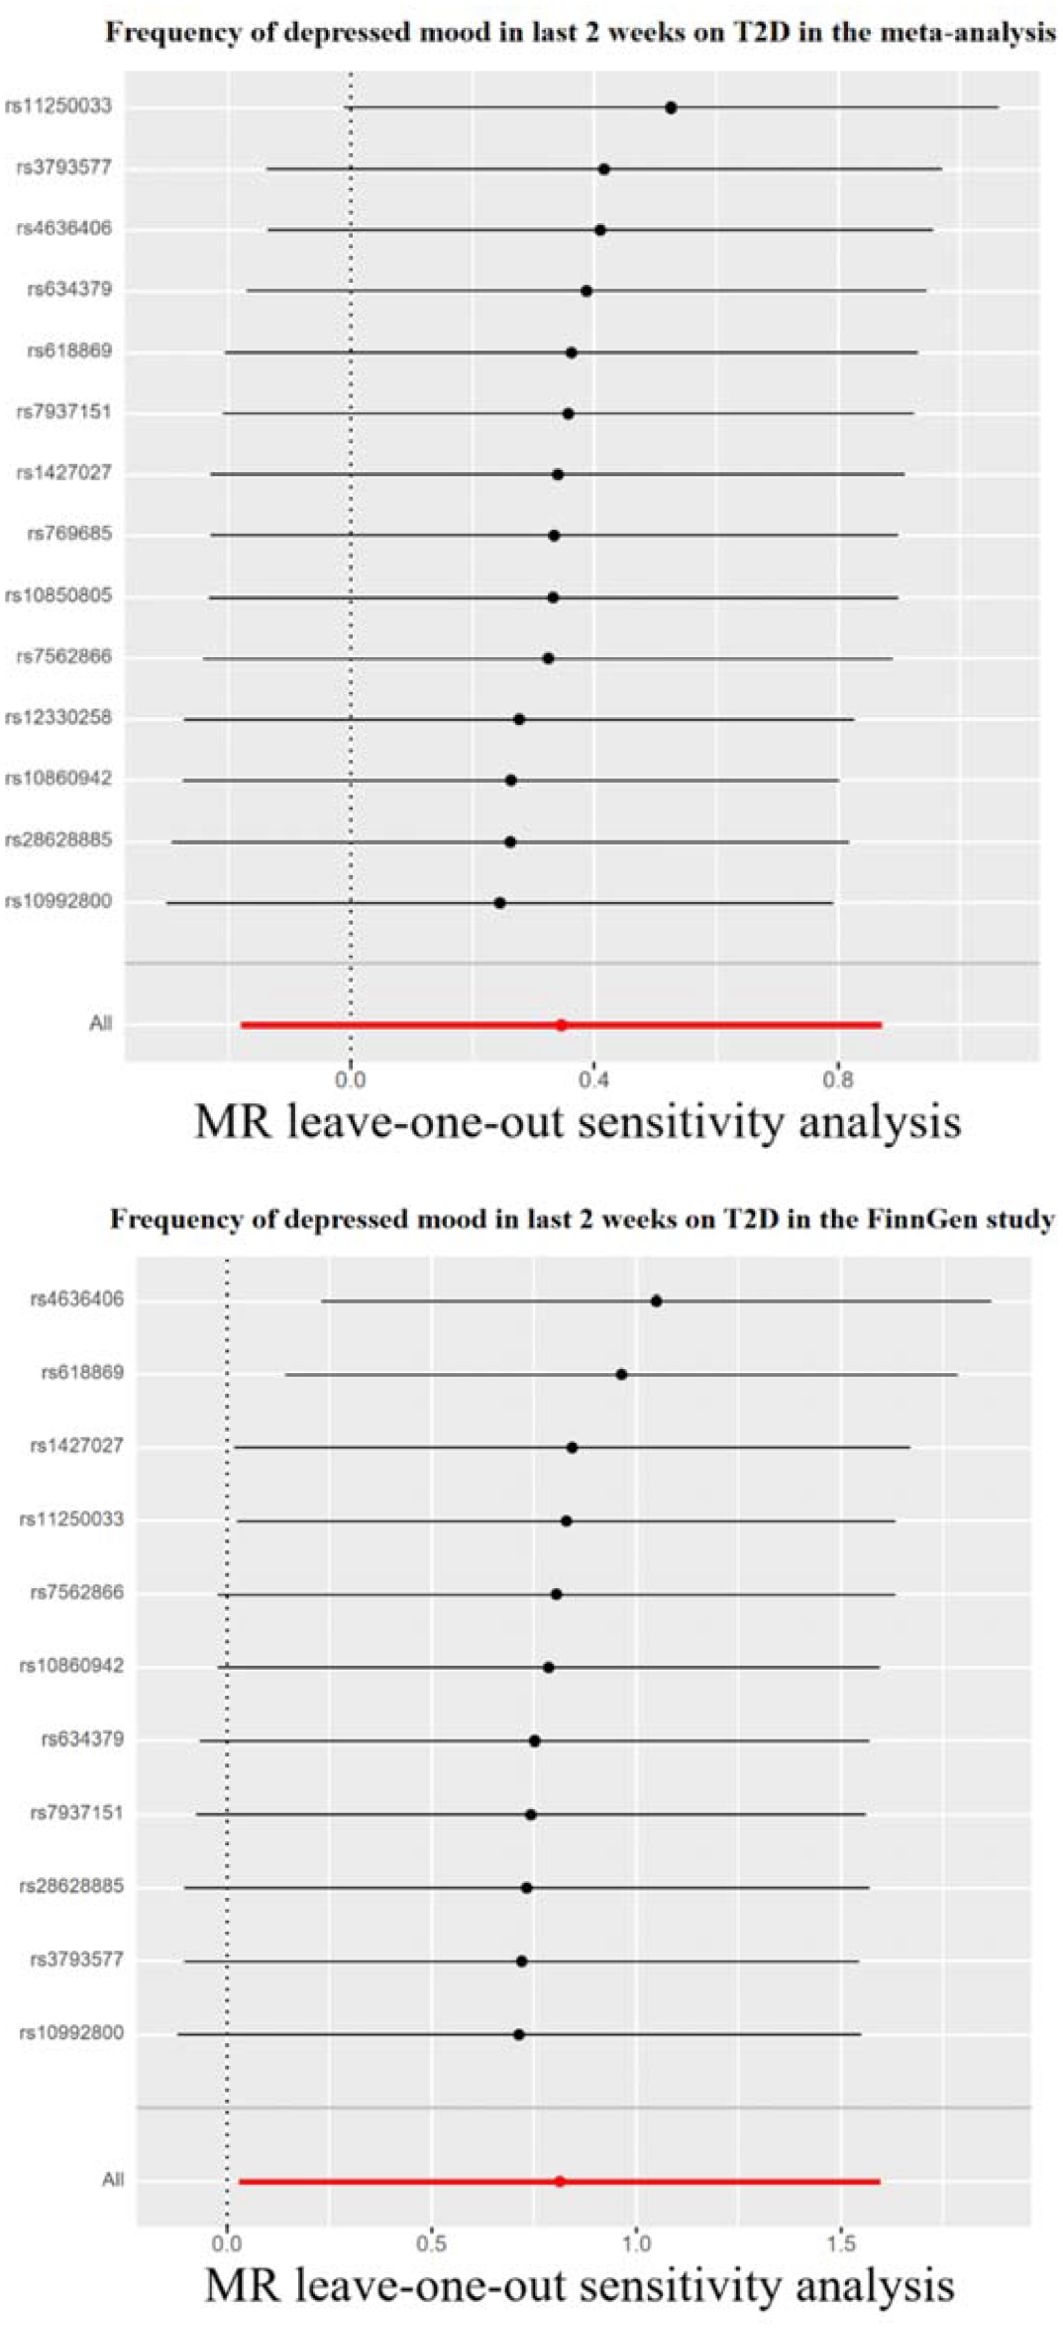
Figure 4. Leave-one-out sensitivity tests. We calculated the MR results of the remaining IVs after removing the IVs one by one. T2D, type 2 diabetes.
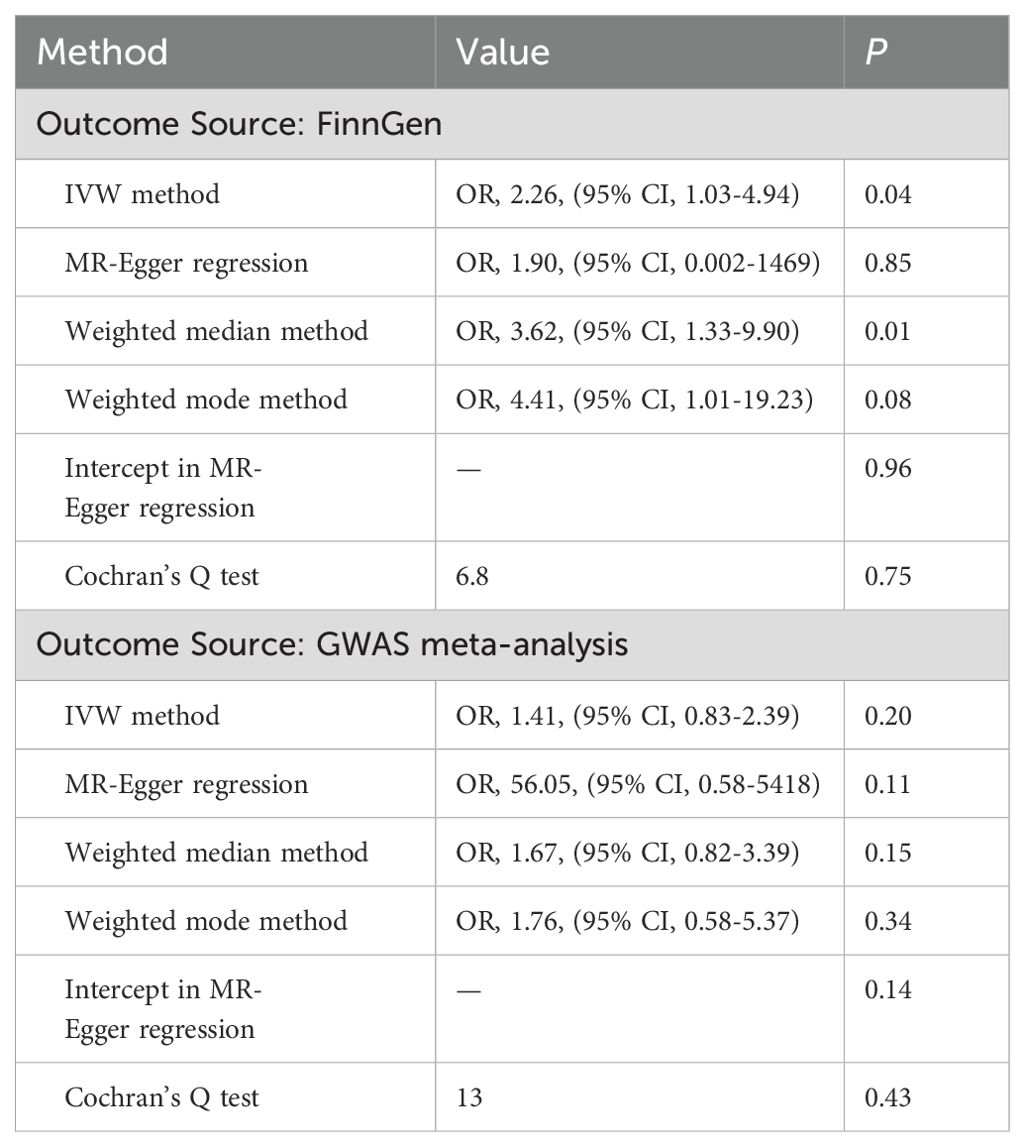
Table 3. Association of genetically predicted depressive status with type 2 diabetes in sensitivity analyses.
The causal effect of depression on potential T2D risk factors
To determine whether the MR association between genetically determined depression and T2D was destroyed through the pleiotropic pathway associated with T2D, we used the IVW method to identify the relationship between depression and several T2D factors, such as obesity, time spent watching television, systolic blood pressure, and diastolic blood pressure. The databases of depressive status and time spent watching television were both from UKBB, which may lead to biased results, so we excluded this group. All p-values were larger than 0.05 and had no statistical significance. Thus, no causal effects of MD and depressive status on potential T2D risk factors were observed (Tables 4, 5).
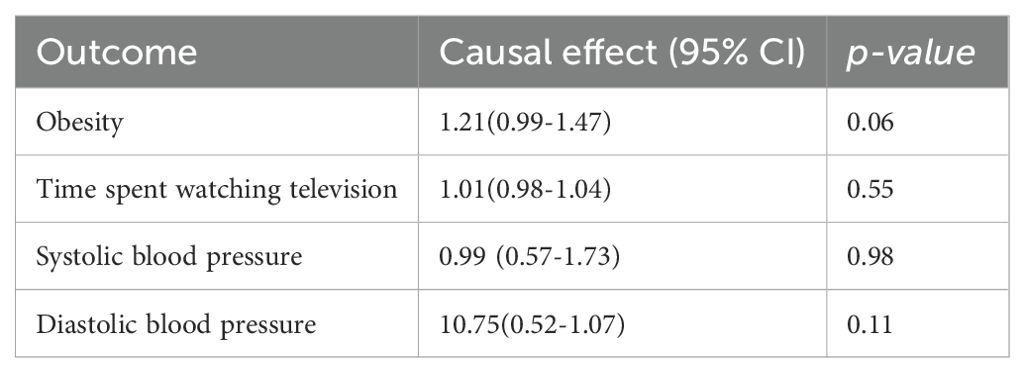
Table 4. Mendelian randomization estimation of the correlation between major depression and risk factors.
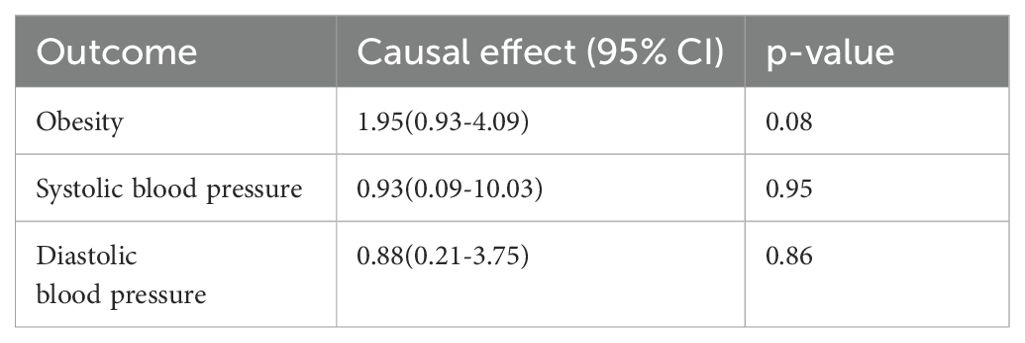
Table 5. Mendelian randomization estimation of the correlation between depressive status and risk factors.
The causal effect of T2D on depression
We also performed a reverse MR. Using MD and depressive status as the outcomes and T2D as the exposure, we did not find a causal relationship based on IVW analysis. All p-values were larger than 0.05 and had no statistical significance. This showed that T2D did not affect MD and depressive status (Table 6).
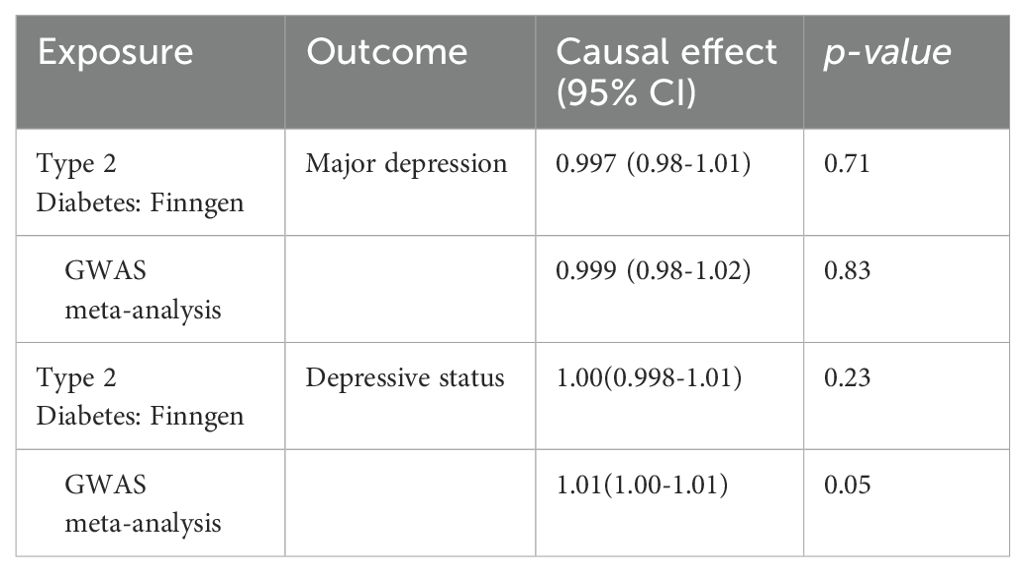
Table 6. Mendelian randomization estimation of the correlation between Type 2 diabetes and depression.
Discussion
We applied a two-sample MR approach to comprehensively evaluate whether depression causally influences T2D incidence and whether T2D causally influences depression. We found evidence to support the causal role of genetically predicted MD and depressive status on the risk of T2D. There was no evidence that T2D increased the risk of depression incidence.
In a prospective analysis of population-based data from the UK Biobank (9,047 people with T2D and 68,739 people without diabetes) and the Maastricht Study (1,158 people with T2D and 3,372 people without diabetes), individuals with T2D had a higher risk of major depression (hazard ratio [HR] 1.61 [95% CI 1.49-1.77]) (25). In a cross-sectional study in China, during a 3-year observation, 316 patients with T2D were newly discovered from the 2,809 participants, and the relative risk and 95% confidence interval of depression on the incidence of diabetes was 1.52 (1.05-2.21). Depression was associated with a 52% increase in the incidence of type 2 diabetes (8). A study in Ontario, Canada, which included 59,315 adults living in communities, aimed to compare the incidence rate of T2D among adults with weight changes related to depression over the past 20 years. The results showed that compared with patients without depression, patients with depression without weight change or with weight gain had an increased risk of developing T2D (26). In a systematic review, there was moderate evidence that there was a causal relationship between T2D and the risk of depression, but more limited evidence showed that there was a causal relationship between depression and the risk of diabetes (27). Therefore, there is controversy over whether there is a causal relationship between depression and T2D, as well as which is the cause and which is the outcome. In addition, depression was associated with an excess mortality rate in patients with T2D recruited clinically in a Danish cohort of patients with T2D (n=8175) (28). A retrospective cohort study (29) in Italy found the same result, as depression was associated with increased T2D complications and mortality. We urgently need to clarify the causal relationship between depression and T2D. The discrepancies across these studies might be caused by residual confounders.
There are several underlying mechanisms that support that MD and depression could increase the incidence rate of T2D. Depression mostly occurs in early adulthood and is associated with self-neglect and inferiority, which may increase the risk of unhealthy lifestyles such as high BMI, poor diet, low levels of physical activity, and smoking, all of which in turn increase the risk of developing T2D (30). Studies (31, 32) showed that patients with depression and subthreshold depression often suffered from poorer self-care and poor lifestyle self-management such as diet, exercise, and managing elevated blood sugar levels. Patients with MD usually have an overactive hypothalamus pituitary adrenal (HPA) axis. An important function of the HPA axis is to stimulate cortisol secretion and promote gluconeogenesis (33). Other studies have shown that the insulin sensitivity of patients with MD is impaired, leading to increased blood sugar, and eventually leading to diabetes (34). Another study (35) that recruited 703 patients with MD showed that the prevalence of T2D in the MD was 21.2%, and it showed that being male, having hypertension, hypertriglyceridemia, BMI ≥30kg/m², and age ≥50 years old were significant risk factors for T2D in MD, and most of the risk factors for T2D were reversible. Antidepressant drugs (ADs), such as tricyclic antidepressants, mirtazapine, and sertraline, taken by depressed patients affect blood sugar and are associated with a higher risk of developing T2D. The pharmacological mechanism may be the higher degrees of occupancy on muscarinic receptors and H(1). Most studies published in the past two decades have not reported the positive effect of ADs on blood sugar control in diabetic patients (36, 37). In summary, we believe that both short-term depressive status and MD will increase the risk of T2D.
Although our results showed that there was no causal relationship between T2D and depression, T2D might have an impact on the progress of MD and depressive status. Several potential pathways between T2D and depression have been widely accepted, one of which is that the use of diabetes drugs will increase the incidence rate of depression, including the use of insulin, sulfonylurea drugs, and high-dose metformin (38). A study (25) found that T2D patients had a higher risk of developing MD, and as the number of risk factors within the recommended target range increased, the additional risk of developing MD decreased, which may be related to unhealthy lifestyles. Our study had both advantages and limitations. In order to avoid the influence of mixed risk factors, in the current study, we applied MR analysis. Due to its research design, it reveals causal relationships other than bias, which strengthens the causal inference of the association between depression and renal T2D risk. The study did not find a reverse causal relationship. Our research also has some limitations. Most of the samples in our research were from Europe. We still need further evidence to evaluate the relationship in other countries with different economic statuses and spanning additional ancestral backgrounds.
Conclusion
Our study supports a causal relationship between MD and depressive status and the risk of developing T2D, while no causal relationship was found in the reverse direction. These findings highlight the importance of monitoring T2D risk in patients with depression, suggesting a need for regular screening and preventive measures in this population.
Data availability statement
Publicly available datasets were analyzed in this study. This data can be found here: https://www.finngen.fi/en; https://www.ukbiobank.ac.uk.
Author contributions
SH: Data curation, Formal analysis, Supervision, Writing – review & editing, Writing – original draft. KL: Writing – original draft, Project administration, Writing – review & editing. DZ: Project administration, Resources, Writing – review & editing. LC: Investigation, Resources, Software, Writing – review & editing.
Funding
The author(s) declare that no financial support was received for the research, authorship, and/or publication of this article.
Conflict of interest
The authors declare that the research was conducted in the absence of any commercial or financial relationships that could be construed as a potential conflict of interest.
Publisher’s note
All claims expressed in this article are solely those of the authors and do not necessarily represent those of their affiliated organizations, or those of the publisher, the editors and the reviewers. Any product that may be evaluated in this article, or claim that may be made by its manufacturer, is not guaranteed or endorsed by the publisher.
Abbreviations
T2D, Type 2 diabetes; MR, Mendelian randomization; SNPs, Single-nucleotide polymorphisms; MD, Major depression; IVW, Inverse variance weighted; GWAS, Genome-wide association study; BMI, Body mass index; MRC-IEU, Medical research council-integrative epidemiology unit; MR-PRESSO, MR pleiotropy residual sum and outlier; OR, Odds ratios; CI, Confidence intervals; HPA, Hypothalamus pituitary adrenal; ADs, Antidepressant drugs.
References
1. Zimmet PZ. Diabetes and its drivers: the largest epidemic in human history? Clin Diabetes Endocrinol. (2017) 3:1. doi: 10.1186/s40842-016-0039-3
2. Sun H, Saeedi P, Karuranga S, Pinkepank M, Ogurtsova K, Duncan BB, et al. IDF Diabetes Atlas: Global, regional and country-level diabetes prevalence estimates for 2021 and projections for 2045. Diabetes Res Clin Pract. (2022) 183:109119. doi: 10.1016/j.diabres.2021.109119
3. Mizukami H, Kudoh K. Diversity of pathophysiology in type 2 diabetes shown by islet pathology. J Diabetes Investig. (2022) 13(1):6–13. doi: 10.1111/jdi.13679
4. Al-Ozairi E, Al Ozairi A, Blythe C, Taghadom E, Ismail K. The epidemiology of depression and diabetes distress in type 2 diabetes in Kuwait. J Diabetes Res. (2020) 2020:7414050. doi: 10.1155/2020/7414050
5. Rehm J, Shield KD. Global burden of disease and the impact of mental and addictive disorders. Curr Psychiatry Rep. (2019) 21:10. doi: 10.1007/s11920-019-0997-0
6. Cuschieri S, Mamo J. Are normoglycaemic individuals at risk of depression? The depression-dysglycaemic phenotype from a European population-based cross-sectional study. Arch Public Health. (2020) 78:111. doi: 10.1186/s13690-020-00495-y
7. Dibato J, Montvida O, Ling J, Koye D, Polonsky WH, Paul SK. Temporal trends in the prevalence and incidence of depression and the interplay of comorbidities in patients with young- and usual-onset type 2 diabetes from the USA and the UK. Diabetologia. (2022) 65(12):2066–77. doi: 10.1007/s00125-022-05764-9
8. Ning F, Zhang D, Xue B, Zhang L, Zhang J, Zhu Z, et al. Synergistic effects of depression and obesity on type 2 diabetes incidence in Chinese adults. J Diabetes. (2020) 12(2):142–50. doi: 10.1111/1753-0407.12968
9. Tabák AG, Akbaraly TN, Batty GD, Kivimäki M. Depression and type 2 diabetes: a causal association? Lancet Diabetes Endocrinol. (2014) 2(3):236–45.doi: 10.1016/S2213-8587(13)70139-6
10. Loos RJF, Yeo GSH. The genetics of obesity: from discovery to biology. Nat Rev Genet. (2022) 23:120–33. doi: 10.1038/s41576-021-00414-z
11. Yuan S, Larsson SC. An atlas on risk factors for type 2 diabetes: a wide-angled Mendelian randomisation study. Diabetologia. (2020) 63:2359–71. doi: 10.1007/s00125-020-05253-x
12. Howard DM, Adams MJ, Clarke T-K, Hafferty JD, Gibson J, Shirali M, et al. Genome-wide meta-analysis of depression identifies 102 independent variants and highlights the importance of the prefrontal brain regions. Nat Neurosci. (2019) 22(3):343–52. doi: 10.1038/s41593-018-0326-7
13. Xue A, Wu Y, Zhu Z, Zhang F, Kemper KE, Zheng Z, et al. Genome-wide association analyses identify 143 risk variants and putative regulatory mechanisms for type 2 diabetes. Nat Commun. (2018) 9(1):2941. doi: 10.1038/s41467-018-04951-w
14. Evangelou E, Warren HR, Mosen-Ansorena D, Mifsud B, Pazoki R, Gao H, et al. Genetic analysis of over 1 million people identifies 535 new loci associated with blood pressure traits. Nat Genet. (2018) 50(10):1412–25. doi: 10.1038/s41588-018-0205-x
15. Davies NM, Holmes MV, Davey Smith G. Reading Mendelian randomisation studies: a guide, glossary, and checklist for clinicians. BMJ. (2018) 362:k601. doi: 10.1136/bmj.k601
16. Burgess S, Butterworth A, Thompson SG. Mendelian randomization analysis with multiple genetic variants using summarized data. Genet Epidemiol. (2013) 37:658–65. doi: 10.1002/gepi.21758
17. Bowden J, Davey Smith G, Burgess S. Mendelian randomization with invalid instruments: effect estimation and bias detection through Egger regression. Int J Epidemiol. (2015) 44:512–25. doi: 10.1093/ije/dyv080
18. Bowden J, Davey Smith G, Haycock PC, Burgess S. Consistent estimation in mendelian randomization with some invalid instruments using a weighted median estimator. Genet Epidemiol. (2016) 40(4):304–14. doi: 10.1002/gepi.21965
19. Hartwig FP, Davey Smith G, Bowden J. Robust inference in summary data Mendelian randomization via the zero modal pleiotropy assumption. Int J Epidemiol. (2017) 46:1985–98. doi: 10.1093/ije/dyx102
20. Verbanck M, Chen C-Y, Neale B, Do R. Detection of widespread horizontal pleiotropy in causal relationships inferred from Mendelian randomization between complex traits and diseases. Nat Genet. (2018) 50(5):693–8. doi: 10.1038/s41588-018-0099-7
21. Bowden J, Del Greco MF, Minelli C, Zhao Q, Lawlor DA, Sheehan NA, et al. Improving the accuracy of two-sample summary-data Mendelian randomization: moving beyond the NOME assumption. Int J Epidemiol. (2019) 48(3):728–42. doi: 10.1093/ije/dyy258
22. Pierce BL, Ahsan H, Vanderweele TJ. Power and instrument strength requirements for Mendelian randomization studies using multiple genetic variants. Int J Epidemiol. (2011) 40:740–52. doi: 10.1093/ije/dyq151
23. Hemani G, Zheng J, Elsworth B, Wade KH, Haberland V, Baird D, et al. The MR-Base platform supports systematic causal inference across the human phenome. Elife. (2018) 7:e34408. doi: 10.7554/eLife.34408
24. Yavorska OO, Burgess S. MendelianRandomization: an R package for performing Mendelian randomization analyses using summarized data. Int J Epidemiol. (2017) 46:1734–9. doi: 10.1093/ije/dyx034
25. van Gennip ACE, Schram MT, Köhler S, Kroon AA, Koster A, Eussen SJPM, et al. Association of type 2 diabetes according to the number of risk factors within the recommended range with incidence of major depression and clinically relevant depressive symptoms: a prospective analysis. Lancet Healthy Longev. (2023) 4(2):e63–71. doi: 10.1016/S2666-7568(22)00291-4
26. Graham E, Watson T, Deschênes SS, Filion KB, Henderson M, Harper S, et al. Depression-related weight change and incident diabetes in a community sample. Sci Rep. (2021) 11:13575. doi: 10.1038/s41598-021-92963-w
27. Bergmans RS, Rapp A, Kelly KM, Weiss D, Mezuk B. Understanding the relationship between type 2 diabetes and depression: lessons from genetically informative study designs. Diabetes Med. (2021) 38:e14399. doi: 10.1111/dme.14399
28. Rohde C, Nielsen JS, Schöllhammer Knudsen J, Thomsen RW, Østergaard SD. Risk factors associated with mortality among individuals with type 2 diabetes and depression across two cohorts. Eur J Endocrinol. (2022) 187(4):567–77. doi: 10.1530/EJE-22-0466
29. Messina R, Iommi M, Rucci P, Reno C, Fantini MP, Lunghi C, et al. Is it time to consider depression as a major complication of type 2 diabetes? Evidence from a large population-based cohort study. Acta Diabetol. (2022) 59(1):95–104. doi: 10.1007/s00592-021-01791-x
30. Katon WJ, Lin EH, Russo J, Von Korff M, Ciechanowski P, Simon G, et al. Cardiac risk factors in patients with diabetes mellitus and major depression. J Gen Intern Med. (2004) 19:1192–9. doi: 10.1111/j.1525-1497.2004.30405.x
31. Jiang R, Ta X, Xu M, Luo Z, Du Y, Zhong X, et al. Mediating role of depression between diabetes management self-efficacy and diabetes self-care behavior among elderly type 2 diabetes mellitus patients in China. Psychol Res Behav Manage. (2023) 16:1545–55. doi: 10.2147/PRBM.S396916
32. Shrestha M, Ng A, Paudel R, Gray R. Association between subthreshold depression and self-care behaviours in adults with type 2 diabetes: A cross-sectional study. J Clin Nurs. (2021) 30:2462–8. doi: 10.1111/jocn.15741
33. Mikulska J, Juszczyk G, Gawrońska-Grzywacz M, Herbet M. HPA axis in the pathomechanism of depression and schizophrenia: new therapeutic strategies based on its participation. Brain Sci. (2021) 11(10):1298. doi: 10.3390/brainsci11101298
34. Weber B, Schweiger U, Deuschle M, Heuser I. Major depression and impaired glucose tolerance. Exp Clin Endocrinol Diabetes. (2000) 108:187–90. doi: 10.1055/s-2000-7742
35. Hein M, Lanquart J-P, Loas G, Hubain P, Linkowski P. Prevalence and risk factors of type 2 diabetes in major depression: A study on 703 individuals referred for sleep examinations. Psychosomatics. (2018) 59:144–57. doi: 10.1016/j.psym.2017.11.003
36. Martins LB, Braga Tibães JR, Berk M, Teixeira AL. Diabetes and mood disorders: shared mechanisms and therapeutic opportunities. Int J Psychiatry Clin Pract. (2022) 26:183–95. doi: 10.1080/13651501.2021.1957117
37. Siafis S, Papazisis G. Detecting a potential safety signal of antidepressants and type 2 diabetes: a pharmacovigilance-pharmacodynamic study. Br J Clin Pharmacol. (2018) 84:2405–14. doi: 10.1111/bcp.13699
Keywords: major depression, depressive status, type 2 diabetes, Mendelian randomization, casual relationship
Citation: Liu K, Zhou D, Chen L and Hao S (2024) Depression and type 2 diabetes risk: a Mendelian randomization study. Front. Endocrinol. 15:1436411. doi: 10.3389/fendo.2024.1436411
Received: 23 May 2024; Accepted: 05 August 2024;
Published: 29 August 2024.
Edited by:
Vinod Tiwari, Indian Institute of Technology (BHU), IndiaReviewed by:
Hagera Dilnashin, Indian Institute of Technology Roorkee, IndiaAnkit Uniyal, Johns Hopkins University, United States
Copyright © 2024 Liu, Zhou, Chen and Hao. This is an open-access article distributed under the terms of the Creative Commons Attribution License (CC BY). The use, distribution or reproduction in other forums is permitted, provided the original author(s) and the copyright owner(s) are credited and that the original publication in this journal is cited, in accordance with accepted academic practice. No use, distribution or reproduction is permitted which does not comply with these terms.
*Correspondence: Sida Hao, aGFvc2lkYUB6anUuZWR1LmNu
 Kaiyuan Liu
 Diyi Zhou1
 Sida Hao