 Yi Fang
 Xiaoqing Yuan
 Qing Zhang
 Juan Liu1
 Xinhua Ye
- 1Department of Endocrinology, The Affiliated Changzhou No. 2 People’s Hospital of Nanjing Medical University, Changzhou, China
- 2Changzhou Medical Center, The Affiliated Changzhou No. 2 People’s Hospital of Nanjing Medical University, Changzhou, China
Background: Past studies have demonstrated that diabetic neuropathy is related to sarcopenia, but the further causal relation is still unclear. We sought to investigate the causal relationship by combining data from cross-sectional and Mendelian randomization (MR) studies.
Methods: The genome-wide association studies data were collected from the UK Biobank and the European Working Group on Sarcopenia to conduct a bi-directional two-sample MR study to explore the causality between diabetic neuropathy and relevant clinical traits of sarcopenia, including appendicular lean mass (ALM), walking speed and low hand grip strength. The inverse-variance weighted and various sensitivity analyses were used to obtain MR estimates. We also enrolled a total of 196 Type 2 diabetes patients from April 2021 to April 2024 and divided them into the Distal peripheral neuropathy (DPN) group (n=51) and non-DPN group (n=145) via vibration perception threshold (VPT) and neuropathy deficit score. Logistic regression and ROC curve analysis were used to investigate the relationship between DPN and relevant sarcopenia clinical features.
Results: According to a forward MR analysis, decreased walking speed (OR: 0.04, 95% confidence interval (CI): 0.01-0.16; P<0.001) and increased ALM (1.25 [1.05-1.50], P=0.012) had a causal effect on developing diabetic neuropathy. According to reverse MR results, developing diabetic neuropathy had a causal effect on decreased walking speed (0.99 [0.99-1.00], P=0.007) and low grip strength (1.05 [1.02-1.08], P<0.001). The cross-sectional study showed that 5-time stand time (P=0.002) and 6-meter walking speed (P=0.009) had an inverse association with DPN. Additionally, we discovered that ASMI (P=0.030) and 5-time stand time (P=0.013) were separate risk factors for DPN.
Conclusion
The MR study suggested that diabetic neuropathy may have a causality with relevant clinical traits of sarcopenia, and our cross-sectional study further proved that sarcopenia indexes are predictors of diabetic neuropathy.
Introduction
Type 2 diabetes (T2DM) is a chronic disease established primarily by disturbances in glucose metabolism, accompanied by metabolic disorders in fats, proteins, and other aspects (1). Diabetic neuropathy is a prevalent form of neuropathy, affecting approximately half of all diabetes patients, resulting in significant mortality rates and imposing substantial economic burdens. diabetic neuropathy is a common chronic complication of T2DM, that primarily affects the peripheral nervous system, leading to disruptions in in motor, sensory, and autonomic nerve functions (2). Distal peripheral neuropathy (DPN) is a type of diabetic neuropathy affecting the peripheral nerves, primarily manifesting as tingling, numbness, and weakness in the hands and feet due to diabetes. It can result in foot infections, foot ulcers, gangrene, and even amputation, significantly impacting the patient’s quality of life and serving as a major cause of disability and death (3, 4). Nerve conduction tests serve as the current gold standard for diagnosing DPN. Nonetheless, they are lengthy, costly, and challenging to incorporate into regular clinical practice. So clinical screening for diabetic neuropathy relies mainly on five examinations, including vibration perception, pinprick sensation, ankle reflex, pressure sensation, and temperature sensation (5, 6).
The vibrating perception threshold (VPT) test, due to its non-invasiveness, convenience, economy, and quantitative advantages, has become a crucial tool for diagnosing and assessing DPN, both domestically and internationally (7–10). The sensitivity of VPT in diagnosing DPN ranges from 77.3% to 100.0%, with a specificity of 72.8% to 81.0%, and it has been widely applied in clinical research related to DPN (11–13).
Sarcopenia refers to the phenomenon where muscle function and mass gradually decrease with increasing age (14). Sarcopenia is closely associated with mobility impairment, falls, low bone density, and metabolic disorders, making it a significant cause and manifestation of physiological decline in older adults. It can impact their quality of life and increase hospitalization rates and medical expenses for them (15). A large community study in the Czech Republic revealed that direct medical costs for older adults with sarcopenia were more than twice as high as those without sarcopenia (16). Another study demonstrated that sarcopenia is associated with increased hospital costs (17).
Recently, the relationship between sarcopenia and diabetic neuropathy has garnered significant attention. Studies have increasingly highlighted a strong association between these two conditions. Henning et al. reported that individuals with diabetes exhibit reduced lower limb muscle volume, which may be linked to the severity of neuropathy (18). Christer et al. suggested that impaired nerve function can lead to denervation and a consequent decrease in muscle strength (19). Similarly, Giorgio et al. indicated that DPN affects muscles by impairing motor nerve conduction (20). Cloin et al., revealed a significant reduction in both muscle mass and contractile strength in patients with DPN (21). Yasemin et al., indicated that Sarcopenia increases the risk of developing diabetic neuropathy (22). While another study proposed that diabetic neuropathy might be a potential risk factor for sarcopenia (23). Furthermore, a systematic review and meta-analysis confirmed a significant association between DPN and sarcopenia (24). Although previous studies have shown a significant association between diabetic neuropathy and sarcopenia, no research has definitively proven a causality between them.
Mendelian randomization (MR) utilizes genetic variants, typically single-nucleotide polymorphisms (SNPs), as instrumental variables to determine the causality between lifelong exposure and disease outcomes. This method is highly reliable because it is less prone to reverse causality and residual confounding factors. Unlike the associations derived from traditional cross-sectional studies, the causality drawn from MR analyses are considered more reliable, especially when their results align with those of conventional cross-sectional studies (25, 26). Therefore, we carried out a MR study to resolve this dispute and conducted a cross-sectional study between DPN and sarcopenia to further provide the relationship between them. This research may offer a theoretical foundation for preventing these two conditions.
Materials and methods
Mendelian randomization analysis design
Based on the STROBE-MR guidelines, we used genetic variants as IVs for the MR analysis in this current study (25). The MR analysis utilizes instrumental variables (IVs) based on genetic variation. The three fundamental assumptions of MR studies are (1): the relevance assumption, which posits that genetic variants are associated with the risk factor (2); the independence assumption, which asserts that the genetic variant is independent of confounders; and (3) the exclusion restriction, meaning the genetic variant affects the outcome solely through the risk factor. The specific details of each method are described in detail by Liu et al (27). The framework of the current MR study was described in Figure 1.
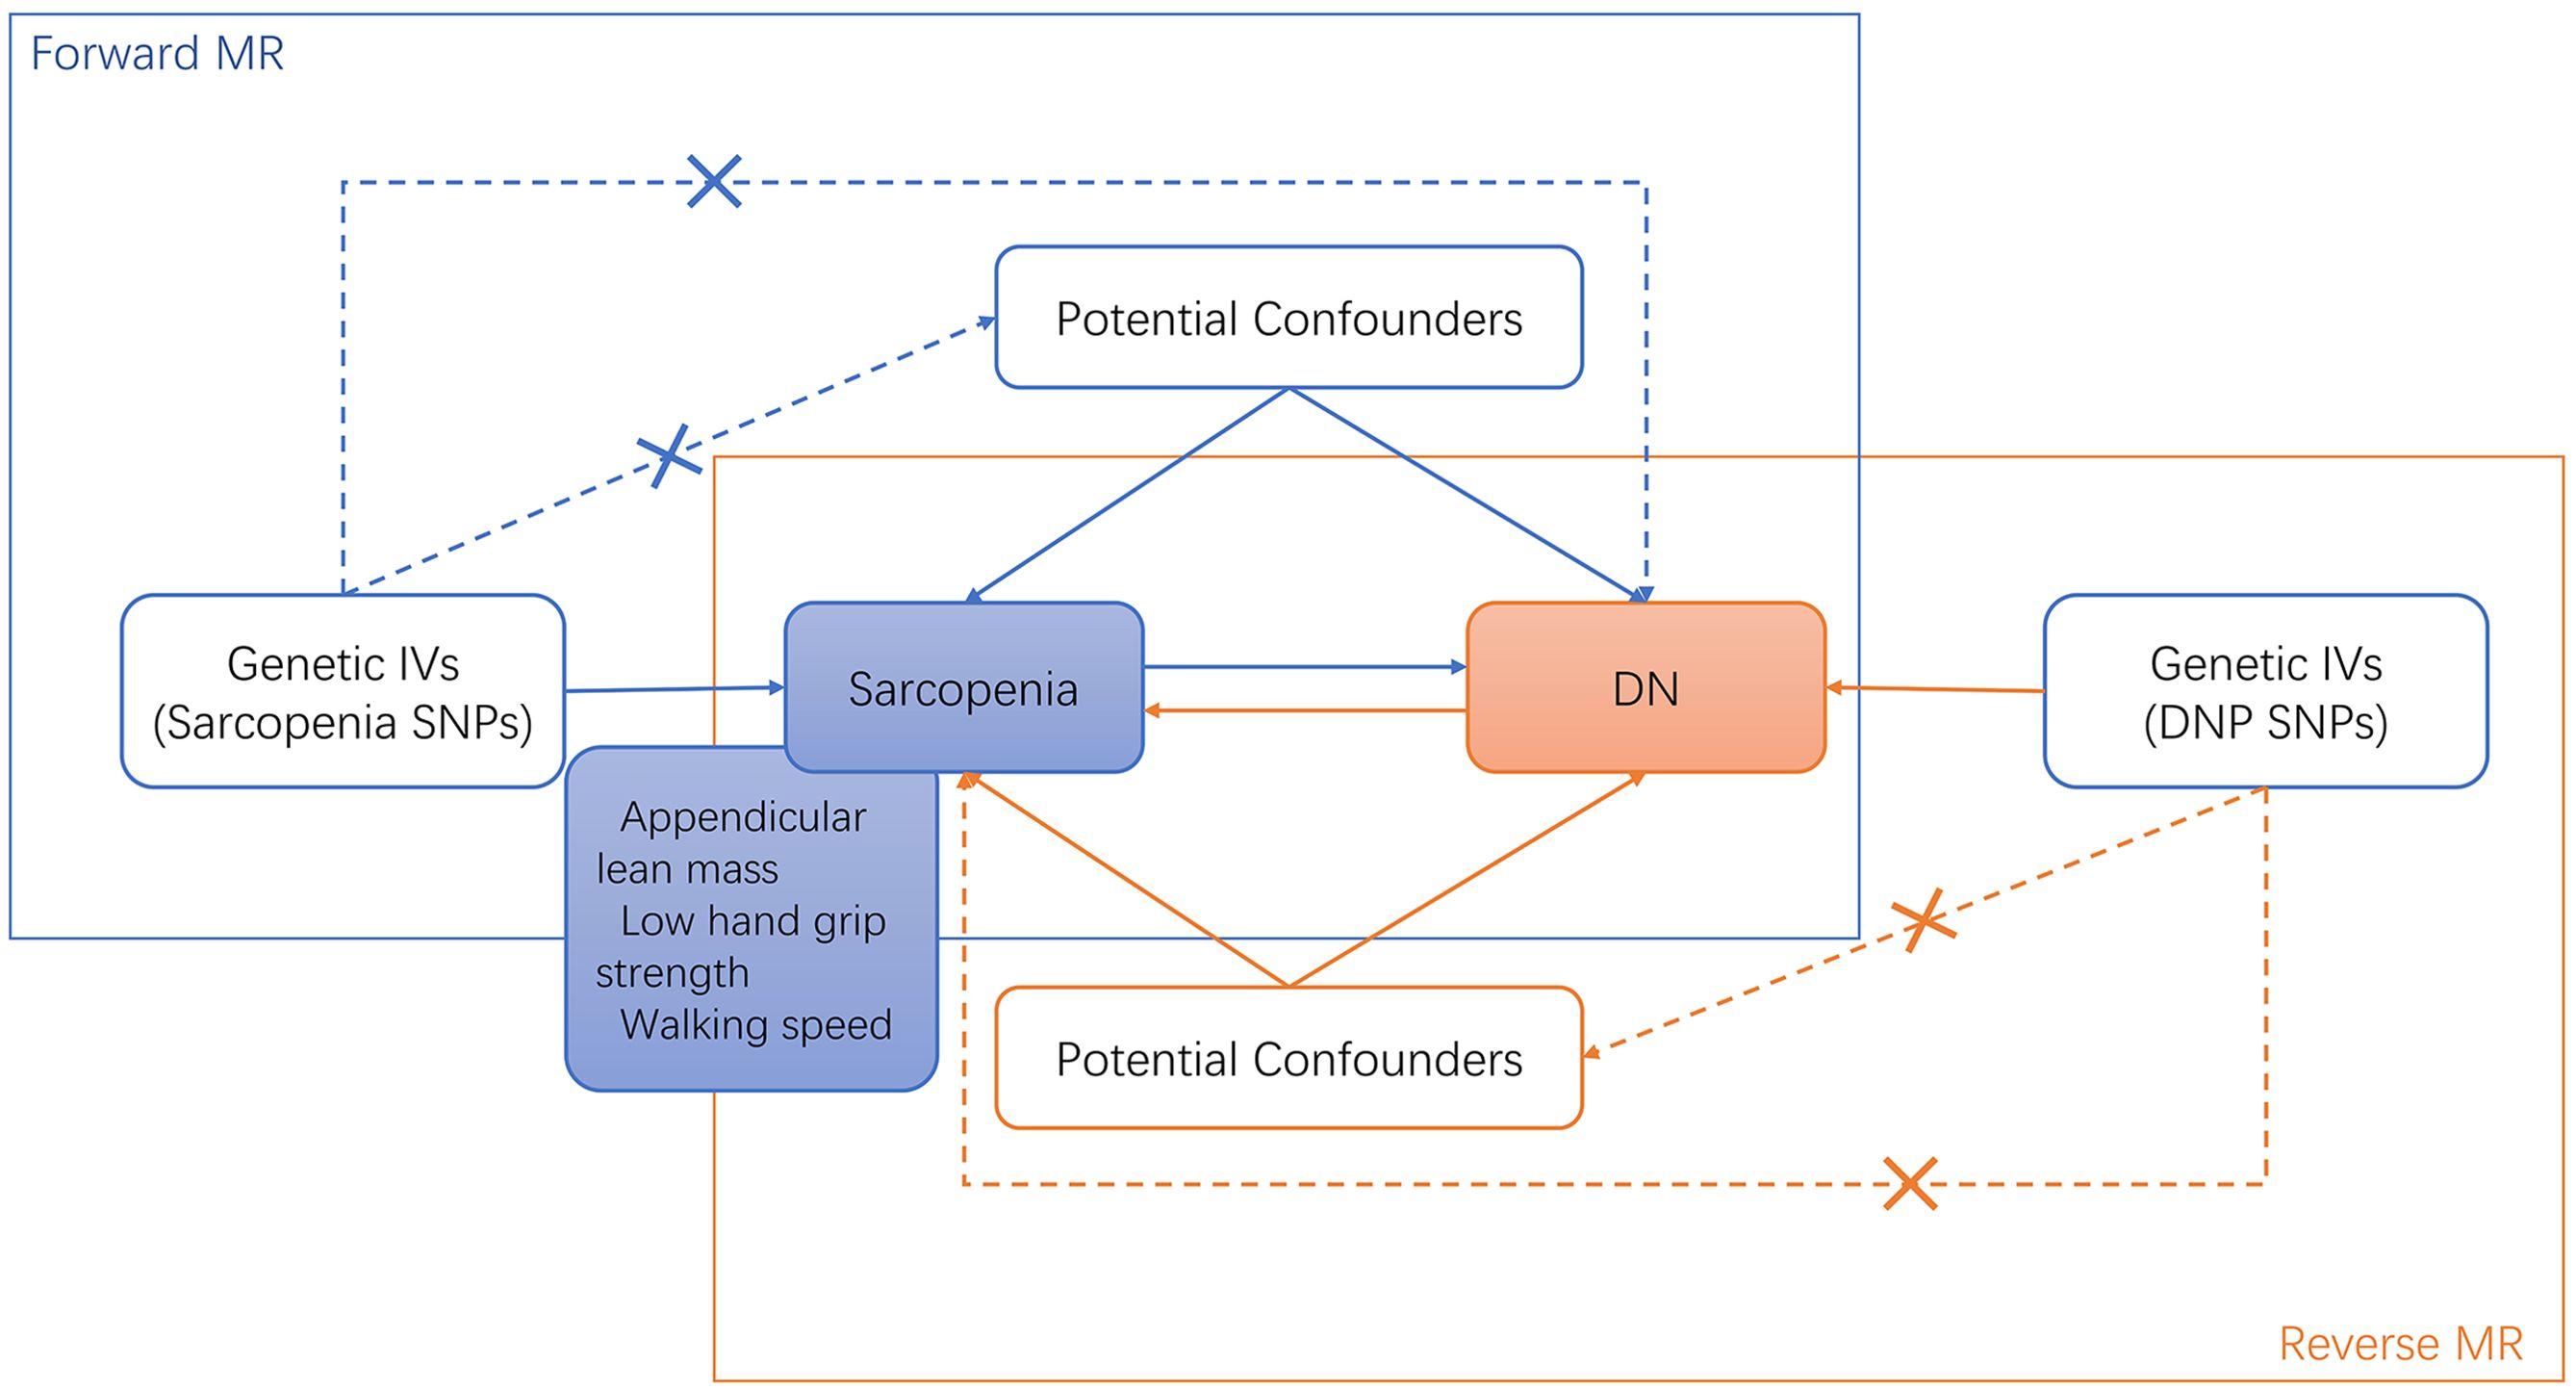
Figure 1. Bi-directional MR study analysis design of sarcopenia and diabetic neuropathy. IVs, instrumental variants; SNP, single nucleotide polymorphism; DN, diabetic neuropathy.
Data sources description
Aggregate grip strength data collected from genome-wide association Studies (GWAS) came from a meta-analysis involving 22 cohorts of 256,523 Europeans aged 60 years or older (28). Sarcopenia was identified in 48,596 participants (18.9%) based on EWGSOP criteria (grip strength <30 kg for men and <20 kg for women). Appendicular lean mass (ALM) data for 450,243 patients and walking speed data for 459,915 patients were collected from the UK Biobank’s GWAS database and pooled for analysis (29). Additionally, GWAS summary data for diabetic neuropathy were obtained from the IEU Open GWAS project, including 1,415 European cases and 162,201 European controls. The details of the GWAS data included in this study were shown in Supplementary Material 1.
Selection of genetic instrumental variables
To screen for SNPs that fit the MR Hypothesis, a series of approaches were taken. First, SNPs associated with sarcopenia-related clinical traits need to reach a threshold of P < 5 × 10⁻⁸ to achieve genome-wide significance. To enlarge SNPs, the threshold of diabetic neuropathy-related SNPs was expanded to P < 5 × 10⁻⁶ according to research by Liu et al (27). Then, SNPs in strong LD were excluded by using the linkage disequilibrium (LD) clustering algorithm with r2 < 0.001, aggregation distance = 10,000 kb, and value of P < 5 × 10⁻⁸ (30). Furthermore, the F statistic was used to test the strength of the allele scores as instruments, the calculation formula is as follows:
N is the sample size of the exposed dataset, K is the number of SNPs, R2 is the proportion of the variation explained by SNPs, and F < 10 was excluded (31). After removing SNPs, the MR Pleiotropy RESidual Sum and Outlier (MR-PRESSO)
method (3000 repeated settings) was used to find potential outliers (32). Subsequently, palindromic SNPs were removed by combining the exposed datasets with DN datasets. Through these rigorous screening, the remaining SNPs were used for subsequent analysis. Detailed information on these SNPs can be found in Supplementary Materials 2–7.
MR statistical analysis and data visualization
The bias of the weak instrumental variables was evaluated by calculating the F-statistic. The formula for calculating F-statistic was consistent with Burgess et al (31),. F > 10 was considered indicative of a strong instrumental variable (31). We used the MR-PRESSO method (3000 repeated settings) to find outliers (32). Then outliers were eliminated so that the data could be re-evaluated.
In the MR analysis, the inverse variance weighted (IVW) approach is known for its efficiency and minimal bias in estimating causal effects, provided that the underlying assumptions are met (33). Additionally, the weighted median method was utilized in this analysis. The weighted median method calculates the causal effect by taking the median of the estimates from individual instrumental variables, weighted by the inverse of their variance (34). This robust approach provides reliable causal estimates even if up to 50% of the genetic instruments are invalid or influenced by pleiotropy (35, 36). To supplement the analysis, the MR egger, MR egger (bootstrap) and weighted mode methods were also applied as additional reference standards.
We performed a series of sensitivity analyses, including Cochran’s Q test, MR Egger intercept test, and leave-one-out analysis, to measure the dependability of the results. Heterogeneity was also determined using Cochran’s Q test. Pleiotropy was evaluated using the MR-Egger intercept test and the Leave-one-out analysis. The “TwoSampleMR” and “MR-PRESSO” packages of the R software (version 4.3.1) were used to implement all MR analyses as well as sensitivity analyses.
Clinical study data
A total of 196 hospitalized patients with T2DM, aged 60 to 80 years, who underwent VPT examinations at our department from April 2021 to April 2024 were included in this study. Then we then excluded patients that met any of the following criteria (1): severe liver conditions (liver enzyme ALT≥3-fold the upper limit of normal range) (n = 2) (2); severe renal dysfunction (estimated glomerular filtration rate [eGFR]<30 mL/min/1.73m2) (3); respiratory insufficiency (PaO2< 60 mmHg or PaCO2> 45 mmHg) (4); sepsis (5); cognitive impairment (6); non-ambulatory (n = 3); and (7) missing clinical data (n = 15). The flowchart of the study population is presented in Figure 2.
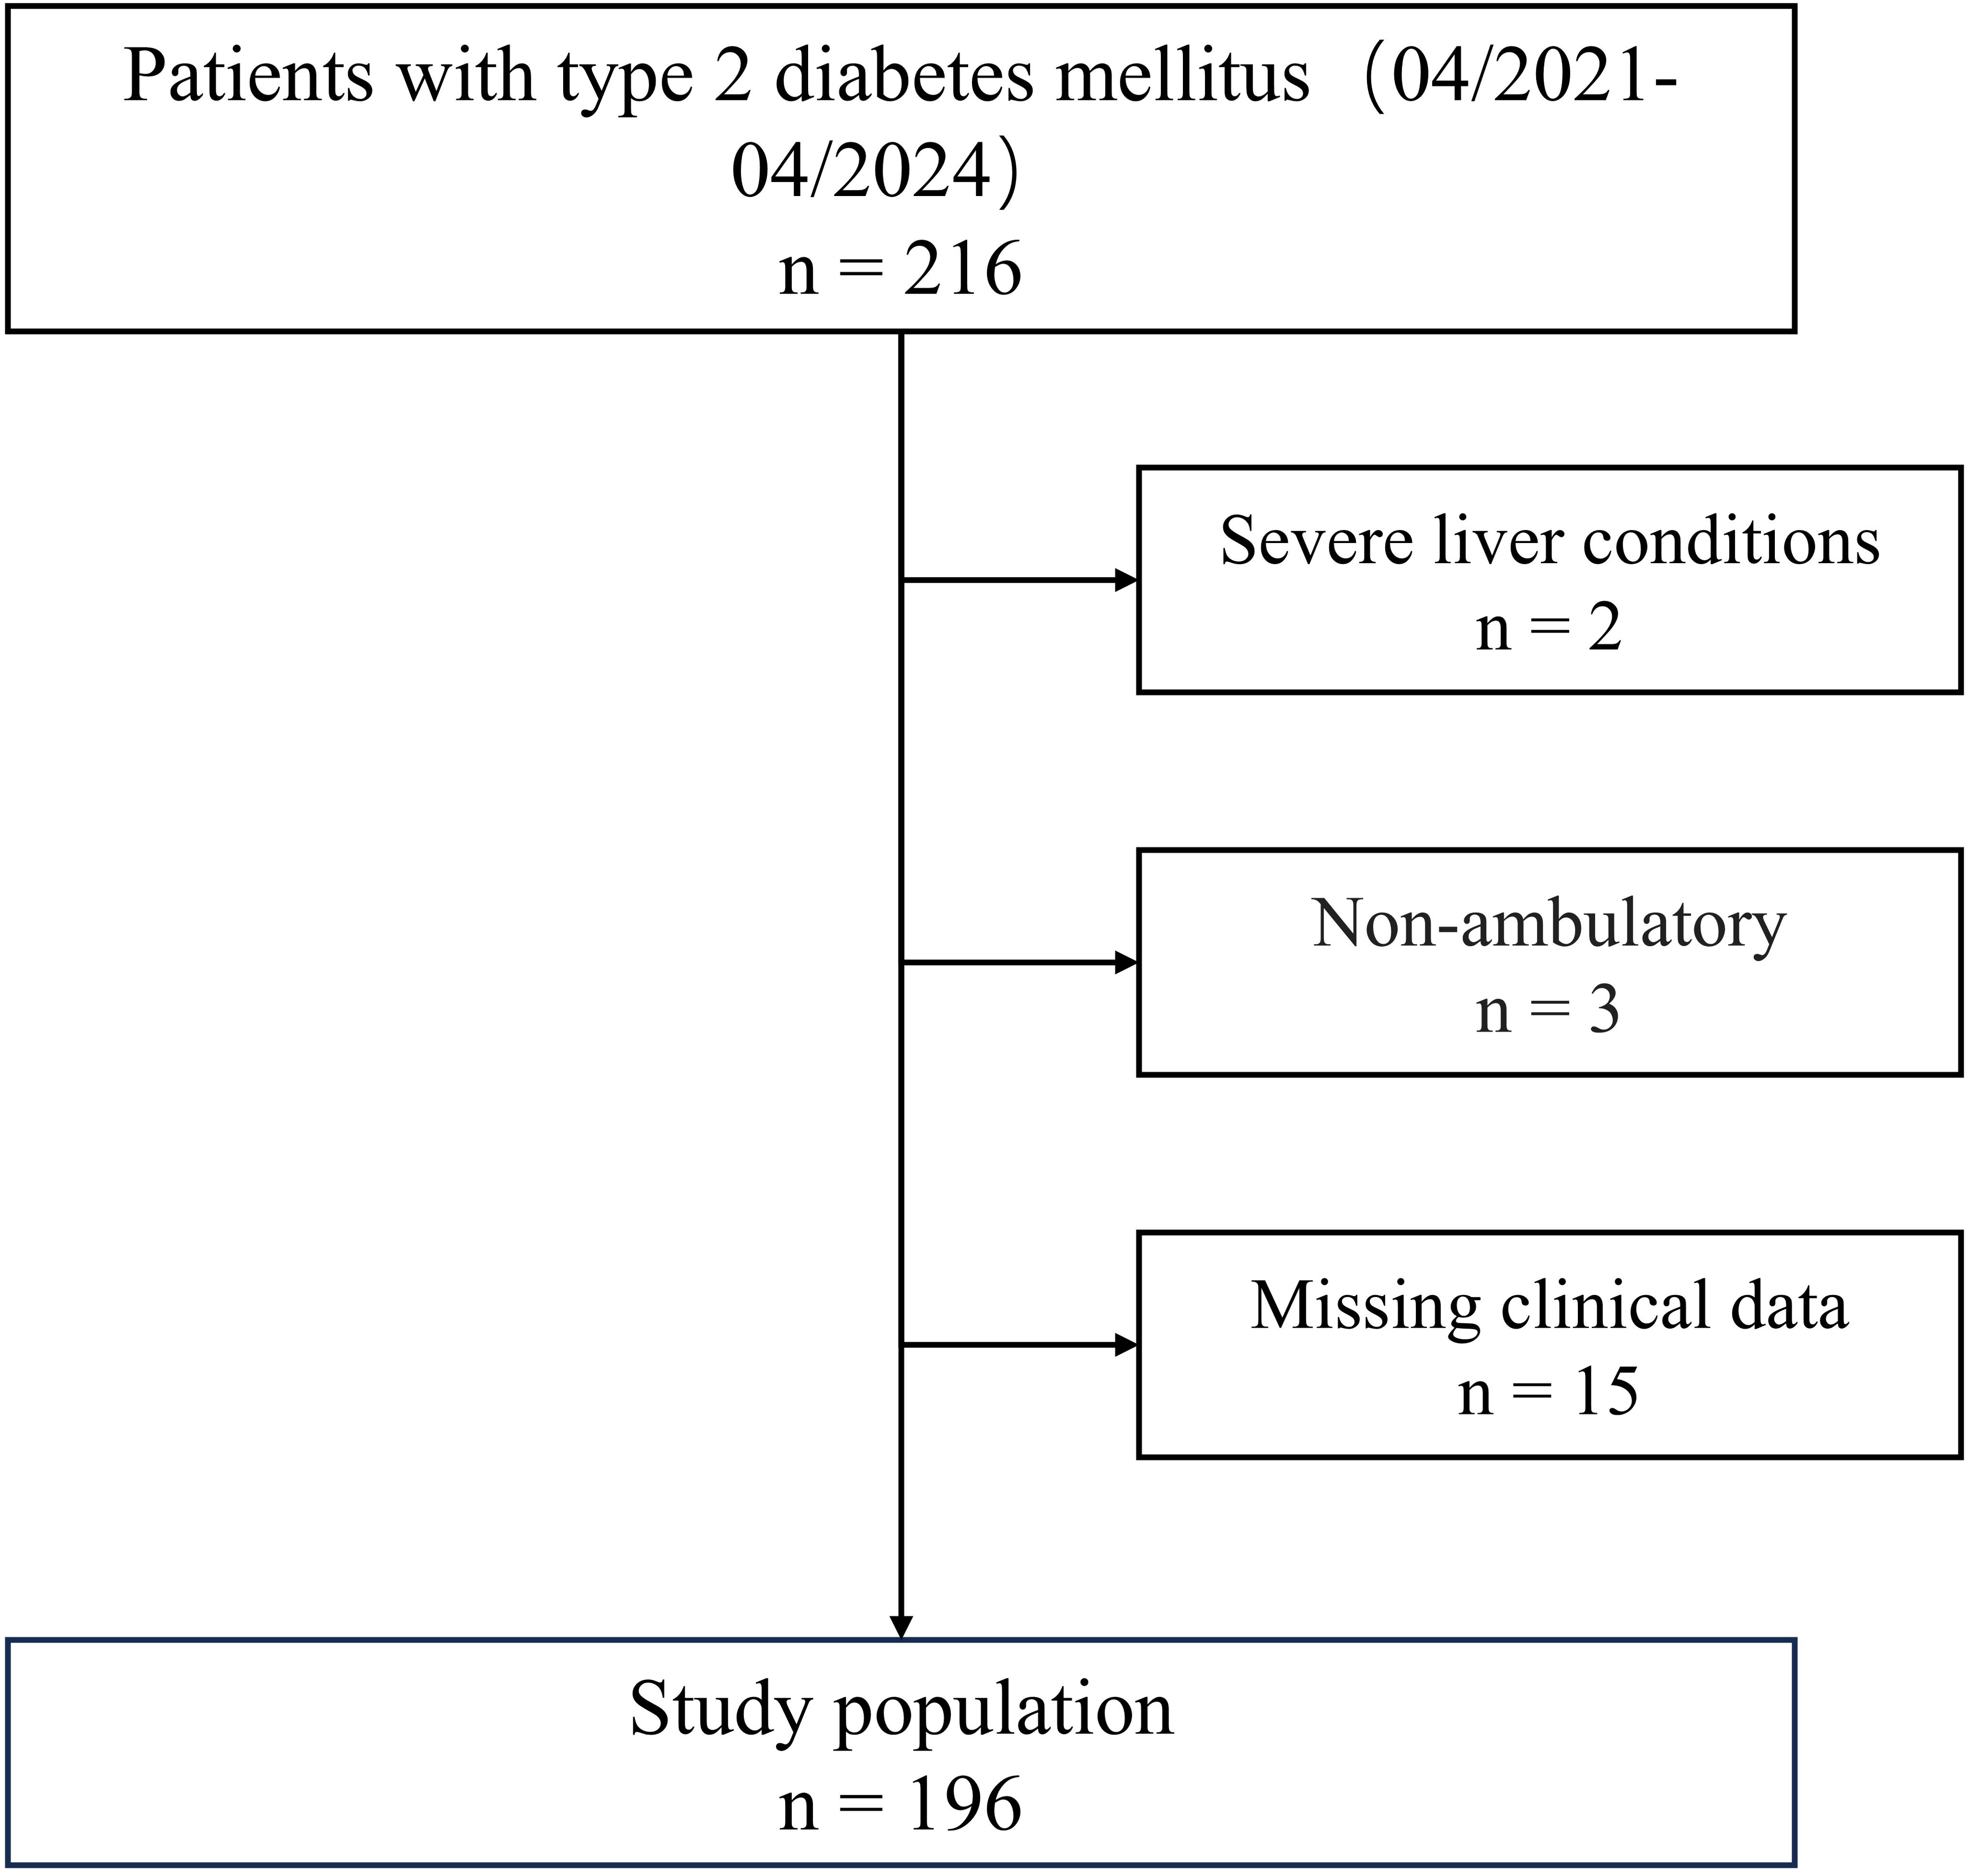
Figure 2. Flowchart of Participant Inclusion and exclusion.
All patients met the diagnostic criteria for T2DM according to the WHO 2019 diabetes guidelines. DPN was diagnosed by the American Diabetes Association’s 2005 diagnostic criteria if the vibration perception threshold VPT was over 25 volts accompanied by a positive Neuropathy Deficit Score (37). Based on these criteria, T2DM patients are categorized into DPN (n=51) and non-DPN (n=145) groups based on the results of VPT tests and clinical signs.
Medical history and anthropometric and biochemical analyses
General information was collected including the patient’s age, sex, duration of diabetes, smoking, alcohol consumption, and co-occurrence of hypertension, etc. The anthropometric analysis included weight, height, and bio-impedance analysis (Inbody Co., Ltd. Korea), and the Body mass index (BMI) was calculated accordingly. Fasting blood and morning urine samples were collected following a more than 8-hour overnight fast. Fasting plasma glucose (FPG), fasting insulin (FINS), glycated hemoglobin (HbA1c), total cholesterol (TC), triglyceride (TG), serum high-density lipoprotein (HDL-c), serum low-density lipoprotein (LDL-c), creatinine and blood urea nitrogen (BUN) were assessed by the protocol of the central laboratory.
Neuropathy evaluation
The same technician assessed VPT using Horwell Neurothesiometers (Wilford Industrial, Nottingham). The mean VPT values of both lower limbs were selected for our analysis.
Sarcopenia assessment
Technicians assessed hand grip strength with a computerized grip strength dynamometer (TSINGHUA TONGFANG, China) after requesting subjects to refrain from strenuous exercise before the measurement (38). Measurements were obtained repeatedly for every hand, and the dominant hand’s mean value was utilized for analysis. The 2019 Asian Working Group defined the relevant clinical traits of sarcopenia for Sarcopenia criteria (39). The parameter of muscle mass index was the appendicular skeletal muscle mass (ASM) divided by the height squared (m2) (ASMI). Low muscle strength and muscle mass were defined as values below the cutoffs of 28 kg and 7.0 kg/m2, respectively, for men and 18 kg and 5.7 kg/m2, respectively, for women. Criteria for low physical performance are 6-m walk <1.0 m/s or 5-time chair stand test ≥12 seconds.
Clinical study statistical analysis
Statistical analysis was performed using SPSS 25.0. Different tests were employed depending on the type of data: independent samples t-test for normally distributed measurements, Kruskal–Wallis H-test for non-normally distributed measurements, chi-square test for count data, and logistic regression model for analyzing the risk factors for DPN. Simple correlations between VPT and various factors were evaluated by Pearson or Spearman correlation analysis. All statistical tests were tailed twice, and p<0.05 was considered statistically significant.
Results
The forward MR analysis showed that parts of the relevant clinical traits of sarcopenia had causal effects on diabetic neuropathy
The forward MR analysis showed that decreased walking speed had a causal effect on developing diabetic neuropathy via IVW (OR: 0.04, 95% confidence interval (CI): 0.01-0.16; P<0.001) and weighted median analysis (0.07 [0.01-0.48], P = 0.006). And increased ALM was proved to have a causal effect on diabetic neuropathy by IVW (1.25 [1.05-1.50], P = 0.012), weighted median (1.37 [1.04-1.80], P = 0.026), weighted mode (2.08 [1.08-4.03], P = 0.030) and MR egger (bootstrap) analysis (1.47 [1.04-2.10], P = 0.017). However, low grip strength did not exhibit any direct influence on the development of diabetic neuropathy across all MR analysis methods.
To evaluate the stability and reliability of each MR method, we employed Cochran’s Q test, MR-Egger intercept test, and leave-one-out analysis. Cochran’s Q test identified heterogeneity in ALM (P < 0.05), suggesting that SNPs from different database or population may influence the result. However, it was considered acceptable due to the application of random-effects IVW as the primary method. All Egger intercept p-values > 0.05 indicated no presence of horizontal pleiotropy as per MR-Egger intercept tests. The forest plot (Figure 3) and scatter plot (Figure 4) offer a detailed depiction of all the above results.
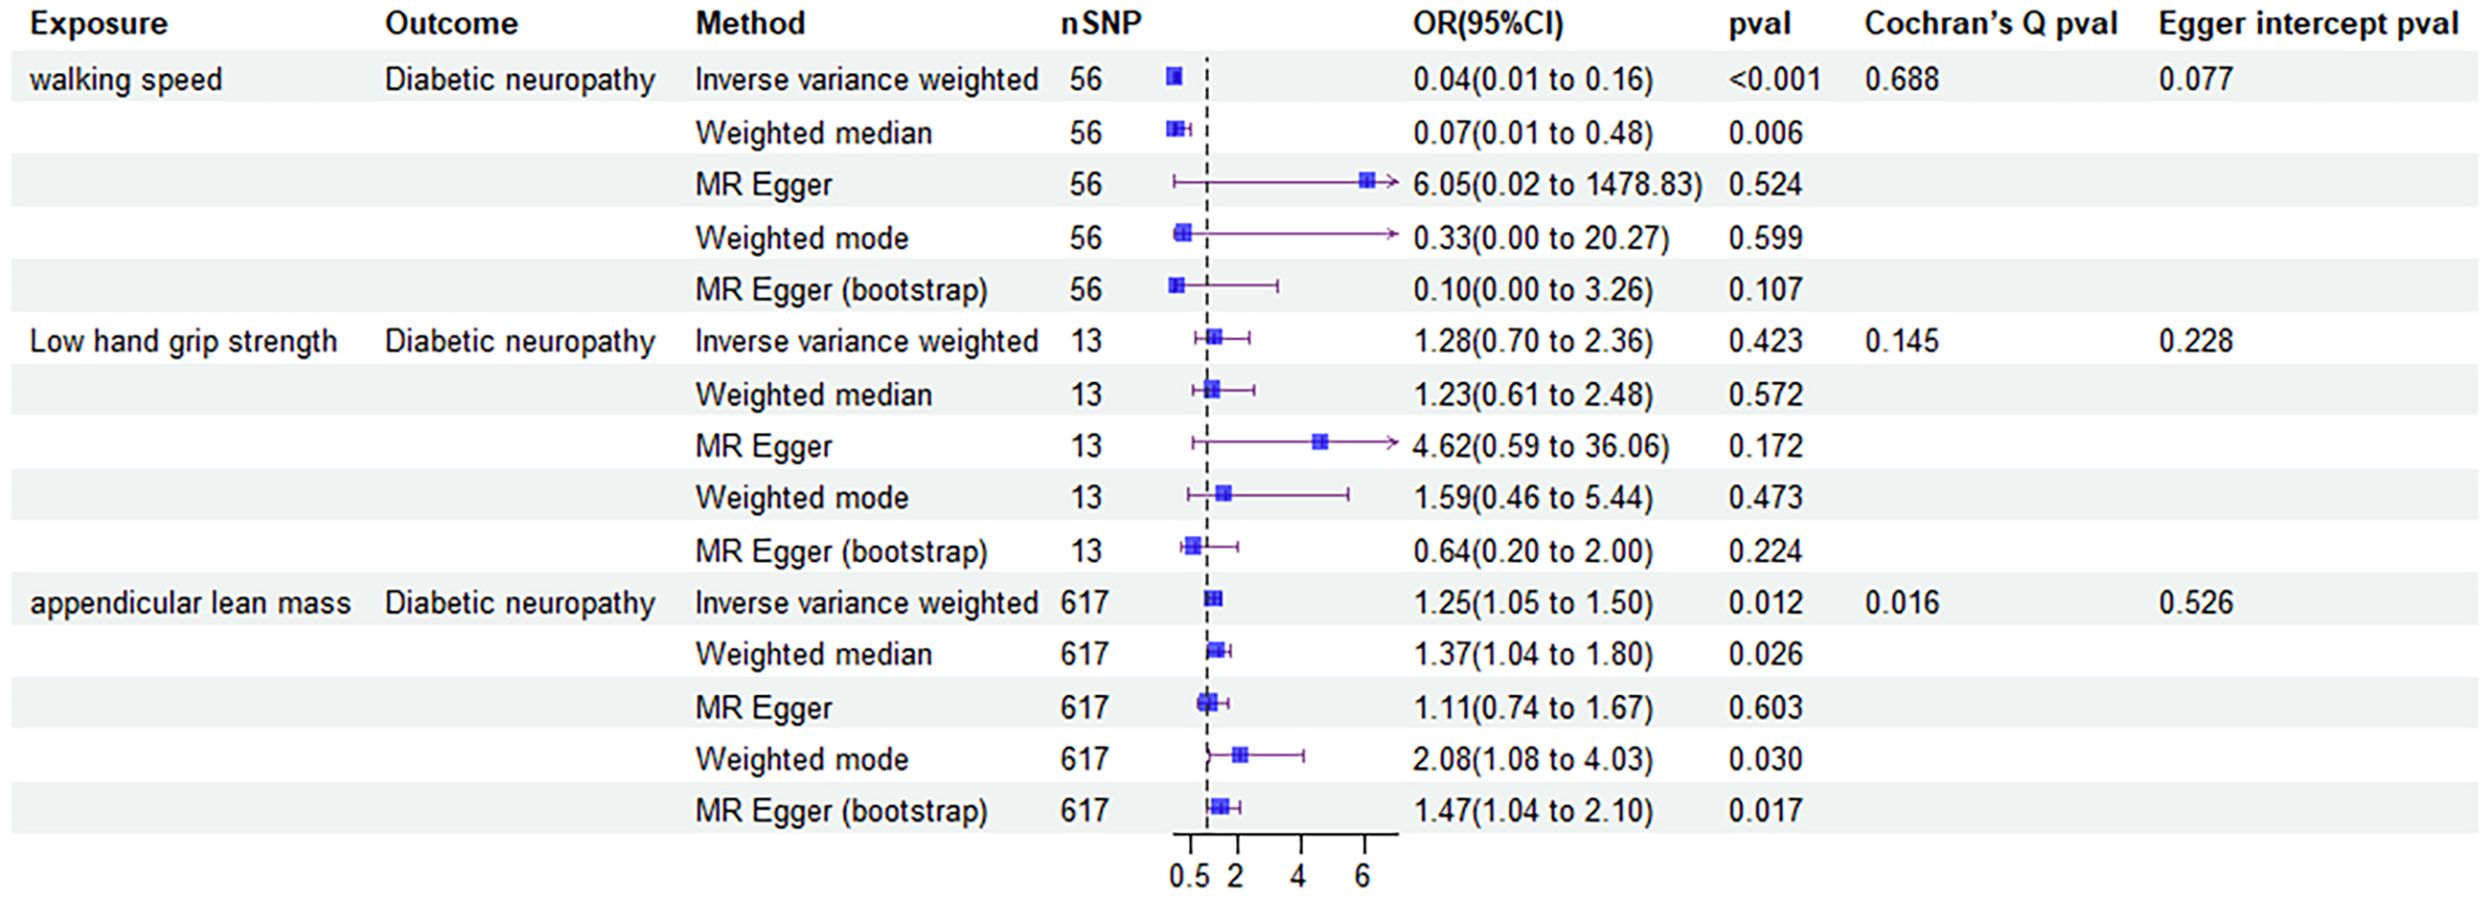
Figure 3. Forest plot of MR results of the effect of sarcopenia related clinical traits on diabetic neuropathy.
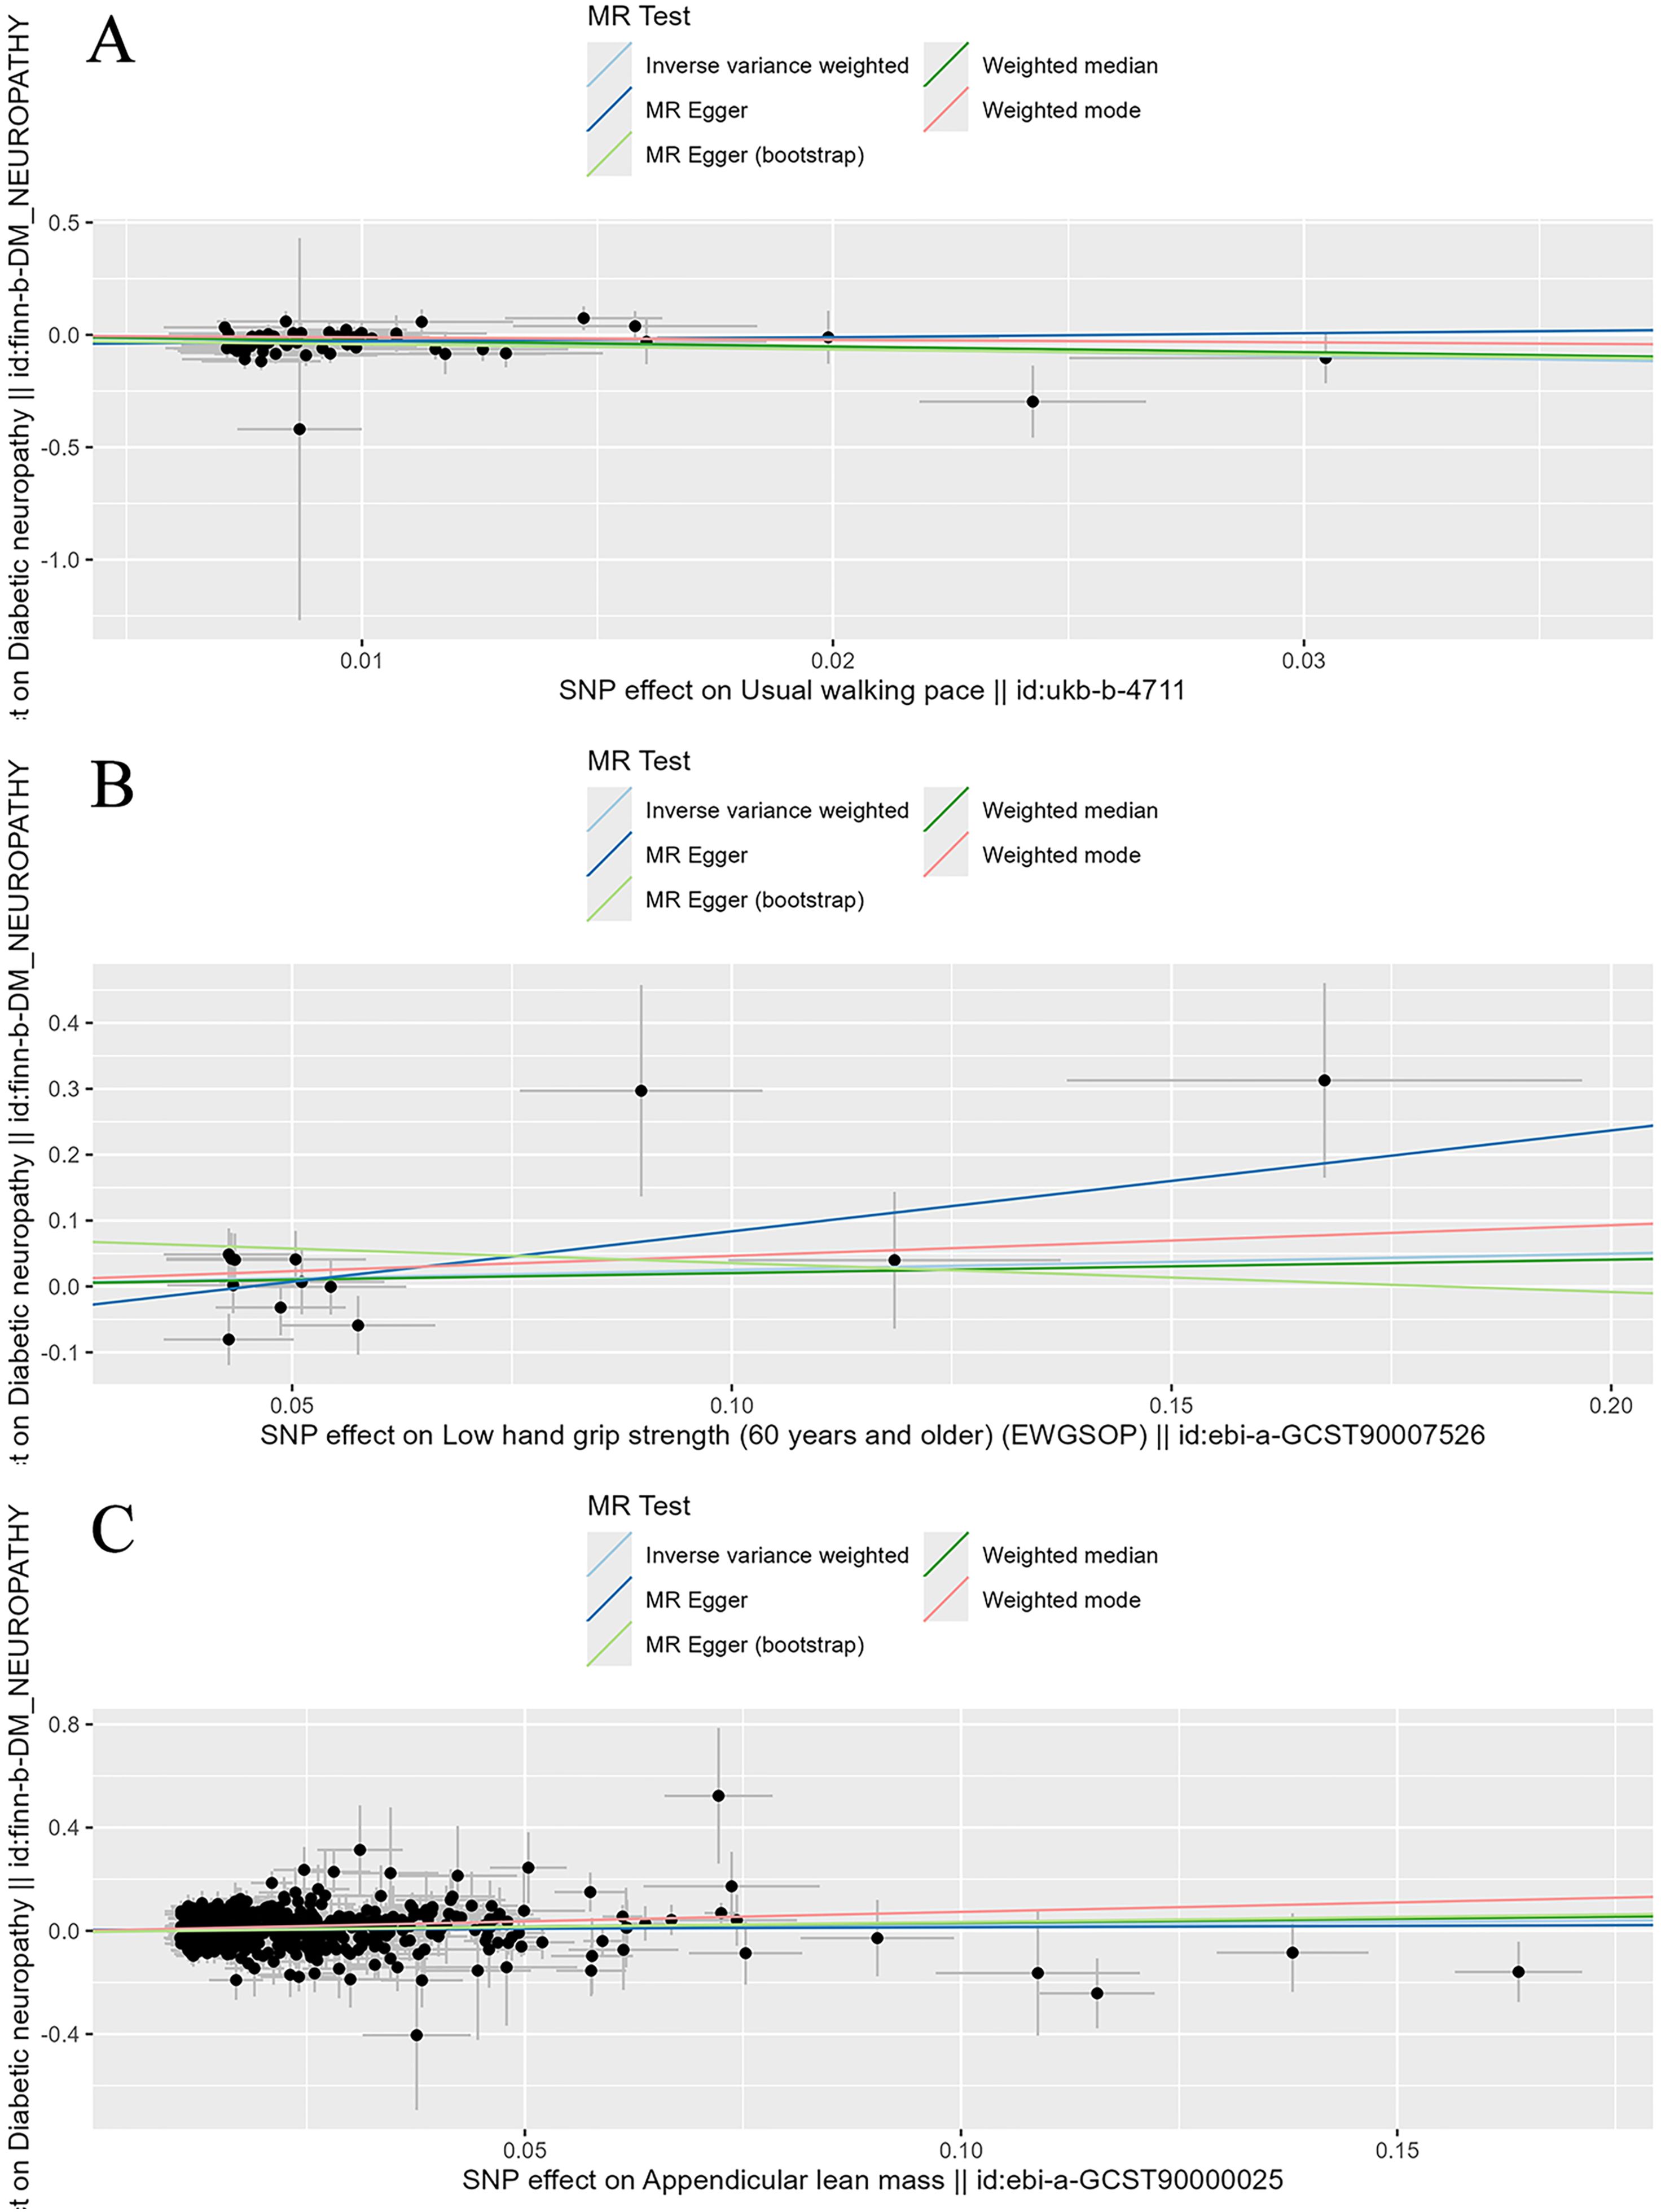
Figure 4. Scatter plot of the causality of sarcopenia related clinical traits on diabetic neuropathy. (A) The causality of walking speed on diabetic neuropathy. (B) The causality of low hand grip strength on diabetic neuropathy. (C) The causality of ALM on diabetic neuropathy.
Leave-one-out analysis confirmed that no SNPs significantly affected the results. Figure 5 shows the leave-one-out analysis results detailly.
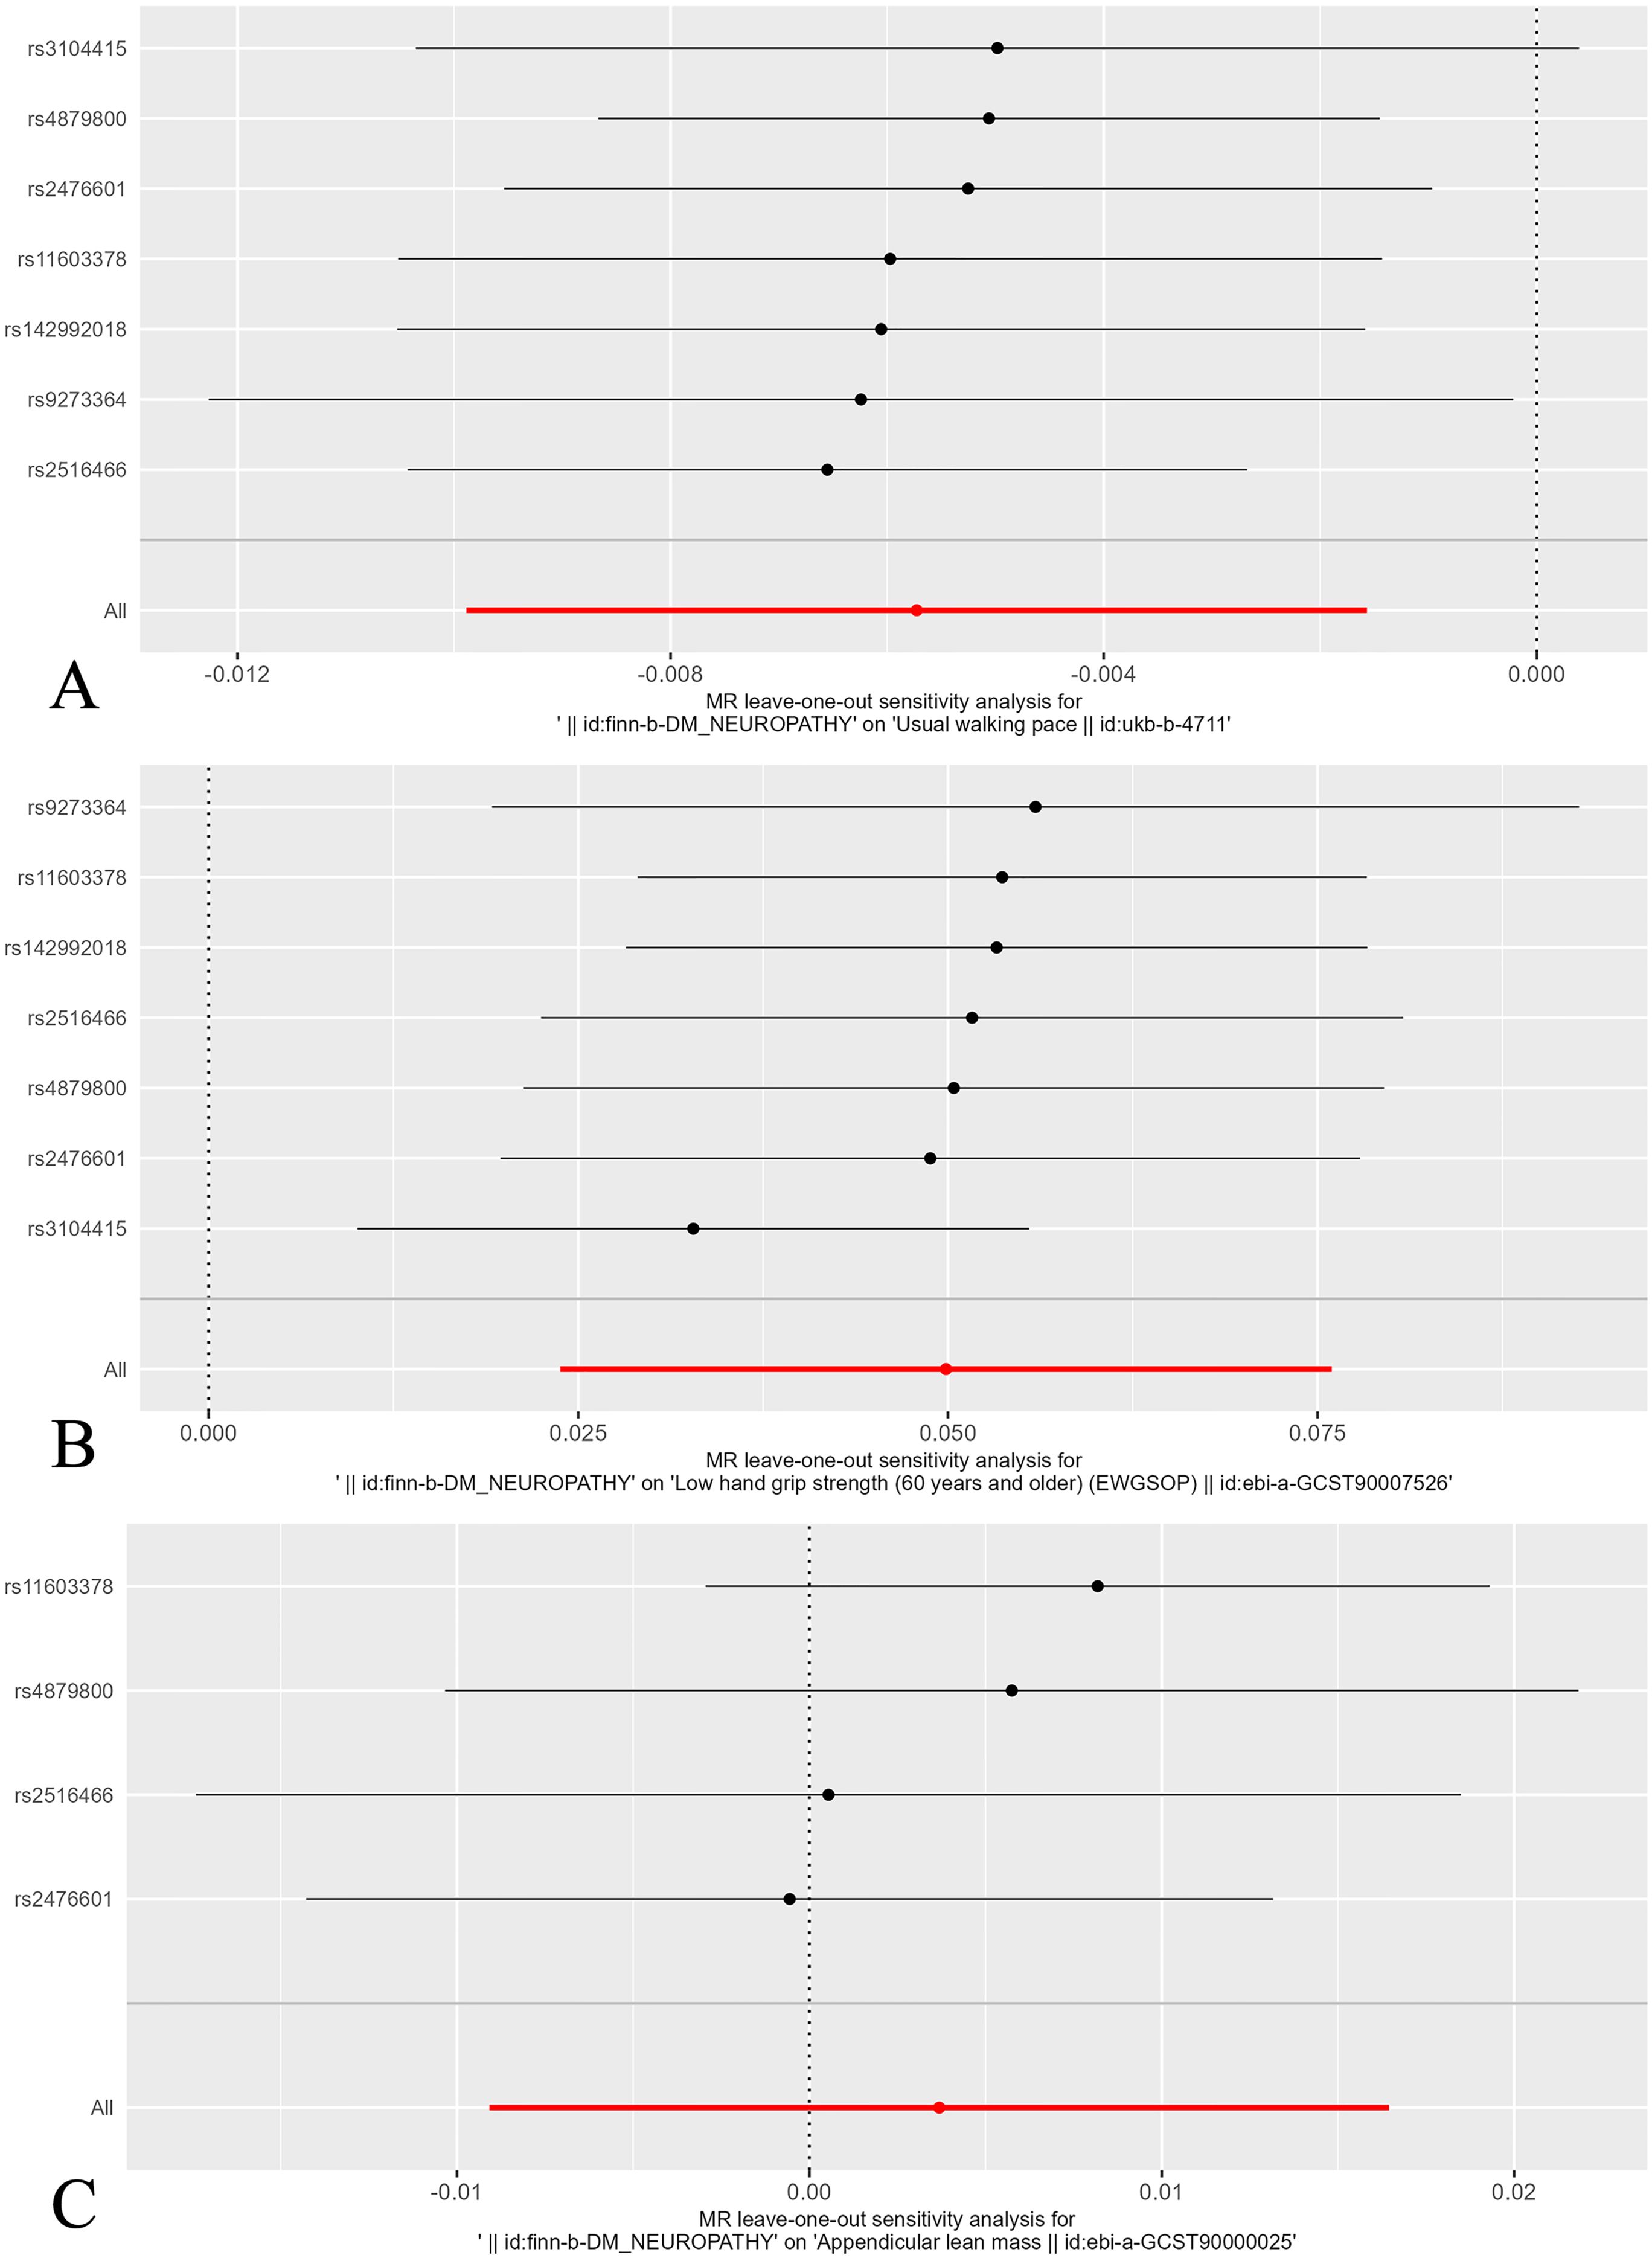
Figure 5. Leave-one-out plot of the effect of sarcopenia related clinical traits on diabetic neuropathy. (A) Leave-one-out plot of the effect of walking speed on diabetic neuropathy. (B) Leave-one-out plot of the effect of low hand grip strength on diabetic neuropathy. (C) Leave-one-out plot of the effect of ALM on diabetic neuropathy.
The reverse MR analysis revealed that diabetic neuropathy had a causal effect on the certain clinical traits of sarcopenia
The four MR analysis methods that demonstrated a causal relationship between developing diabetic neuropathy and walking speed included IVW (0.99 [0.99-1.00], P = 0.007), weighted median (0.99 [0.99-1.00], P = 0.001), weighted mode (0.99 [0.99-1.00], P = 0.013) and MR egger (bootstrap) analysis (0.99 [0.99-1.00], P = 0.021). All MR analysis methods confirmed that diabetic neuropathy had causal effects on low hand grip strength, but no causal effects on ALM.
Then, we assessed the results in the same manner as the forward MR analysis above. Cochran’s Q test indicated that there was heterogeneity in ALM, but it was also considered acceptable due to the application of random-effects IVW as the primary method. (Figures 6, 7). MR-Egger intercept tests and leave-one-out analysis produced results consistent with the forward MR analysis above (Figure 8).
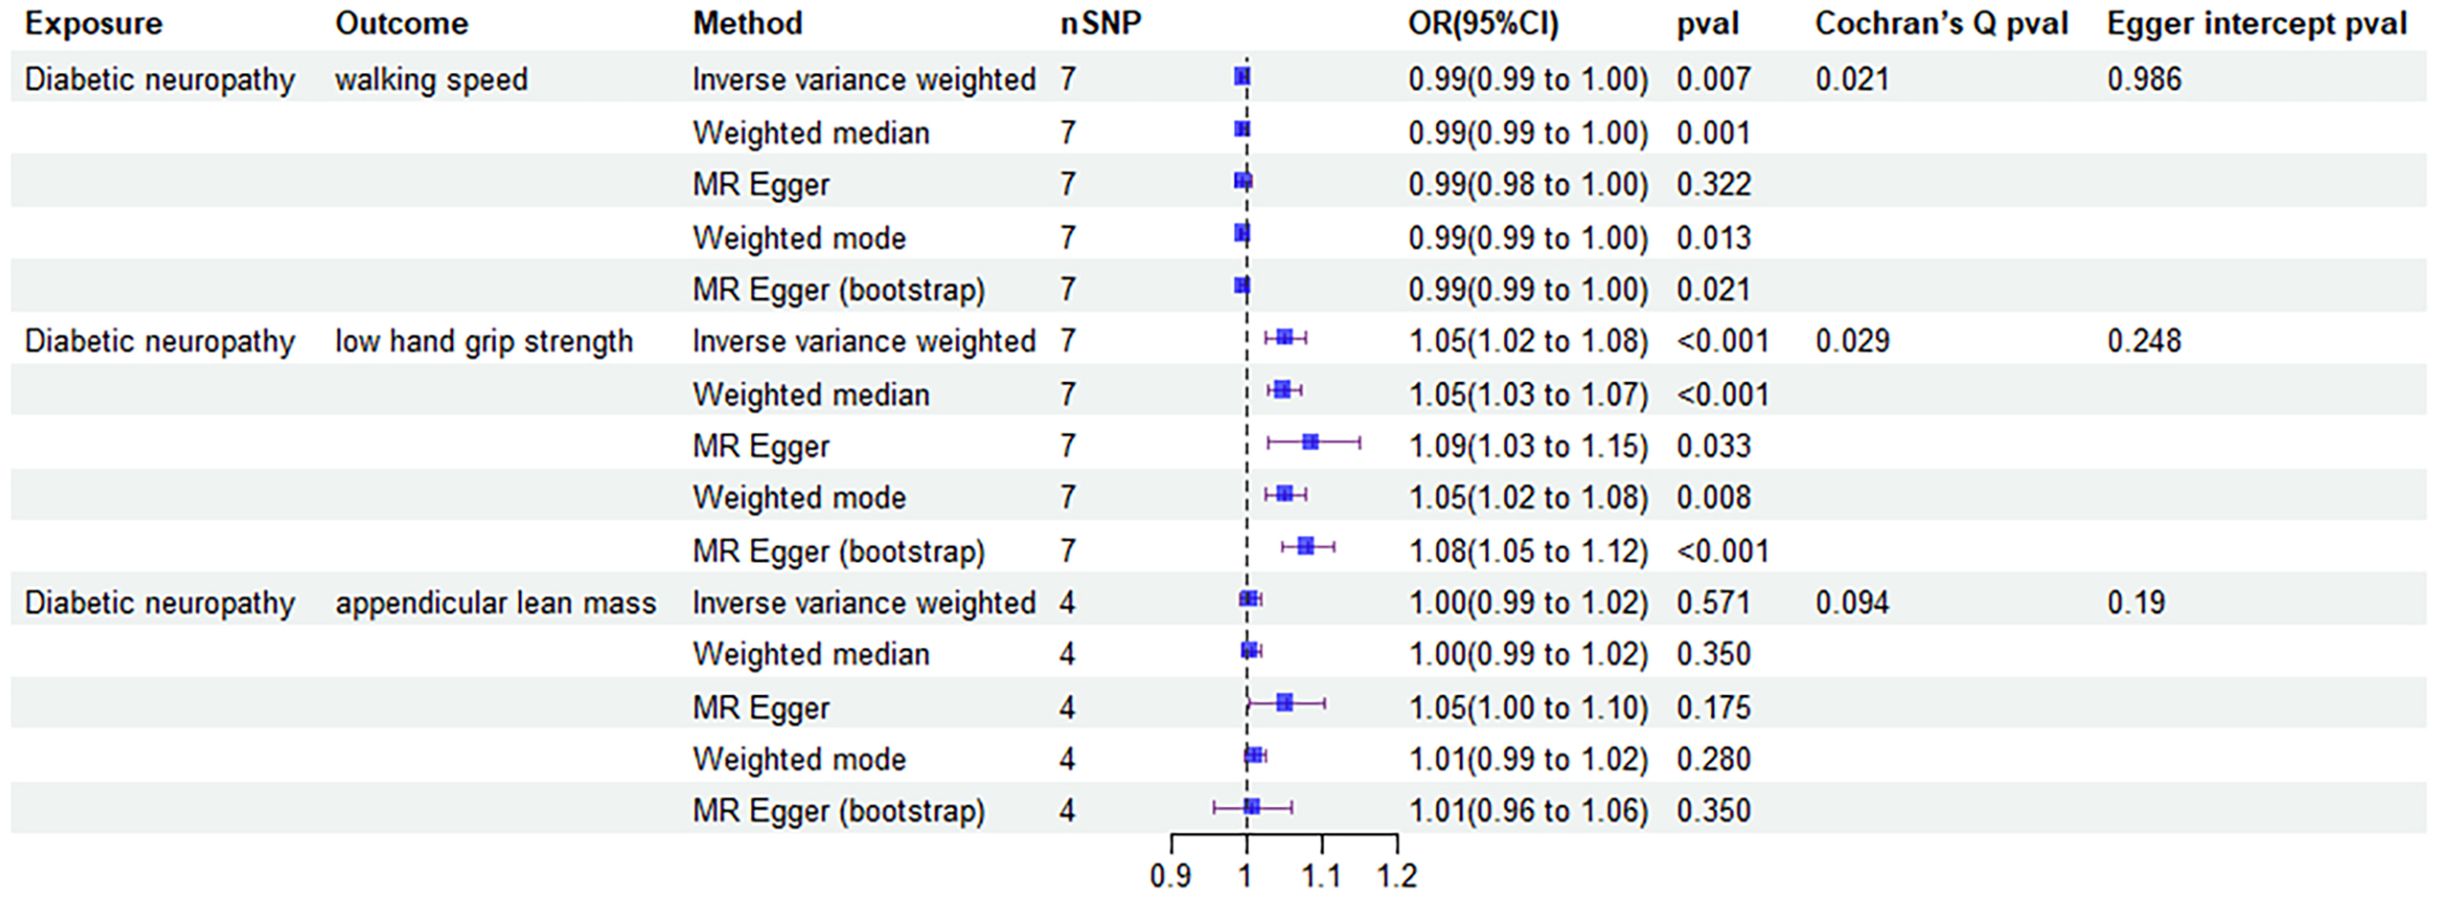
Figure 6. Forest plot of MR results of the effect of diabetic neuropathy on sarcopenia related clinical traits.
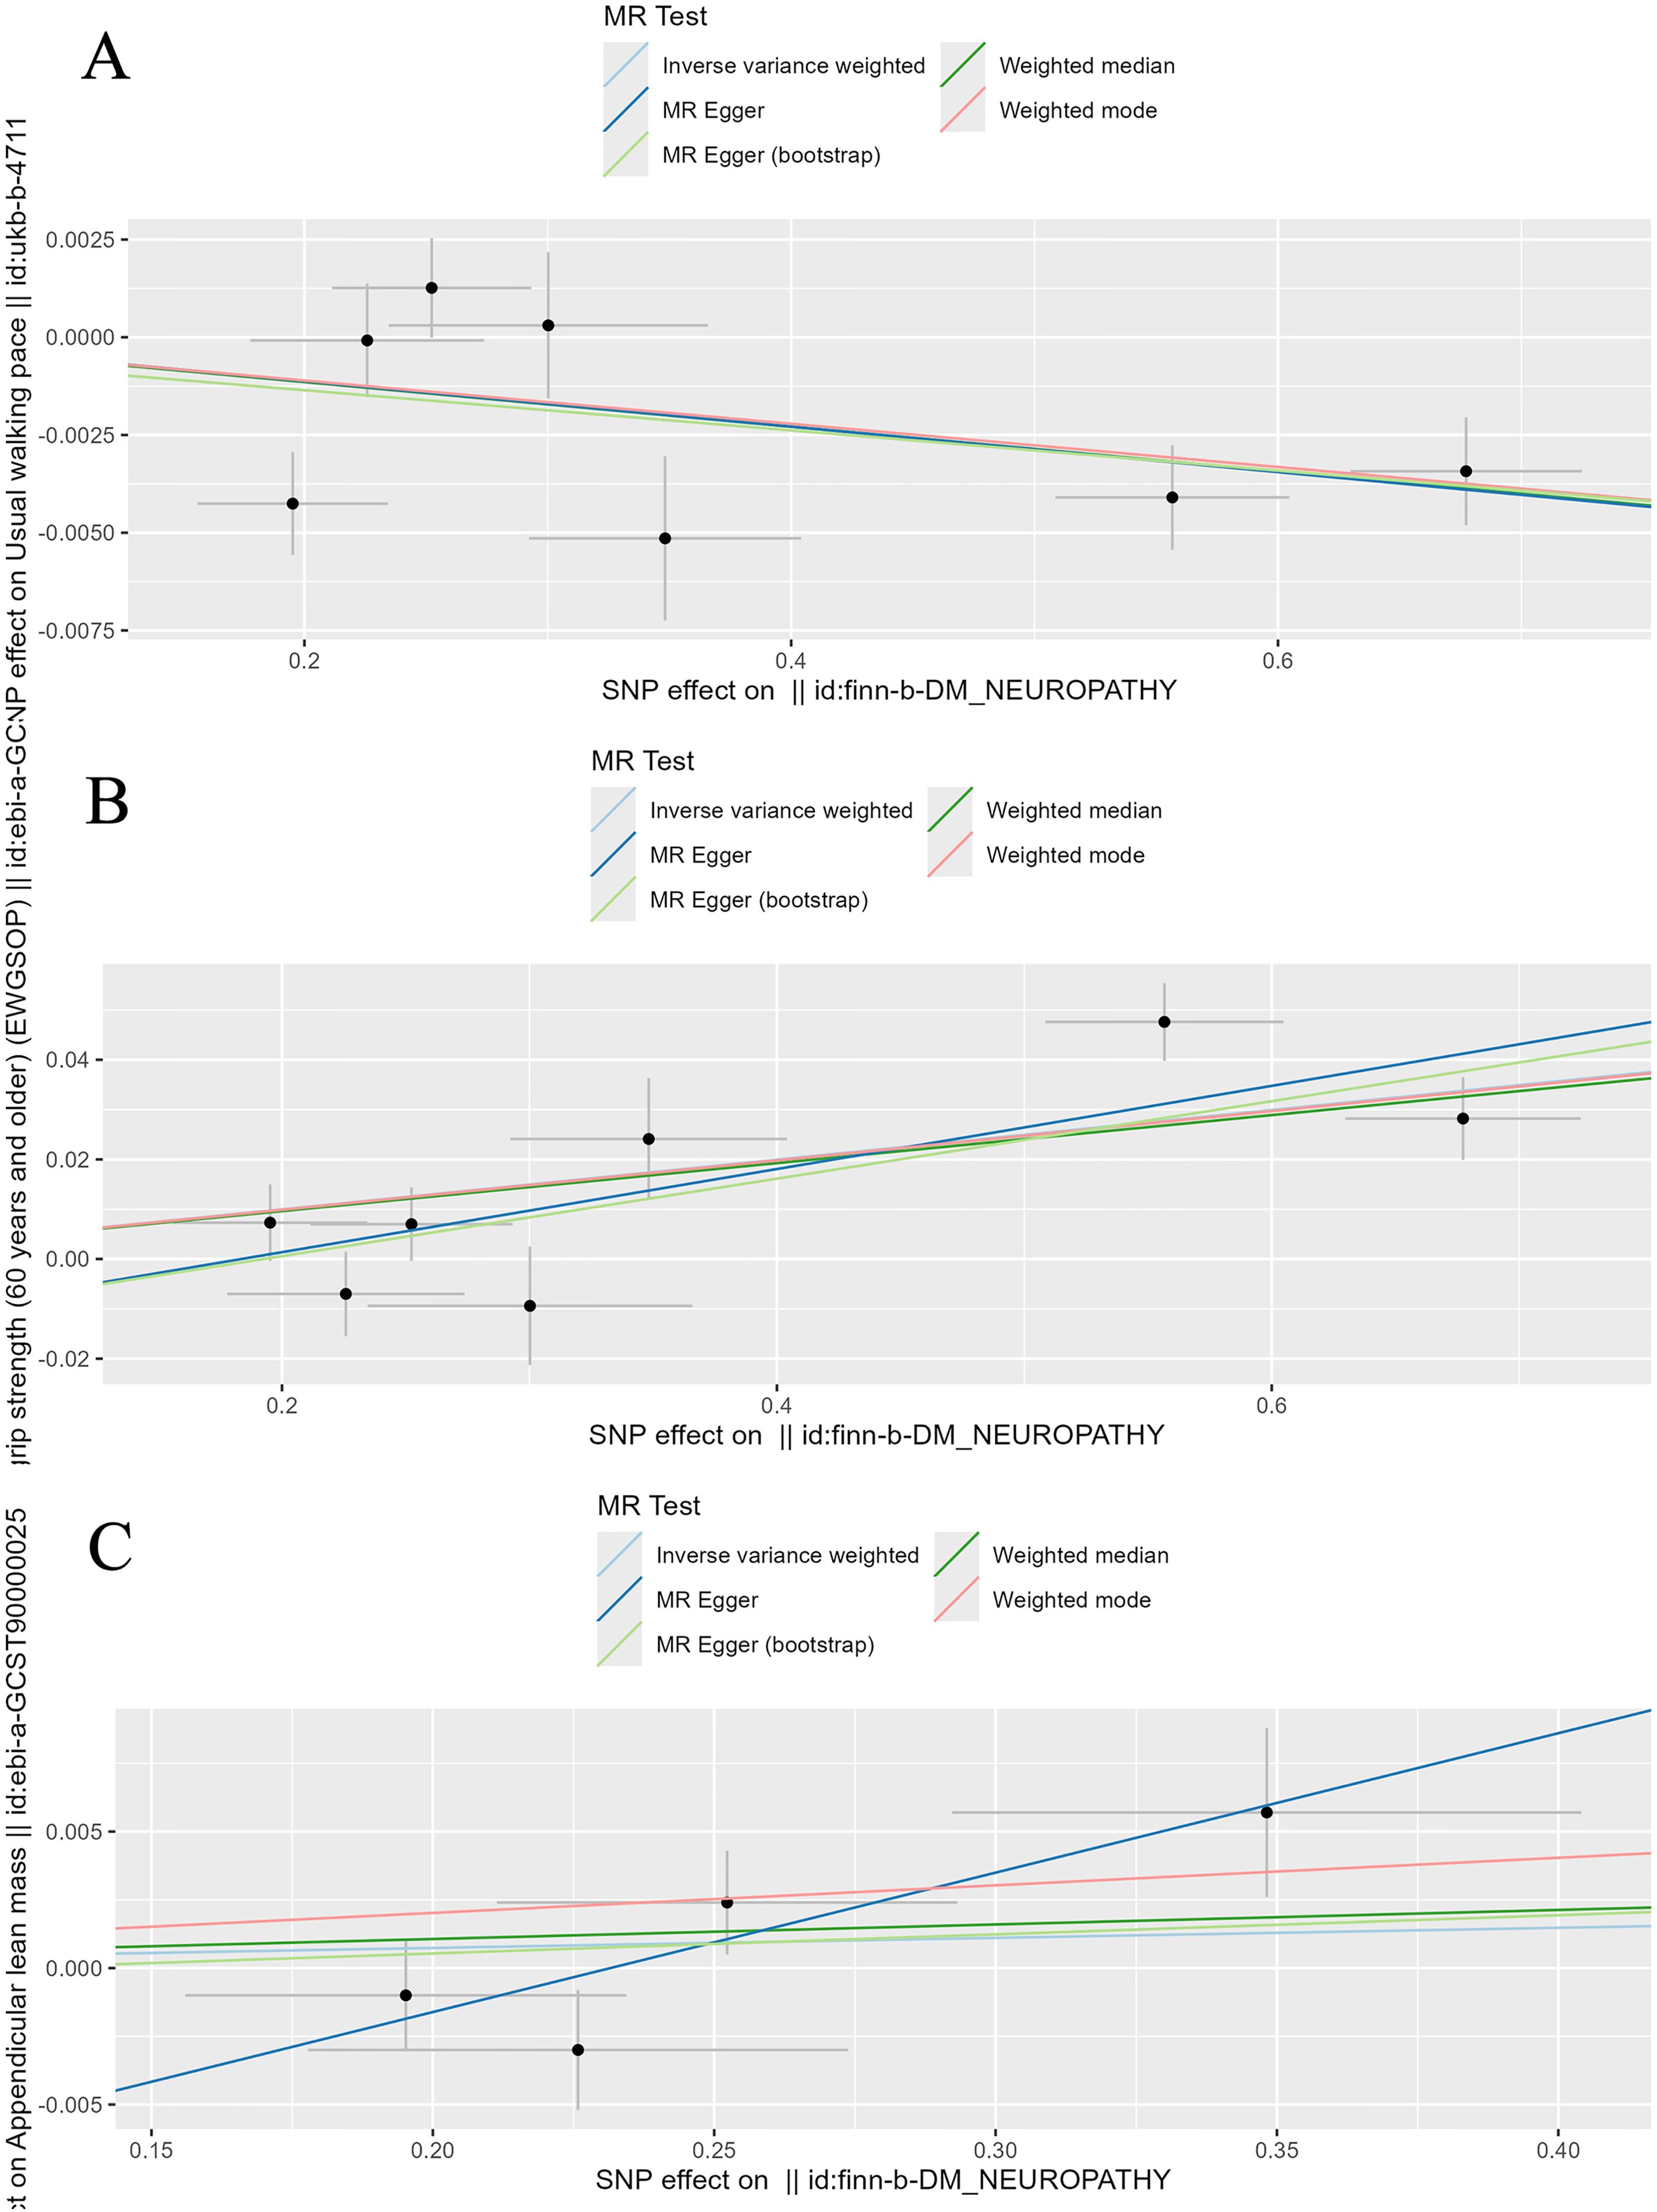
Figure 7. Scatter plot of the causality of diabetic neuropathy on sarcopenia related clinical traits. (A) The causality of diabetic neuropathy on walking speed. (B) The causality of diabetic neuropathy on low hand grip strength. (C) The causality of diabetic neuropathy on ALM.
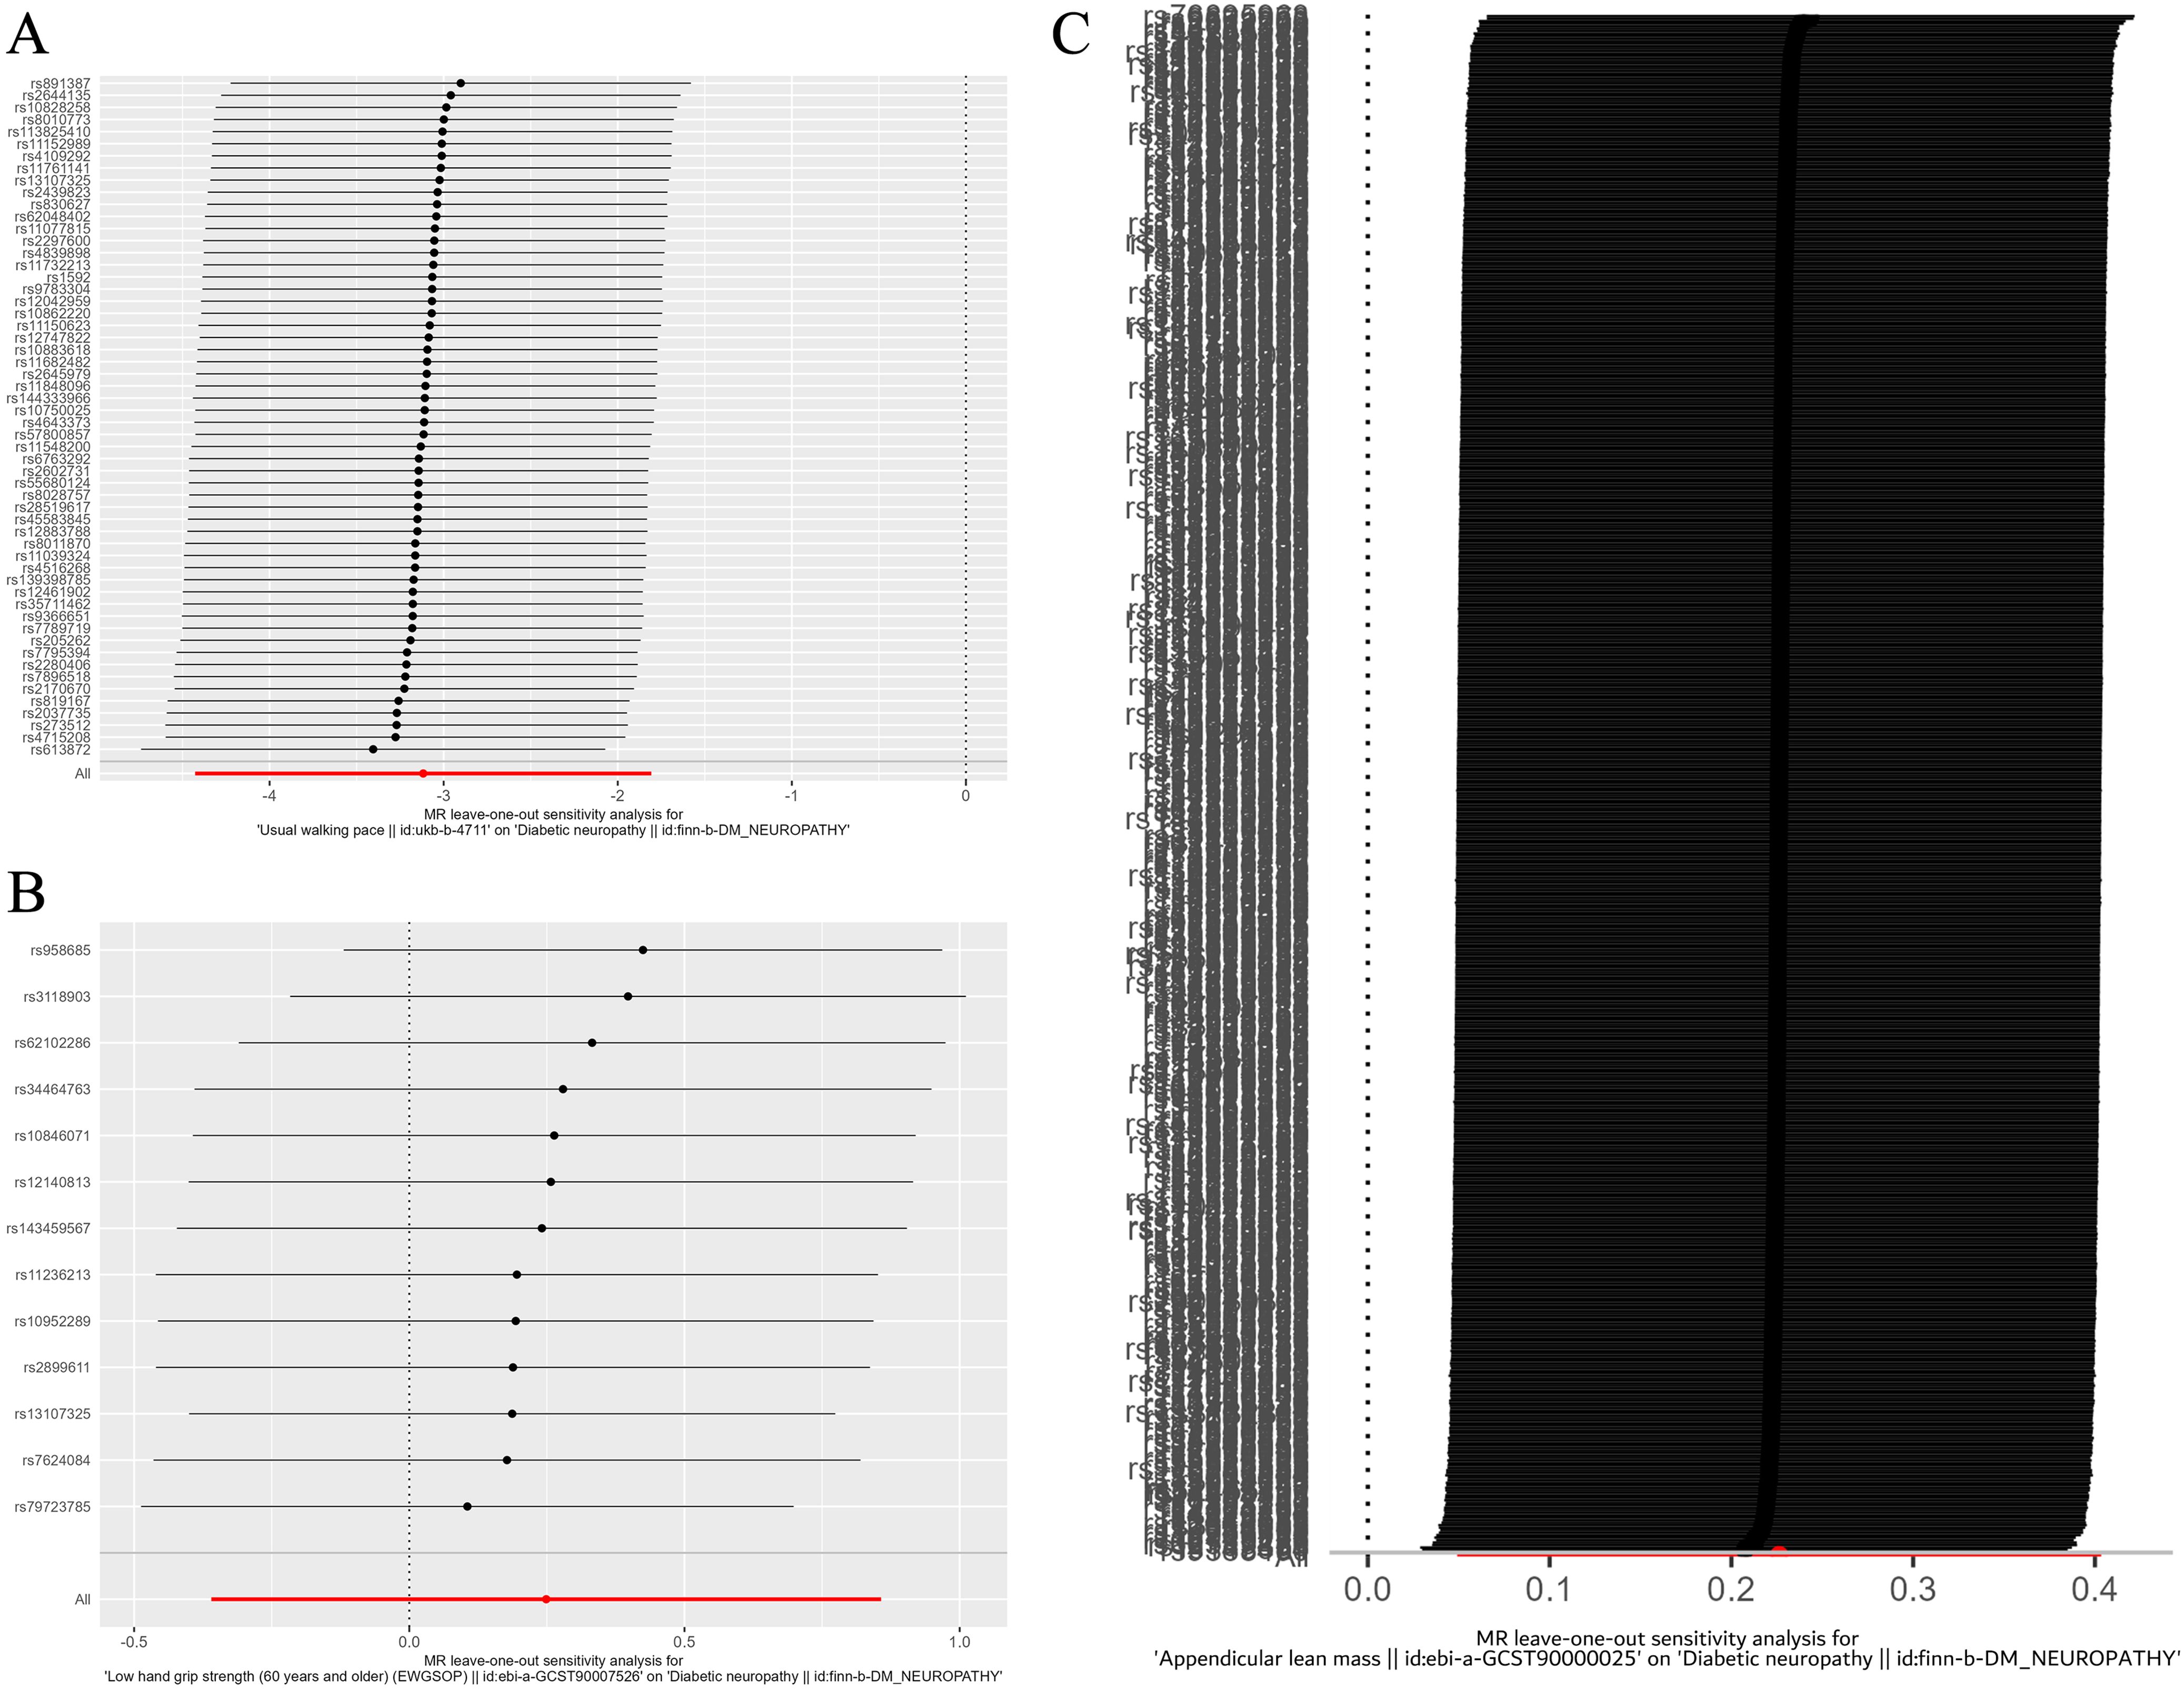
Figure 8. Leave-one-out plot of the effect of diabetic neuropathy on sarcopenia related clinical traits. (A) Leave-one-out plot of the effect of diabetic neuropathy on walking speed. (B) Leave-one-out plot of the effect of diabetic neuropathy on low hand grip strength. (C) Leave-one-out plot of the effect of diabetic neuropathy on ALM.
Baseline patient features
A total of 196 patients aged ≥60 years with T2DM were enrolled in this study, who were then divided into DPN (n=51) and non-DPN (n=145) groups. The DPN prevalence was determined as 26% (51/196). As it was seen in Table 1. Significant variations were identified between patients with and without DPN in terms of sex, age, weight, alcohol consumption, hypertension comorbidity, as well as levels of HbA1c, fasting insulin, HDL-c, creatinine, and VPT (P<0.001). Compared to the patients without DPN, the patients who had DPN were older, more obese, and with higher HbA1c, creatinine, and lower fasting insulin. Moreover, the number of males, alcohol consumers, and individuals with hypertension was more in patients with DPN than the ones without DPN (P<0.05). Additionally, in terms of muscle-related indicators, the patients with DPN had longer 5-time chair stand time and slower 6-meter walking speed, while their grip strength and ASMI showed no significant difference.
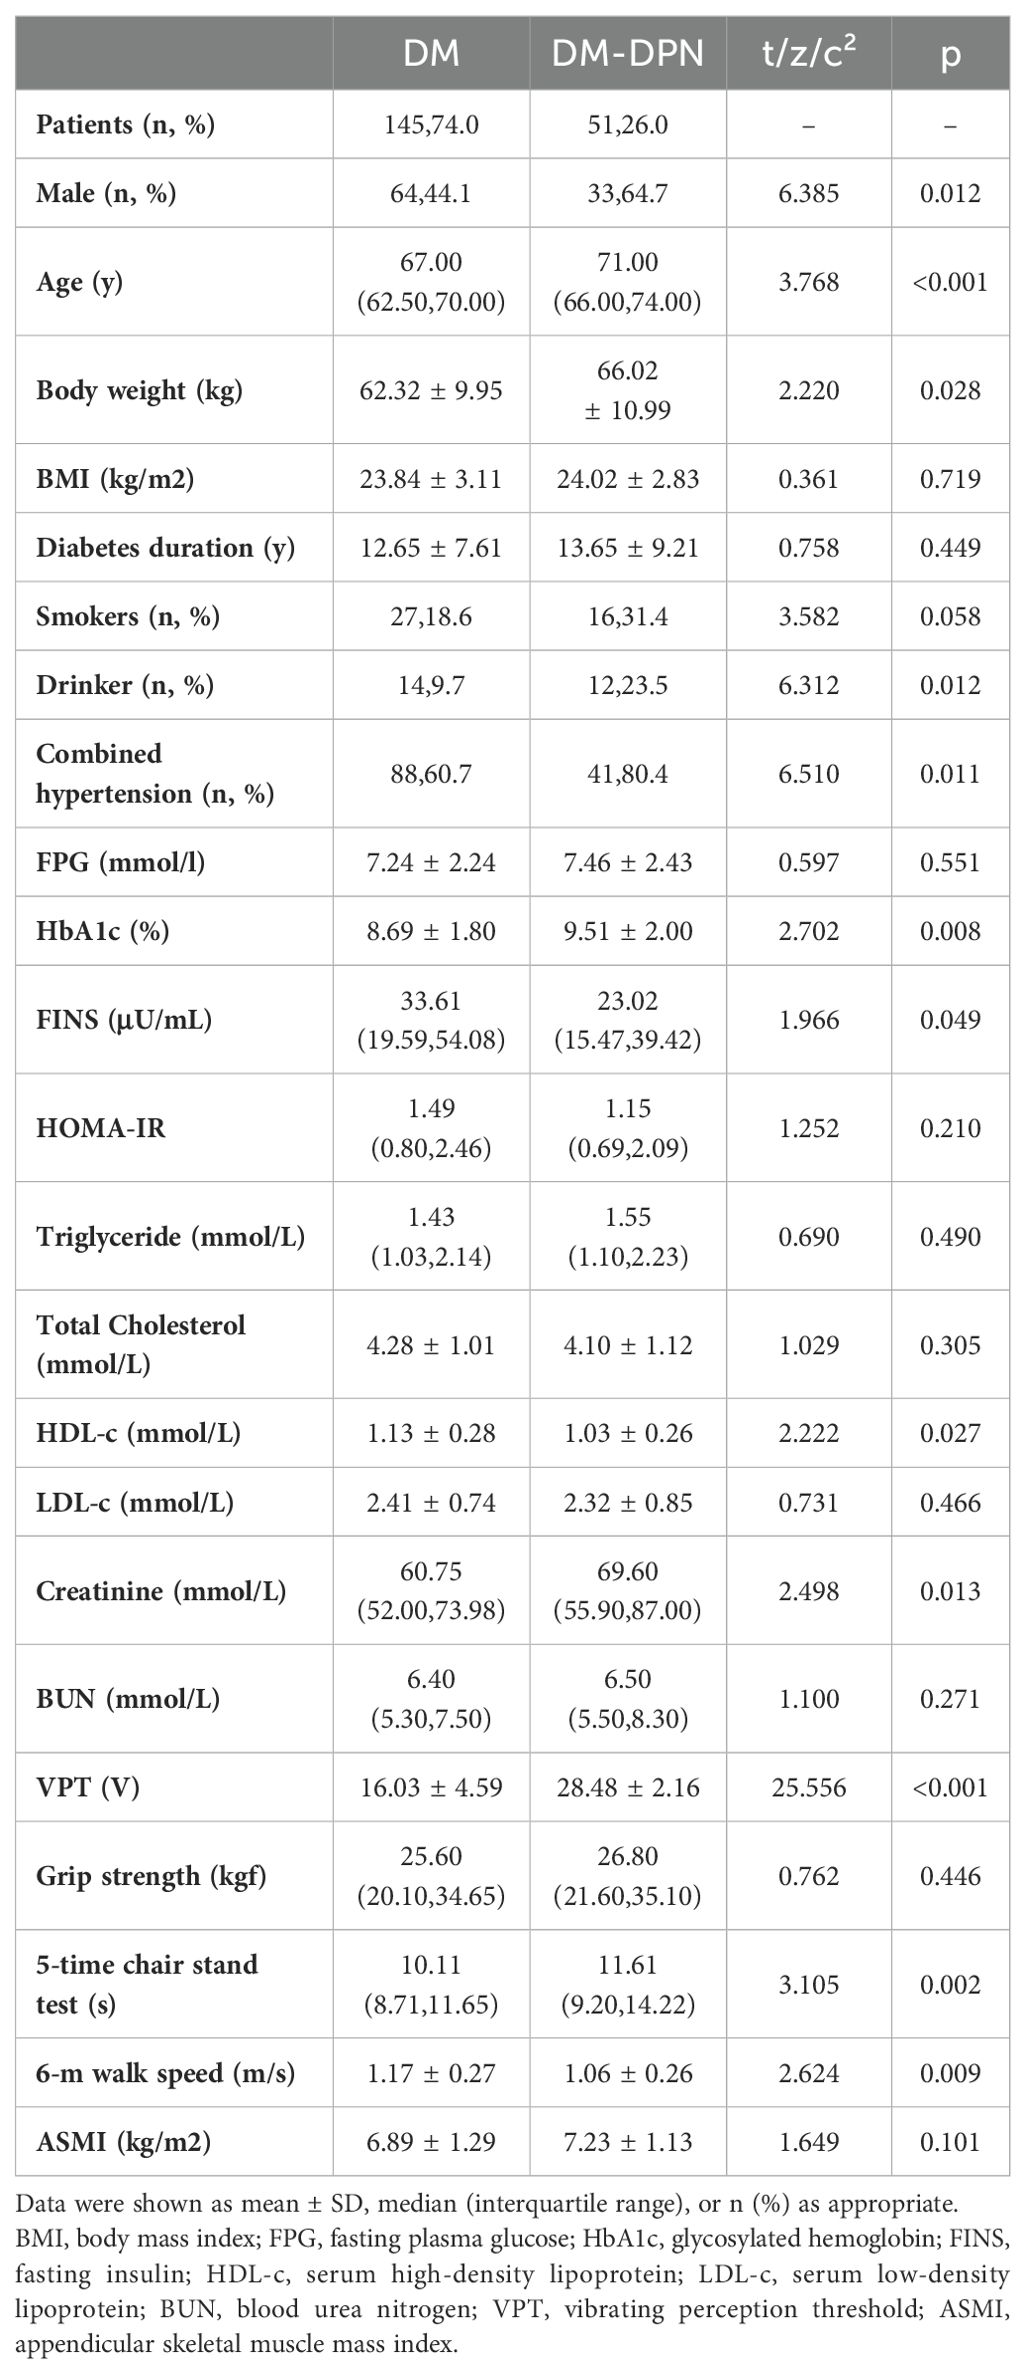
Table 1. Baseline characteristics of patients with T2DM with or without diabetic peripheral neuropathy.
Associations of sarcopenia indexes with DPN
The logistic regression analysis results indicated that sex (5.840 [1.444-23.618], P = 0.013), age (1.146 [1.047-1.254], P = 0.003), body weight (1.137 [1.020-1.267], P = 0.021), alcohol drinking (3.146 [1.026-9.648], P = 0.045), HbA1c (2.211 [0.851-5.748], P = 0.045), 5-time chair stand test (1.230 [1.045-1.448], P = 0.013), and ASMI (0.337 [0.126-0.902], P = 0.030) were all independent risk factors for DPN in patients with T2DM (Table 2).
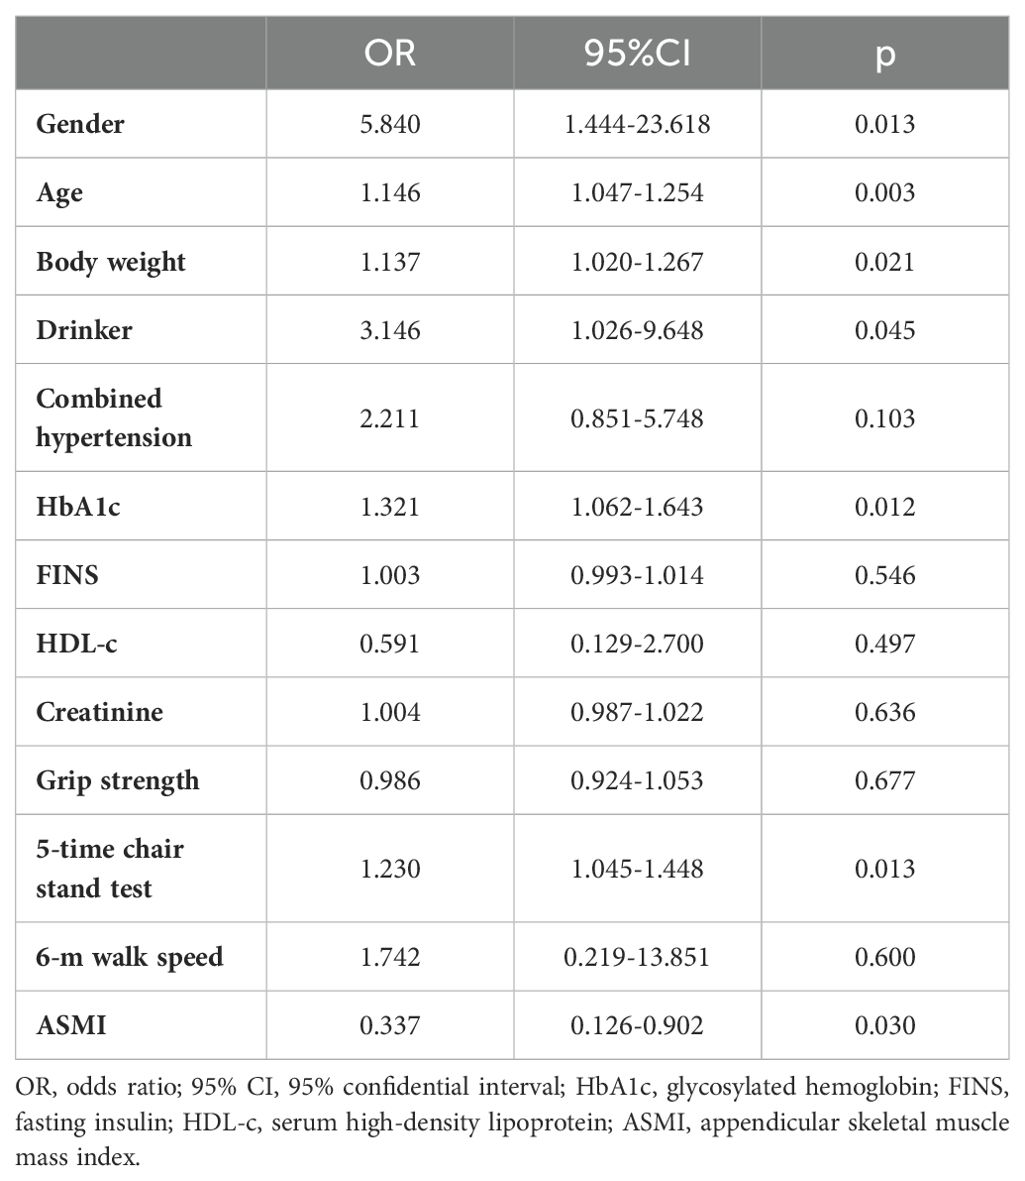
Table 2. Logistic regression analysis of diabetic peripheral neuropathy risk factors.
Risk factors for diabetic neuropathy
The correlation analysis between VPT and various factors in T2DM patients showed that VPT was positively related to sex (r: 0.164, P = 0.022), age (r: 0.363; P<0.001), body weight (r: 0.181, P = 0.011), Combined hypertension (r: 0.166, P = 0.020), HbA1c (r: 0.240, P = 0.001), and 5-time chair stand test (r: 0.247; P<0.001). Conversely, VPT is negatively correlated with fasting insulin (r: -0.168, P = 0.019), HDL-c (r: -0.194, P = 0.006), and 6-m walk speed (r: -0.245; P<0.001) (Table 3).
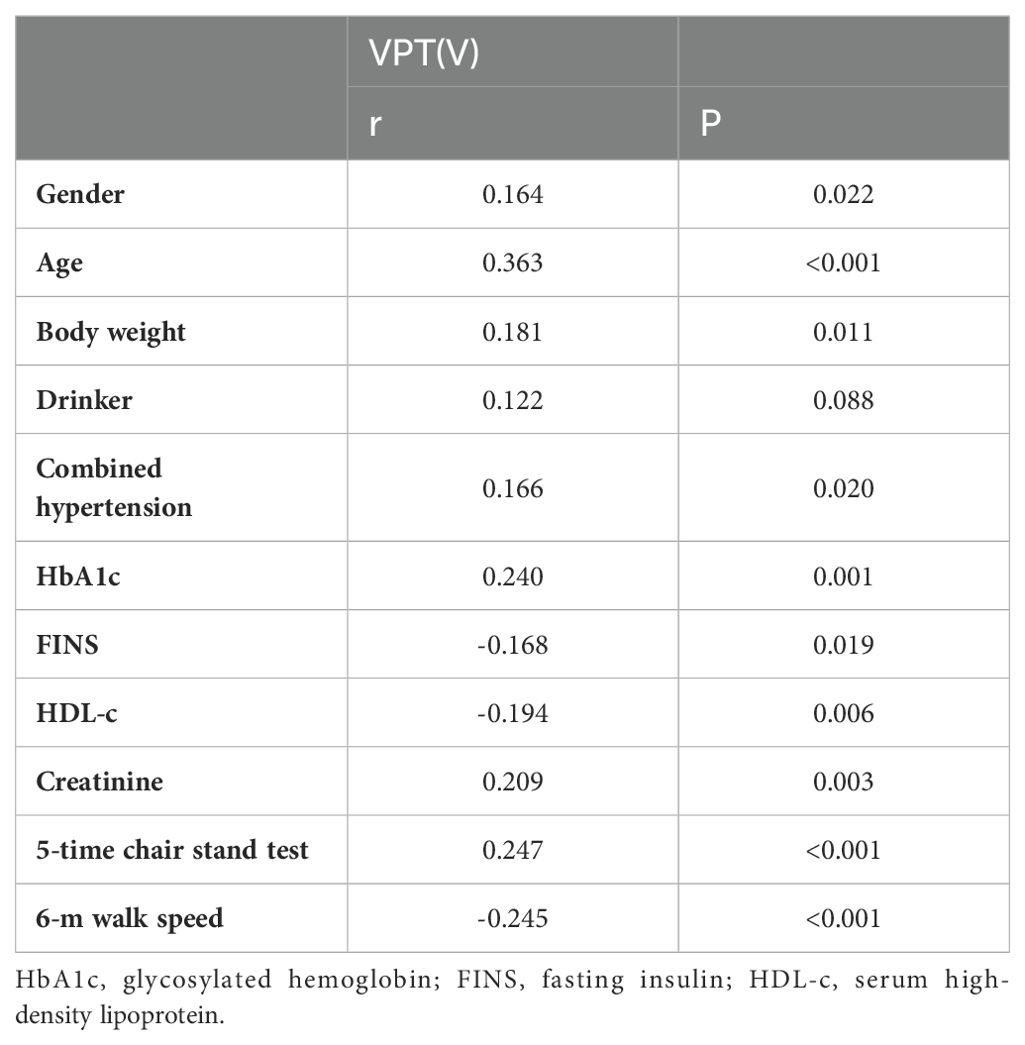
Table 3. Correlation coefficients between VPT and various factors.
Discussion
In our MR analysis, we investigated the relationship between diabetic neuropathy and parts of the relevant clinical traits of sarcopenia. The results suggest a partial causality between sarcopenia and diabetic neuropathy. Moreover, a cross-sectional study was carried out to further investigate the correlation between DPN and sarcopenia in T2DM patients, revealing that patients with DPN have a significantly higher prevalence of sarcopenia than those without sarcopenia. In addition, this study also suggested that sarcopenia indexes were independent risk factors for DPN, which is generally consistent with our MR analysis findings.
A previous cross-sectional study found that diabetic patients with DPN exhibited slower walking speeds and greater variability in step frequency compared to diabetic patients without DPN and healthy controls (16). Additionally, a cohort study from the UK Biobank showed that T2DM participants with faster walking speeds had a lower incidence of DPN (40). These findings are consistent with the results of our MR analysis and cross-sectional study. A single-center study from China found that DPN impairs hand function, primarily manifesting as reduced fingertip grip strength and decreased hand dexterity (41). While our reverse MR analysis supports these findings, our forward MR analysis did not show a significant association between hand grip strength and diabetic neuropathy. Another study reported that patients with more severe diabetic foot neuropathy had lower ALM index (42). This conclusion is contrary to our results, which might be due to factors such as insufficient sample size or the use of samples exclusively from a single European population. A previous MR study indicated that ALM did not show a significant causal relationship with T2DM, which is consistent with our findings (43).
Several previous studies have demonstrated a correlation between sarcopenia and diabetic neuropathy, yet the underlying mechanisms by which diabetic neuropathy leads to the development of sarcopenia remain unclear. Andreassen et al. demonstrated that DPN induces muscle atrophy and weakness through muscle denervation resulting from motor axon loss (44). Zhang et al. found that increased muscle mass can partially improve sensory and motor nerve conduction velocity (45). On the other hand, Han et al. observed that the low muscle mass seen in sarcopenic patients can lead to decreased glucose uptake and increased insulin resistance (46). Jarmusch et al., showed that some muscle-secreted cytokines, such as insulin-like growth factor 1, have a major nutritional impact on neurons. Lower levels of insulin-like growth factor-1 expression in sarcopenia have been linked to muscle denervation, as well as poor neuronal regeneration, potentially contributing to the onset of sarcopenia (47).
This study still had some disadvantages. In terms of MR analysis, firstly, past study showed that sarcopenia may be influenced by sex and age, but the GWAS database lacks sex and age stratification, which limits our ability to perform subgroup analyses, such as those regarding low hand-grip strength and ALM according to sex and age. Secondly, due to the lack of ASMI data in the GWAS database, we had to use another widely accepted measure, ALM, as a substitute for ASMI in calculating muscle mass. However, it may not be insufficiently precise due to deviations in other non-fat soft tissues such as lungs and kidneys. Thirdly, our MR analysis included only European populations, which may not be applicable enough to groups from other regions. Lastly, residual bias cannot be completely avoided, as it is a known limitation of the MR technique. Despite the use of pleiotropy tests and MR-PRESSO procedures to minimize confounding by pleiotropy, some bias may still remain. In terms of our cross-sectional study, our participants were selected from hospitalized patients at a single center, consisting only of patients over 60 years old with T2DM, which may lead to selection bias. Additionally, due to the lack of relevant diagnostic equipment, the research did not include Nerve conduction studies to diagnose DPN, which are considered the current gold standard. Using only VPT to explore the correlation between DPN and sarcopenia without including assessments related to autonomic neuropathy, might not be entirely convincing. Indeed, more samples from different locations are required to demonstrate the precise link between DPN and sarcopenia more thoroughly. Nevertheless, despite these limitations, it is still necessary for clinical doctors to screen for sarcopenia in patients with DPN. The easy-to-use VPT test not only helps diagnose DPN but also indicates the risk of abnormal body functions, which can help T2DM patients prevent falls, fractures, and even foot diseases.
In conclusion, this study provides solid evidence that clinical traits of sarcopenia, including VPT, walking speed, hand grip strength and AMSI, are possible predictors of diabetic neuropathy. Nevertheless, despite some limitations, it is still necessary for clinical doctors to screen for sarcopenia in patients with DPN. The easy-to-use VPT test not only helps diagnose DPN but also indicates the risk of abnormal muscle functions, which can help T2DM patients prevent falls, fractures, and even foot diseases.
Data availability statement
The datasets presented in this study can be found in online repositories. The names of the repository/repositories and accession number(s) can be found in the article/Supplementary Material.
Ethics statement
The studies involving humans were approved by Medical Research Ethics Committee of The Affiliated Changzhou No. 2 People’s Hospital of Nanjing Medical University. The studies were conducted in accordance with the local legislation and institutional requirements. The participants provided their written informed consent to participate in this study. Written informed consent was obtained from the individual(s) for the publication of any potentially identifiable images or data included in this article.
Author contributions
YF: Conceptualization, Data curation, Formal analysis, Investigation, Methodology, Resources, Software, Supervision, Validation, Visualization, Writing – original draft, Writing – review & editing. XQY: Data curation, Investigation, Resources, Supervision, Validation, Writing – review & editing. QZ: Investigation, Resources, Supervision, Validation, Writing – review & editing. JL: Data curation, Investigation, Resources, Supervision, Validation, Writing – review & editing. QY: Resources, Supervision, Validation, Writing – review & editing. XHY: Conceptualization, Funding acquisition, Investigation, Project administration, Resources, Supervision, Validation, Writing – review & editing.
Funding
The author(s) declare financial support was received for the research, authorship, and/or publication of this article. This study was supported by grants from Clinical Research Project of Changzhou Medical Center of Nanjing Medical University (CMCC202310), Changzhou Municipal Health Commission science and technology project (ZD202317).
Conflict of interest
The authors declare that the research was conducted in the absence of any commercial or financial relationships that could be construed as a potential conflict of interest.
Publisher’s note
All claims expressed in this article are solely those of the authors and do not necessarily represent those of their affiliated organizations, or those of the publisher, the editors and the reviewers. Any product that may be evaluated in this article, or claim that may be made by its manufacturer, is not guaranteed or endorsed by the publisher.
Supplementary material
The Supplementary Material for this article can be found online at: https://www.frontiersin.org/articles/10.3389/fendo.2024.1428835/full#supplementary-material
References
1. Zheng Y, Ley SH, Hu FB. Global aetiology and epidemiology of type 2 diabetes mellitus and its complications. Nat Rev Endocrinol. (2018) 14:88–98. doi: 10.1038/nrendo.2017.151
2. Boulton A. A brief overview of the diabetic neuropathies. Diabetes Res Clin Pract. (2023) 206 Suppl 1:110758. doi: 10.1016/j.diabres.2023.110758
3. Feldman EL, Callaghan BC, Pop-Busui R, Zochodne DW, Wright DE, Bennett DL, et al. Diabetic neuropathy. Nat Rev Dis Primers. (2019) 5:42. doi: 10.1038/s41572-019-0097-9
4. Zaino B, Goel R, Devaragudi S, Prakash A, Vaghamashi Y, Sethi Y, et al. Diabetic neuropathy: Pathogenesis and evolving principles of management. Dis Mon. (2023) 69:101582. doi: 10.1016/j.disamonth.2023.101582
5. Selvarajah D, Kar D, Khunti K, Davies MJ, Scott AR, Walker J, et al. Diabetic peripheral neuropathy: advances in diagnosis and strategies for screening and early intervention. Lancet Diabetes Endocrinol. (2019) 7:938–48. doi: 10.1016/S2213-8587(19)30081-6
6. Carmichael J, Fadavi H, Ishibashi F, Shore AC, Tavakoli M. Advances in screening, early diagnosis and accurate staging of diabetic neuropathy. Front Endocrinol (Lausanne). (2021) 12:671257. doi: 10.3389/fendo.2021.671257
7. Zhu X, Mao F, Liu S, Zheng H, Lu B, Li Y. Association of SUDOSCAN values with vibration perception threshold in chinese patients with type 2 diabetes mellitus. Int J Endocrinol. (2017) 2017:8435252. doi: 10.1155/2017/8435252
8. Ding J, Shi Q, Dong L, Su H, Du Y, Pan T, et al. Association of hbA1c variability with vibrating perception threshold in middle-aged and elderly patients with type 2 diabetes mellitus: A retrospective cohort study. Diabetes Metab Syndr Obes. (2024) 17:193–202. doi: 10.2147/DMSO.S443917
9. Liu M, Gao Y, Chen DW, Lin S, Wang C, Chen LH, et al. Quantitative vibration perception threshold in assessing diabetic polyneuropathy: Should the cut-off value be adjusted for Chinese individuals with type 2 diabetes? J Diabetes Investig. (2021) 12:1663–70. doi: 10.1111/jdi.13515
10. Martin CL, Waberski BH, Pop-Busui R, Cleary PA, Catton S, Albers JW, et al. Vibration perception threshold as a measure of distal symmetrical peripheral neuropathy in type 1 diabetes: results from the DCCT/EDIC study. Diabetes Care. (2010) 33:2635–41. doi: 10.2337/dc10-0616
11. Xiong Q, Lu B, Ye HY, Liu SY, Zheng HP, Zhang RY, et al. Corneal confocal microscopy as a non-invasive test to assess diabetic peripheral neuropathy. Diabetes Res Clin Pract. (2018) 136:85–92. doi: 10.1016/j.diabres.2017.11.026
12. Liu S, Zheng H, Zhu X, Mao F, Zhang S, Shi H, et al. Neutrophil-to-lymphocyte ratio is associated with diabetic peripheral neuropathy in type 2 diabetes patients. Diabetes Res Clin Pract. (2017) 130:90–7. doi: 10.1016/j.diabres.2017.05.008
13. Garrow AP, Boulton AJ. Vibration perception threshold–a valuable assessment of neural dysfunction in people with diabetes. Diabetes Metab Res Rev. (2006) 22:411–19. doi: 10.1002/dmrr.657
14. Landi F, Calvani R, Tosato M, Martone AM, Ortolani E, Savera G, et al. Protein intake and muscle health in old age: from biological plausibility to clinical evidence. Nutrients. (2016) 8(5):295. doi: 10.3390/nu8050295
15. Landi F, Cruz-Jentoft AJ, Liperoti R, Russo A, Giovannini S, Tosato M, et al. Sarcopenia and mortality risk in frail older persons aged 80 years and older: results from ilSIRENTE study. Age Ageing. (2013) 42:203–09. doi: 10.1093/ageing/afs194
16. Steffl M, Sima J, Shiells K, Holmerova I. The increase in health care costs associated with muscle weakness in older people without long-term illnesses in the Czech Republic: results from the Survey of Health, Ageing and Retirement in Europe (SHARE). Clin Interv Aging. (2017) 12:2003–07. doi: 10.2147/CIA.S150826
17. Sousa AS, Guerra RS, Fonseca I, Pichel F, Ferreira S, Amaral TF. Financial impact of sarcopenia on hospitalization costs. Eur J Clin Nutr. (2016) 70:1046–51. doi: 10.1038/ejcn.2016.73
18. Andersen H, Gjerstad MD, Jakobsen J. Atrophy of foot muscles: a measure of diabetic neuropathy. Diabetes Care. (2004) 27:2382–85. doi: 10.2337/diacare.27.10.2382
19. Andreassen CS, Jakobsen J, Andersen H. Muscle weakness: a progressive late complication in diabetic distal symmetric polyneuropathy. Diabetes. (2006) 55:806–12. doi: 10.2337/diabetes.55.03.06.db05-1237
20. Orlando G, Balducci S, Bazzucchi I, Pugliese G, Sacchetti M. Neuromuscular dysfunction in type 2 diabetes: underlying mechanisms and effect of resistance training. Diabetes Metab Res Rev. (2016) 32:40–50. doi: 10.1002/dmrr.2658
21. Moore CW, Allen MD, Kimpinski K, Doherty TJ, Rice CL. Reduced skeletal muscle quantity and quality in patients with diabetic polyneuropathy assessed by magnetic resonance imaging. Muscle Nerve. (2016) 53:726–32. doi: 10.1002/mus.24779
22. Yasemin Ö, Seydahmet A, Özcan K. Relationship between diabetic neuropathy and sarcopenia. Prim Care Diabetes. (2019) 13:521–28. doi: 10.1016/j.pcd.2019.04.007
23. Oh TJ, Song Y, Moon JH, Choi SH, Jang HC. Diabetic peripheral neuropathy as a risk factor for sarcopenia. Ann Geriatr Med Res. (2019) 23:170–75. doi: 10.4235/agmr.19.0039
24. Wannarong T, Sukpornchairak P, Naweera W, Geiger CD, Ungprasert P. Association between diabetic peripheral neuropathy and sarcopenia: A systematic review and meta-analysis. Geriatr Gerontol Int. (2022) 22:785–89. doi: 10.1111/ggi.14462
25. Skrivankova VW, Richmond RC, Woolf B, Yarmolinsky J, Davies NM, Swanson SA, et al. Strengthening the reporting of observational studies in epidemiology using mendelian randomization: the STROBE-MR statement. Jama. (2021) 326:1614–21. doi: 10.1001/jama.2021.18236
26. Lawlor DA, Tilling K, Davey SG. Triangulation in aetiological epidemiology. Int J Epidemiol. (2016) 45:1866–86. doi: 10.1093/ije/dyw314
27. Liu Y, Xu H, Zhao Z, Dong Y, Wang X, Niu J. No evidence for a causal link between Helicobacter pylori infection and nonalcoholic fatty liver disease: A bidirectional Mendelian randomization study. Front Microbiol. (2022) 13:1018322. doi: 10.3389/fmicb.2022.1018322
28. Jones G, Trajanoska K, Santanasto AJ, Stringa N, Kuo CL, Atkins JL, et al. Genome-wide meta-analysis of muscle weakness identifies 15 susceptibility loci in older men and women. Nat Commun. (2021) 12:654. doi: 10.1038/s41467-021-20918-w
29. Pei YF, Liu YZ, Yang XL, Zhang H, Feng GJ, Wei XT, et al. The genetic architecture of appendicular lean mass characterized by association analysis in the UK Biobank study. Commun Biol. (2020) 3:608. doi: 10.1038/s42003-020-01334-0
30. Burgess S, Butterworth A, Thompson SG. Mendelian randomization analysis with multiple genetic variants using summarized data. Genet Epidemiol. (2013) 37:658–65. doi: 10.1002/gepi.21758
31. Burgess S, Thompson SG. Avoiding bias from weak instruments in Mendelian randomization studies. Int J Epidemiol. (2011) 40:755–64. doi: 10.1093/ije/dyr036
32. Burgess S, Bowden J, Fall T, Ingelsson E, Thompson SG. Sensitivity analyses for robust causal inference from mendelian randomization analyses with multiple genetic variants. Epidemiology. (2017) 28:30–42. doi: 10.1097/EDE.0000000000000559
33. Lee CH, Cook S, Lee JS, Han B. Comparison of two meta-analysis methods: inverse-variance-weighted average and weighted sum of Z-scores. Genomics Inform. (2016) 14:173–80. doi: 10.5808/GI.2016.14.4.173
34. Walker VM, Davies NM, Hemani G, Zheng J, Haycock PC, Gaunt TR, et al. Using the MR-Base platform to investigate risk factors and drug targets for thousands of phenotypes. Wellcome Open Res. (2019) 4:113. doi: 10.12688/wellcomeopenres.15334.2
35. Hemani G, Bowden J, Davey SG. Evaluating the potential role of pleiotropy in Mendelian randomization studies. Hum Mol Genet. (2018) 27:R195–208. doi: 10.1093/hmg/ddy163
36. Hartwig FP, Davey SG, Bowden J. Robust inference in summary data Mendelian randomization via the zero modal pleiotropy assumption. Int J Epidemiol. (2017) 46:1985–98. doi: 10.1093/ije/dyx102
37. Boulton AJ, Vinik AI, Arezzo JC, Bril V, Feldman EL, Freeman R, et al. Diabetic neuropathies: a statement by the American Diabetes Association. Diabetes Care. (2005) 28:956–62. doi: 10.2337/diacare.28.4.956
38. Roberts HC, Denison HJ, Martin HJ, Patel HP, Syddall H, Cooper C, et al. A review of the measurement of grip strength in clinical and epidemiological studies: towards a standardised approach. Age Ageing. (2011) 40:423–29. doi: 10.1093/ageing/afr051
39. Chen LK, Woo J, Assantachai P, Auyeung TW, Chou MY, Iijima K, et al. Asian working group for sarcopenia: 2019 consensus update on sarcopenia diagnosis and treatment. J Am Med Dir Assoc. (2020) 21:300–07. doi: 10.1016/j.jamda.2019.12.012
40. Zhu X, Zhang X, Zhou C, Li B, Huang Y, Li C, et al. Walking pace and microvascular complications among individuals with type 2 diabetes: A cohort study from the UK Biobank. Scand J Med Sci Sports. (2024) 34:e14501. doi: 10.1111/sms.14501
41. Zhang Q, Lin Y, Liu X, Zhang L, Zhang Y, Zhao D, et al. Diabetic peripheral neuropathy affects pinch strength and hand dexterity in elderly patients. Neural Plast. (2021) 2021:9959103. doi: 10.1155/2021/9959103
42. Yang Q, Zhang Y, Zeng Q, Yang C, Shi J, Zhang C, et al. Correlation between diabetic peripheral neuropathy and sarcopenia in patients with type 2 diabetes mellitus and diabetic foot disease: A cross-sectional study. Diabetes Metab Syndr Obes. (2020) 13:377–86. doi: 10.2147/DMSO.S237362
43. Chen S, Yan S, Aiheti N, Kuribanjiang K, Yao X, Wang Q, et al. A bi-directional Mendelian randomization study of sarcopenia-related traits and type 2 diabetes mellitus. Front Endocrinol (Lausanne). (2023) 14:1109800. doi: 10.3389/fendo.2023.1109800
44. Andreassen CS, Jakobsen J, Ringgaard S, Ejskjaer N, Andersen H. Accelerated atrophy of lower leg and foot muscles–a follow-up study of long-term diabetic polyneuropathy using magnetic resonance imaging (MRI). Diabetologia. (2009) 52:1182–91. doi: 10.1007/s00125-009-1320-0
45. Zhang Y, Shen X, He L, Zhao F, Yan S. Association of sarcopenia and muscle mass with both peripheral neuropathy and nerve function in patients with type 2 diabetes. Diabetes Res Clin Pract. (2020) 162:108096. doi: 10.1016/j.diabres.2020.108096
46. Han SJ, Boyko EJ, Kim SK, Fujimoto WY, Kahn SE, Leonetti DL. Association of thigh muscle mass with insulin resistance and incident type 2 diabetes mellitus in Japanese americans. Diabetes Metab J. (2018) 42:488–95. doi: 10.4093/dmj.2018.0022
Keywords: diabetic neuropathy (DN), diabetes, sarcopenia, causality, Mendelian randomization (MR), cross-sectional study, correlation
Citation: Fang Y, Yuan X, Zhang Q, Liu J, Yao Q and Ye X (2024) Causality between sarcopenia and diabetic neuropathy. Front. Endocrinol. 15:1428835. doi: 10.3389/fendo.2024.1428835
Received: 07 May 2024; Accepted: 27 August 2024;
Published: 13 September 2024.
Edited by:
Keiichiro Susuki, right State University, United StatesReviewed by:
Jin Zhang, University of Mississippi Medical Center, United StatesSilvia Giovannini, Catholic University of the Sacred Heart, Italy
Copyright © 2024 Fang, Yuan, Zhang, Liu, Yao and Ye. This is an open-access article distributed under the terms of the Creative Commons Attribution License (CC BY). The use, distribution or reproduction in other forums is permitted, provided the original author(s) and the copyright owner(s) are credited and that the original publication in this journal is cited, in accordance with accepted academic practice. No use, distribution or reproduction is permitted which does not comply with these terms.
*Correspondence: Xinhua Ye, RW5kb2NyaW5lbDEzMTRAMTYzLmNvbQ==