- 1School of Clinical Medicine, Jiangxi University of Chinese Medicine, Nanchang, Jiangxi, China
- 2Guang'anmen Hospital, China Academy of Chinese Medical Sciences, Beijing, China
- 3Affiliated Hospital of Jiangxi University of Chinese Medicine, Nanchang, Jiangxi, China
Background: Previous studies have shown a significantly increased prevalence of osteoporosis (OP) in patients with type 2 diabetes mellitus (T2DM), which is closely associated with inflammation and nutrition. This study aimed to investigate the relationship between the advanced lung cancer inflammation index (ALI) and OP in patients with T2DM.
Methods: This cross-sectional analysis was conducted based on data from middle-aged and older adults aged 50 years and older with T2DM from the National Health and Nutrition Examination Survey (NHANES).Weighted multivariable logistic regression and linear regression were utilized to investigate the correlation between the ALI and OP with femur bone mineral density (BMD) in individuals with T2DM. Restricted cubic splines (RCS) were employed to assess potential nonlinear relationships, and receiver operating characteristic (ROC) curves were used to evaluate diagnostic accuracy.
Results: A total of 1596 patients with T2DM were included in this study, among whom 736 had OP. After adjusting for covariates, the multivariable logistic regression model showed that compared to participants in the fourth quartile of log2-transformed ALI, those in the first quartile had an increased prevalence of OP in T2DM (OR = 1.95, 95% CI=1.28-2.96, p < 0.01). The multivariable linear regression model indicated that a low log2-transformed ALI is associated with a low femur BMD.RCS demonstrated a linear dose-response relationship between the ALI index and OP in T2DM (p = 0.686), with the area under the ROC curve being 0.57 (95% CI: 0.54-0.60, p < 0.001), and the optimal cutoff value was 6.04.
Conclusion: Our findings indicate that low levels of ALI are independently associated with an increased prevalence of OP in middle-aged and older adults with T2DM in the United States. ALI may serve as a potential biomarker for assessing the prevalence of OP in middle-aged and older adults with T2DM.
Introduction
Osteoporosis (OP) is a metabolic skeletal condition characterized by diminished bone density and degradation of bone microstructure, ultimately resulting in heightened bone fragility and vulnerability to fractures (1). This condition substantially amplifies the likelihood of disability, hospitalization, and mortality (2, 3). In the United States, approximately 10.2 million individuals aged 50 and above are affected by OP, a number projected to swell to 13.46 million by 2030 (4), imposing significant economic burdens on both individuals and society.
Diabetes, as a disease posing a significant threat to global health, with over 90% of cases being type 2 diabetes mellitus (T2DM) (5), has recently shown a high prevalence of OP among T2DM patients, reaching up to 27.67% (6). Furthermore, OP is increasingly acknowledged as a consequence of diabetes (7). Presently, bone mineral density (BMD) ascertained through dual-energy X-ray absorptiometry (DXA) stands as the standard technology for clinically evaluating bone strength. However, there are indications that it might underestimate fracture risk in diabetic patients (8). Additionally, several studies indicate that fractures in diabetic patients have worse outcomes compared to normal controls (9, 10). Importantly, OP is often challenging to detect before fragility fractures occur, leading to delayed diagnosis and treatment (11). Therefore, identifying new and beneficial early screening tools for OP in T2DM patients is crucial.
Previous studies have indicated that the pathogenesis of OP involves various factors, including oxidative stress, inflammation, nutritional status, physical activity, and their potential interactions (12–14). Overproduction of reactive oxygen species (ROS) triggers abnormalities in osteoblasts (15), heightened levels of pro-inflammatory cytokines affect bone resorption (16), and increase in the number of osteoclasts (17). The advanced lung cancer inflammation index (ALI) is derived by multiplying body mass index (BMI) with serum albumin and dividing it by the neutrophil-to-lymphocyte ratio (NLR), reflecting nutritional and inflammatory status (18). It has been used not only in lung cancer patients but also has shown close associations with the prognosis of hypertension and heart failure in recent years (19, 20). Moreover, it is calculated from objective parameters obtained through laboratory tests, making it clinically practical. However, the role of ALI in OP among patients with T2DM remains unclear. Therefore, this study utilizes the National Health and Nutrition Examination Survey (NHANES) database to explore the correlation between ALI and OP in patients with T2DM.
Materials and methods
Data source and participants
The NHANES survey adopts a sophisticated, multi-stage probability sampling framework overseen by the Centers for Disease Control and Prevention (CDC). Its primary objective is to evaluate the health and nutritional condition of a nationally representative cross-section of adults and children in the United States. Presently, data collection and dissemination follow a biennial pattern, encompassing demographic, dietary, physical examination, laboratory, and questionnaire data. Approval for the NHANES protocol has been granted by the Research Ethics Review Board of the National Center for Health Statistics, and written informed consent has been secured from all participants.
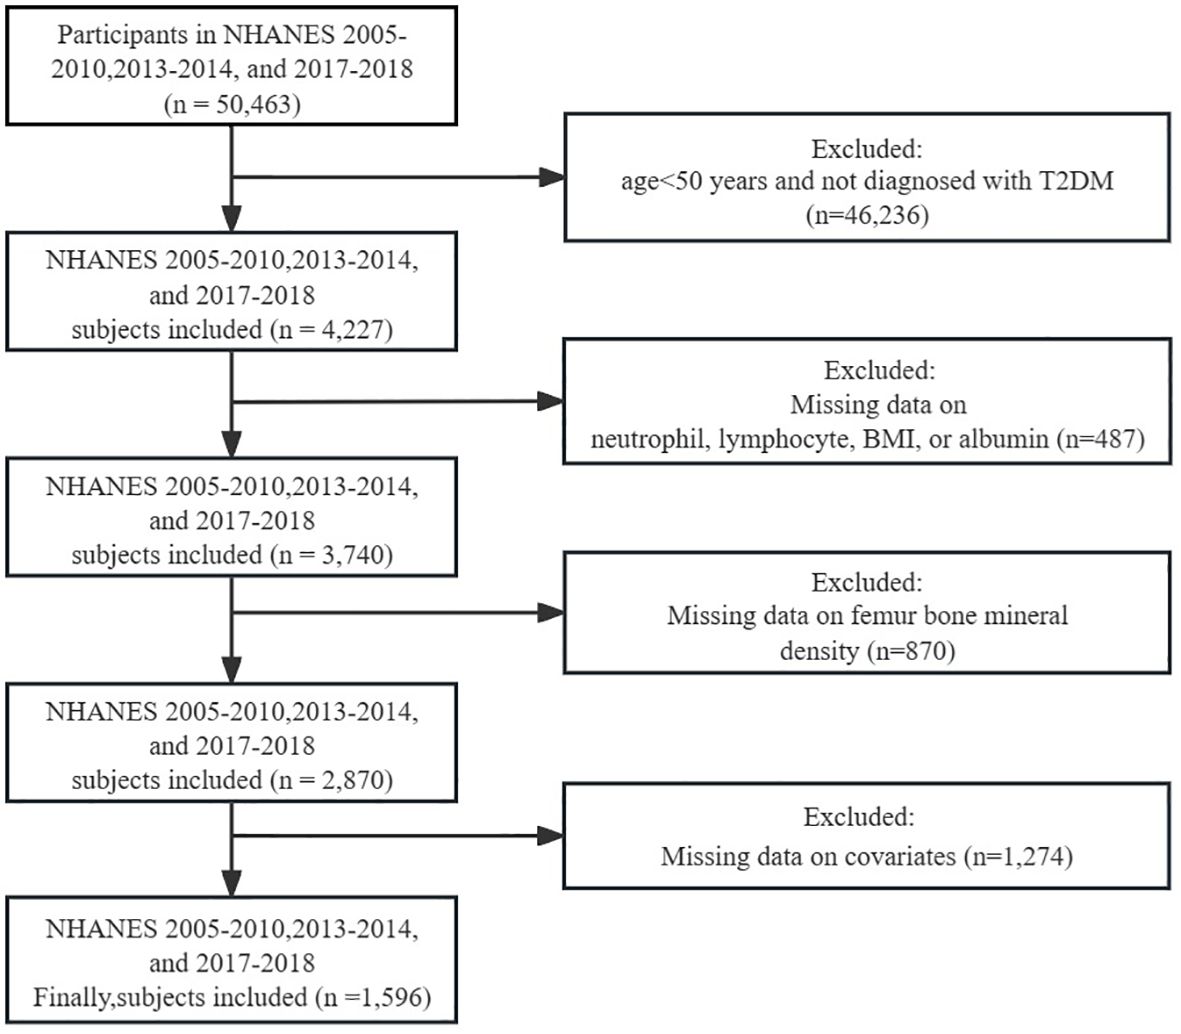
For this cross-sectional investigation, data from five NHANES cycles spanning from 2005-2010, 2013-2014, and 2017-2018 were extracted as the foundation for analysis. Participants were disqualified if they: (1) were under 50 years of age and not diagnosed with T2DM; (2) had missing data for neutrophils, lymphocytes, BMI, or albumin; (3) had missing data for femur BMD; (4) had missing data for covariates. Ultimately, a total of 1596 individuals satisfied the inclusion criteria for this investigation (Figure 1).
Assessment of exposure
The calculation formula for ALI is as follows: ALI = BMI (kg/m2) × albumin level (g/dL)/NLR, where NLR is determined from the ratio of neutrophil count to absolute lymphocyte count. Due to the right-skewed distribution of ALI, log2 transformation was applied during the regression analysis (Supplementary Figure S1). According to quartiles, log2-ALI levels were divided into four groups,Q1(<5.406)、Q2(>5.406,≤5.911)、Q3(>5.911, ≤6.361)、Q4(>6.361).
Assessment of outcome
We delineated T2DM in accordance with the standards established by the International Diabetes Federation (IDF): (1) medically confirmed diabetes; (2) utilization of oral hypoglycemic agents or insulin; (3) random/oral glucose tolerance test with a 2-hour blood glucose level ≥11.1 mmol/L; (4) fasting blood glucose ≥7.0 mmol/L; (5) glycated hemoglobin (HbA1c) ≥6.5%. The definition of OP is based on the classification criteria established by the World Health Organization, which defines it as a BMD value in any region of the femur that is 2.5 standard deviations (SD) or more below the mean value of a young adult reference population (21); DXA measurements of BMD were performed using a Hologic QDR-4500A fan-beam densitometer (Hologic, Inc., Bedford, Massachusetts). Total femur, femoral neck, trochanter, and intertrochanteric regions were included in the assessment of OP, and respective reference ranges were obtained from previously published NHANES III reports (22).
Covariates
The factors considered in this study encompass age, sex, race, marital status, education attainment, smoking status, poverty income ratio (PIR), BMI, physical activity, aspartate aminotransferase (AST), alanine aminotransferase (ALT), alkaline phosphatase (ALP), serum creatinine, serum uric acid, blood urea nitrogen, serum calcium, serum phosphorus, glycated hemoglobin (HbA1c), triglycerides, total cholesterol, cardiovascular disease (CVD), hypertension, and cancer. Race is categorized into 4 groups: non-Hispanic White, non-Hispanic Black, Mexican American, or Other; marital status is divided into 3 categories: married/cohabiting, never married, and widowed/divorced/separated; education attainment is classified into 5 categories: less than 9th grade, 9-11th grade, high school graduate/GED certificate, some college or associate’s degree, and college graduate or higher. Smoking status is divided into 3 groups: never smokers, former smokers, and current smokers; never smokers are defined as smoking fewer than 100 cigarettes in their lifetime, former smokers are defined as smoking more than 100 cigarettes but currently not smoking, and current smokers are defined as smoking more than 100 cigarettes and currently smoking. PIR is categorized as ≤1.3, 1.3-3.5, and >3.5. Physical activity is converted into metabolic equivalent (MET) scores, where the weekly time spent on each leisure activity reported by participants is multiplied by the MET value of that activity to obtain weekly MET-minute index, with MET minutes/week ≥500 considered as physically active and MET minutes/week <500 considered as physically inactive, following the criteria recommended by NHANES (23). CVD is defined based on the presence of congestive heart failure (CHF)/coronary heart disease (CHD)/angina/heart attack/stroke. Hypertension is determined by self-reported hypertension, average systolic blood pressure ≥140 mmHg, average diastolic blood pressure ≥90 mmHg, or the use of antihypertensive medications. Cancer is defined based on whether a physician has ever told you that you have cancer or malignancy.
Statistical analysis
Our study accounted for the intricate sampling design and sample weights utilized in NHANES. Categorical variables were depicted as numbers and percentages (%), whereas continuous variables were expressed as mean ± standard error (SE). Weighted t-tests were employed for continuous variables, and weighted chi-square tests were utilized to discern significant disparities in population characteristics among categorical variables.
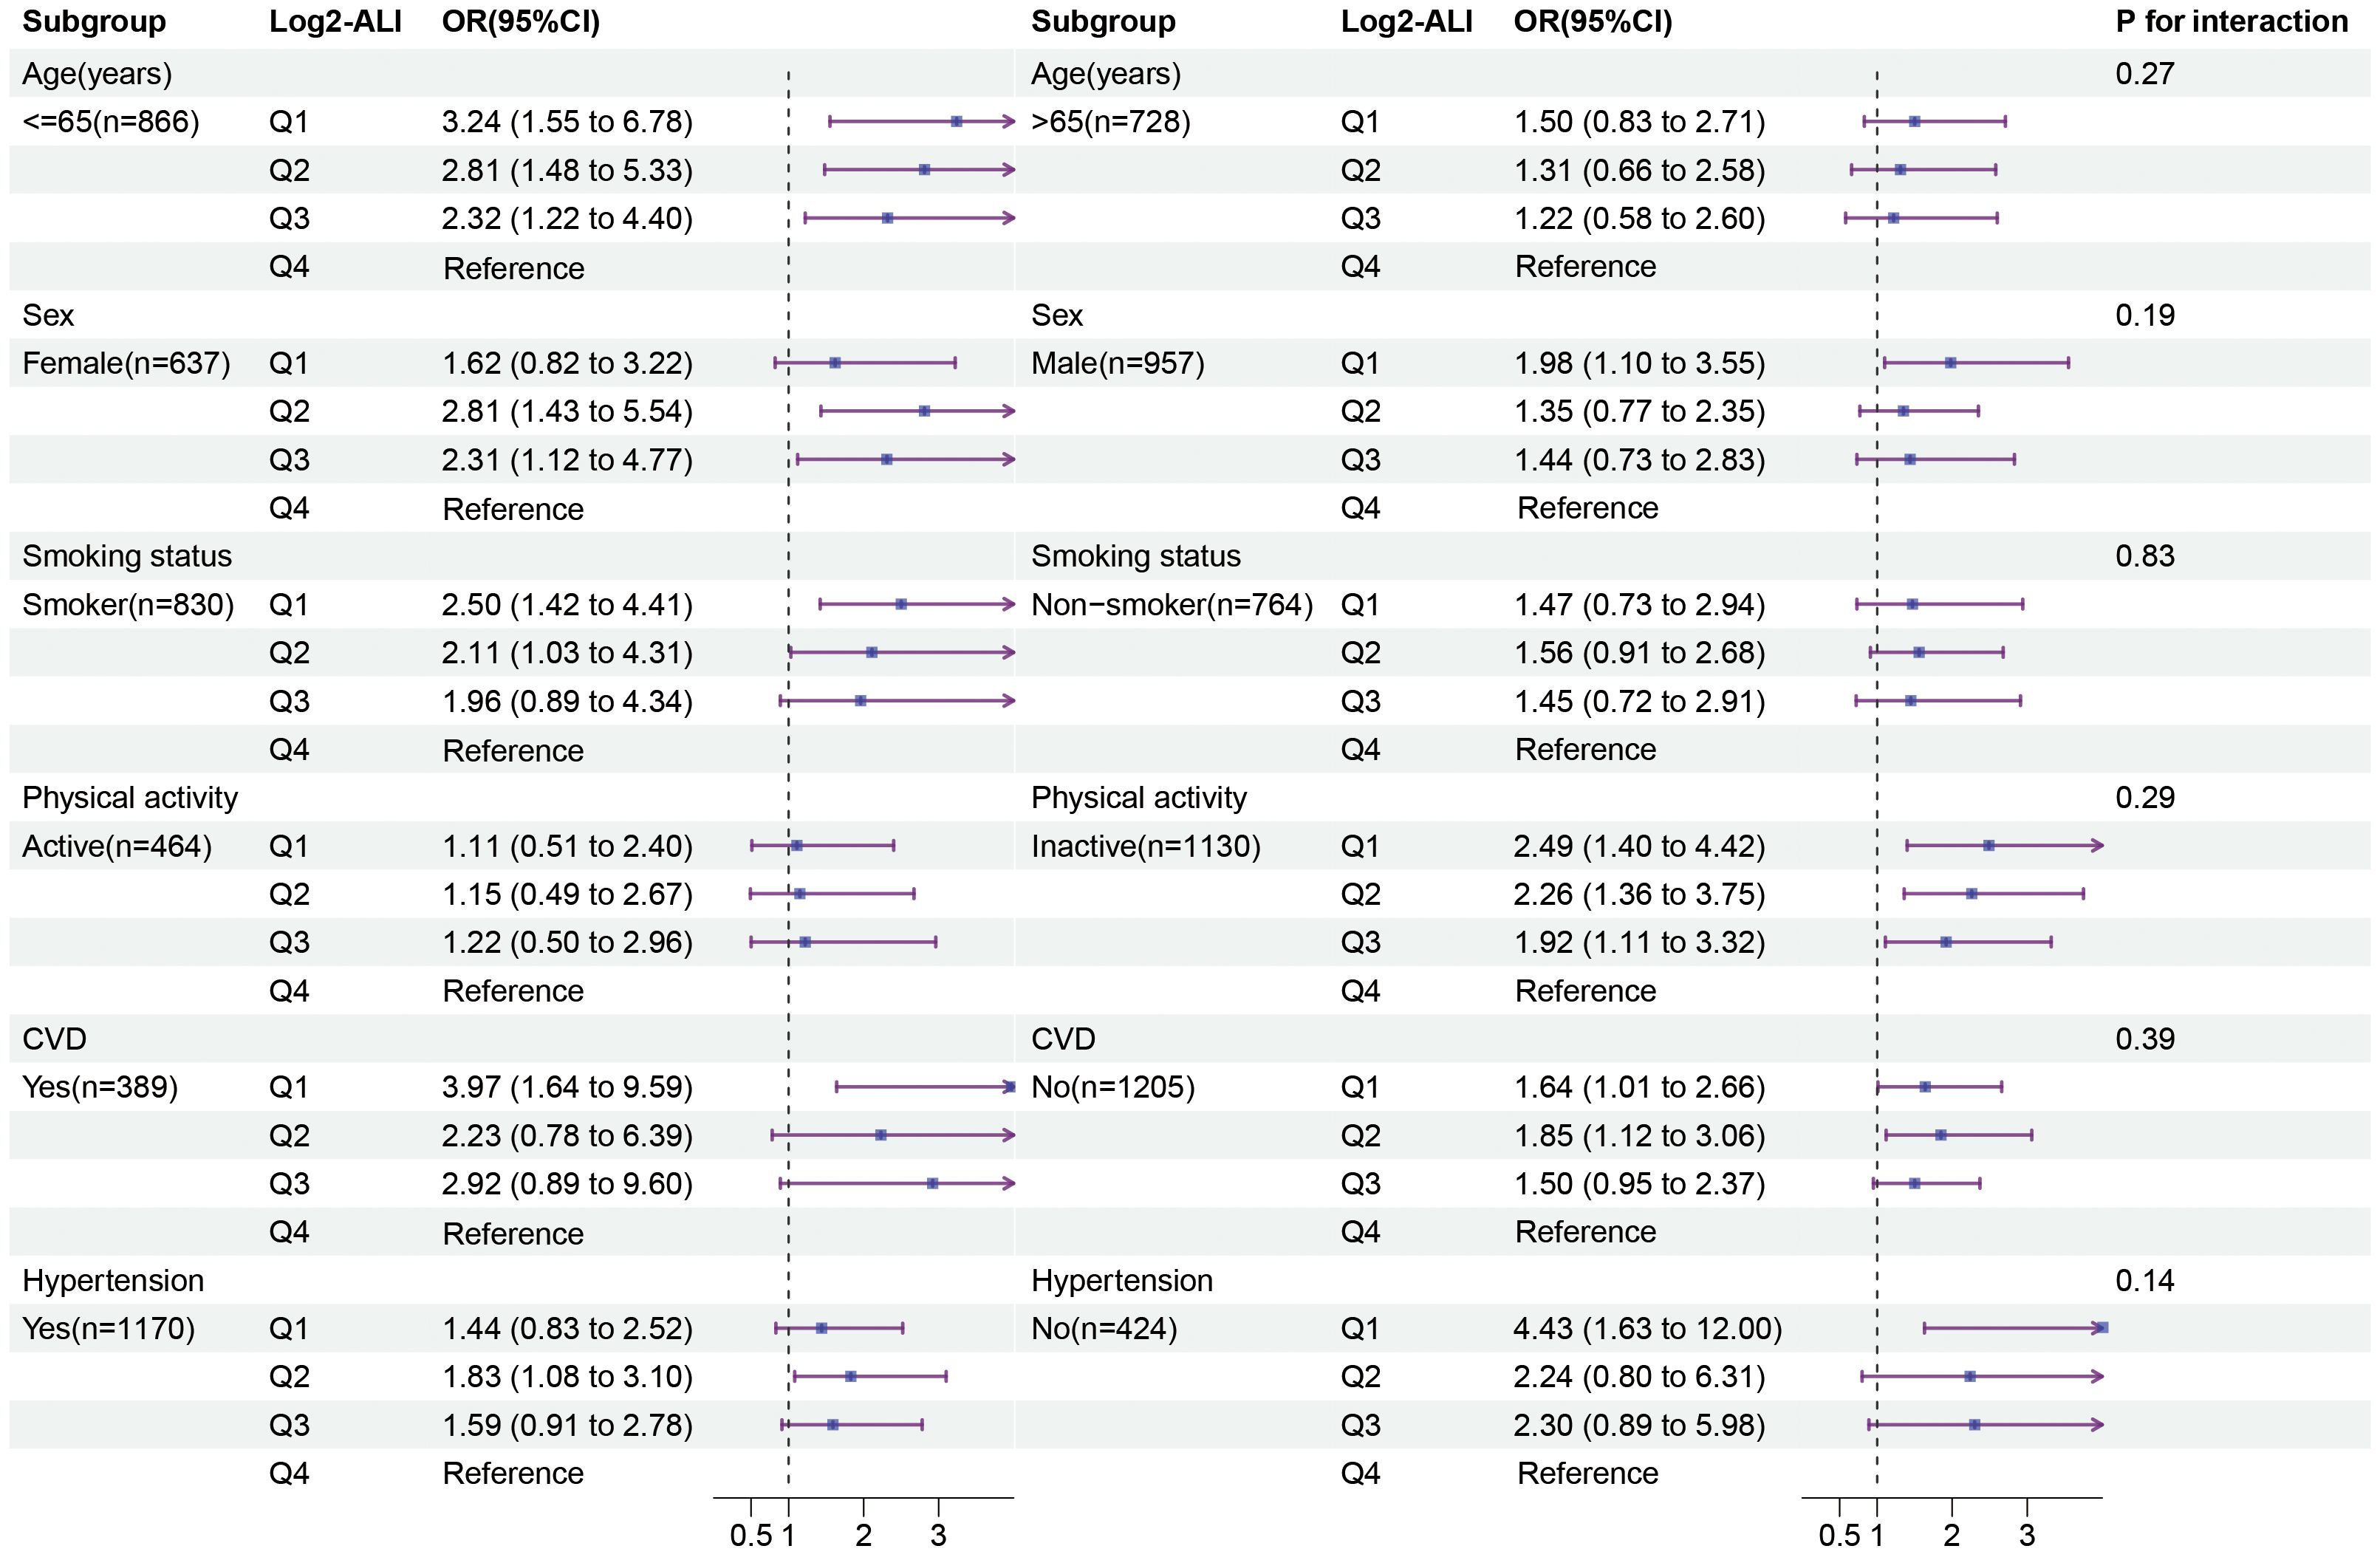
We employed weighted univariate and multivariate logistic regression models to explore the relationship between ALI and OP in the T2DM population, with findings presented as odds ratios (ORs) and corresponding 95% confidence intervals (CIs). Weighted multivariate linear regression models were employed to assess the association between ALI and femur BMD in T2DM, with results presented as β coefficients and 95% CIs. Regression models were constructed by gradually adjusting covariates: the crude model was unadjusted, model 1 adjusted for age, sex, and race; model 2 further adjusted for smoking status, marital status, education level, PIR, and physical activity on the basis of model 1; model 3 additionally adjusted for AST, ALT, ALP, serum creatinine, serum uric acid, blood urea nitrogen, serum calcium, serum phosphorus, HbA1c, triglycerides, total cholesterol, CVD, hypertension, and cancer. Additionally, a linear trend test was conducted by converting the categorical variables of log2-ALI quartiles into continuous variables. To investigate the nonlinear correlation between ALI and OP, as well as femur BMD in T2DM, restricted cubic splines (RCS) with three knots (at the 10th, 50th, and 90th percentiles) were utilized to examine the dose-response relationship in Model 3. The area under the receiver operating characteristic (ROC) curve was employed to assess the predictive accuracy of ALI for identifying OP patients within the T2DM population and to ascertain the optimal cutoff point. In addition, subgroup and interaction analyses were conducted based on age (<65 years or ≥65 years), sex (male or female), smoking status (smoker or non-smoker), physical activity (active or inactive), hypertension (yes or no), and cardiovascular disease (CVD) (yes or no).
Finally, we conducted a series of sensitivity analyses, specifically including: (1) repeating the primary analysis using a binary approach to log2-ALI based on the optimal cutoff point; (2) excluding patients with cancer, malignancy, or liver disease; (3) adjusting for medication usage, including daily intake of prednisone or cortisone, current use of diabetes medication or insulin, with relevant categorization (no medication use, prednisone or cortisone only, diabetes medication or insulin only, concurrent use of prednisone or cortisone with diabetes medication or insulin); (4) considering that metabolic dysfunction-associated fatty liver disease (MAFLD), as a metabolic disease, is closely related to bone metabolism (24, 25), we included MAFLD and conducted subgroup analyses based on MAFLD (yes or no).The definition of MAFLD is provided in the Supplementary Table S1; (5) we incorporated the inflammatory marker C-reactive protein(CRP) to reflect the inflammatory status and analyzed the correlation between ALI and CRP to assess the reliability of ALI in reflecting inflammation in patients with T2DM. The statistical significance threshold was established at p < 0.05 (two-tailed). All statistical analyses were conducted using R Studio (version 4.2.2).
Results
Baseline characteristics of the population
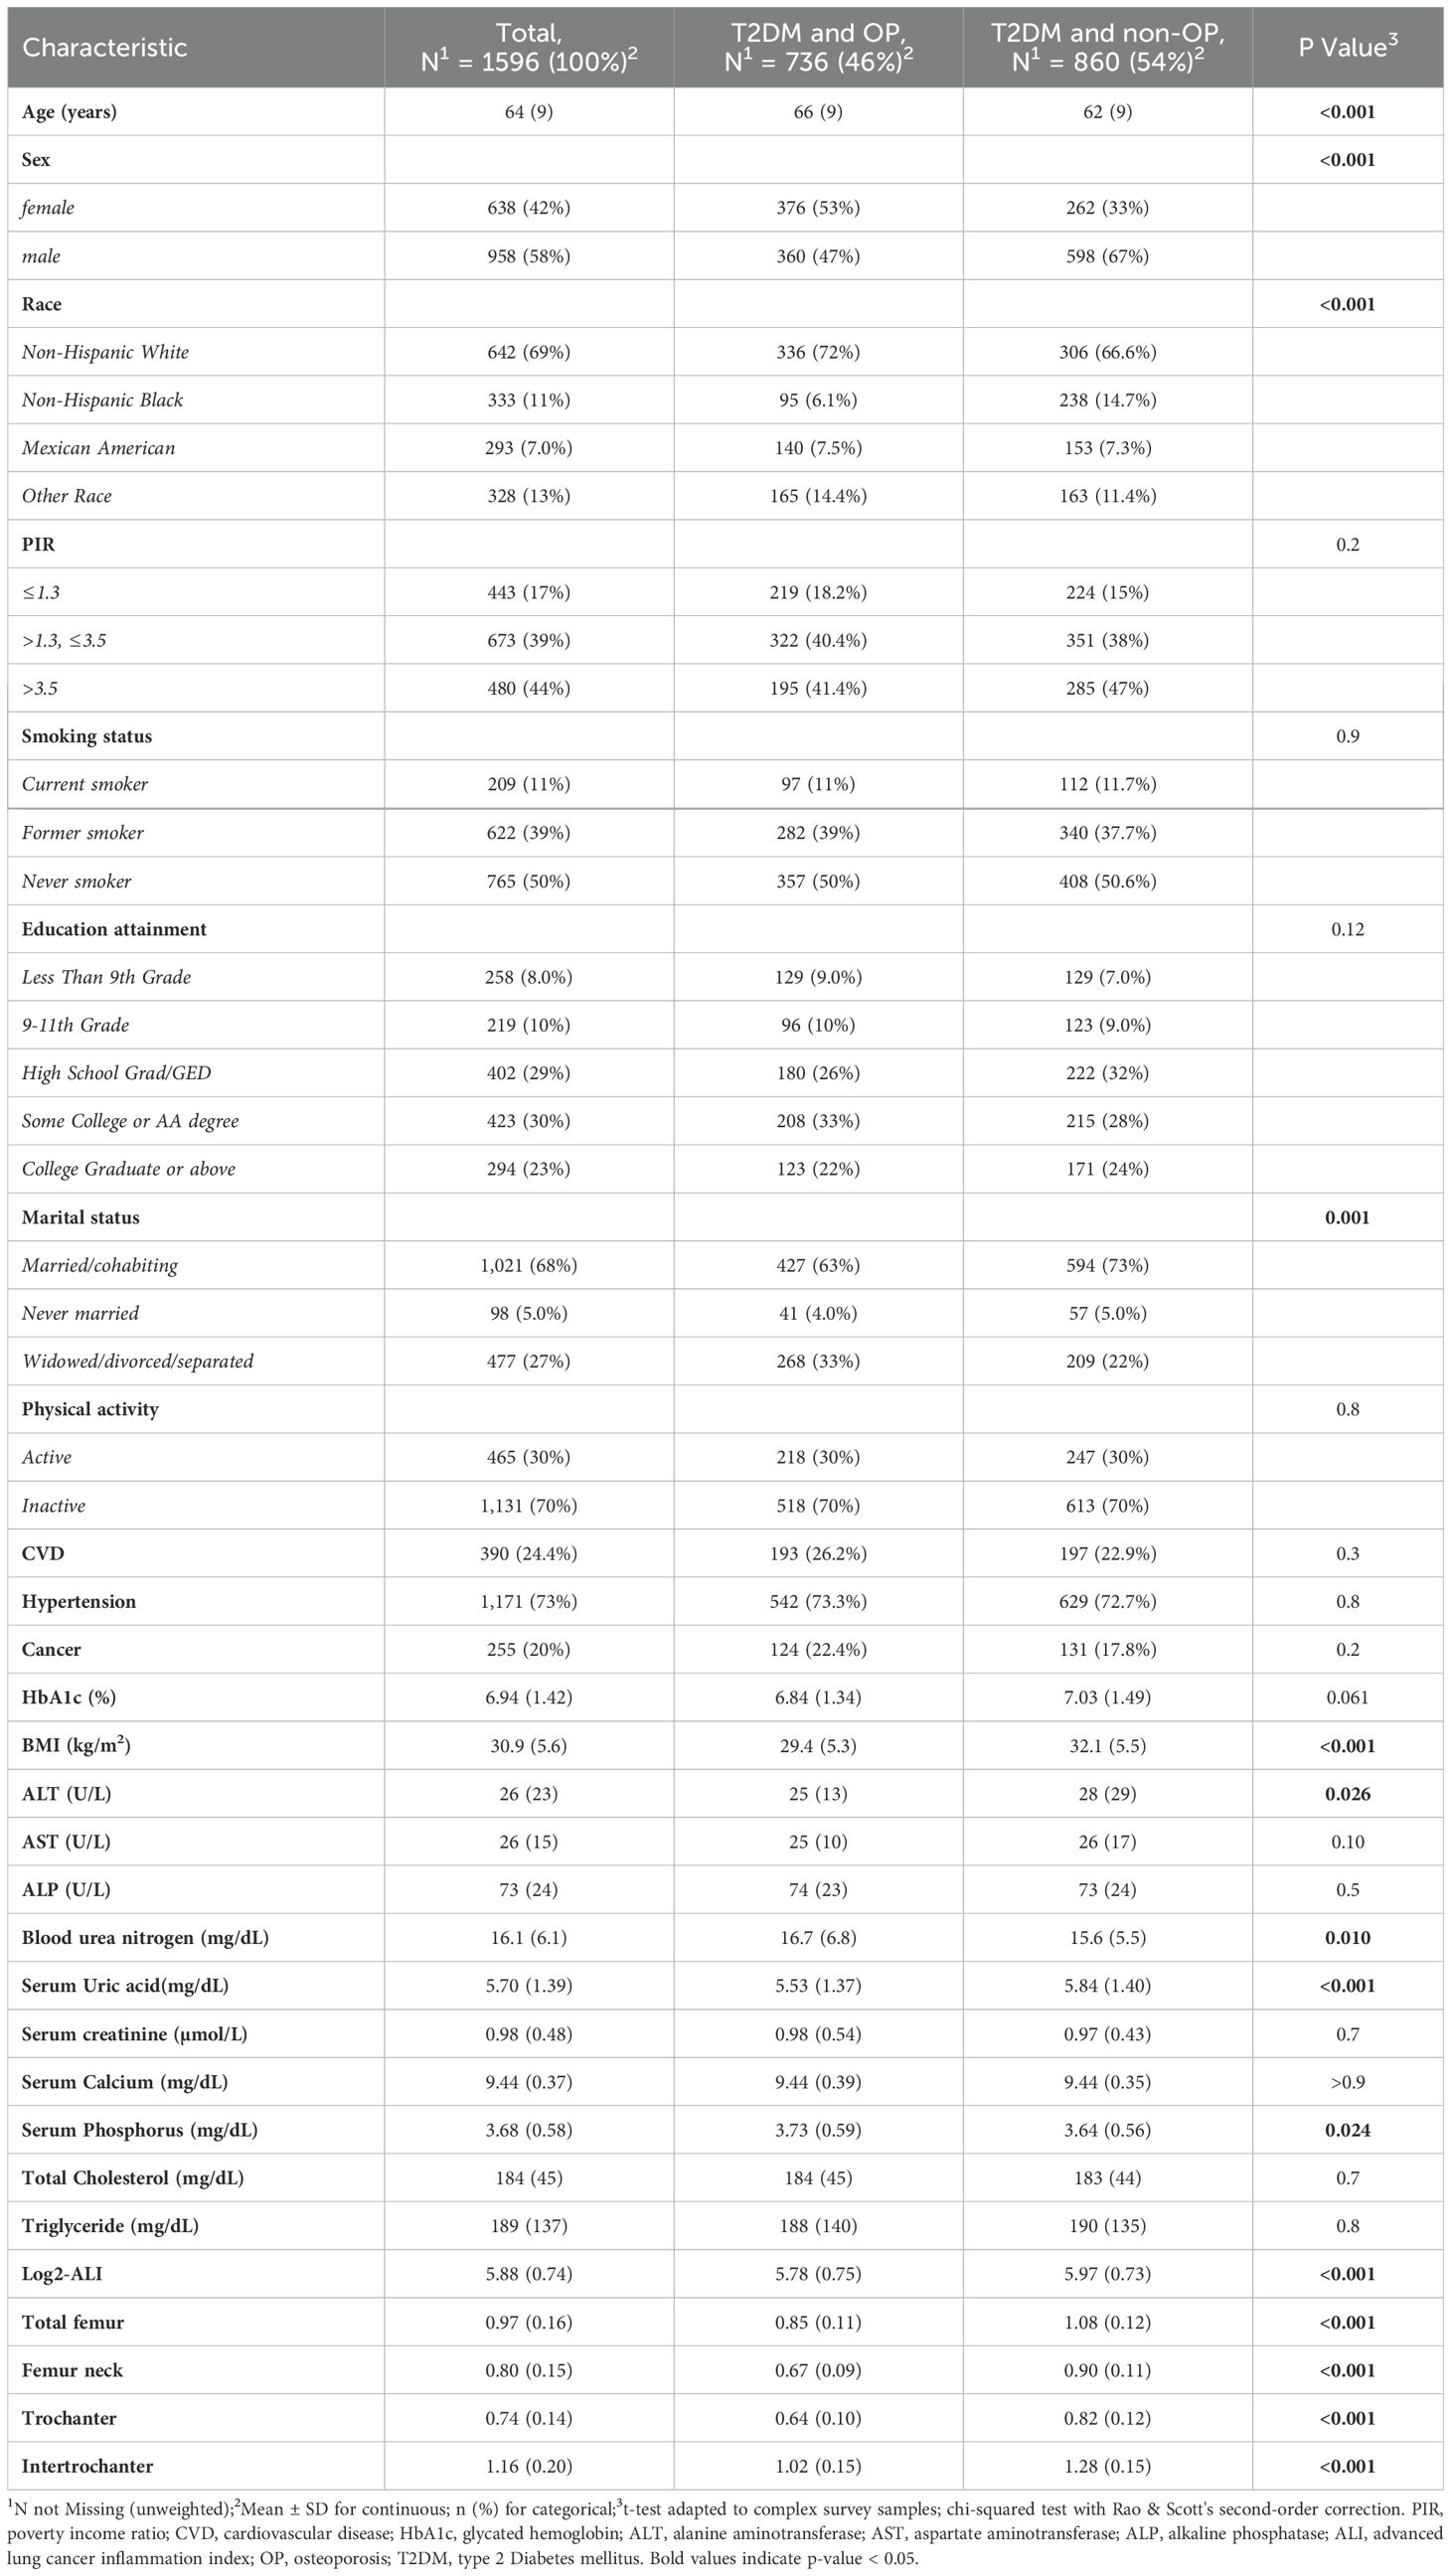
This study included a total of 1596 middle-aged and elderly participants with T2DM, with a weighted average age of 64 years (SE = 9). Among them, 736 individuals (weighted proportion: 46%) were classified as having OP, including 360 males (47%) and 376 females (53%). Compared to the non-OP group, OP patients were likely to be older (66 (9) vs. 62 (9)) and more likely to be female (376 [53%] vs. 262 [33%]). They were also more likely to be non-Hispanic White (336 [72%] vs. 306 [66.6%]) and in the Widowed/divorced/separated status (268 [33%] vs. 209 [22%]). Additionally, significant differences between the two groups were observed in sex, BMI, ALT, blood urea nitrogen, serum uric acid, serum phosphorus, Log2-ALI, total femur, femur neck, trochanter, and intertrochanter (all p < 0.05). No significant differences were observed between the two groups in terms of PIR, smoking status, education level, physical activity, CVD, hypertension, cancer, HbA1c, AST, ALP, serum creatinine, serum calcium, total cholesterol, and triglycerides (Table 1).
Association between ALI with OP and femur BMD in T2DM
The univariate analysis indicated that sex, age, race, education attainment, marital status, ALT, blood urea nitrogen, serum uric acid, serum phosphorus, and ALI were associated with OP in patients with T2DM (Supplementary Table S2).
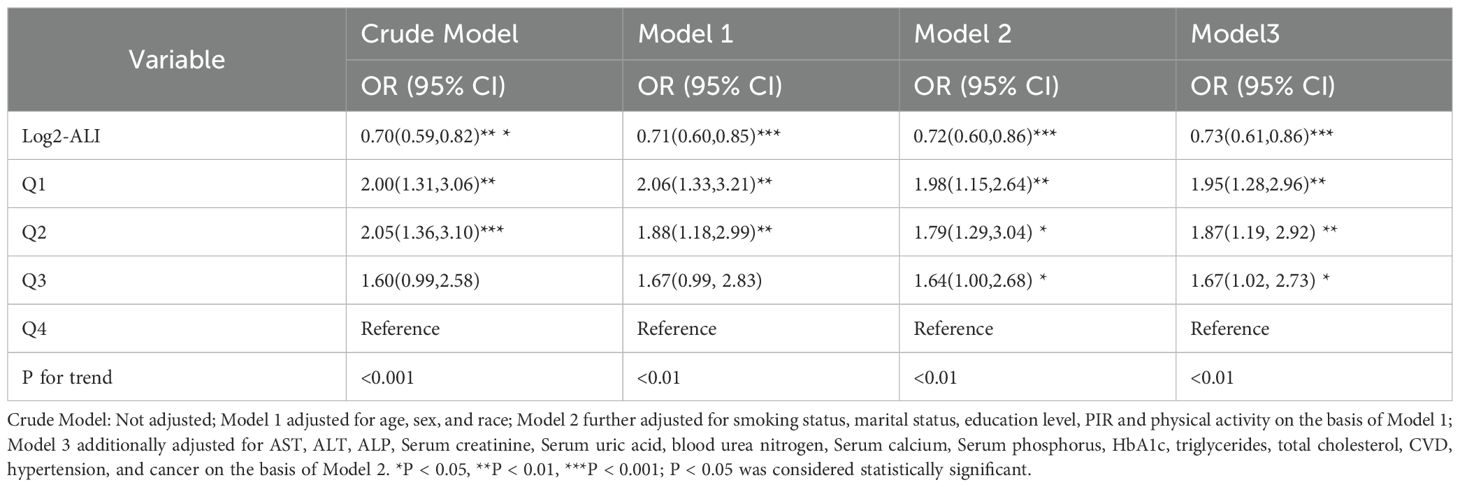
The multivariable regression model shows a significant association between log2-ALI and the prevalence of OP in the population with T2DM. In the fully adjusted model (Model 3), compared to the fourth quartile of log2-ALI, the prevalence of OP significantly increased in the third to first quartiles (p for trend < 0.01), with increases of 67% (OR = 1.67; 95% CI: 1.02-2.73), 87% (OR = 1.87; 95% CI: 1.19-2.92), and 95% (OR = 1.95; 95% CI: 1.28-2.96) respectively (Table 2).
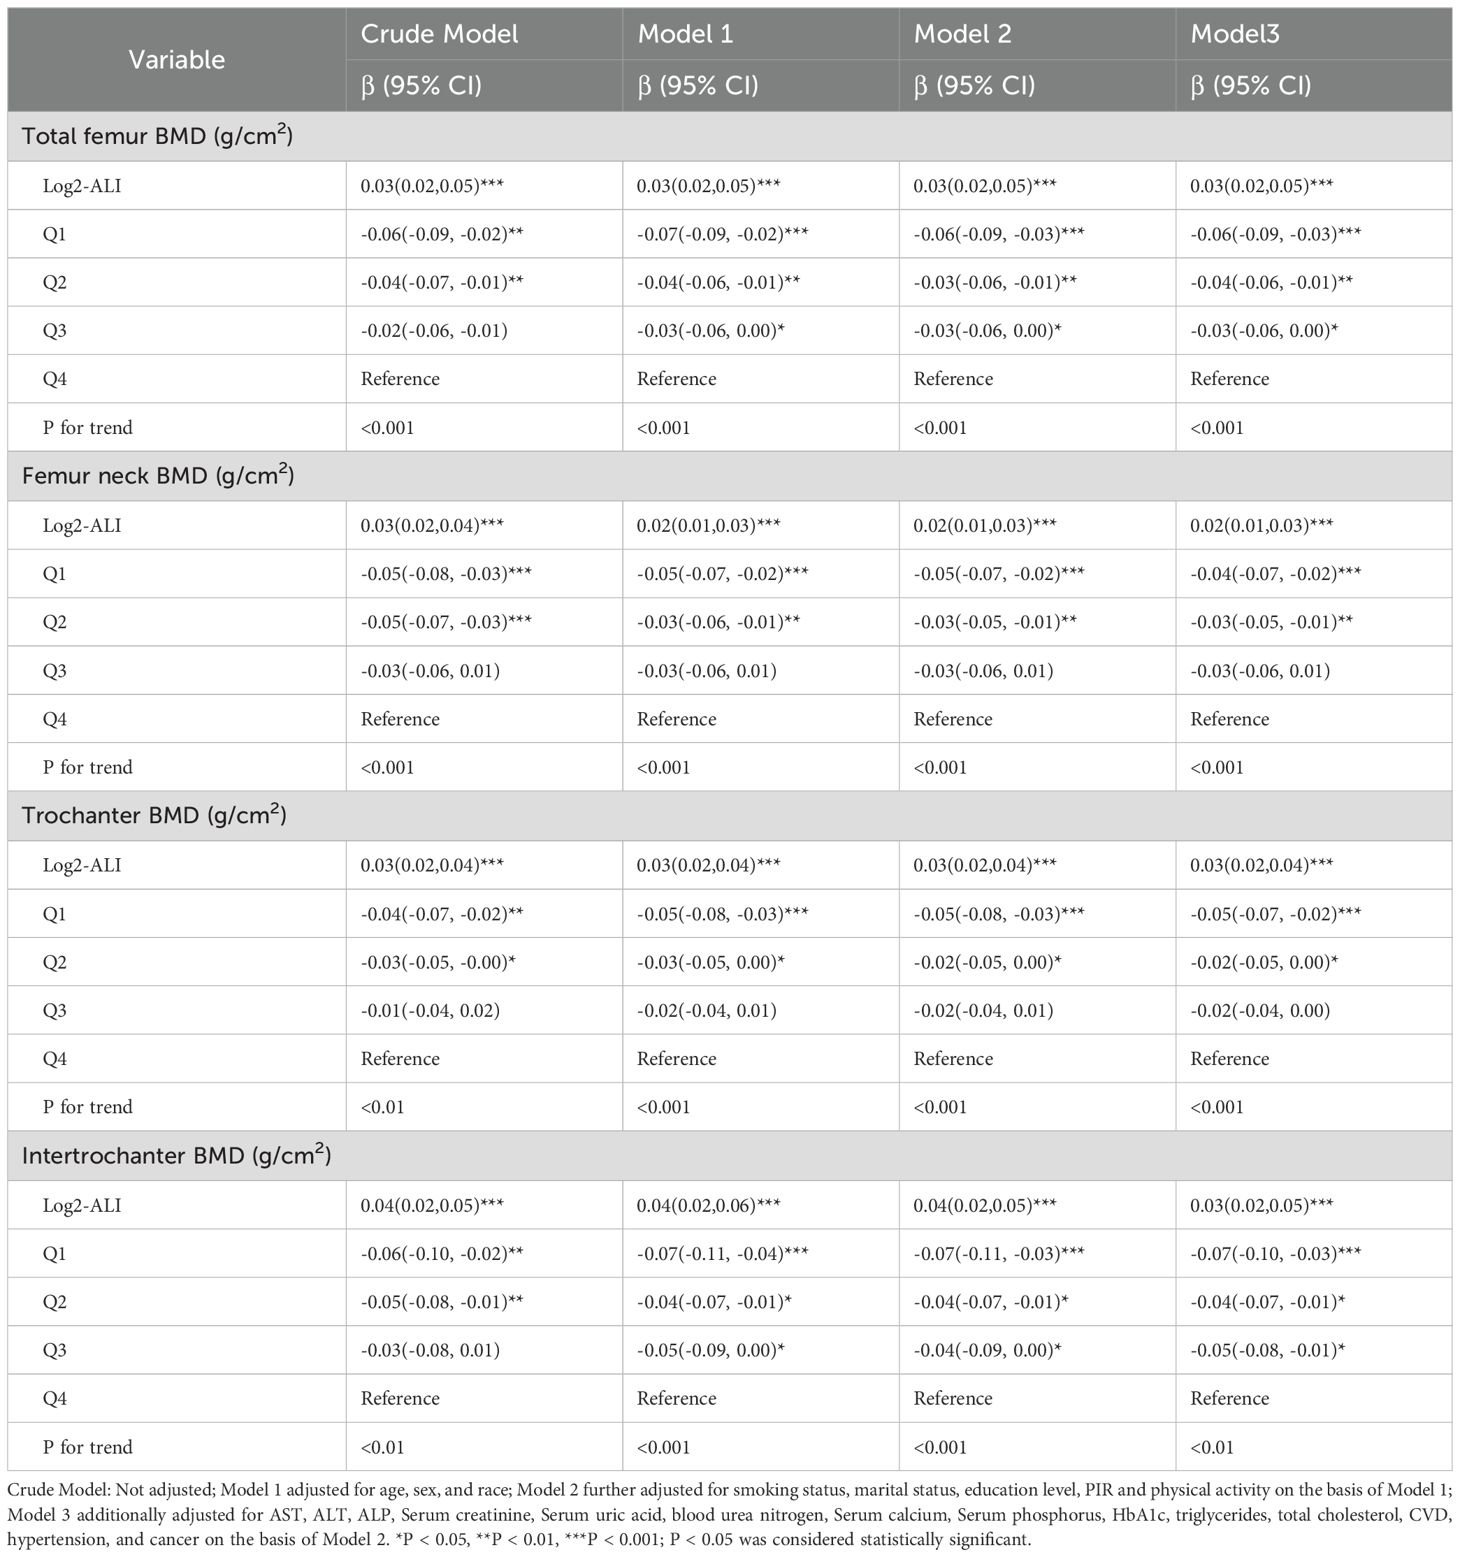
Furthermore, in the fully adjusted model, log2-ALI remained significantly associated with femur BMD. Specifically, compared to the fourth quartile of log2-ALI, the first quartile showed negative correlations with total femur BMD (β = -0.06; 95% CI: -0.09 - -0.03), femoral neck BMD (β = -0.04; 95% CI: -0.07 - -0.02), trochanter BMD (β = -0.05; 95% CI: -0.07 - -0.02), and intertrochanteric BMD (β = -0.07; 95% CI: -0.10 - -0.03) (p for trend < 0.01) (Table 3).
Nonlinear relationship and ROC curve
We evaluated the dose-response relationship between ALI and OP, as well as femur BMD in patients with T2DM based on Model 3. RCS analysis indicated a linear dose-response relationship between log2-ALI and OP in the overall population (p for nonlinear = 0.62). Stratified analysis by gender showed consistent trends with the overall population (all p for nonlinear > 0.05) (Figure 2). Regarding femur BMD, a nonlinear relationship was observed between log2-ALI and trochanter BMD (p for nonlinear = 0.04), while linear relationships were found with total femur BMD, femur neck BMD, and intertrochanter BMD (all p for nonlinear > 0.05) (Figure 3).
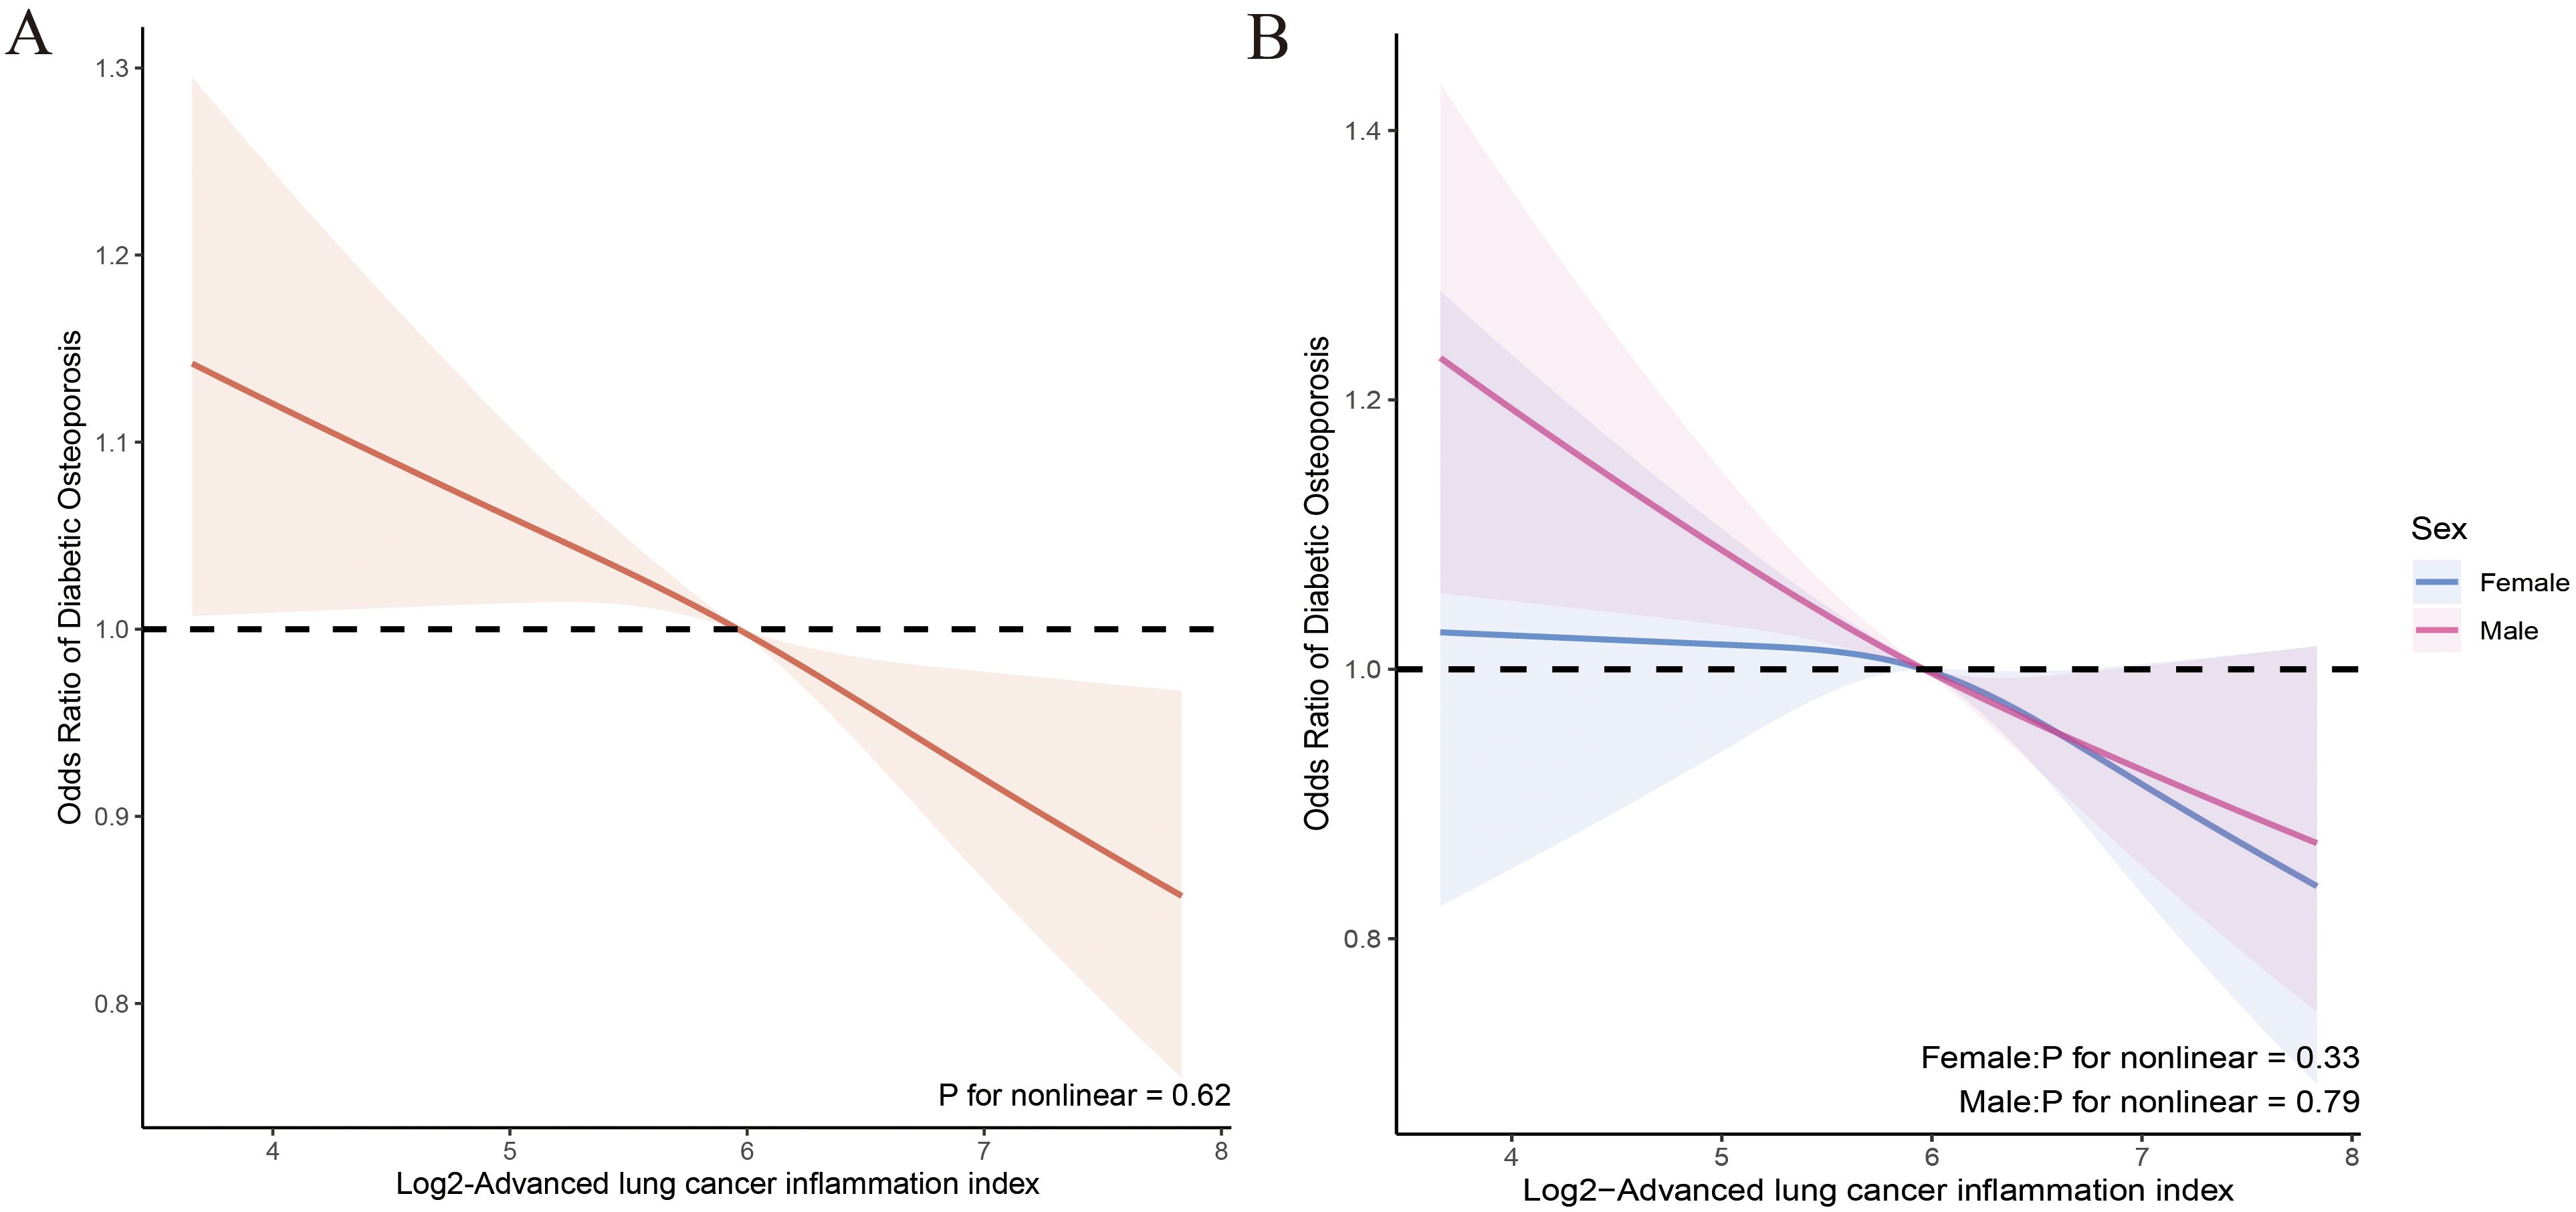
Figure 2. Relationship between Log2-ALI and the prevalence of OP in patients with T2DM. (A) Overall population; (B) Stratified population by sex.
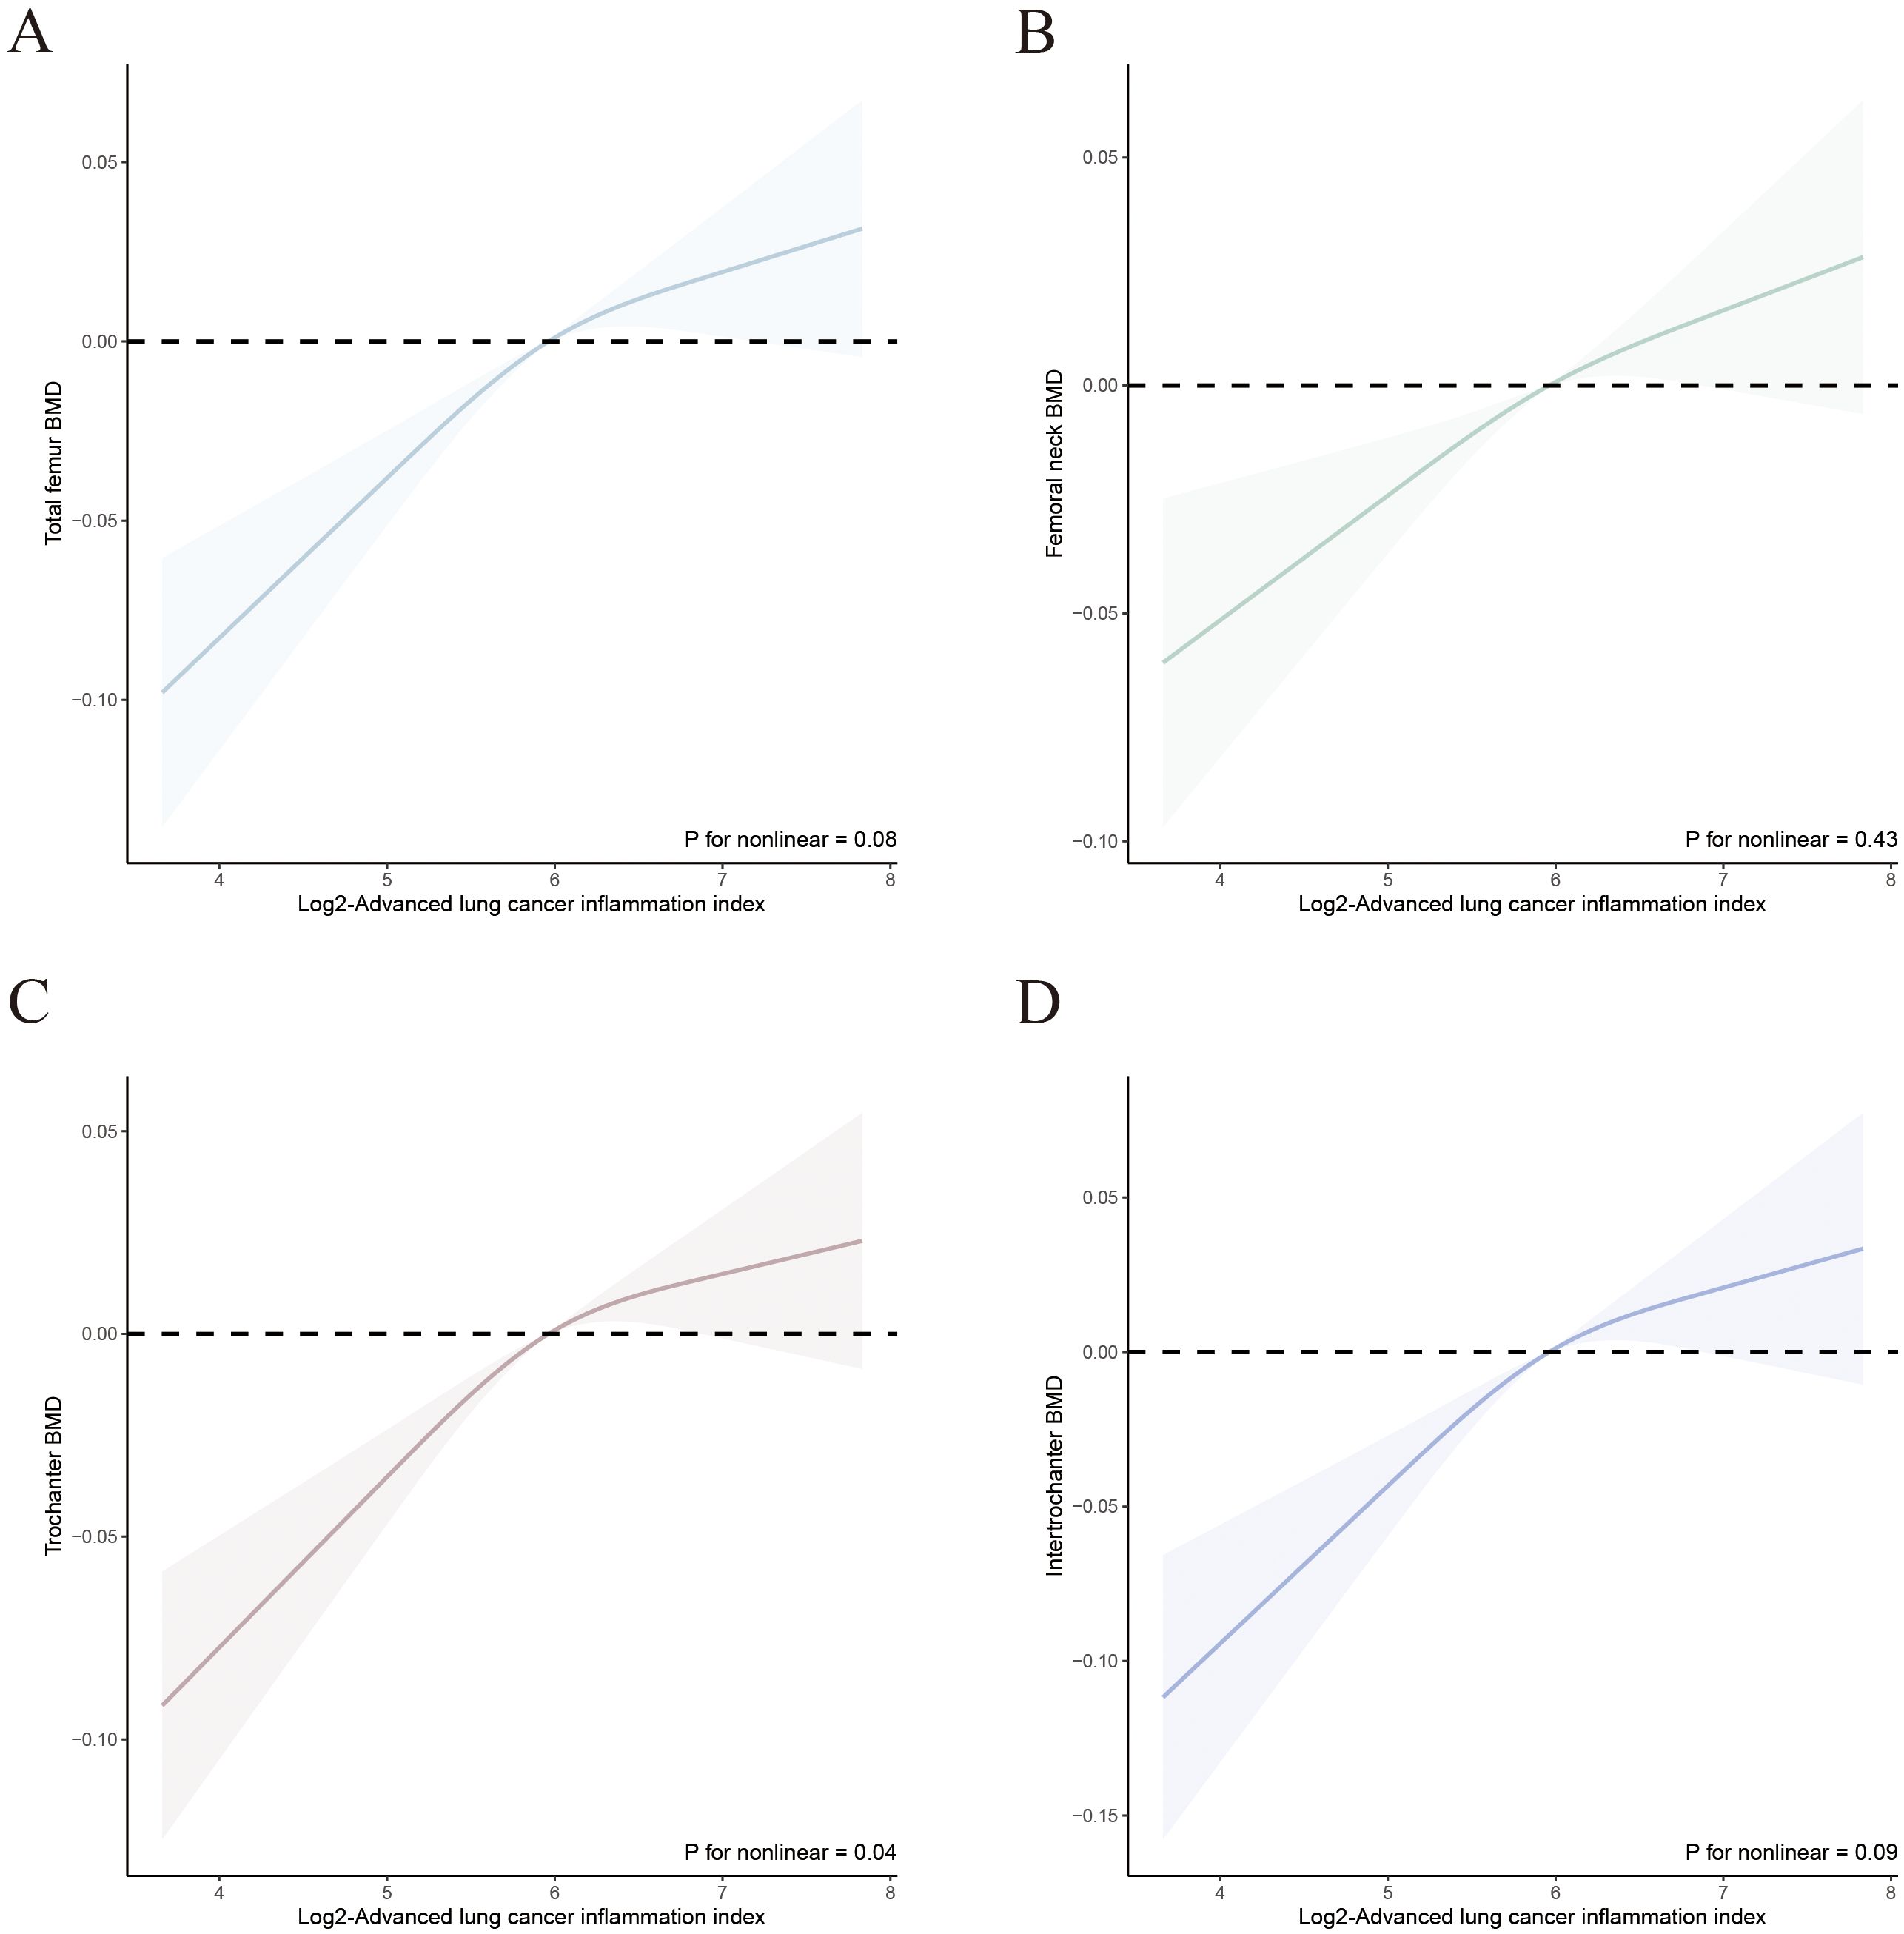
Figure 3. Relationship between Log2-ALI and femur BMD in T2DM. (A) Total femur BMD; (B) Femur neck BMD; (C) Trochanter BMD; (D) Intertrochanter BMD.
The ROC curve indicated that the area under the curve (AUC) for predicting the ROC curve when Log2-ALI was considered as a continuous variable was 0.57 (95% CI: 0.54-0.60, p < 0.001). The optimal cutoff value was 6.04, with corresponding sensitivity and specificity of 61.1% and 50.8%, respectively. Furthermore, the predictive ROC curve areas for models 1, 2, and 3 were all statistically significant, with an AUC of 0.72 (95% CI: 0.70–0.74, p < 0.001) in the fully adjusted model (Model 3) (Figure 4).
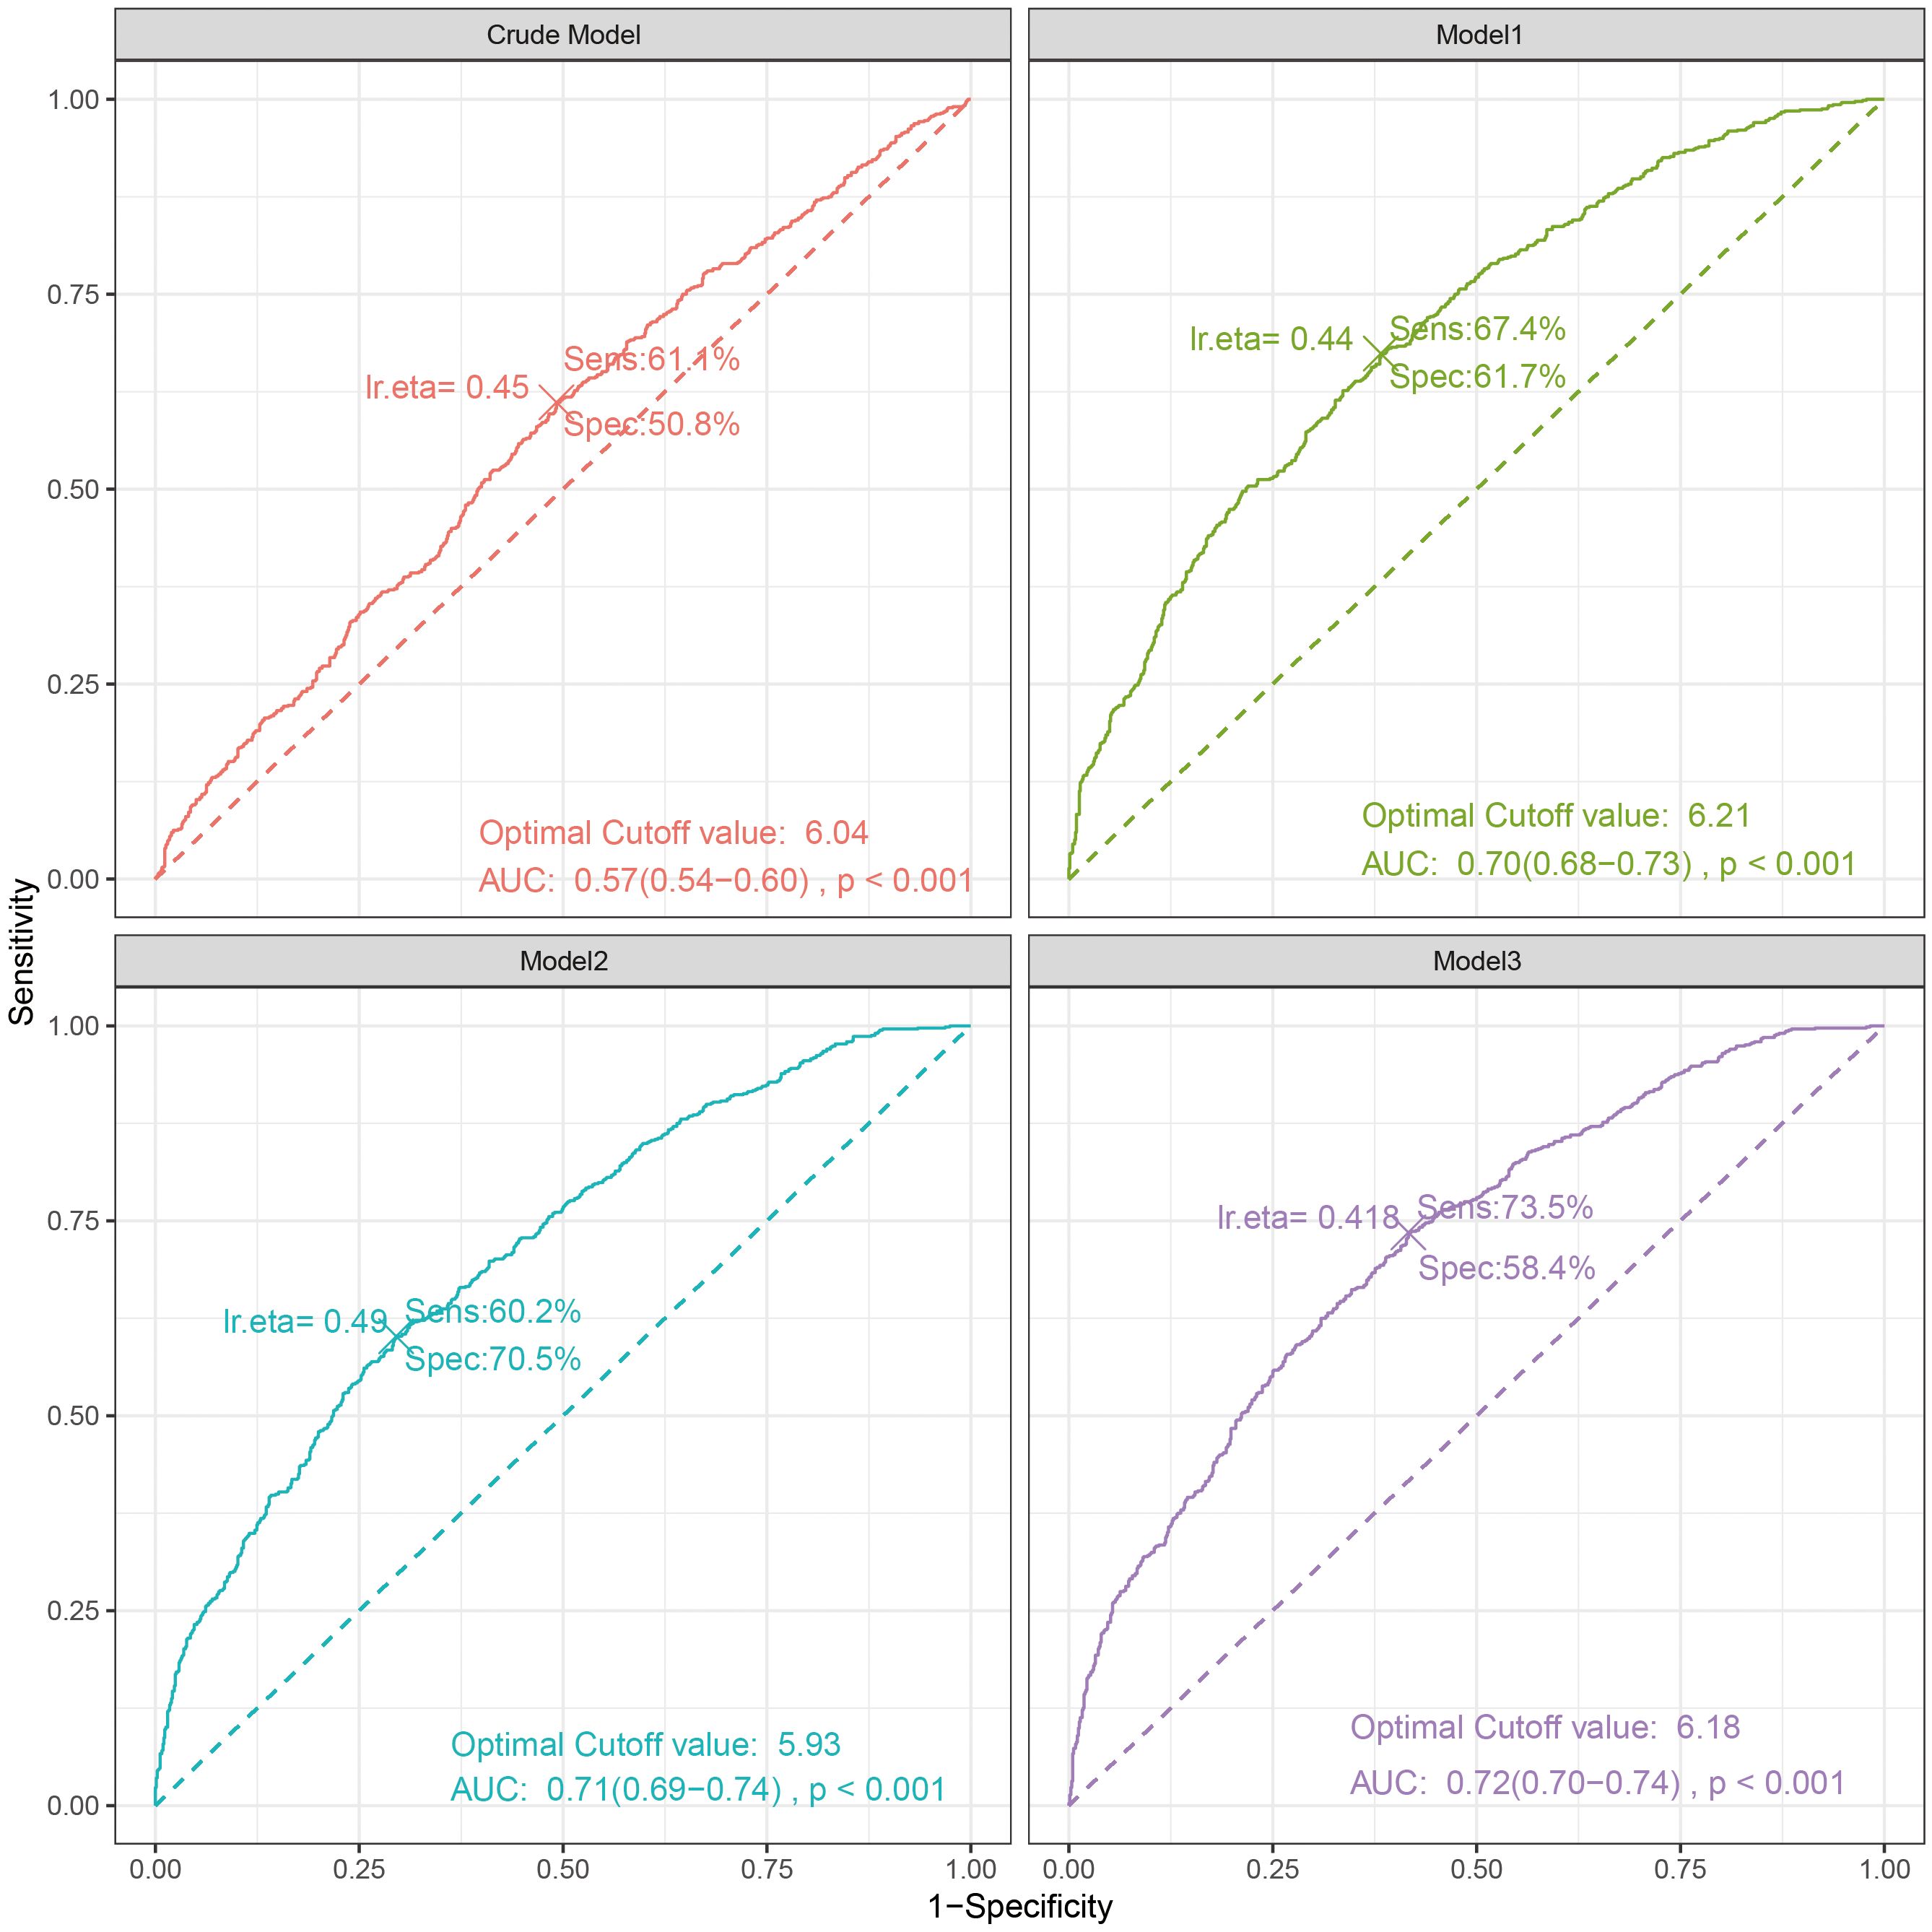
Figure 4. The ROC curve between Log2-ALI (continuous) and OP in T2DM. Sens, sensibility; Spec, specificity; AUC, area under the curve.
Subgroup and sensitivity analysis
We examined the potential differences in the association between ALI and OP among patients with T2DM based on age, sex, smoking status, physical activity, CVD, and hypertension subgroups. The results indicated that, compared to the fourth quartile of Log2-ALI, the first quartile was more strongly associated with the prevalence of OP in individuals under 60 years old (OR = 3.24; 95% CI: 1.55–6.78), smokers (OR = 2.50; 95% CI: 1.42–4.41), and those with low physical activity (OR = 2.49; 95% CI: 1.40–4.42) (Figure 5). No significant differences were found in terms of sex, CVD, and hypertension. Additionally, subgroup analysis for MAFLD showed that, compared to the fourth quartile of Log2-ALI, the first quartile exhibited a stronger association with the prevalence of OP in MAFLD patients (OR = 5.76; 95% CI: 1.11–29.9) (Supplementary Table S3). Finally, no interactions were observed in any of the above subgroups (all p for interaction > 0.05).
Based on the optimal cutoff value of Log2-ALI determined by the ROC curve (6.04), Log2-ALI was divided into two groups (high: >6.04, low: ≤6.04), and weighted logistic regression was used to analyze the association between Log2-ALI and OP in T2DM again. The results indicated that in the fully adjusted model, the low Log2-ALI group was consistently positively associated with the prevalence of OP compared to the high Log2-ALI group (OR = 1.62; 95% CI: 1.20 – 2.19) (Supplementary Table S4). Furthermore, compared to the high Log2-ALI group, the low Log2-ALI group showed significant negative correlations with total femur BMD (β = -0.04; 95% CI: -0.06 – -0.02), femoral neck BMD (β = -0.02; 95% CI: -0.04 – 0.00), trochanteric BMD (β = -0.03; 95% CI: -0.05 – -0.01), and intertrochanteric BMD (β = -0.04; 95% CI: -0.06 – -0.01) (Supplementary Table S5).
After excluding participants with cancer, malignancies, or liver disease, a total of 1,233 participants remained. We then reanalyzed the association between Log2-ALI and OP in individuals with T2DM. The results we obtained were stable; specifically, in the fully adjusted model, the prevalence of OP in the first quartile of Log2-ALI was positively correlated with that of participants in the fourth quartile (OR = 2.03; 95% CI: 1.23–3.33) (Supplementary Table S6). We also observed consistent directional associations between Log-ALI and femur BMD in line with previous analyses (Supplementary Table S7).
Certainly, we also adjusted for medication use, and the association between Log2-ALI and OP, as well as between Log2-ALI and femur BMD, remained consistent. In the fully adjusted model, compared to participants in the fourth quartile, the Log2-ALI in the second quartile showed a positive correlation with the prevalence of OP (OR = 1.76; 95% CI: 1.08 – 2.86) (Supplementary Table S8). Furthermore, there were significant negative correlations between Log2-ALI in the first quartile and total femur BMD (β = -0.05; 95% CI: -0.08 – -0.02), femoral neck BMD (β = -0.04; 95% CI: -0.06 – -0.01), trochanteric BMD (β = -0.04; 95% CI: -0.07 – -0.01), and intertrochanteric BMD (β = -0.06; 95% CI: -0.10 – -0.02) compared to participants in the fourth quartile (Supplementary Table S9).
Finally, we included CRP in the analysis, with 878 participants remaining. The baseline characteristics of the participants are shown in Supplementary Table S10, where a significant difference in CRP was observed between the OP and non-OP groups (p < 0.05). Additionally, we performed a correlation analysis between Log2-ALI and CRP using weighted logistic regression. The results indicated that in the fully adjusted model, there was a negative correlation between Log2-ALI and CRP (β = -0.13; 95% CI: -0.22, -0.05) (Supplementary Table S11). Overall, the results of the sensitivity analysis were stable.
Discussion
T2DM and OP are both metabolic diseases with significant global prevalence. In this study, we focused on middle-aged and older patients with T2DM in the United States and found that low levels of ALI are associated with the prevalence of osteoporosis and low femur BMD among T2DM patients. This association remains significant even after accounting for relevant confounding variables. Additionally, further RCS analysis revealed a linear relationship between ALI levels and the prevalence of OP in T2DM patients, which is consistent across both genders. Through ROC curve analysis, the optimal cutoff value was determined to be 6.04. Various subgroup analyses and sensitivity assessments further reinforced the robustness of our conclusions. In summary, evaluating ALI levels could aid in identifying the prevalence of osteoporosis among T2DM patients in the United States.
The occurrence of OP is closely related to significant alterations in the bone remodeling process due to the imbalance between osteoclasts and osteoblasts (26), with oxidative-reductive status and inflammation playing crucial roles in osteoclast and osteoblast generation (27). Excessive production of ROS and elevated levels of pro-inflammatory cytokines can impair bone cell function, negatively impacting osteoblast proliferation, differentiation, and maturation, while accelerating the generation of osteoclasts, leading to changes in bone structure and loss of bone mass (28, 29). In comparison to healthy individuals, inflammatory cytokine levels are higher in diabetic populations, potentially indicating a chronic inflammatory state (30, 31). Additionally, hyperglycemic conditions can trigger the release of pro-inflammatory cytokines, leading to ROS production (32, 33), directly affecting osteoblast differentiation and survival. It is noteworthy that prolonged hyperglycemia, inflammation, and oxidative stress contribute to elevated levels of advanced glycation end products (AGEs) in T2DM. On one hand, AGEs accumulation leads to decreased bone turnover rates and compromised bone strength (34), while on the other hand, AGEs inhibit crucial endoplasmic reticulum functions essential for osteoblast differentiation and activity, and increase osteoblast apoptosis (35, 36). Activation of AGEs receptors in human osteoblasts exacerbates the generation of inflammatory cytokines and ROS, perpetuating a vicious cycle between inflammation and bone resorption (37). Furthermore, inflammation may contribute to another risk factors for OP, malnutrition (38, 39), as it reduces the effective utilization of dietary proteins and enhances the breakdown metabolism of key cellular proteins (40). Additionally, individuals with T2DM may incur additional risks of nutritional deficiencies by excessively restricting their dietary intake to manage blood sugar levels (41). Hence, OP in T2DM patients should be given greater attention.
ALI have been used in the assessment of various chronic diseases, such as rheumatoid arthritis and the prognosis of patients with hypertension (19, 42). ALI has been used to assess the prognosis of various chronic diseases, such as rheumatoid arthritis and hypertension in patients. Some studies have indicated a significant correlation between elevated ALI levels and reduced all-cause mortality in patients with T2DM (43), further supporting our research. Previous studies have shown that T2DM patients are more susceptible to OP (44, 45), which significantly increases the risk of fractures, leading to higher rates of disability, mortality, and economic costs, especially among the elderly. Our research indicates that ALI is associated with osteoporosis in T2DM patients. Firstly, the ALI score comprises BMI, serum albumin levels, and NLR, where BMI and albumin levels reflect nutritional status, and NLR reflects inflammatory status, making ALI a comprehensive assessment of nutrition and inflammation. Neutrophils serve as frontline innate immune defenders, crucially recruiting immune cells to sites of inflammation (46). Conversely, lymphocytes primarily mediate adaptive immunity, exerting regulatory or protective functions, with low lymphocyte counts typically indicating poor conditions (47). Therefore, NLR reflects two distinct immune pathways and may better reflect inflammatory status compared to individual inflammatory markers. Studies have revealed a strong correlation between elevated NLR and OP (48, 49), as evidenced by meta-analyses (50), which aligns with our research findings. Reports indicate that inflammation induced by lymphocyte dysfunction triggers a series of inflammatory cytokines and chemokines, resulting in the aggregation of neutrophils and macrophages, thereby disrupting the delicate balance of bone formation (51, 52). Additionally, the excessive activation of neutrophils releases reactive oxygen species and enhances the receptor activator of nuclear factor kappa-B ligand signaling pathway, accelerating the apoptosis of osteoblasts and promoting the generation of osteoclasts (53, 54).
Currently, a substantial body of research indicates a close association between low serum albumin levels and the development of osteoporosis (55, 56), Some studies report a direct correlation between hypoalbuminemia and the activation of nuclear factor kappa-B (57), a process that involves the inhibition of osteoblasts and the activation of osteoclasts (58). Furthermore, hypoalbuminemia can lead to reduced synthesis of insulin-like growth factor-1, thereby affecting factors such as the quantity and activity of osteoblasts and bone remodeling (55). BMI, as a modifiable risk factor for T2DM and OP, has been studied in relation to increased risk of OP with lower body weight (59). A study in a Korean population indicated that men (BMI: 25.0-29.9 kg/m2) and women (BMI: ≥30 kg/m2) had a more than 60% lower prevalence of OP compared to the reference group (BMI: 21.0-22.9 kg/m2); however, it’s crucial to note the risks linked with obesity, as it is associated with higher mortality rates in T2DM populations (60). The increase in BMI associated with T2DM may result in elevated pro-inflammatory cytokines and circulating lipid factors, which can exacerbate mechanical loading on skeletal sites, ultimately promoting bone resorption (61). In conclusion, the relationship between BMI and T2DM and OP is complex and significant. Future prospective studies will help determine appropriate BMI ranges to guide the more effective application of ALI biomarkers and more precise health management measures.
In our further subgroup analysis, we found that ALI in the MAFLD subgroup is more closely associated with the prevalence of OP. MAFLD is one of the major complications of T2DM, involving hepatic lipid accumulation, inflammation, and liver fibrosis (62, 63). In MAFLD, as liver lipid deposition increases, excessive accumulation leads to the production of lipotoxic substances, which in turn triggers oxidative stress, mitochondrial dysfunction, and endoplasmic reticulum stress (64). ROS are the primary type of free radicals involved in the disruption of bone remodeling. When the mechanisms of ROS production are enhanced and overcome the antioxidant system, their excessive generation leads to redox imbalance, resulting in increased differentiation of osteoclasts, further supporting increased bone loss and promoting the development of OP (65, 66). Additionally, all our study participants were T2DM patients, which may further exacerbate oxidative stress. However, it is necessary to conduct further research in the future to explore the underlying mechanisms behind these complex associations.
Our study boasts several strengths. Firstly, it draws from a representative national sample, offering extensive scale.
Secondly, our findings provide valuable insights for clinical applications, alerting healthcare practitioners to the potential complications of OP or bone loss in patients with T2DM who have low ALI levels. Furthermore, ALI serves as a comprehensive indicator reflecting nutrition and inflammation, emphasizing the necessity for timely nutritional and anti-inflammatory interventions. Thirdly, the ALI calculation is simple and cost-effective, making it a viable biomarker for the early screening of OP in elderly patients with T2DM.
We also acknowledge some limitations. First, our study is cross-sectional, which prevents us from inferring causality. Second, some covariate information relies on self-reported questionnaire assessments, which may introduce recall bias. Third, although we controlled for key demographic factors, laboratory measurements, behavioral risk factors, and various chronic diseases, we cannot completely rule out the influence of other potential confounding variables. Lastly, our study was conducted in a representative sample from the United States, which limits the generalizability of the findings. In future research, we recommend conducting longitudinal studies to regularly track changes in ALI levels and bone density in patients with T2DM, which will help determine the causal relationship between ALI and OP. Similarly, intervention studies involving nutritional interventions and anti-inflammatory treatments to evaluate their effects on the prevalence of OP in T2DM will provide more direct evidence regarding the importance of nutrition and inflammation in the development of OP among T2DM patients. Moreover, considering multicenter studies may help improve the generalizability of the results.
Conclusion
Our study found that low levels of ALI are independently associated with an increased prevalence of OP in middle-aged and elderly patients with T2DM in the United States. This suggests that maintaining good nutritional status and anti-inflammatory treatment may have a positive impact on bone health. Additionally, ALI can serve as a useful biomarker for early screening of OP in clinical practice among middle-aged and elderly individuals with T2DM.
Data availability statement
The original contributions presented in the study are included in the article/Supplementary Material. Further inquiries can be directed to the corresponding author.
Author contributions
YX: Conceptualization, Data curation, Software, Supervision, Writing – original draft. ZY: Data curation, Investigation, Software, Writing – original draft. LL: Funding acquisition, Investigation, Software, Visualization, Writing – review & editing.
Funding
The author(s) declare financial support was received for the research, authorship, and/or publication of this article. This work is supported by grants from the Jiangxi University of Chinese Medicine Science and Technology Innovation Team Development Program (No. CXTD22011).
Acknowledgments
The authors thank all the participants and researchers who contributed and collected data.
Conflict of interest
The authors declare that the research was conducted in the absence of any commercial or financial relationships that could be construed as a potential conflict of interest.
Publisher’s note
All claims expressed in this article are solely those of the authors and do not necessarily represent those of their affiliated organizations, or those of the publisher, the editors and the reviewers. Any product that may be evaluated in this article, or claim that may be made by its manufacturer, is not guaranteed or endorsed by the publisher.
Supplementary material
The Supplementary Material for this article can be found online at: https://www.frontiersin.org/articles/10.3389/fendo.2024.1421696/full#supplementary-material
References
1. Reid IR, Billington EO. Drug therapy for osteoporosis in older adults. Lancet. (2022) 399:1080–92. doi: 10.1016/S0140-6736(21)02646-5
2. Paschou SA, Dede AD, Anagnostis PG, Vryonidou A, Morganstein D, Goulis DG. Type 2 diabetes and osteoporosis: A guide to optimal management. J Clin Endocrinol Metab. (2017) 102:3621–34. doi: 10.1210/jc.2017-00042
3. Leslie WD, Morin SN. New developments in fracture risk assessment for current osteoporosis reports. Curr Osteoporos Rep. (2020) 18:115–29. doi: 10.1007/s11914-020-00590-7
4. Carlson BC, Robinson WA, Wanderman NR, Sebastian AS, Nassr A, Freedman BA, et al. A review and clinical perspective of the impact of osteoporosis on the spine. Geriatr Orthop Surg Rehabil. (2019) 10:2151459319861591. doi: 10.1177/2151459319861591
5. Holman N, Young B, Gadsby R. Current prevalence of Type 1 and Type 2 diabetes in adults and children in the UK. Diabetes Med. (2015) 32:1119–20. doi: 10.1111/dme.2015.32.issue-9
6. Liu X, Chen F, Liu L, Zhang Q. Prevalence of osteoporosis in patients with diabetes mellitus: a systematic review and meta-analysis of observational studies. BMC Endocr Disord. (2023) 23:1. doi: 10.1186/s12902-022-01260-8
7. Bao J, Yan Y, Zuo D, Zhuo Z, Sun T, Lin H, et al. Iron metabolism and ferroptosis in diabetic bone loss: from mechanism to therapy. Front Nutr. (2023) 10:1178573. doi: 10.3389/fnut.2023.1178573
8. Jiang N, Xia W. Assessment of bone quality in patients with diabetes mellitus. Osteoporos Int. (2018) 29:1721–36. doi: 10.1007/s00198-018-4532-7
9. Sellmeyer DE, Civitelli R, Hofbauer LC, Khosla S, Lecka-Czernik B, Schwartz AV. Skeletal metabolism, fracture risk, and fracture outcomes in type 1 and type 2 diabetes. Diabetes. (2016) 65:1757–66. doi: 10.2337/db16-0063
10. Koh WP, Wang R, Ang LW, Heng D, Yuan JM, Yu MC. Diabetes and risk of hip fracture in the Singapore Chinese Health Study. Diabetes Care. (2010) 33:1766–70. doi: 10.2337/dc10-0067
11. Mills ES, Hah RJ, Fresquez Z, Mertz K, Buser Z, Alluri RK, et al. Secondary fracture rate after vertebral osteoporotic compression fracture is decreased by anti-osteoporotic medication but not increased by cement augmentation. J Bone Joint Surg Am. (2022) 104:2178–85. doi: 10.2106/JBJS.22.00469
12. Iantomasi T, Romagnoli C, Palmini G, Donati S, Falsetti I, Miglietta F, et al. Oxidative stress and inflammation in osteoporosis: molecular mechanisms involved and the relationship with microRNAs. Int J Mol Sci. (2023) 24:3772. doi: 10.3390/ijms24043772
13. Ji Y, Geng N, Niu Y, Zhao H, Fei W, Chen S, et al. Relationship between geriatric nutritional risk index and osteoporosis in type 2 diabetes in Northern China. BMC Endocr Disord. (2022) 22:308. doi: 10.1186/s12902-022-01215-z
14. Papadopoulou SK, Papadimitriou K, Voulgaridou G, Georgaki E, Tsotidou E, Zantidou O, et al. Exercise and nutrition impact on osteoporosis and sarcopenia-the incidence of osteosarcopenia: A narrative review. Nutrients. (2021) 13:4499. doi: 10.3390/nu13124499
15. Romagnoli C, Marcucci G, Favilli F, Zonefrati R, Mavilia C, Galli G, et al. Role of GSH/GSSG redox couple in osteogenic activity and osteoclastogenic markers of human osteoblast-like SaOS-2 cells. FEBS J. (2013) 280:867–79. doi: 10.1111/febs.2013.280.issue-3
16. Cline-Smith A, Axelbaum A, Shashkova E, Chakraborty M, Sanford J, Panesar P, et al. Veis D et al: Ovariectomy Activates Chronic Low-Grade Inflammation Mediated by Memory T Cells, Which Promotes Osteoporosis in Mice. J Bone Miner Res. (2020) 35:1174–87. doi: 10.1002/jbmr.3966
17. Salamanna F, Maglio M, Borsari V, Landini MP, Fini M. Blood factors as biomarkers in osteoporosis: points from the COVID-19 era. Trends Endocrinol Metab. (2021) 32:672–9. doi: 10.1016/j.tem.2021.05.005
18. Jafri SH, Shi R, Mills G. Advance lung cancer inflammation index (ALI) at diagnosis is a prognostic marker in patients with metastatic non-small cell lung cancer (NSCLC): a retrospective review. BMC Cancer. (2013) 13:158. doi: 10.1186/1471-2407-13-158
19. Tu J, Wu B, Xiu J, Deng J, Lin S, Lu J, et al. Advanced lung cancer inflammation index is associated with long-term cardiovascular death in hypertensive patients: national health and nutrition examination study, 1999-2018. Front Physiol. (2023) 14:1074672. doi: 10.3389/fphys.2023.1074672
20. Yuan X, Huang B, Wang R, Tie H, Luo S. The prognostic value of advanced lung cancer inflammation index (ALI) in elderly patients with heart failure. Front Cardiovasc Med. (2022) 9:934551. doi: 10.3389/fcvm.2022.934551
21. Kanis JA. Assessment of fracture risk and its application to screening for postmenopausal osteoporosis: synopsis of a WHO report. WHO Study Group. Osteoporos Int. (1994) 4:368–81. doi: 10.1007/BF01622200
22. Looker AC, Orwoll ES, Johnston CC Jr., Lindsay RL, Wahner HW, Dunn WL, et al. Prevalence of low femoral bone density in older U.S. adults from NHANES III. J Bone Miner Res. (1997) 12:1761–8. doi: 10.1359/jbmr.1997.12.11.1761
23. Janssen I, Carson V, Lee IM, Katzmarzyk PT, Blair SN. Years of life gained due to leisure-time physical activity in the U.S. Am J Prev Med. (2013) 44:23–9. doi: 10.1016/j.amepre.2012.09.056
24. Pan B, Zhao Y, Chen C, Cai J, Li K, Wang Y, et al. The relationship between advanced liver fibrosis and osteoporosis in type 2 diabetes patients with MAFLD. Endocrine. (2024) 85:206–21. doi: 10.1007/s12020-024-03724-4
25. Liu J, Tang Y, Feng Z, Chen Y, Zhang X, Xia Y, et al. Metabolic associated fatty liver disease and bone mineral density: a cross-sectional study of the National Health and Nutrition Examination Survey 2017-2018. Osteoporos Int. (2023) 34:713–24. doi: 10.1007/s00198-023-06687-w
26. Li H, Xiao Z, Quarles LD, Li W. Osteoporosis: mechanism, molecular target and current status on drug development. Curr Med Chem. (2021) 28:1489–507. doi: 10.2174/0929867327666200330142432
27. Kimball JS, Johnson JP, Carlson DA. Oxidative stress and osteoporosis. J Bone Joint Surg Am. (2021) 103:1451–61. doi: 10.2106/JBJS.20.00989
28. Conaway HH, Henning P, Lie A, Tuckermann J, Lerner UH. Activation of dimeric glucocorticoid receptors in osteoclast progenitors potentiates RANKL induced mature osteoclast bone resorbing activity. Bone. (2016) 93:43–54. doi: 10.1016/j.bone.2016.08.024
29. Saxena Y, Routh S, Mukhopadhaya A. Immunoporosis: role of innate immune cells in osteoporosis. Front Immunol. (2021) 12:687037. doi: 10.3389/fimmu.2021.687037
30. Gilbert L, He X, Farmer P, Boden S, Kozlowski M, Rubin J, et al. Inhibition of osteoblast differentiation by tumor necrosis factor-alpha. Endocrinology. (2000) 141:3956–64. doi: 10.1210/endo.141.11.7739
31. Glantschnig H, Fisher JE, Wesolowski G, Rodan GA, Reszka AA. M-CSF, TNFalpha and RANK ligand promote osteoclast survival by signaling through mTOR/S6 kinase. Cell Death Differ. (2003) 10:1165–77. doi: 10.1038/sj.cdd.4401285
32. Palui R, Pramanik S, Mondal S, Ray S. Critical review of bone health, fracture risk and management of bone fragility in diabetes mellitus. World J Diabetes. (2021) 12:706–29. doi: 10.4239/wjd.v12.i6.706
33. Napoli N, Chandran M, Pierroz DD, Abrahamsen B, Schwartz AV, Ferrari SL, et al. Mechanisms of diabetes mellitus-induced bone fragility. Nat Rev Endocrinol. (2017) 13:208–19. doi: 10.1038/nrendo.2016.153
34. Neumann T, Lodes S, Kastner B, Franke S, Kiehntopf M, Lehmann T, et al. High serum pentosidine but not esRAGE is associated with prevalent fractures in type 1 diabetes independent of bone mineral density and glycaemic control. Osteoporos Int. (2014) 25:1527–33. doi: 10.1007/s00198-014-2631-7
35. Okazaki K, Yamaguchi T, Tanaka K, Notsu M, Ogawa N, Yano S, et al. Advanced glycation end products (AGEs), but not high glucose, inhibit the osteoblastic differentiation of mouse stromal ST2 cells through the suppression of osterix expression, and inhibit cell growth and increasing cell apoptosis. Calcif Tissue Int. (2012) 91:286–96. doi: 10.1007/s00223-012-9641-2
36. Kim JH, Kim YY, Kim SJ. High glucose inhibits gene expression of tyrosyl-tRNA synthetase in osteoblast cells. Methods Find Exp Clin Pharmacol. (2009) 31:639–44. doi: 10.1358/mf.2009.31.10.1441114
37. Hein GE. Glycation endproducts in osteoporosis–is there a pathophysiologic importance? Clin Chim Acta. (2006) 371:32–6. doi: 10.1016/j.cca.2006.03.017
38. Merker M, Felder M, Gueissaz L, Bolliger R, Tribolet P, Kagi-Braun N, et al. Bilz S et al: Association of Baseline Inflammation With Effectiveness of Nutritional Support Among Patients With Disease-Related Malnutrition: A Secondary Analysis of a Randomized Clinical Trial. JAMA Netw Open. (2020) 3:e200663. doi: 10.1001/jamanetworkopen.2020.0663
39. Aldhwayan MM, Al-Najim W, Ruban A, Glaysher MA, Johnson B, Chhina N, et al. Byrne JP et al: Does Bypass of the Proximal Small Intestine Impact Food Intake, Preference, and Taste Function in Humans? An Experimental Medicine Study Using the Duodenal-Jejunal Bypass Liner. Nutrients. (2022) 14:2141. doi: 10.3390/nu14102141
40. Don BR, Kaysen G. Serum albumin: relationship to inflammation and nutrition. Semin Dial. (2004) 17:432–7. doi: 10.1111/j.0894-0959.2004.17603.x
41. Kirkman MS, Briscoe VJ, Clark N, Florez H, Haas LB, Halter JB, et al. Odegard PS et al: Diabetes in older adults. Diabetes Care. (2012) 35:2650–64. doi: 10.2337/dc12-1801
42. Tian X, Qu Z, Sun Y, Zhang B. Association between the advanced lung cancer inflammation index and all-cause and cardiovascular mortality in patients with RA: Insights from NHANES data analysis. Heliyon. (2024) 10:e33673. doi: 10.1016/j.heliyon.2024.e33673
43. Chen Y, Guan M, Wang R, Wang X. Relationship between advanced lung cancer inflammation index and long-term all-cause, cardiovascular, and cancer mortality among type 2 diabetes mellitus patients: NHANES, 1999-2018. Front Endocrinol (Lausanne). (2023) 14:1298345. doi: 10.3389/fendo.2023.1298345
44. Huang G, Chen X, Chen Y, Liu W, Chen C, Song W, et al. Causal relationship between type 2 diabetes mellitus and bone mineral density: a Mendelian randomization study in an East Asian population. Osteoporos Int. (2023) 34:1719–27. doi: 10.1007/s00198-023-06807-6
45. Sheu A, Greenfield JR, White CP, Center JR. Assessment and treatment of osteoporosis and fractures in type 2 diabetes. Trends Endocrinol Metab. (2022) 33:333–44. doi: 10.1016/j.tem.2022.02.006
46. Mayadas TN, Cullere X, Lowell CA. The multifaceted functions of neutrophils. Annu Rev Pathol. (2014) 9:181–218. doi: 10.1146/annurev-pathol-020712-164023
47. Wirsdorfer F, Jendrossek V. The role of lymphocytes in radiotherapy-induced adverse late effects in the lung. Front Immunol. (2016) 7:591. doi: 10.3389/fimmu.2016.00591
48. Nie YZ, Yan ZQ, Yin H, Shan LH, Wang JH, Wu QH. Osteosarcopenic obesity and its components-osteoporosis, sarcopenia, and obesity-are associated with blood cell count-derived inflammation indices in older Chinese people. BMC Geriatr. (2022) 22:532. doi: 10.1186/s12877-022-03225-x
49. Chen S, Sun X, Jin J, Zhou G, Li Z. Association between inflammatory markers and bone mineral density: a cross-sectional study from NHANES 2007-2010. J Orthop Surg Res. (2023) 18:305. doi: 10.1186/s13018-023-03795-5
50. Liu YC, Yang TI, Huang SW, Kuo YJ, Chen YP. Associations of the neutrophil-to-lymphocyte ratio and platelet-to-lymphocyte ratio with osteoporosis: A meta-analysis. Diagnostics (Basel). (2022) 12:2968. doi: 10.3390/diagnostics12122968
51. Lechner J, Rudi T, von Baehr V. Osteoimmunology of tumor necrosis factor-alpha, IL-6, and RANTES/CCL5: a review of known and poorly understood inflammatory patterns in osteonecrosis. Clin Cosmet Investig Dent. (2018) 10:251–62. doi: 10.2147/CCIDE.S184498
52. Liu D, Zhu Y, Chen W, Li J, Zhao K, Zhang J, et al. Relationship between the inflammation/immune indexes and deep venous thrombosis (DVT) incidence rate following tibial plateau fractures. J Orthop Surg Res. (2020) 15:241. doi: 10.1186/s13018-020-01765-9
53. Lee SH, Ryu SY, Park J, Shin MH, Han MA, Choi SW. The relationship of neutrophil-lymphocyte ratio and platelet-lymphocyte ratio with bone mineral density in korean postmenopausal women. Chonnam Med J. (2019) 55:150–5. doi: 10.4068/cmj.2019.55.3.150
54. Iking-Konert C, Ostendorf B, Sander O, Jost M, Wagner C, Joosten L, et al. Transdifferentiation of polymorphonuclear neutrophils to dendritic-like cells at the site of inflammation in rheumatoid arthritis: evidence for activation by T cells. Ann Rheum Dis. (2005) 64:1436–42. doi: 10.1136/ard.2004.034132
55. Afshinnia F, Wong KK, Sundaram B, Ackermann RJ, Pennathur S. Hypoalbuminemia and osteoporosis: reappraisal of a controversy. J Clin Endocrinol Metab. (2016) 101:167–75. doi: 10.1210/jc.2015-3212
56. Afshinnia F, Pennathur S. Association of hypoalbuminemia with osteoporosis: analysis of the national health and nutrition examination survey. J Clin Endocrinol Metab. (2016) 101:2468–74. doi: 10.1210/jc.2016-1099
57. Abu-Amer Y. NF-kappaB signaling and bone resorption. Osteoporos Int. (2013) 24:2377–86. doi: 10.1007/s00198-013-2313-x
58. Zheng CM, Wu CC, Lu CL, Hou YC, Wu MS, Hsu YH, et al. Hypoalbuminemia differently affects the serum bone turnover markers in hemodialysis patients. Int J Med Sci. (2019) 16:1583–92. doi: 10.7150/ijms.39158
59. Coin A, Sergi G, Beninca P, Lupoli L, Cinti G, Ferrara L, et al. Bone mineral density and body composition in underweight and normal elderly subjects. Osteoporos Int. (2000) 11:1043–50. doi: 10.1007/s001980070026
60. Li K, Cao B, Wang X, Chai T, Ke J, Zhao D. Sex differences in the non-linear association between BMI and LDL cholesterol in type 2 diabetes. Front Endocrinol (Lausanne). (2023) 14:1180012. doi: 10.3389/fendo.2023.1180012
61. Khosla S, Samakkarnthai P, Monroe DG, Farr JN. Update on the pathogenesis and treatment of skeletal fragility in type 2 diabetes mellitus. Nat Rev Endocrinol. (2021) 17:685–97. doi: 10.1038/s41574-021-00555-5
62. Popov SS, Kryl’skii ED, Shulgin KK, Raskina EA, Popova TN, Pashkov AN, et al. Inflammation is associated with impairment of oxidative status, carbohydrate and lipid metabolism in type 2 diabetes complicated by non-alcoholic fatty liver disease. Minerva Endocrinol (Torino). (2022) 47:304–13. doi: 10.23736/S2724-6507.20.03257-5
63. Bhardwaj M, Mazumder PM. The gut-liver axis: emerging mechanisms and therapeutic approaches for nonalcoholic fatty liver disease and type 2 diabetes mellitus. Naunyn Schmiedebergs Arch Pharmacol. (2024) 397:8421–43. doi: 10.1007/s00210-024-03204-6
64. Chen Z, Tian R, She Z, Cai J, Li H. Role of oxidative stress in the pathogenesis of nonalcoholic fatty liver disease. Free Radic Biol Med. (2020) 152:116–41. doi: 10.1016/j.freeradbiomed.2020.02.025
65. Zhu C, Shen S, Zhang S, Huang M, Zhang L, Chen X. Autophagy in bone remodeling: A regulator of oxidative stress. Front Endocrinol (Lausanne). (2022) 13:898634. doi: 10.3389/fendo.2022.898634
Keywords: advanced lung cancer inflammation index, type 2 diabetes mellitus, osteoporosis, cross-sectional study, NHANES
Citation: Xu Y, Yan Z and Liu L (2024) Association between advanced lung cancer inflammation index and osteoporosis in patients with type 2 diabetes mellitus: evidence from NHANES. Front. Endocrinol. 15:1421696. doi: 10.3389/fendo.2024.1421696
Received: 22 April 2024; Accepted: 04 November 2024;
Published: 25 November 2024.
Edited by:
Åke Sjöholm, Gävle Hospital, SwedenReviewed by:
Giovanni Vitale, Italian Auxological Institute (IRCCS), ItalyAhmet Fatih Durmusoglu, Istanbul Medipol University, Türkiye
Copyright © 2024 Xu, Yan and Liu. This is an open-access article distributed under the terms of the Creative Commons Attribution License (CC BY). The use, distribution or reproduction in other forums is permitted, provided the original author(s) and the copyright owner(s) are credited and that the original publication in this journal is cited, in accordance with accepted academic practice. No use, distribution or reproduction is permitted which does not comply with these terms.
*Correspondence: Liangji Liu, bGxqNjUwNUAxNjMuY29t
 Yifeng Xu
 Zhaoqi Yan
 Liangji Liu