- 1Emergency Department, The Second Affiliated Hospital, Jiangxi Medical College, Nanchang University, No.1 Minde Road, Nanchang, China
- 2General Surgery Center, Department of Thyroid Surgery, The 1st Hospital of Jilin University, Chang Chun, China
- 3Department of General Surgery, Panzhihua Central Hospital, Panzhihua, China
Background: Graves’ disease (GD) is an autoimmune disease associated with an increased incidence of other autoimmune diseases. To investigate the causality between GD and Diabetes mellitus (DM), we designed bidirectional two-sample Mendelian randomization (MR) and multivariable MR (MVMR) studies.
Methods: Single-nucleotide polymorphisms (SNPs) associated with GD, thyroid peroxidase (TPO), thyroglobulin (Tg), thyroid-stimulating hormone (TSH), type 1 diabetes (T1D), and type 2 diabetes (T2D) were obtained from the IEU Open GWAS and FinnGen biobank databases. For the forward MR study, we used GD (sample size = 458,620) as the exposure and T1D (sample size = 520,580) and T2D (sample size = 211,766) as the outcomes. Next, high risk of T1D and T2D were used as exposure variables, and GD was used as the outcome variable for the reverse MR analysis. Finally, MVMR analysis was conducted to investigate the probable relationship between DM and indicators for thyroid function like TPO, Tg, and TSH. The inverse variance weighting (IVW) was used as the main method. Finally, the heterogeneity and sensitivity were assessed.
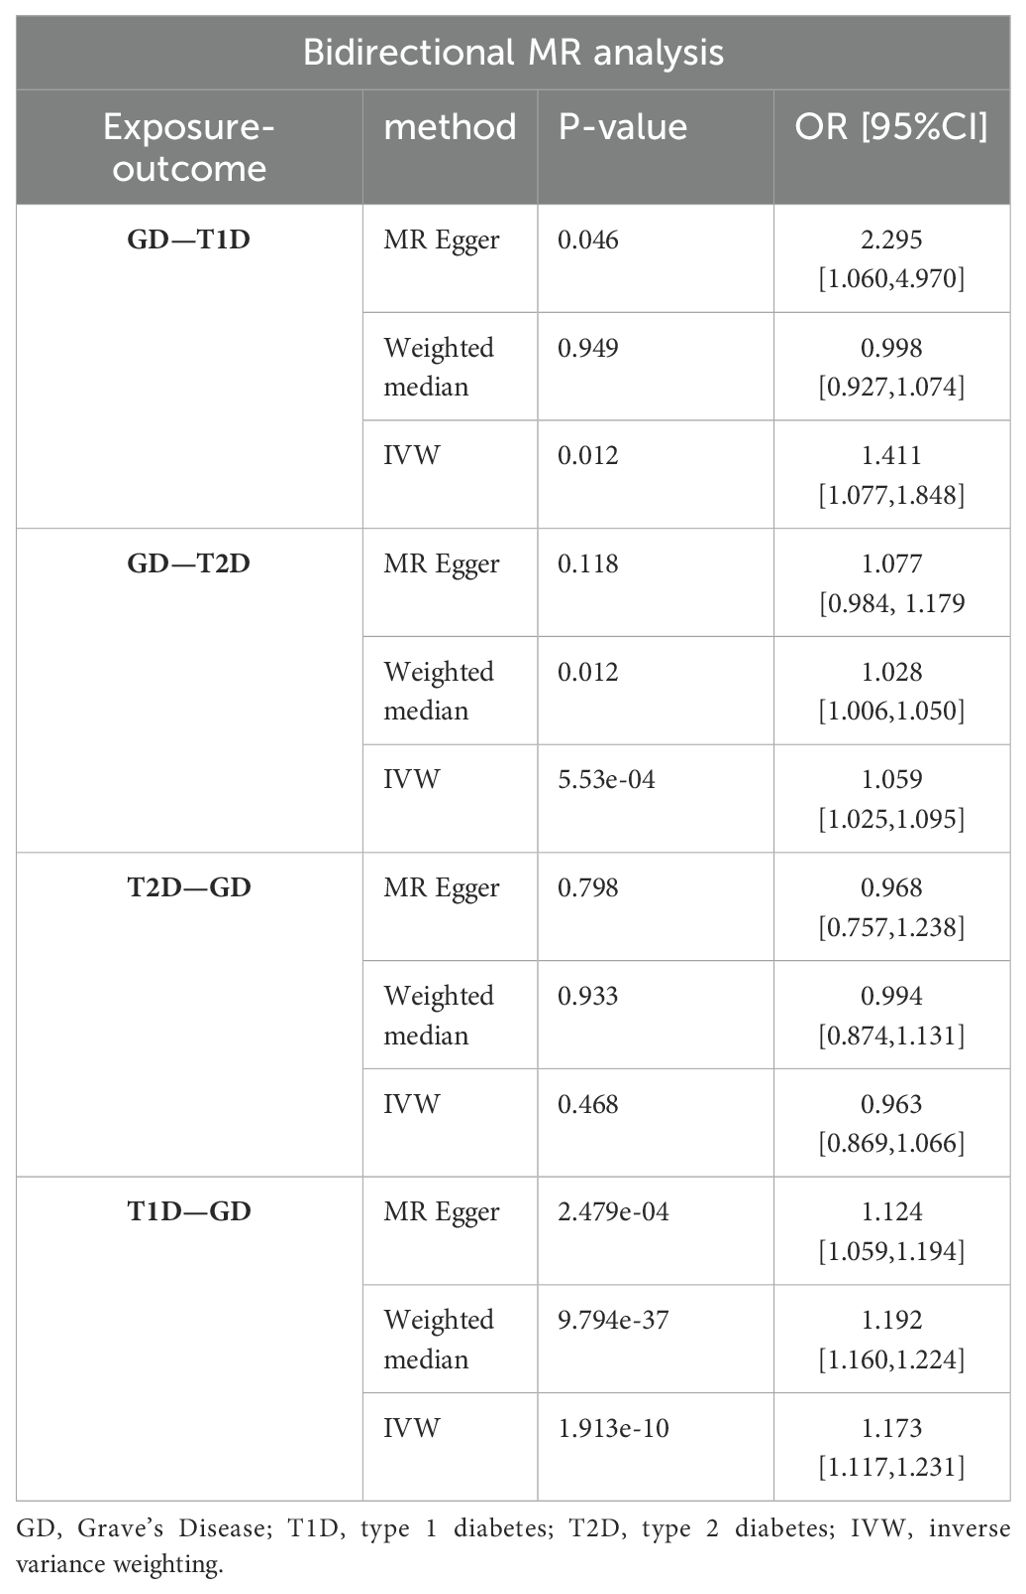
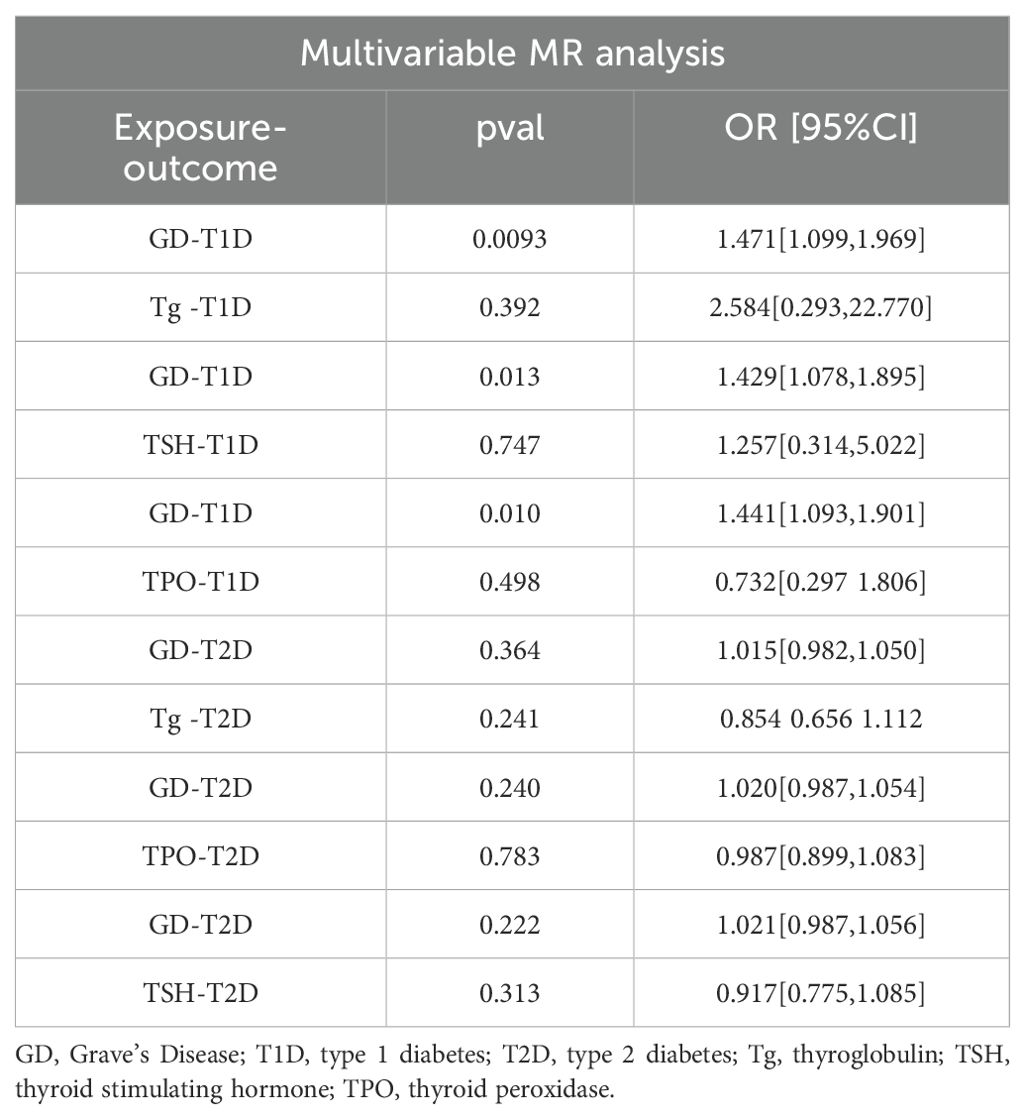
Results: There were 27, 88, and 55 SNPs associated with GD, T1D, and T2D, respectively. A significant causal connection between higher genetic liability of GD and the risk of T2D (OR [95% CI] = 1.059 [1.025–1.095], P = 5.53e-04) was found in the forward MR analysis. Comparatively, the significant causal relationship between higher genetic liability of GD and the risk of T1D was not demonstrated (OR [95% CI] = 0.998[0.927,1.074], P=0.949). However, reverse MR suggested that there was a genetic susceptibility to T1D that increased the likelihood of developing GD (OR [95% CI] = 1.173[1.117,1.231], P = 1.913e-10), while T2D did not (OR [95% CI] = 0.963 [0.870–1.066], P = 0.468). Furthermore, there was inadequate evidence to suggest that abnormal TSH, TPO, and Tg levels increase the risk of incident T1D or T2D in individuals with GD. MVMR revealed no causal relationship among Tg, TSH, TPO, T1D, or T2D.
Conclusion: There was no increased risk of T1D with an increase in genetic susceptibility to GD, although higher genetic susceptibility to T1D has been shown to be associated with increased risk of developing GD. A unidirectional causal relationship between the genetic liability for GD and increased risk of T2D was observed using MR analyses. MVMR analysis showed no statistically relevant causality between the genetic liability for TSH, TPO, or Tg and the risk of either T1D or T2D.
1 Introduction
Diabetes mellitus (DM), a metabolic disorder characterized by high blood glucose levels, is one of the fastest-growing global health problems of the 21st century. Globally, 537 million people were estimated to have diabetes by 2021. By 2030, this figure is likely to rise to 643 million, and by 2045, it is predicted to reach 783 million (1). Associated complications of DM affect multiple organs and include cardiovascular disease, diabetic nephropathy, retina-related eye diseases, neuropathy, and diabetic foot ulcers (2, 3). There are three broad forms of DM: type 1 (T1D), type 2 (T2D), and gestational diabetes. T1D is an autoimmune illness mostly caused by the immune system attacking the β-cells in the pancreas that produce insulin (4–6). T1D mainly occurs in pediatric patients; however, some patients with latent autoimmune diabetes are diagnosed during adulthood (7). T2D is mostly caused by insulin resistance (8) and is distinguished by the absence of pathological alterations in the pancreas and insensitivity of other body parts and tissues to insulin. Obesity is believed to be the primary cause of T2D (9). However, some studies have demonstrated that immunology also contributes to its pathophysiology (10–13). Owing to its high incidence and numerous complications, DM has a considerable influence on the quality of life of patients and is a heavy strain on society. Investigating the risk factors for DM development and implementing early preventive interventions are crucial.
Diffuse toxic goiter, also known as Graves’ disease (GD), is an autoimmune condition that affects the thyroid glands. Hyperthyroidism is mainly caused by GD (14). Many patients with GD exhibit abnormal levels of indicators of thyroid function, thyroid-stimulating hormone (TSH), thyroid peroxidase (TPO), and thyroglobulin (Tg). Patients with GD typically present with a range of hypermetabolic symptoms due to elevated thyroid hormone levels, including hyperthermia, hyperhidrosis, irritability, and cardiac arrhythmias, such as atrial fibrillation and flutter (15). In addition to thyroid function abnormalities, patients diagnosed with GD may have abnormal thyroid antigens and antibodies (16, 17). Moreover, individuals with GD have a significantly higher risk for other autoimmune diseases, including T1D (18), rheumatoid arthritis (19), and systemic lupus erythematosus (20), than the general population. Previous studies have reported a correlation between GD and T1D (18, 21, 22); however, few studies have examined bidirectional causality. Thus, it is crucial to demonstrate a causal link between GD and T2D.
Mendelian randomization (MR) analysis is a novel research method that has emerged over the last decade. MR analysis is superior to randomized controlled trials in several respects. First, MR analysis uses genetic variation (single-nucleotide polymorphisms [SNPs]) as a random assignment to remove the effects of confounding factors and reverse causality, enabling the examination of the cause–effect relationship between exposure and outcome (23–26). Additionally, compared with traditional randomized group experiments, MR can save time and reduce economic costs while obtaining a larger sample size.
To identify any potential bidirectional causal relationship between GD, T1D, and T2D, this study used genome-wide association study (GWAS) data from publicly accessible databases in a bidirectional two-sample analysis. Furthermore, we clarified the causal relationship between TSH, TPO, and Tg and T1D and T2D through multifactorial MR analysis. This study offers a novel approach to the prevention of GD and DM.
2 Materials and methods
2.1 Study design
A bidirectional two-sample MR study was performed to determine the cause–effect relationship between GD and T1D. We also performed multivariate MR (MVMR) analysis to reduce the interference of confounding variables, such as TPO, TSH, and Tg, on the results. The research design process is illustrated in Figure 1.
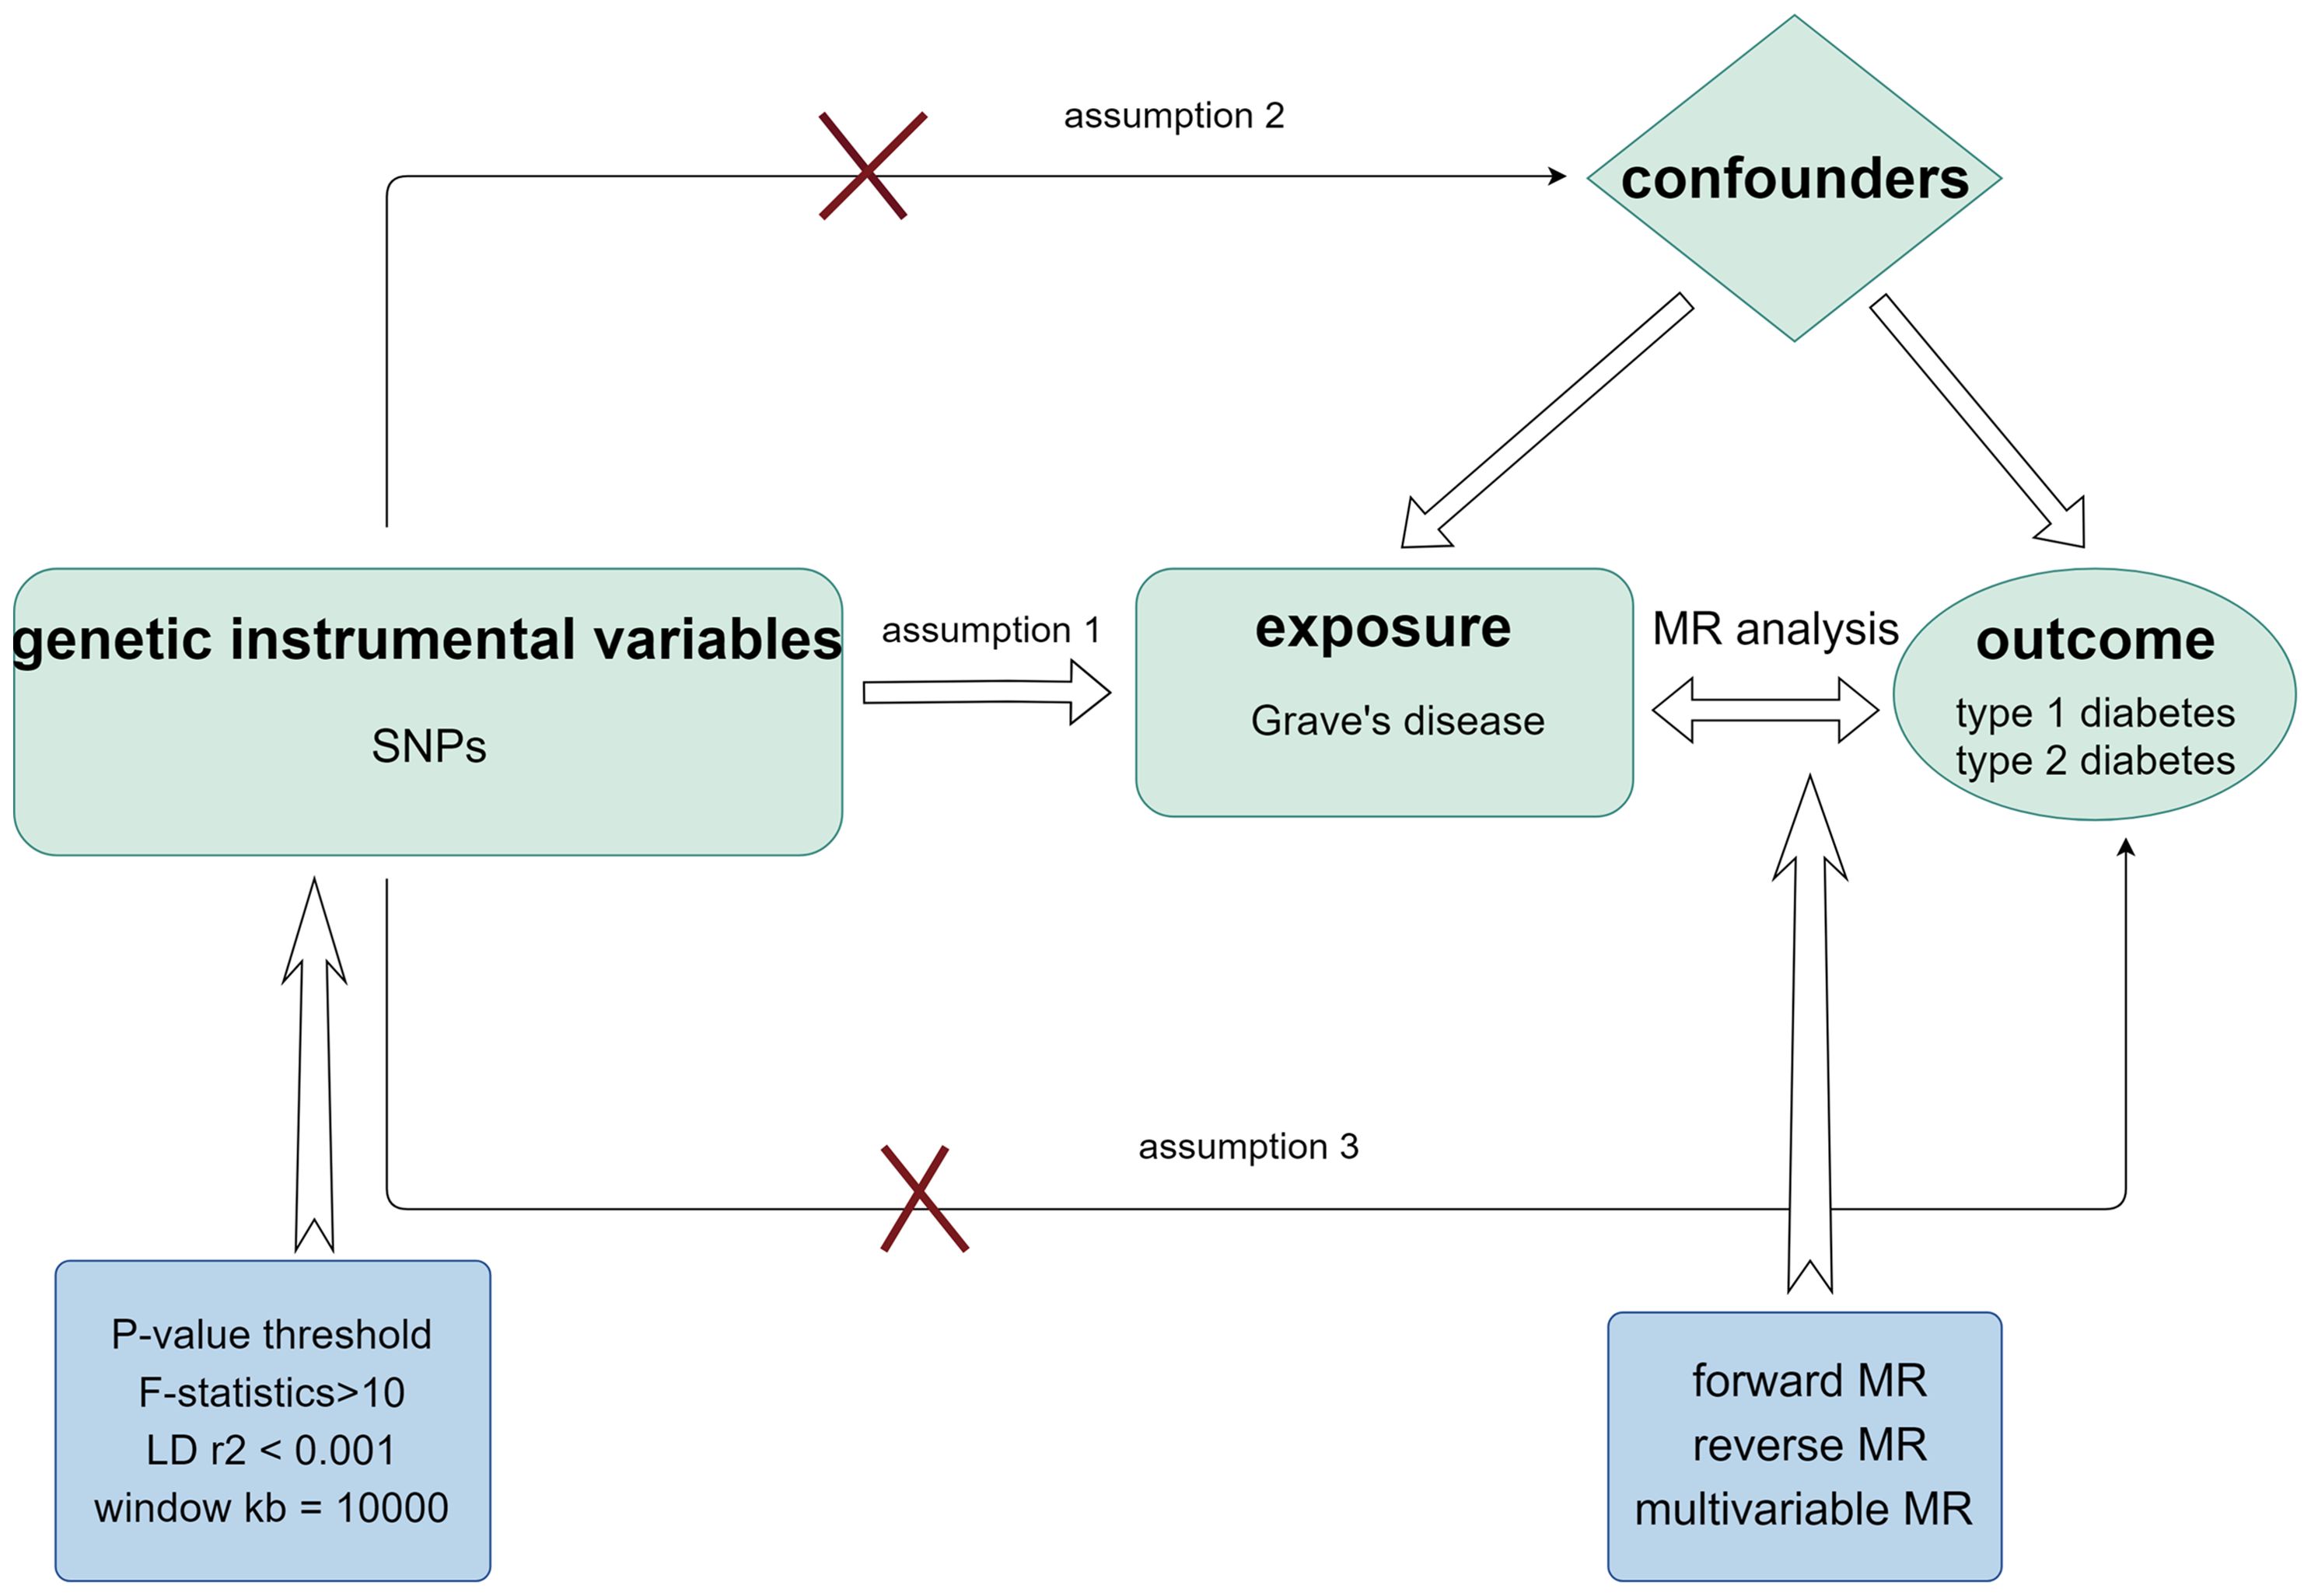
Figure 1. Schematic diagram of MR analysis satisfying three key assumptions. SNP, Single nucleotide polymorphism.
2.2 GWAS data sources and selection of instrumental variables
Utilizing genetic IVs associated with GD obtained from a study by Sakaue et al. (27), this study investigated 220 human phenotypes, including thyroid dysfunction, in a European population with a large sample size of 458,620. Genetic data associated with TPO, Tg, and TSH were acquired from a study carried out by Benjamin et al. with a sample size of 3301 (28). Genetic data associated with GD, TPO, Tg, and TSH can be found in the IEU Open GWAS database (https://gwas.mrcieu.ac.uk/). To render the selected IVs for MR analysis comprehensive, three assumptions must be made: (1) The SNPs utilized as IVs should have a high correlation with exposure. Therefore, maintaining a clear logical structure when presenting these points is essential. (2) Genetic variation has no bearing on the possible genetic or environmental factors that could influence the outcome. (3) IVs should only affect the outcomes through exposure (29, 30). Subsequently, we determined the following selection criteria to reduce the likelihood of missing SNPs while maintaining a high correlation with exposure: P-value< 5×10⁻⁸, linkage disequilibrium (LD) r2< 0.001, and window kb = 10,000. The SNPs used as IVs are listed in Supplementary Tables 2–4. F-statistics for every SNP were also produced to evaluate the usefulness of the IVs according to this formula:
More precisely, a powerful instrument is typically indicated by an F-statistic greater than 10, which implies that IVs are predictive of the exposure variable (31). Supplementary Table 1 provides detailed phenotypic information.
2.3 Genetic variants with a risk of T1D and T2D
To perform reverse MR analysis, it was necessary to extract SNPs related to T1D and T2D. GWAS data for T1D originated from a study conducted by Chiou et al. that encompassed a cohort of 520,580 individuals from the European population, including 18,942 cases and 501,638 controls (32). The associated data were obtained from https://gwas.mrcieu.ac.uk/. The GWAS information for T2D was gathered from the FinnGen biobank database (bWFpbHRvOkBvbmxpbmUlN2JmaW5uZ2Vu), containing 29,193 cases and 182,573 controls (33). The assumptions and selection criteria mentioned previously are also applicable to the reverse MR analysis.
2.4 Two-sample MR analysis and sensitivity analysis
Three methods were used: inverse variance weighting (IVW), weighted median, and MR-Egger regression. Giving more weight to variants with smaller standard errors makes IVW a highly efficient method that provides precise and powerful estimates of causal effects (34). Therefore, IVW was regarded as the primary method. Scatter plots were constructed to visualize the MR results. The results were subjected to statistical tests and sensitivity studies to evaluate reliability. In a two-sample MR analysis, heterogeneity generally refers to discrepancies in effect estimates across different loci or studies. Heterogeneity among the SNPs in IVW computation was assessed using Cochran’s Q test (35). If the P-value was greater than 0.05, the assumption of existing heterogeneity among SNPs was rejected; otherwise, a random-effects model was used. Subsequently, the MR-Egger intercept test was performed to identify horizontal pleiotropic effects (36). If the P-value obtained by this test was< 0.05, the selected SNPs influenced multiple phenotypes. This means that a single genetic variant may affect more than one phenotype, and that these effects are not mediated by the primary exposure of interest. The MR-PRESSO test was used for global and distortion testing. The presence or absence of heterogeneity was determined using a global test. Heterogeneity was considered present if the results were statistically significant. Conversely, if the P-values for the global testing were greater than 0.05, heterogeneity was absent. The distortion test is used to identify outliers and determine whether the MR analysis results are affected (37); therefore, this test was used in the present study. Random-effect models were utilized to estimate the MR effect sizes and assess a meaningful cause–effect link between exposure and outcome. Finally, the total effect of each remaining SNP was estimated using the leave-one-out methodology (38). Funnel and forest plots were constructed to display the results more clearly and concisely.
2.5 Reverse MR analysis and sensitivity analysis
To determine whether there was a reverse causal relationship between higher genetic liability of T1D and T2D, and GD, we performed reverse MR analysis. The same genotypes and SNPs were used for consistency. We examined GD, T1D, and T2D as outcomes. Similar to the forward MR analysis, the SNPs for T1D and T2D were extracted using the criteria mentioned previously and are shown in Supplementary Tables 3 and 4.
2.6 MVMR analysis
As most patients with GD have comorbidities, such as abnormal serum TPO, Tg, and TSH levels, we conducted an MVMR analysis to identify whether these factors contribute to the heightened risk of developing T1D and T2D.
3 Results
3.1 IV selection
We selected the following SNPs associated with GD, T1D, and T2D according to previous criteria. There were 27, 88, and 55 SNPs associated with GD, T1D, and T2D, respectively. In addition, 15 outliers were found for GD, 8 for T1D, and 1 for T2D through the MR-PRESSO test. Supplementary all selected SNPs and MR-PRESSO results are displayed in Supplementary Material. The F-statistic for each SNP was > 10, suggesting a significant association between the SNPs and exposure.
3.2 Two-sample MR analysis
The IVW analysis results demonstrated that higher genetic liability of GD will increase risk of T1D (odds ratio [OR] (95% confidence interval [CI]) = 1.411 (1.077–1.848), P = 0.012). This suggests that the high genetic liability of GD is associated with a 41.1% increased risk of T1D. However, the weighted-median analysis results suggested no increased risk of T1D as genetic susceptibility to GD increases (OR[95% CI]= 0.998[0.927,1.074],P=0.949).The causal relationship between GD and T2D was also significant (OR (95% CI) = 1.059 (1.025–1.095), P = 5.53e-04). The elevated genetic liability of GD is potentially associated with a 5.9% increased risk of T2D. Table 1 and Figure 2 present the results of the MR analysis.
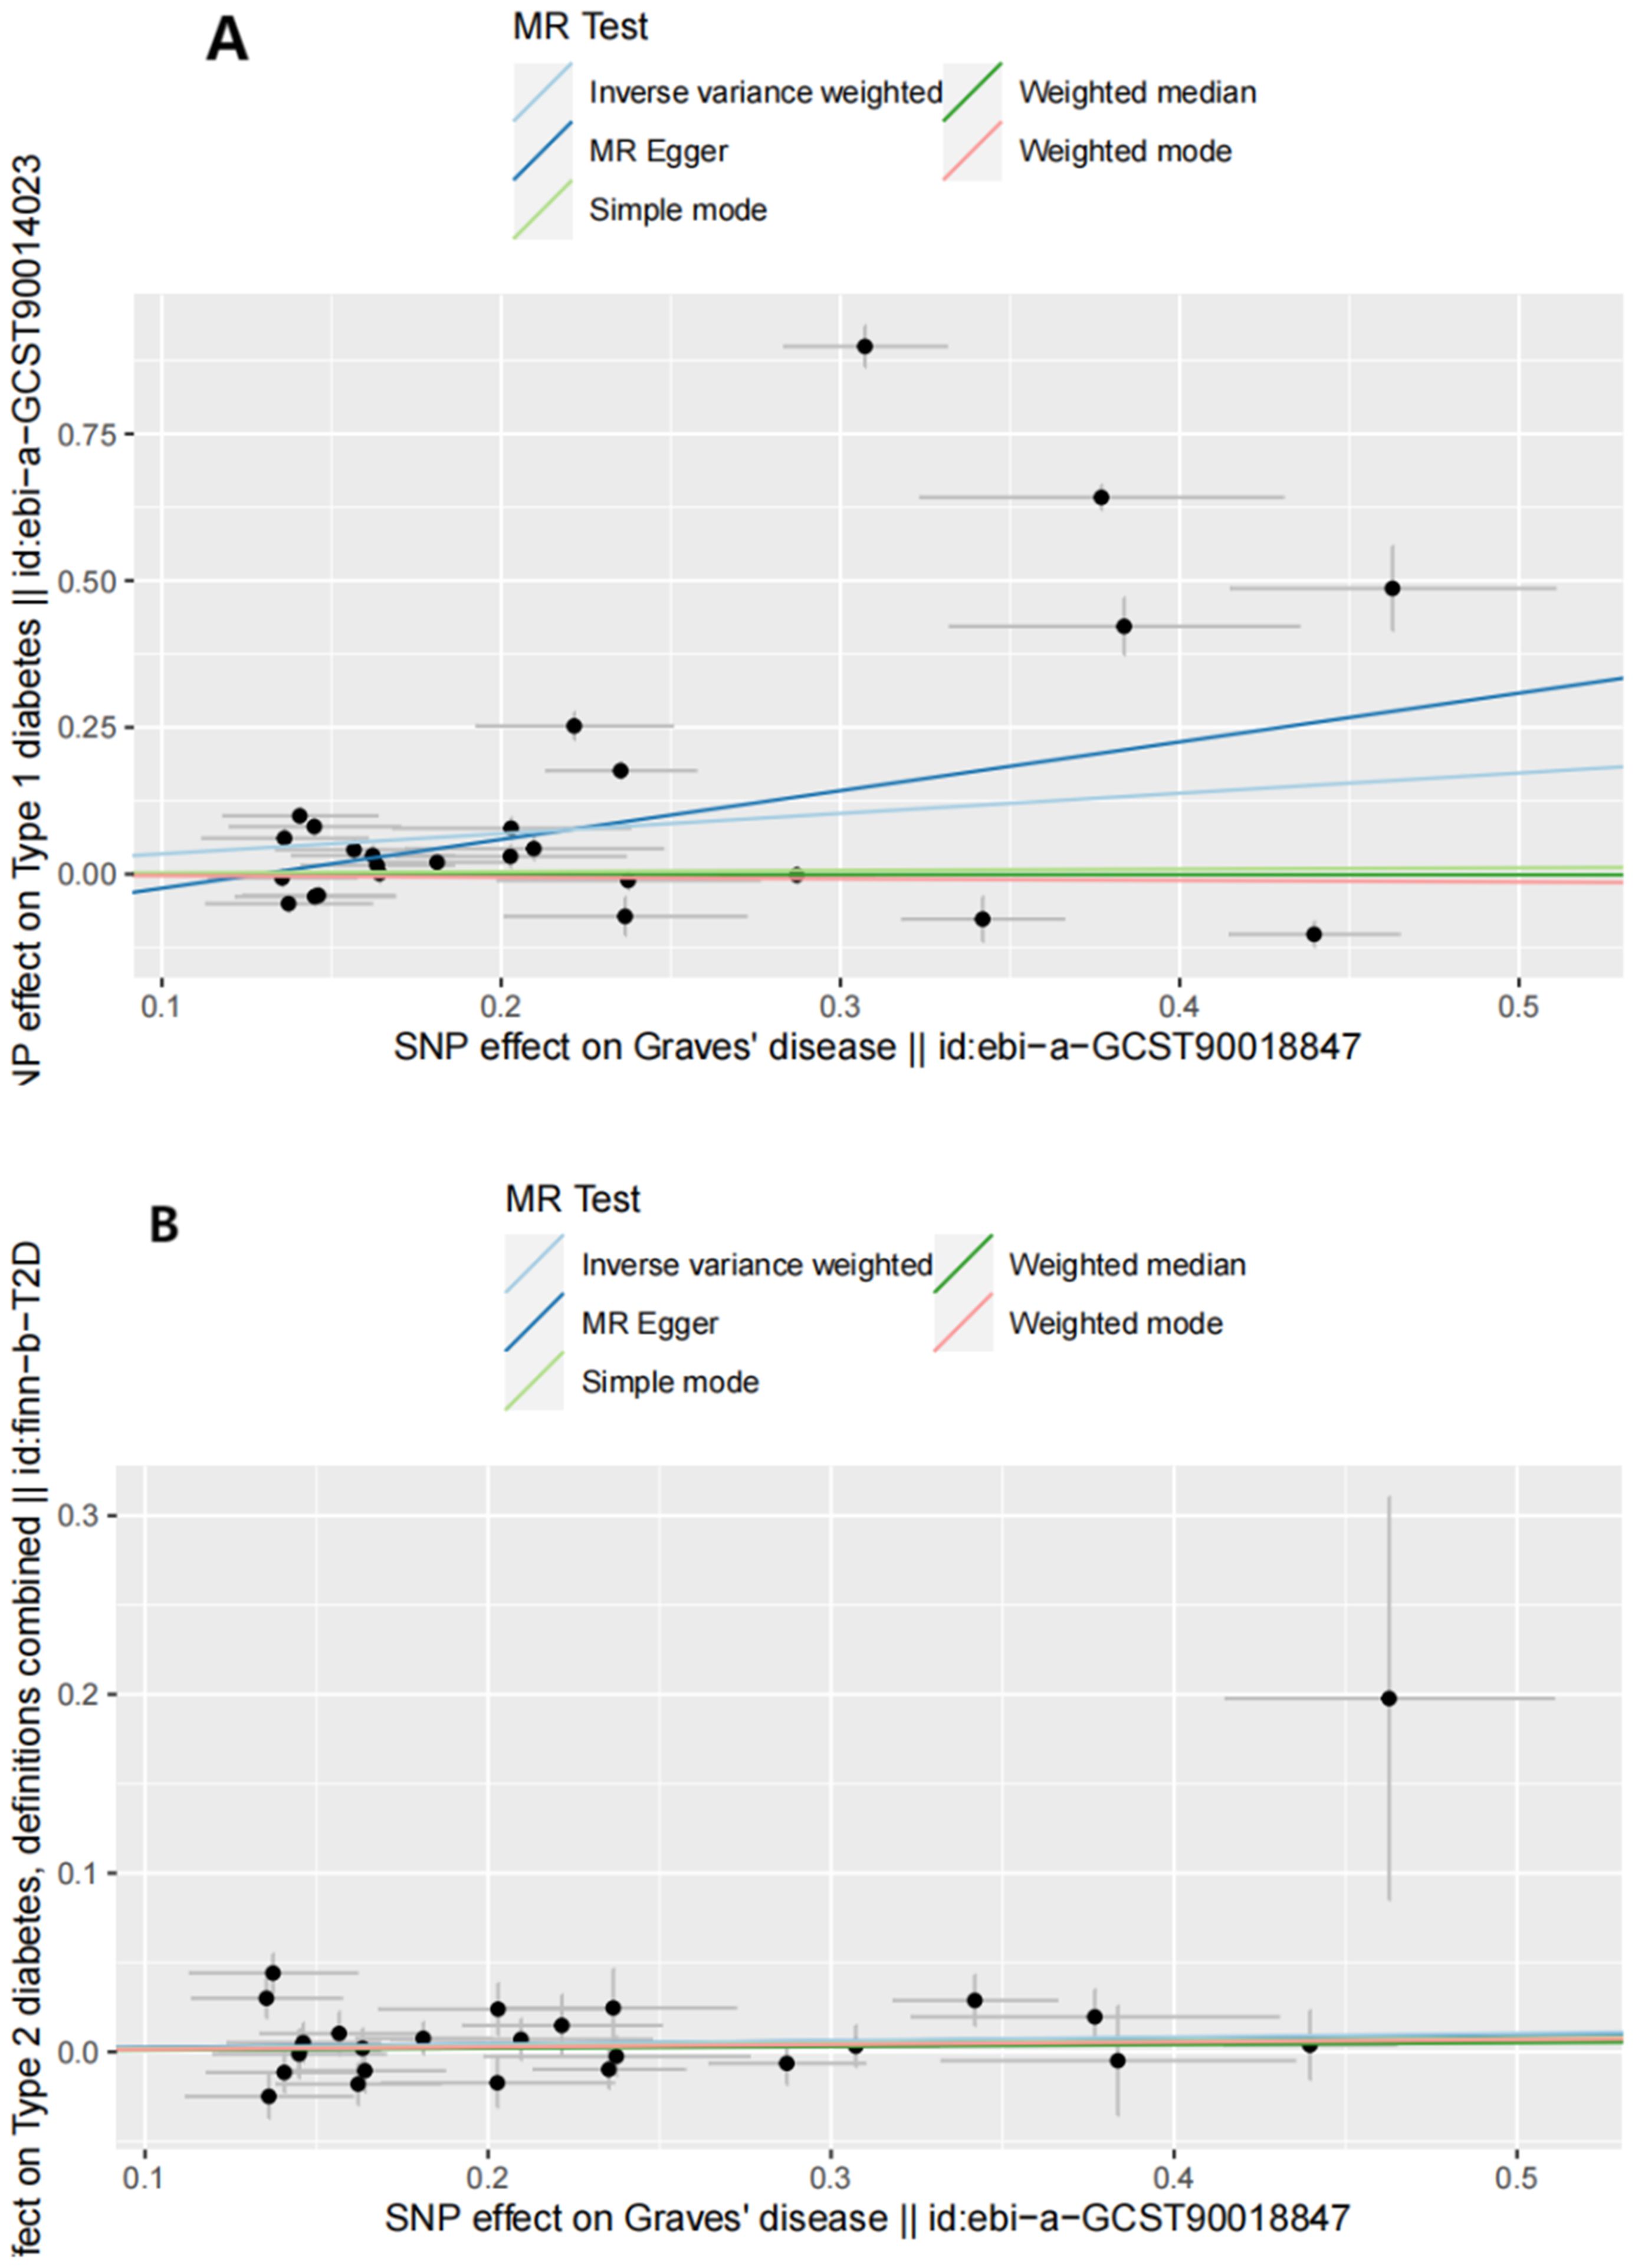
Figure 2. Scatter plots of forward MR analysis. (A) Scatter plots of SNP effects on GD and T1D risk. X axes represent SNP effects on GD. Y axes represent SNP effects on T1D risk. (B) Scatter plots of SNP effects on GD and T2D risk. X axes represent SNP effects on GD. Y axes represent SNP effects on T2D risk.
3.3 Sensitivity analyses
Sensitivity analyses included the Cochran’s Q test and horizontal pleiotropy testing (Table 2). Heterogeneity was present in all analyses, as indicated by a P-value< 0.05. The MR-PRESSO test results showed that heterogeneity and outliers were present in all datasets. The MR effect magnitude was re-estimated using random-effects models, and causality was verified. The MR-Egger intercept tests of GD had P > 0.05, which suggests that horizontal pleiotropy was not significant (Table 2). The funnel plots for these analyses are shown in Figure 3. Ultimately, the leave-one-out analysis and visualization supported the reliability of our findings (Figure 4).
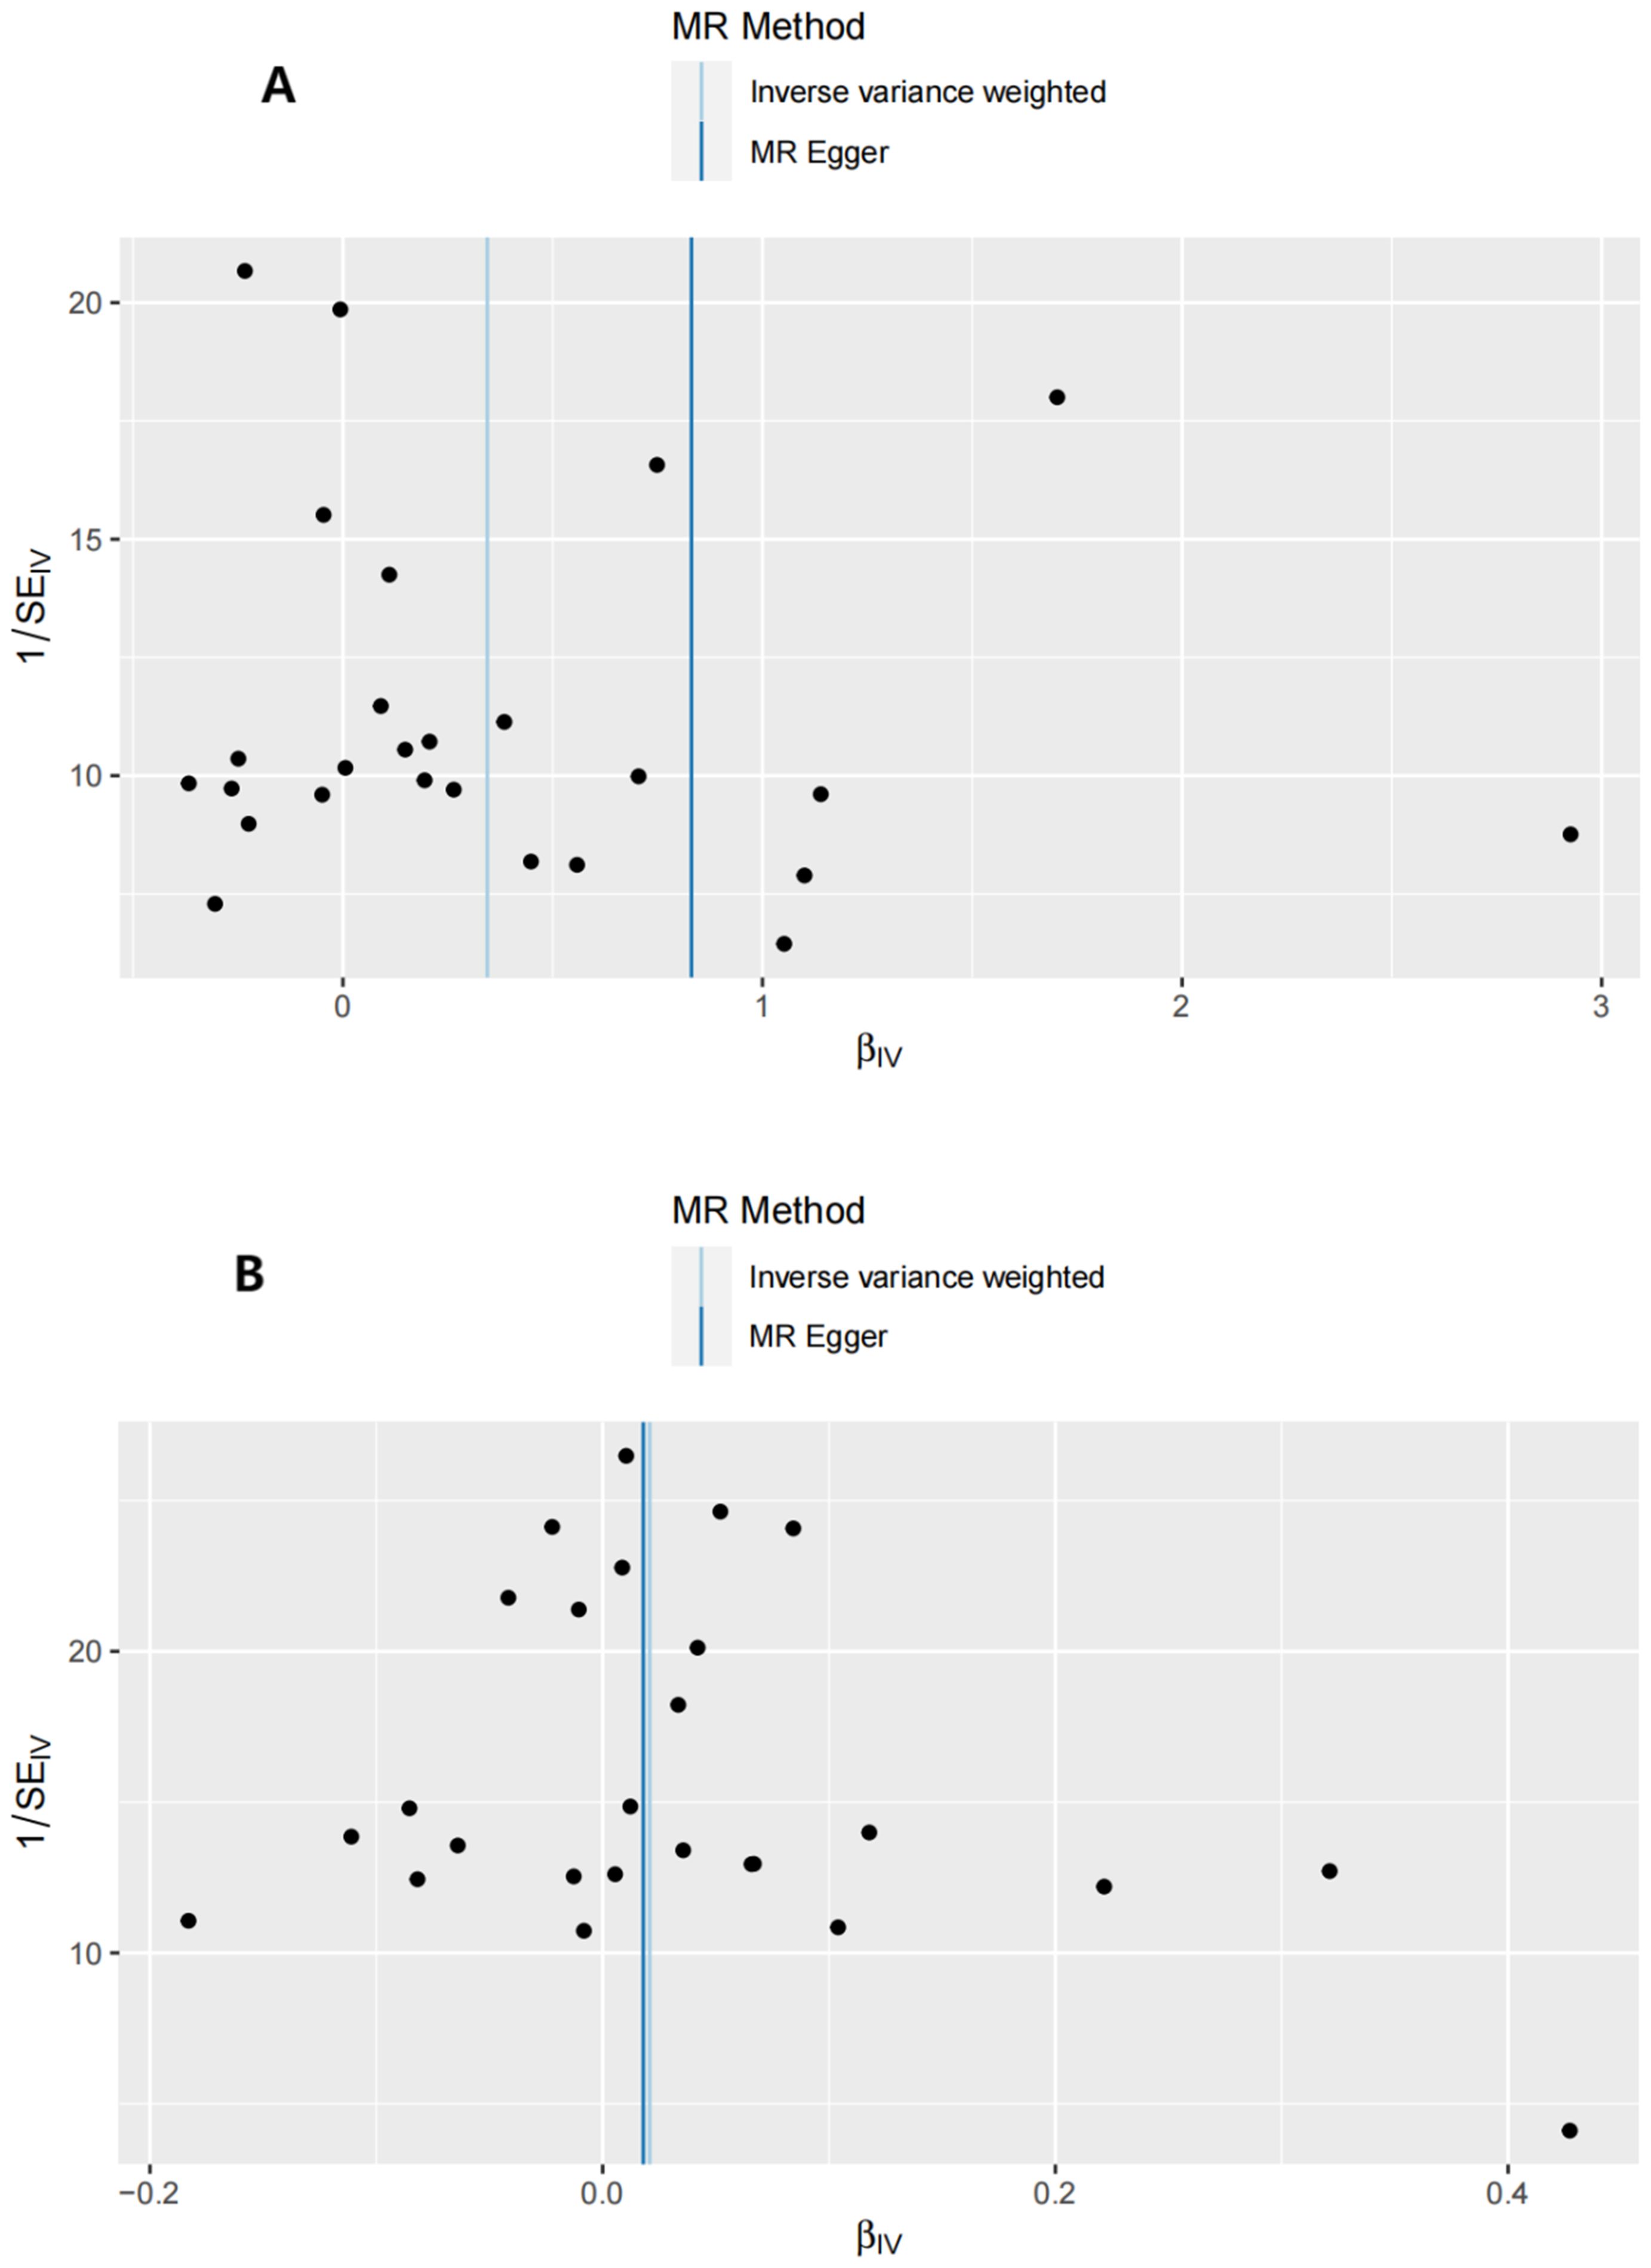
Figure 3. Funnel plots of the forward MR analysis. (A) exposure: GD, outcome: T1D. (B) exposure: GD, outcome: T2D.
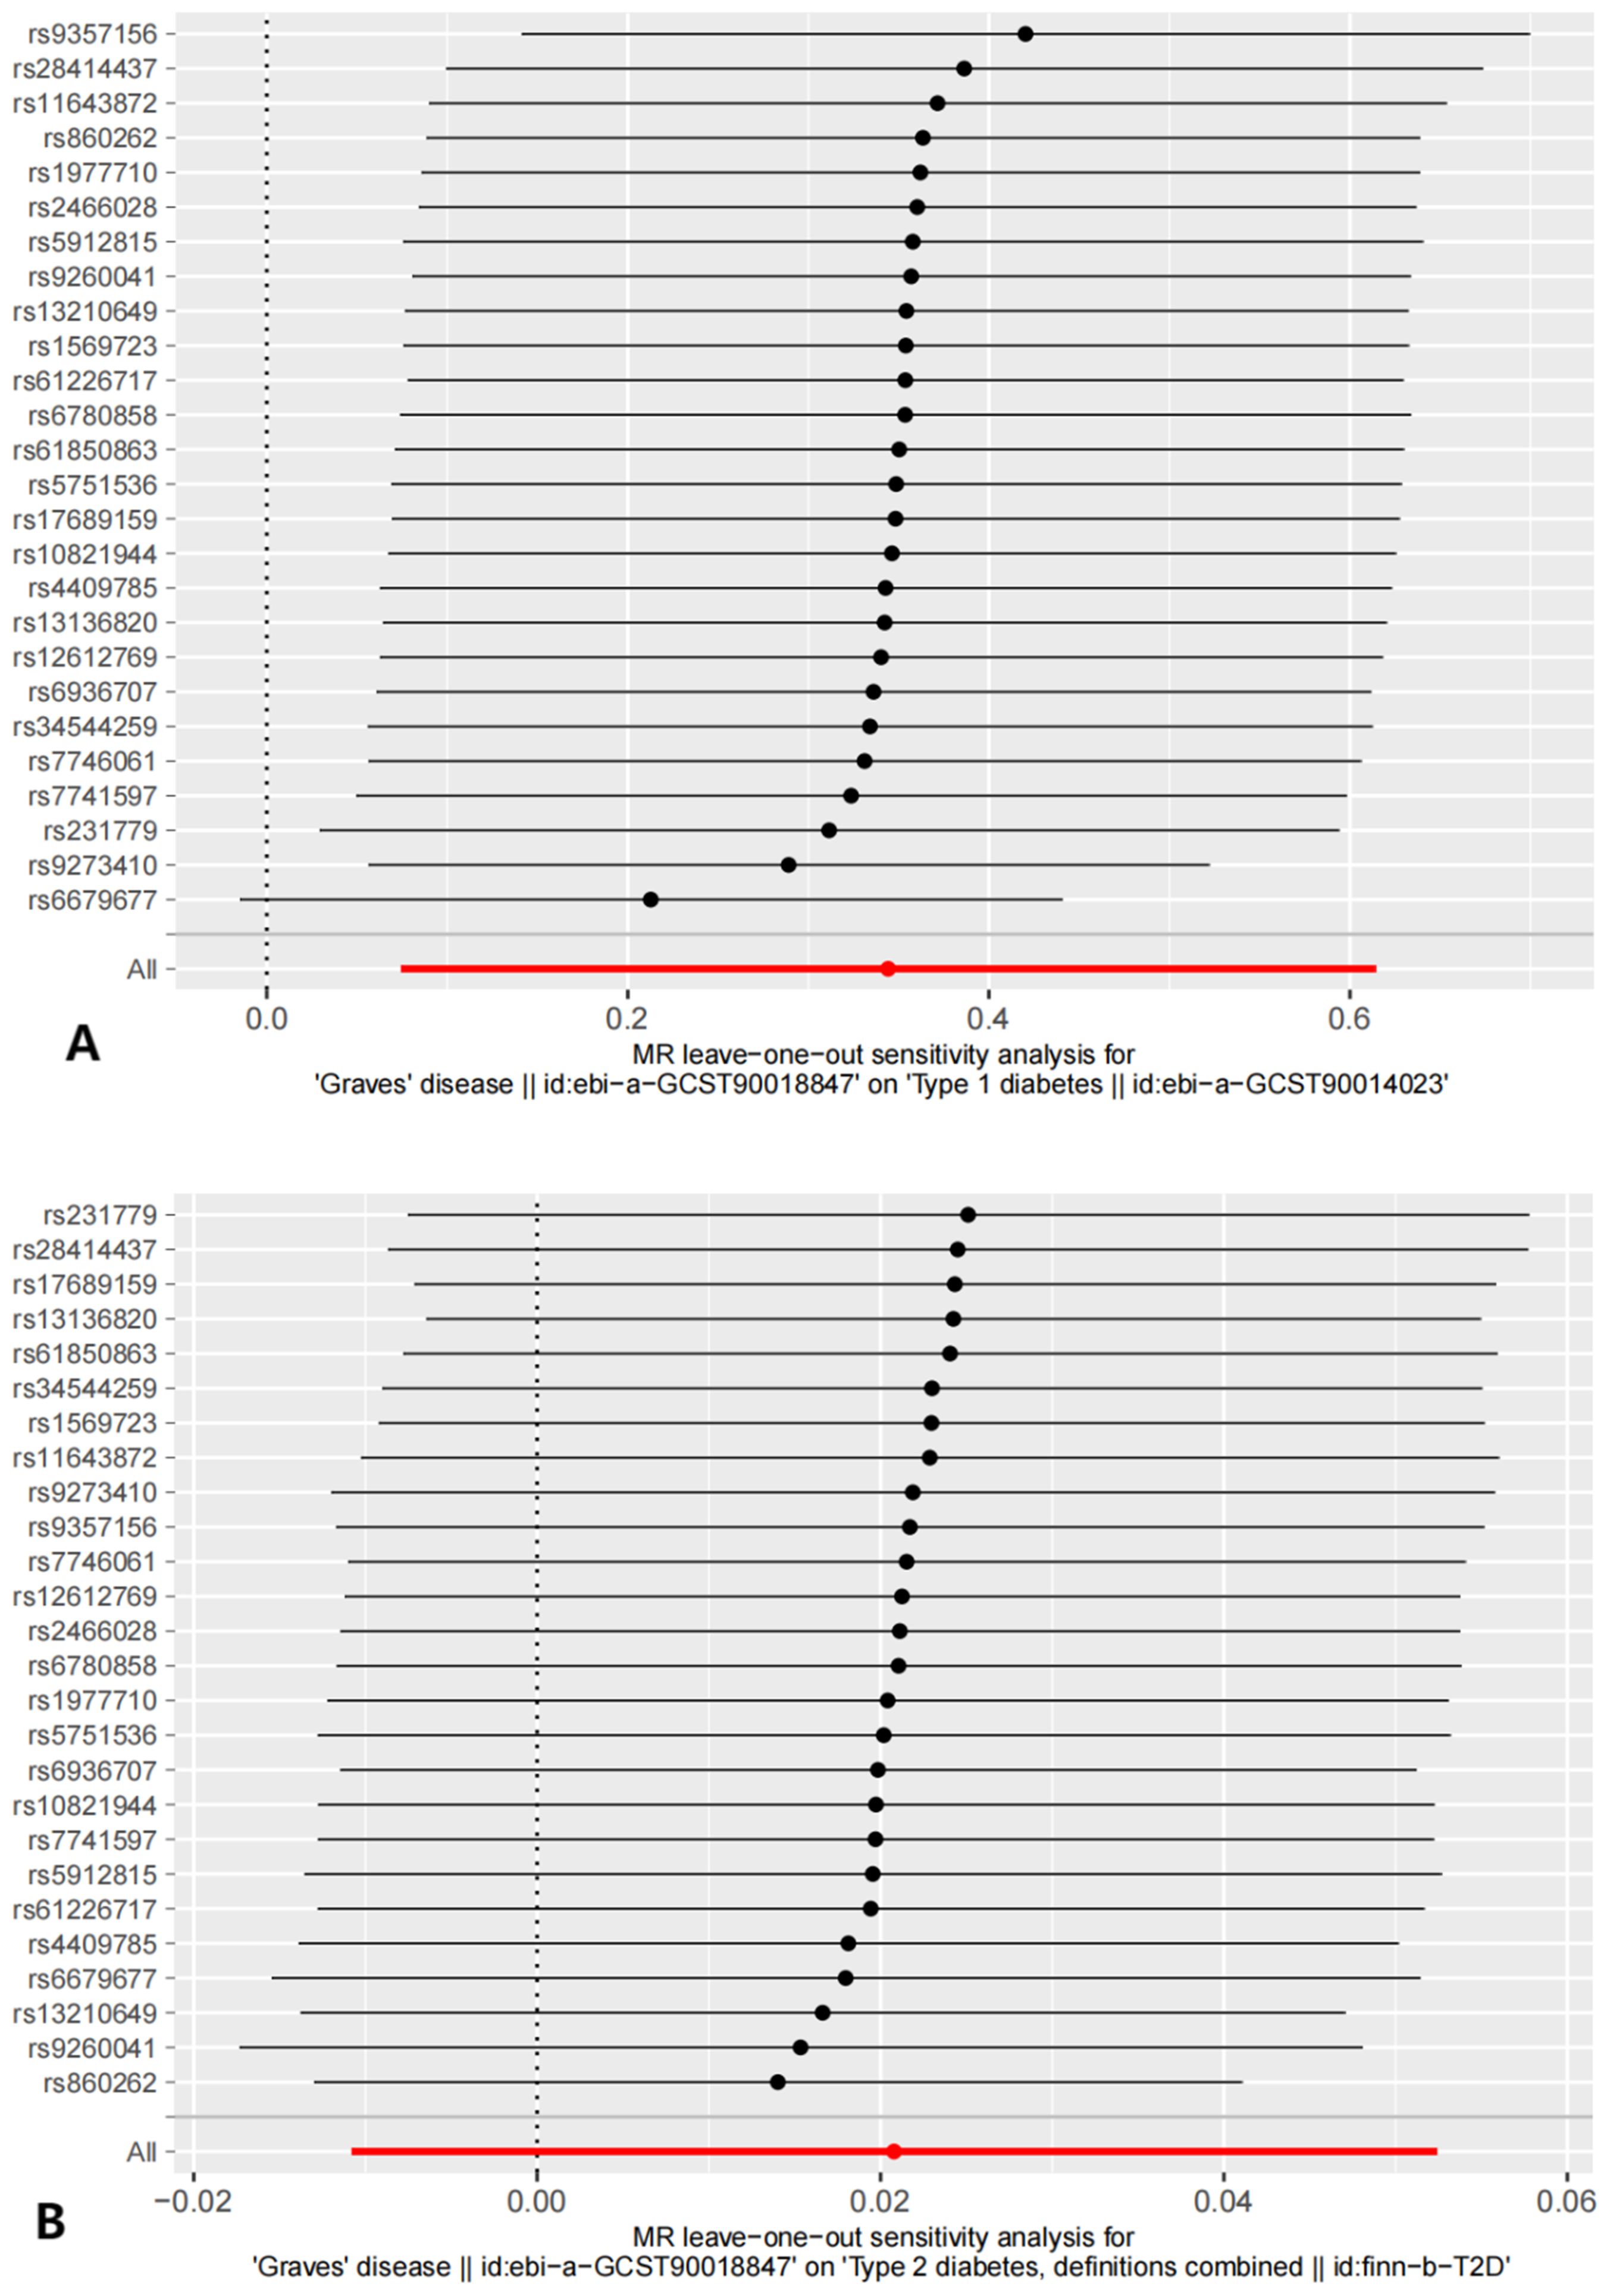
Figure 4. The results of Leave-one-out analysis. (A) leave-one-out analysis on causal relationship between GD and T1D. (B) leave-one-out analysis on causal relationship between GD and T2D.
3.4 Reverse MR analysis and sensitivity analysis
The reverse MR analysis and sensitivity analysis results shown in Table 1 and Figure 5 revealed the presence of a causal connection between the increased genetic liability of T1D and risk of GD [IVW, OR (95% CI) = 1.173(1.117,1.231), P = 1.913e-10]. In contrast, genetic susceptibility to T2D did not increase the risk of developing GD (OR (95% CI) = 0.963 (0.870–1.066), P = 0.468). Table 2 displays the sensitivity analysis results of the reverse MR analysis. The funnel and leave-one-out plots of the reverse MR are shown in Figures 6 and 7, respectively.
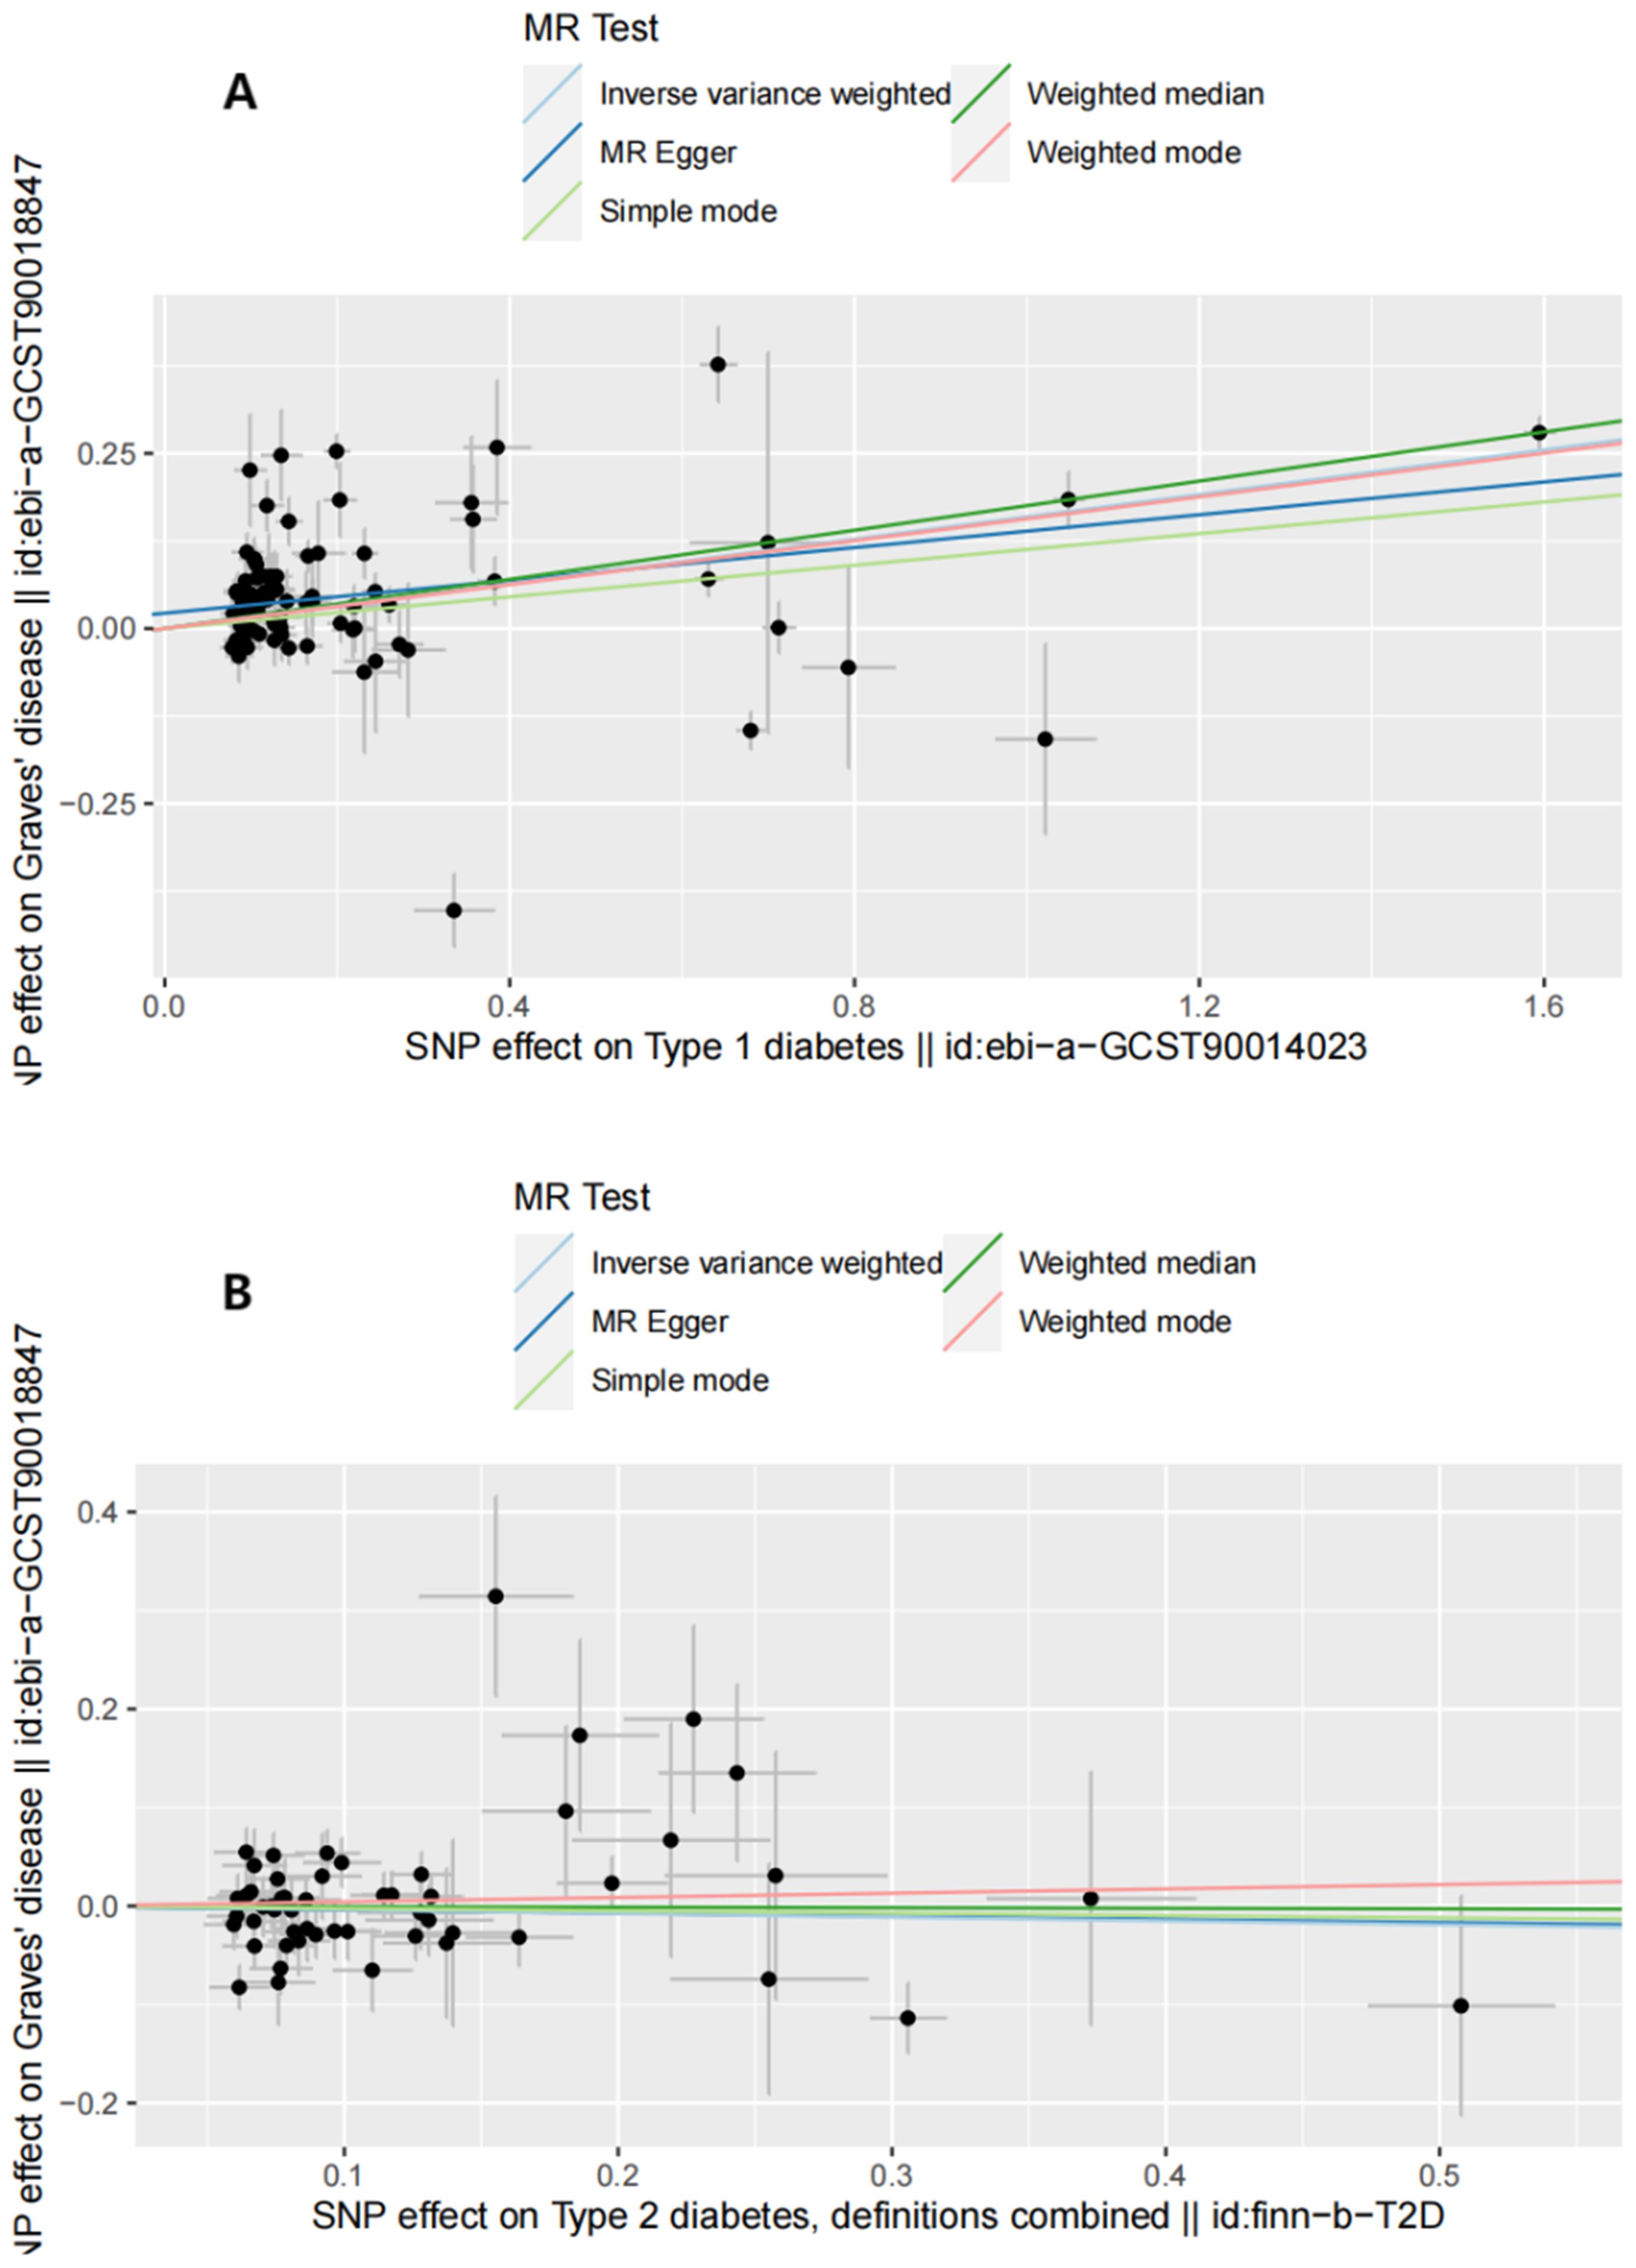
Figure 5. Scatter plots of reverse MR analysis. (A) Scatter plots of SNP effects on T1D and GD risk. X axes represent SNP effects on T1D. Y axes represent SNP effects on GD risk. (B) Scatter plots of SNP effects on T2D and GD risk. X axes represent SNP effects on T2D. Y axes represent SNP effects on GD risk.
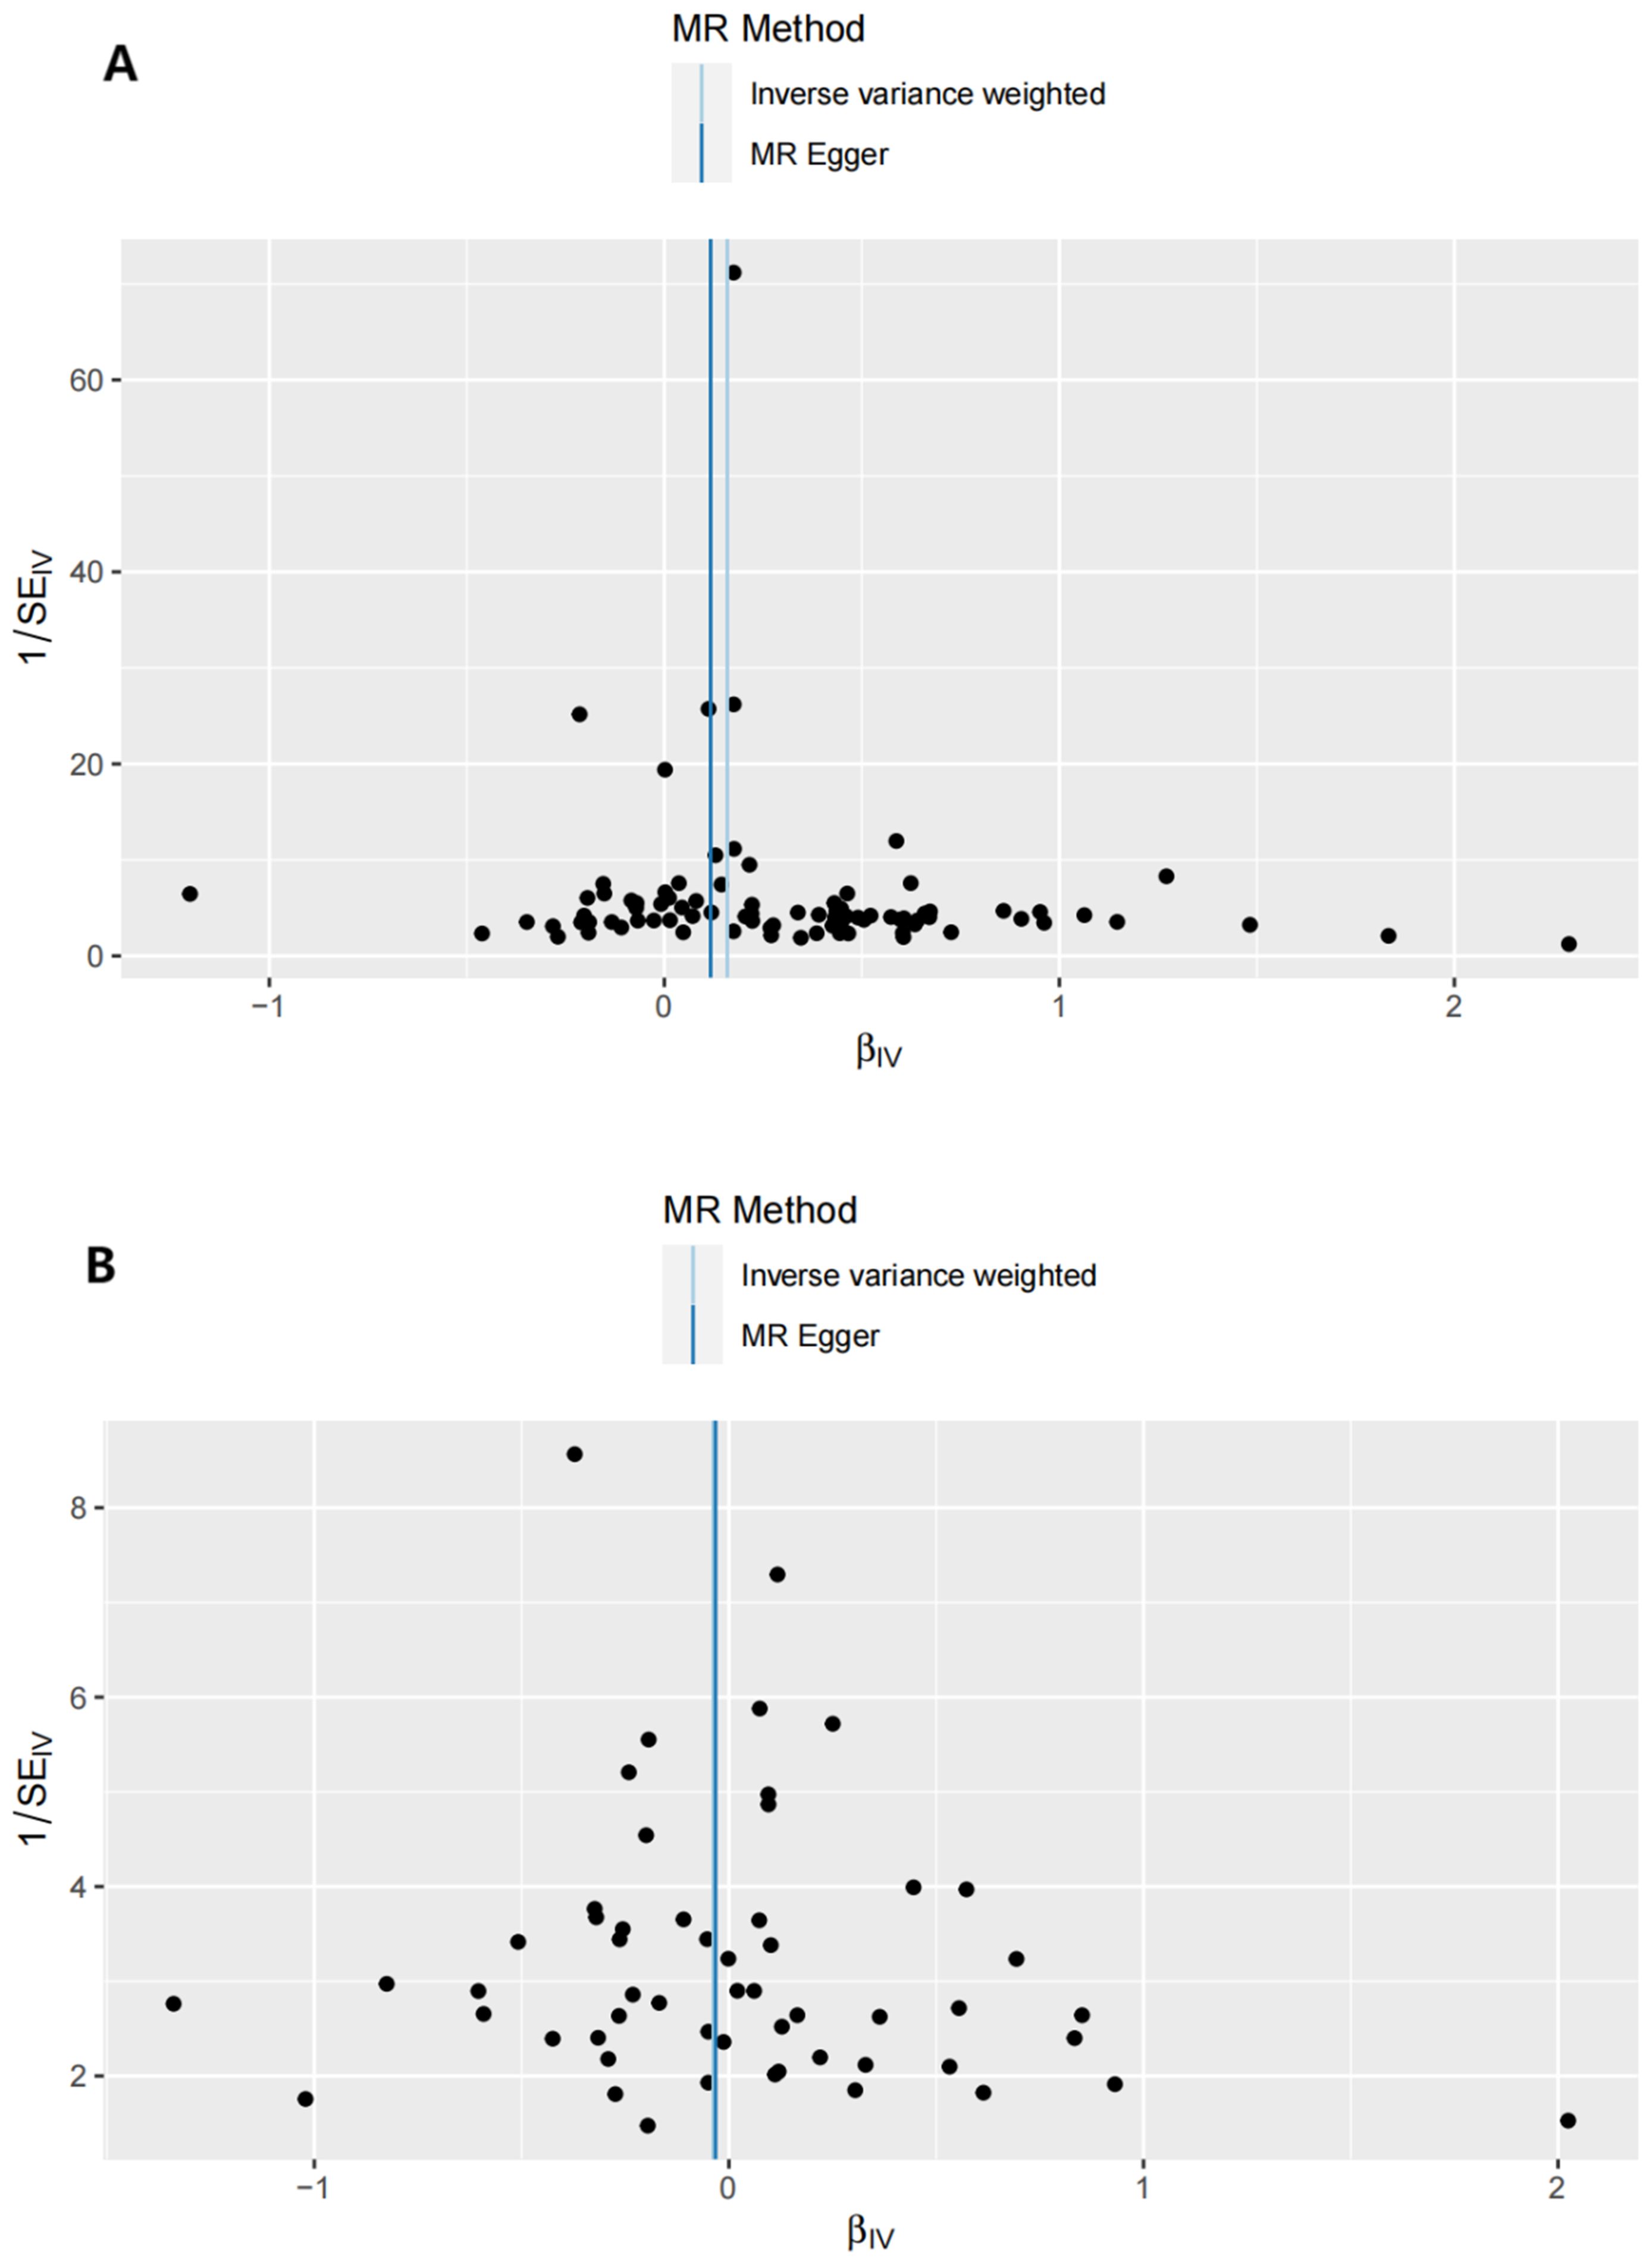
Figure 6. Funnel plots of the reverse MR analysis. (A) exposure: T1D, outcome: GD. (B) exposure: T2D, outcome: GD.
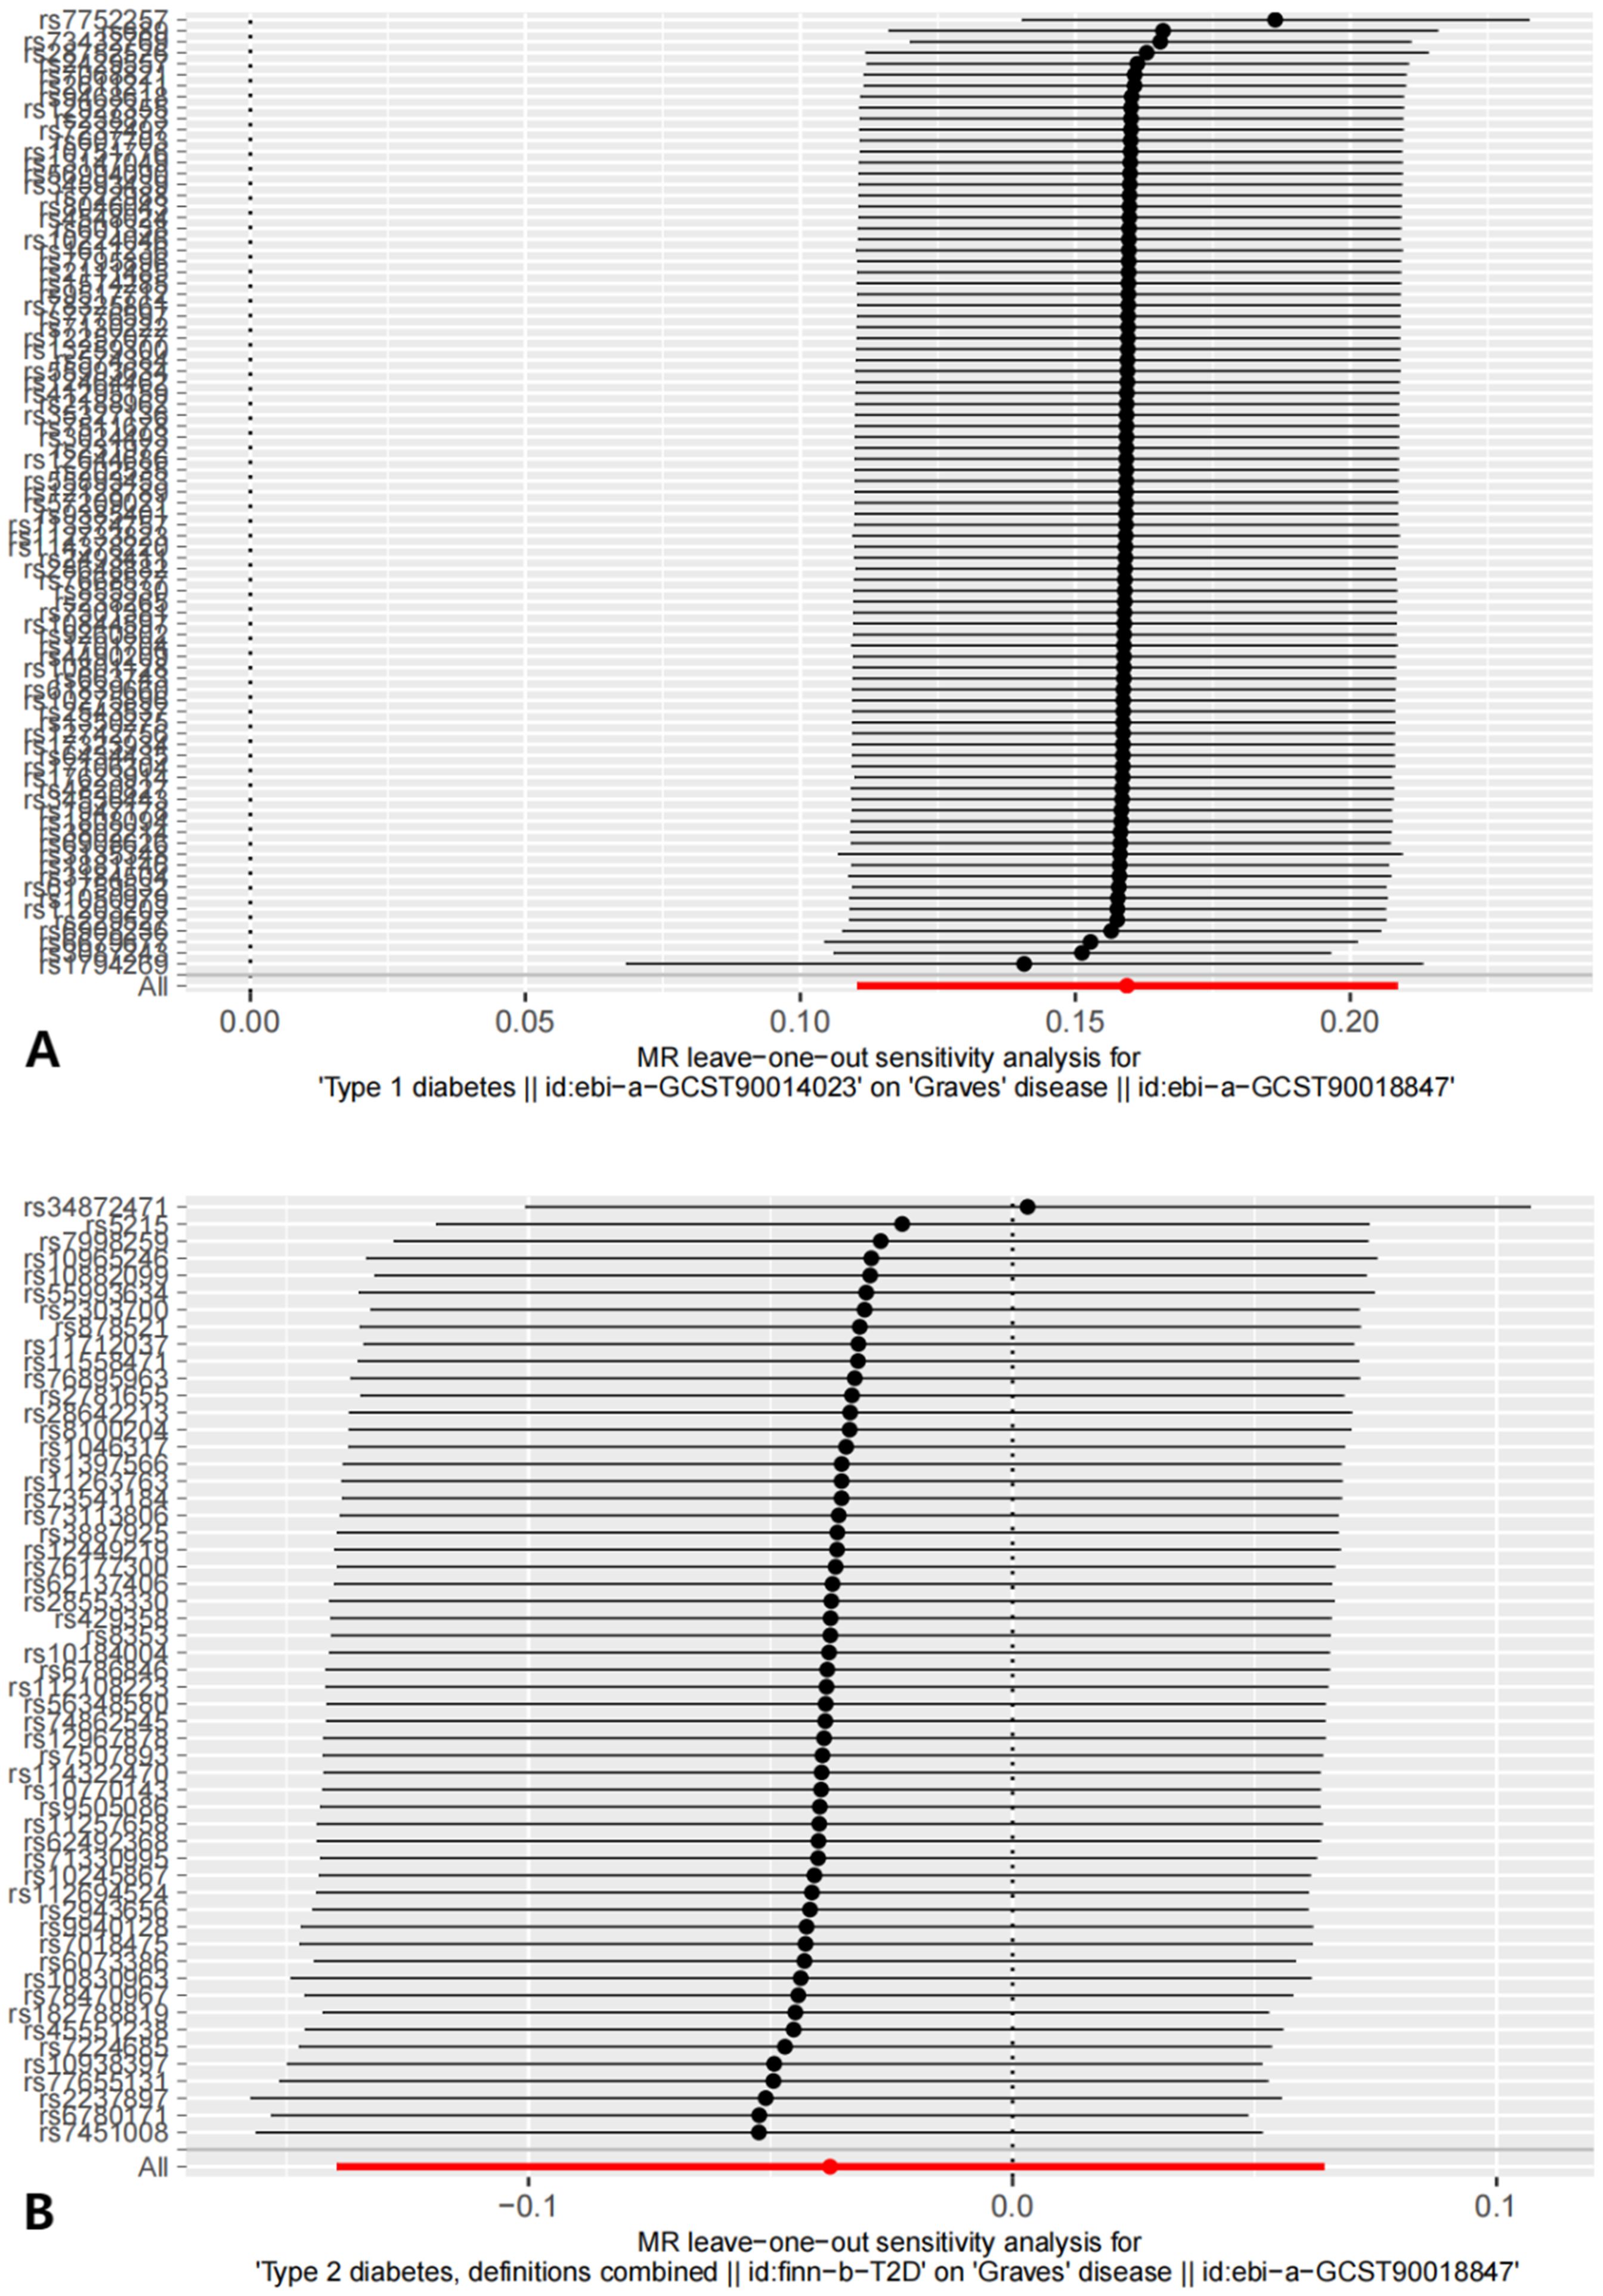
Figure 7. The results of Leave-one-out analysis on reverse MR analysis. (A) leave-one-out analysis on causal relationship between T1D and GD. (B) leave-one-out analysis on causal relationship between T2D and GD.
3.5 MVMR analysis
Table 3 demonstrates the causal links between the higher genetic liability of GD and T1D and the increased risk of T2D. In comparison, no causal relationship was observed between Tg, TSH, or TPO and T1D or T2D.
4 Discussion
GD and T2D were causally linked in this study, indicating that a genetic predisposition to GD increases the risk of T2D. Conversely, there was no significant causal relationship between GD and T1D. However, reverse MR suggested that genetic liability to T1D increases the risk of developing GD, while T2D does not. Furthermore, there is inadequate evidence to suggest that abnormal TSH, TPO, and Tg levels increase the risk of developing T1D or T2D in patients with GD.
We believe that the increased risk of developing DM due to GD can be explained by certain aspects, such as the commonality of autoimmune mechanisms. GD is a chronic autoimmune thyroid disorder characterized by an abnormal immune response to thyroid antigens. Several animal studies have described a correlation between GD and regulatory T cells (Tregs) (39, 40). Some studies have reported varying degrees of functional impairment, decreased Treg cell efficiency, and enrichment of T helper 17 cells (Th17) in patients with GD (41–43). Th17 cells play a role in promoting inflammation and immune responses, whereas Tregs act as immunosuppressors. There may be a link between the onset and progression of DM (types 1 and 2) and an imbalance between Tregs and Th17 cells (43–45). A population-based study conducted in Finland revealed a significant correlation between T1D and other autoimmune diseases, including GD (46). The study found a significant association between hyperthyroidism and an increased risk of developing T1D (OR 2.98 [2.27–3.90]). In addition, GD has been identified as a primary cause of hyperthyroidism (47). In a separate study, it was found that out of 491 patients diagnosed with T1D, 122 tested positive for the TPO antibody, including 15 with autoimmune thyroid disease (48). In addition, a study of 500 individuals reported that patients with autoimmune thyroid disorders were more likely to develop other autoimmune diseases (49). Among them, researchers found T1D in 3.1% of patients with GD, confirming our finding that genetic susceptibility to GD increases the risk of developing T1D. Although several previous studies have suggested a potential correlation between GD and T1D, our findings indicate that increased genetic susceptibility to GD may not be a primary cause of the elevated risk of developing T1D. Considering the results of the IVW analysis are inconsistent with those of the weighted-media analysis, we conclude that the causal relationship between GD and T1D derived from the IVW analysis is unreliable. The disparate conclusions reached in this study in comparison to those of previous studies may be attributable to the presence of unavoidable confounding variables. To this end, larger sample sizes from other databases should be included in subsequent studies to validate the aforementioned conclusions.
The onset and progression of T2D is a complex process involving multiple mechanisms. Several studies have reported on the involvement of immune factors in the pathogenesis of this disease. Obesity-associated chronic inflammation is an important factor in the predisposition to T2D (44, 50). Multiple studies have shown that an imbalance between Treg and Th17 cells, specifically a deficiency of Tregs and an excess of Th17 cells, is linked to obesity, insulin resistance, and T2D (51–53). Some studies have suggested that systemic Treg defects are associated with diabetic nephropathy, retinopathy, and diabetic foot ulcers (54, 55). An increasing number of Tregs in the body has been shown to improve the severity of diabetes in some animal studies. Fengjie et al. discovered that Tregs can promote the mobilization of endothelial progenitor cells, anti-inflammatory effects, and cytoprotection (56). This can inhibit vascular endothelial hyperplasia and alleviate the vascular degeneration caused by elevated blood glucose levels in diabetic pigs. One study found that CD4+ Tregs decreased in the visceral tissues of patients with T2D (57). This suggests that an imbalance between the quality and capability of Treg and Th17 cells is involved in the development of GD, T1D, and T2D. This finding is consistent with the bidirectional causal relationship between GD and T1D. In contrast, the etiology of T2D is multifactorial, with immunological factors being one of the many contributors to its onset or progression. Consequently, patients with GD may have an increased risk of T2D due to the disruption of immune system homeostasis, while T2D does not necessarily increase the risk of GD.
Chronic inflammation should also be taken into consideration. It is common for autoimmune diseases to be accompanied by a chronic inflammatory response (58–61). Researchers have revealed that some cytokines, including transforming growth factor beta (TGF-β), interleukin-6 (IL-6), IL-4, IL-5, IL-10, IL-13, IL-1β, and interferon-gamma (IFN-γ), are associated with GD. T1D is associated with chronic inflammation (62), and several studies have reported that cytokines, such as IFN-γ, tumor necrosis factor (TNF)-α, and IL-1β, contribute to the pathogenesis of T1D (63–65). We speculate that chronic inflammation triggered by GD may contribute to the development of T1D, and vice versa. This finding suggests a bidirectional causal relationship between GD and T1D. In recent research, T2D has been increasingly associated with chronic inflammation (66). Chronic inflammation with increased levels of various cytokines contributes to the development of T2D. It has been reported that conventional type 1 dendritic cells can promote insulin resistance by increasing IFN-γ production (67). IL1-β, IL-6, IL-8, TNF-α, NF-κB, and MAPK were also significantly increased in the T2D and prediabetes groups compared to non-diabetic groups, indicating their role as pro-inflammatory factors (68). Chronic inflammation resulting from GD-induced increases in the levels of inflammatory factors, such as IFN-γ, IL-1β, and TNF-α in vivo, may contribute to insulin resistance and increase the risk of developing T2D by affecting insulin sensitivity. It is essential to note that this suggestion is based on objective evidence rather than subjective evaluation. Chronic inflammation is not the sole factor in the development of T2D. Therefore, the complex etiology of T2D indicates that GD development is not necessarily increased by T2D.
Similar to other studies, this study has certain limitations. First, database limitations prevented the inclusion of indicators related to thyroid function, such as thyroid hormone, TSH receptor, anti-Tg, and anti-TPO. Additional research is required to examine the relationships between other indicators and DM. Second, our study did not investigate the causal relationship between Hashimoto’s thyroiditis and T1D or T2D. Future studies should explore autoimmune thyroiditis. Third, the scope of this study was restricted to the European population. Forth, due to the limitation of the database, the sample of MVMR is too small. The follow-up study will incorporate a larger sample size and disease-related exposure into the MVMR portion of the study. Therefore, additional research is necessary to verify whether our findings are applicable to other research groups.
5 Conclusion
In the present study, there was no increased risk of T1D as genetic susceptibility to GD increased, although higher genetic susceptibility to T1D has been shown to be associated with increased risk of developing GD. No significant causal relationship between TSH, TPO, or Tg and T1D or T2D was found in the MVMR analysis. According to the results mentioned before, higher genetic susceptibility to GD will increase the risk of T2D. The findings provide new insights into the control of DM.
Data availability statement
The original contributions presented in the study are included in the article/Supplementary Material. Further inquiries can be directed to the corresponding author/s.
Author contributions
YZ: Writing – original draft, Visualization, Validation, Software, Resources, Methodology, Investigation, Formal analysis, Data curation, Conceptualization. LF: Resources, Writing – review & editing, Validation, Supervision, Investigation, Formal analysis, Conceptualization.
Funding
The author(s) declare that no financial support was received for the research, authorship, and/or publication of this article.
Acknowledgments
We want to acknowledge the participants and investigators of the FinnGen study. The FinnGen study is a large-scale genomics initiative that has analyzed over 500,000 Finnish biobank samples and correlated genetic variation with health data to understand disease mechanisms and predispositions. The project is a collaboration between research organisations and biobanks within Finland and international industry partners. We are also very grateful to the IEU open GWAS project for helping us with our research.
Conflict of interest
The authors declare that the research was conducted in the absence of any commercial or financial relationships that could be construed as a potential conflict of interest.
Publisher’s note
All claims expressed in this article are solely those of the authors and do not necessarily represent those of their affiliated organizations, or those of the publisher, the editors and the reviewers. Any product that may be evaluated in this article, or claim that may be made by its manufacturer, is not guaranteed or endorsed by the publisher.
Supplementary material
The Supplementary Material for this article can be found online at: https://www.frontiersin.org/articles/10.3389/fendo.2024.1420499/full#supplementary-material
References
1. Magliano DJ, Boyko EJ, committee IDFDAtes. IDF Diabetes Atlas. In: Idf diabetes atlas, vol. 2021. Brussels: International Diabetes Federation (2021).
2. Saeedi P, Petersohn I, Salpea P, Malanda B, Karuranga S, Unwin N, et al. Global and regional diabetes prevalence estimates for 2019 and projections for 2030 and 2045: Results from the International Diabetes Federation Diabetes Atlas, 9(th) edition. Diabetes Res Clin Pract. (2019) 157:107843. doi: 10.1016/j.diabres.2019.107843
3. Lim JZ, Ng NS, Thomas C. Prevention and treatment of diabetic foot ulcers. J R Soc Med. (2017) 110(3):104–9. doi: 10.1177/0141076816688346
4. Wasserfall C, Nick HS, Campbell-Thompson M, Beachy D, Haataja L, Kusmartseva I, et al. Persistence of pancreatic insulin mRNA expression and proinsulin protein in type 1 diabetes pancreata. Cell Metab. (2017) 26:568–575.e563. doi: 10.1016/j.cmet.2017.08.013
5. Donath MY. Type 1 diabetes: what is the role of autoimmunity in β cell death? J Clin Invest. (2022) 132(20).
6. Quattrin T, Mastrandrea LD, Walker LSK. Type 1 diabetes. Lancet. (2023) 401:2149–62. doi: 10.1016/S0140-6736(23)00223-4
7. Ravikumar V, Ahmed A, Anjankar A. A review on latent autoimmune diabetes in adults. Cureus. (2023) 15:e47915. doi: 10.7759/cureus.47915
8. Galicia-Garcia U, Benito-Vicente A, Jebari S, Larrea-Sebal A, Siddiqi H, Uribe KB, et al. Pathophysiology of type 2 diabetes mellitus. Int J Mol Sci. (2020) 21(17). doi: 10.3390/ijms21176275
9. Chen Y, Lundeen EA, Koyama AK, Kompaniyets L, Andes LJ, Benoit SR, et al. Prevalence of testing for diabetes among US adults with overweight or obesity, 2016-2019. Prev Chronic Dis. (2023) 20:E116. doi: 10.5888/pcd20.230173
10. Jensen AH, Winther-Sørensen M, Burisch J, Bergquist A, Ytting H, Gluud LL, et al. Autoimmune liver diseases and diabetes: A propensity score matched analysis and a proportional meta-analysis. Liver Int. (2023) 43:2479–91. doi: 10.1111/liv.v43.11
11. Niţulescu IM, Ciulei G, Cozma A, Procopciuc LM, Orăşan OH. From innate immunity to metabolic disorder: A review of the NLRP3 inflammasome in diabetes mellitus. J Clin Med. (2023) 12(18). doi: 10.3390/jcm12186022
12. Lampousi AM, Carlsson S, Löfvenborg JE, Cabrera-Castro N, Chirlaque MD, Fagherazzi G, et al. Interaction between plasma phospholipid odd-chain fatty acids and GAD65 autoantibodies on the incidence of adult-onset diabetes: the EPIC-InterAct case-cohort study. Diabetologia. (2023) 66:1460–71. doi: 10.1007/s00125-023-05948-x
13. Fan B, Lim CKP, Poon EWM, Lau ESH, Wu H, Yang A, et al. Differential associations of GAD antibodies (GADA) and C-peptide with insulin initiation, glycemic responses, and severe hypoglycemia in patients diagnosed with type 2 diabetes. Diabetes Care. (2023) 46:1282–91. doi: 10.2337/dc22-2301
14. Burch HB, Cooper DS. Management of graves disease: A review. Jama. (2015) 314:2544–54. doi: 10.1001/jama.2015.16535
15. Subekti I, Pramono LA. Current diagnosis and management of graves’ Disease. Acta Med Indones. (2018) 50:177–82.
16. Petranović Ovčariček P, Görges R, Giovanella L. Autoimmune thyroid diseases. Semin Nucl Med. (2023).
17. Kravchenko V, Zakharchenko T. Thyroid hormones and minerals in immunocorrection of disorders in autoimmune thyroid diseases. Front Endocrinol (Lausanne). (2023) 14:1225494. doi: 10.3389/fendo.2023.1225494
18. Wang LT, Huang CY, Lin CH, Cheng BW, Lo FS, Ting WH, et al. Graves disease is more prevalent than Hashimoto disease in children and adolescents with type 1 diabetes. Front Endocrinol (Lausanne). (2022) 13:1083690. doi: 10.3389/fendo.2022.1083690
19. Gu P, Pu B, Ma Y, Yue D, Xin Q, Li H, et al. Appraising the causal relationship between thyroid function and rheumatoid arthritis: a two-sample bidirectional Mendelian randomization study. Front Immunol. (2023) 14:1238757. doi: 10.3389/fimmu.2023.1238757
20. Chu YC, Yu KH, Lin WT, Wang WT, Chen DP. Finding the common single-nucleotide polymorphisms in three autoimmune diseases and exploring their bio-function by using a reporter assay. Biomedicines. (2023) 11(9). doi: 10.3390/biomedicines11092426
21. Ferrari SM, Fallahi P, Ruffilli I, Elia G, Ragusa F, Benvenga S, et al. The association of other autoimmune diseases in patients with Graves’ disease (with or without ophthalmopathy): Review of the literature and report of a large series. Autoimmun Rev. (2019) 18:287–92. doi: 10.1016/j.autrev.2018.10.001
22. Zala A, Thomas R. Antigen-specific immunotherapy to restore antigen-specific tolerance in Type 1 diabetes and Graves’ disease. Clin Exp Immunol. (2023) 211:164–75. doi: 10.1093/cei/uxac115
23. Ebrahim S, Davey Smith G. Mendelian randomization: can genetic epidemiology help redress the failures of observational epidemiology? Hum Genet. (2008) 123:15–33. doi: 10.1007/s00439-007-0448-6
24. Emdin CA, Khera AV, Kathiresan S. Mendelian randomization. Jama. (2017) 318:1925–6. doi: 10.1001/jama.2017.17219
25. Li P, Wang H, Guo L, Gou X, Chen G, Lin D, et al. Association between gut microbiota and preeclampsia-eclampsia: a two-sample Mendelian randomization study. BMC Med. (2022) 20:443. doi: 10.1186/s12916-022-02657-x
26. Zhu G, Zhou S, Xu Y, Gao R, Zhang M, Zeng Q, et al. Chickenpox and multiple sclerosis: A Mendelian randomization study. J Med Virol. (2023) 95:e28315. doi: 10.1002/jmv.28315
27. Sakaue S, Kanai M, Tanigawa Y, Karjalainen J, Kurki M, Koshiba S, et al. A cross-population atlas of genetic associations for 220 human phenotypes. Nat Genet. (2021) 53:1415–24. doi: 10.1038/s41588-021-00931-x
28. Sun BB, Maranville JC, Peters JE, Stacey D, Staley JR, Blackshaw J, et al. Genomic atlas of the human plasma proteome. Nature. (2018) 558:73–9. doi: 10.1038/s41586-018-0175-2
29. Gagliano Taliun SA, Evans DM. Ten simple rules for conducting a mendelian randomization study. PloS Comput Biol. (2021) 17:e1009238.
30. Burgess S, Thompson SG. Avoiding bias from weak instruments in Mendelian randomization studies. Int J Epidemiol. (2011) 40:755–64. doi: 10.1093/ije/dyr036
31. Chen L, Yang H, Li H, He C, Yang L, Lv G. Insights into modifiable risk factors of cholelithiasis: A Mendelian randomization study. Hepatology. (2022) 75:785–96. doi: 10.1002/hep.32183
32. Chiou J, Geusz RJ, Okino ML, Han JY, Miller M, Melton R, et al. Interpreting type 1 diabetes risk with genetics and single-cell epigenomics. Nature. (2021) 594:398–402. doi: 10.1038/s41586-021-03552-w
33. Kurki MI, Karjalainen J, Palta P, Sipilä TP, Kristiansson K, Donner KM, et al. FinnGen provides genetic insights from a well-phenotyped isolated population. Nature. (2023) 613:508–18. doi: 10.1038/s41586-022-05473-8
34. Burgess S, Davey Smith G, Davies NM, Dudbridge F, Gill D, Glymour MM, et al. Guidelines for performing Mendelian randomization investigations: update for summer 2023. Wellcome Open Res. (2019) 4:186. doi: 10.12688/wellcomeopenres
35. Greco MF, Minelli C, Sheehan NA, Thompson JR. Detecting pleiotropy in Mendelian randomisation studies with summary data and a continuous outcome. Stat Med. (2015) 34:2926–40. doi: 10.1002/sim.v34.21
36. Verbanck M, Chen CY, Neale B, Do R. Detection of widespread horizontal pleiotropy in causal relationships inferred from Mendelian randomization between complex traits and diseases. Nat Genet. (2018) 50:693–8. doi: 10.1038/s41588-018-0099-7
37. Meng H, Jiang L, Song Z, Wang F. Causal associations of circulating lipids with osteoarthritis: A bidirectional mendelian randomization study. Nutrients. (2022) 14(7). doi: 10.3390/nu14071327
38. Dong R, Zhang Q, Peng H. Gastroesophageal reflux disease and the risk of respiratory diseases: a Mendelian randomization study. J Transl Med. (2024) 22:60. doi: 10.1186/s12967-023-04786-0
39. Zhou J, Bi M, Fan C, Song X, Yang R, Zhao S, et al. Regulatory T cells but not T helper 17 cells are modulated in an animal model of Graves’ hyperthyroidism. Clin Exp Med. (2012) 12:39–46. doi: 10.1007/s10238-011-0137-6
40. Yuan Q, Zhao Y, Zhu X, Liu X. Low regulatory T cell and high IL-17 mRNA expression in a mouse Graves’ disease model. J Endocrinol Invest. (2017) 40:397–407. doi: 10.1007/s40618-016-0575-9
41. Tan Y, Chen W, Liu C, Zheng X, Guo A, Long J. Effect of IL-21 on the balance of th17 cells/treg cells in the pathogenesis of graves’ Disease. Endocr Res. (2019) 44:138–47. doi: 10.1080/07435800.2019.1600535
42. Su X, Yin X, Liu Y, Yan X, Zhang S, Wang X, et al. Gut dysbiosis contributes to the imbalance of treg and th17 cells in graves’ Disease patients by propionic acid. J Clin Endocrinol Metab. (2020) 105(11). doi: 10.1210/clinem/dgaa511
43. Fan Q, Liu Y, Rao J, Zhang Z, Xiao W, Zhu T, et al. Anti-atherosclerosis effect of angong niuhuang pill via regulating th17/treg immune balance and inhibiting chronic inflammatory on apoE(-/-) mice model of early and mid-term atherosclerosis. Front Pharmacol. (2019) 10:1584.
44. Barbosa P, Pinho A, Lázaro A, Rosendo-Silva D, Paula D, Campos J, et al. CD8(+) Treg cells play a role in the obesity-associated insulin resistance. Life Sci. (2024) 336:122306. doi: 10.1016/j.lfs.2023.122306
45. Xu Q, Zhang X, Li T, Shao S. Exenatide regulates Th17/Treg balance via PI3K/Akt/FoxO1 pathway in db/db mice. Mol Med. (2022) 28:144. doi: 10.1186/s10020-022-00574-6
46. Mäkimattila S, Harjutsalo V, Forsblom C, Groop PH. Every fifth individual with type 1 diabetes suffers from an additional autoimmune disease: A finnish nationwide study. Diabetes Care. (2020) 43:1041–7. doi: 10.2337/dc19-2429
48. Triolo TM, Armstrong TK, McFann K, Yu L, Rewers MJ, Klingensmith GJ, et al. Additional autoimmune disease found in 33% of patients at type 1 diabetes onset. Diabetes Care. (2011) 34:1211–3.
49. Sharma H, Sahlot R, Purwar N, Garg U, Saran S, Sharma B, et al. Co-existence of type 1 diabetes and other autoimmune ailments in subjects with autoimmune thyroid disorders. Diabetes Metab Syndr. (2022) 16:102405.
50. Coope A, Torsoni AS, Velloso LA. MECHANISMS IN ENDOCRINOLOGY: Metabolic and inflammatory pathways on the pathogenesis of type 2 diabetes. Eur J Endocrinol. (2016) 174:R175–187. doi: 10.1530/EJE-15-1065
51. Ou Q, Power R, Griffin MD. Revisiting regulatory T cells as modulators of innate immune response and inflammatory diseases. Front Immunol. (2023) 14:1287465. doi: 10.3389/fimmu.2023.1287465
52. Fabbrini E, Cella M, McCartney SA, Fuchs A, Abumrad NA, Pietka TA, et al. Association between specific adipose tissue CD4+ T-cell populations and insulin resistance in obese individuals. Gastroenterology. (2013) 145:366–374.e361-363. doi: 10.1053/j.gastro.2013.04.010
53. Gu QW, Sun Q, Wang J, Gu WS, Wang W, Mao XM. Effects of glycemic variability on regulatory T cells in patients with type 2 diabetes and kidney disease. Diabetes Metab Syndr Obes. (2023) 16:2365–75. doi: 10.2147/DMSO.S413407
54. Gonzalez LL, Garrie K, Turner MD. Type 2 diabetes - An autoinflammatory disease driven by metabolic stress. Biochim Biophys Acta Mol Basis Dis. (2018) 1864:3805–23. doi: 10.1016/j.bbadis.2018.08.034
55. Zhang J, Chen J, Gao C, Sun X, Wang L, Hu Z, et al. Maggot treatment promotes healing of diabetic foot ulcer wounds possibly by upregulating Treg levels. Diabetes Res Clin Pract. (2022) 184:109187. doi: 10.1016/j.diabres.2021.109187
56. Guo F, Ren Z, Liu D, Wang L, Hou X, Chen W. The inhibitory effect of regulatory T cells on the intimal hyperplasia of tissue-engineered blood vessels in diabetic pigs. Front Bioeng Biotechnol. (2022) 10:929867. doi: 10.3389/fbioe.2022.929867
57. Wu D, Han JM, Yu X, Lam AJ, Hoeppli RE, Pesenacker AM, et al. Characterization of regulatory T cells in obese omental adipose tissue in humans. Eur J Immunol. (2019) 49:336–47. doi: 10.1002/eji.201847570
58. Widder J, Dorfinger K, Wilfing A, Trieb K, Pirich K, Loebenstein R, et al. The immunoregulatory influence of transforming growth factor beta in thyroid autoimmunity: TGF beta inhibits autoreactivity in Graves’ disease. J Autoimmun. (1991) 4:689–701. doi: 10.1016/0896-8411(91)90186-G
59. Gianoukakis AG, Khadavi N, Smith TJ. Cytokines, Graves’ disease, and thyroid-associated ophthalmopathy. Thyroid. (2008) 18:953–8. doi: 10.1089/thy.2007.0405
60. Kutluturk F, Yarman S, Sarvan FO, Kekik C. Association of cytokine gene polymorphisms (IL6, IL10, TNF-α, TGF-β and IFN-γ) and Graves’ disease in Turkish population. Endocr Metab Immune Disord Drug Targets. (2013) 13:163–7. doi: 10.2174/18715303113139990001
61. Ueland HO, Ulvik A, Løvås K, Wolff ASB, Breivik LE, Stokland AM, et al. Systemic activation of the kynurenine pathway in graves disease with and without ophthalmopathy. J Clin Endocrinol Metab. (2023) 108:1290–7. doi: 10.1210/clinem/dgad004
62. Ermis E, Nargis T, Webster K, Tersey SA, Anderson RM, Mirmira RG. Leukotriene B4 receptor 2 governs macrophage migration during tissue inflammation. J Biol Chem. (2023) 300:105561. doi: 10.1016/j.jbc.2023.105561
63. De George DJ, Ge T, Krishnamurthy B, Kay TWH, Thomas HE. Inflammation versus regulation: how interferon-gamma contributes to type 1 diabetes pathogenesis. Front Cell Dev Biol. (2023) 11:1205590. doi: 10.3389/fcell.2023.1205590
64. Sun W, Liu J, Zhao R, Yang T, Zheng Z, Zhang T, et al. Knockdown of IFNAR2 reduces the inflammatory response in mouse model of type 1 diabetes. Biochem Biophys Res Commun. (2022) 619:9–14. doi: 10.1016/j.bbrc.2022.06.028
65. Gonuguntla S, Humphrey RK, Gorantla A, Hao E, Jhala US. Stress-induced pseudokinase TRB3 augments IL1β signaling by interacting with Flightless homolog 1. J Biol Chem. (2023) 299:104803. doi: 10.1016/j.jbc.2023.104803
66. Zhang M, Gao Y, Tian L, Zheng L, Wang X, Liu W, et al. Association of serum 25-hydroxyvitamin D(3) with adipokines and inflammatory marker in persons with prediabetes mellitus. Clin Chim Acta. (2017) 468:152–8. doi: 10.1016/j.cca.2017.02.022
67. Hildreth AD, Padilla ET, Gupta M, Wong YY, Sun R, Legala AR, et al. Adipose cDC1s contribute to obesity-associated inflammation through STING-dependent IL-12 production. Nat Metab. (2023) 5:2237–52. doi: 10.1038/s42255-023-00934-4
Keywords: Graves’ disease, Mendelian randomization, type 1 diabetes, type 2 diabetes, autoimmune disease
Citation: Zhang Y and Fu L (2024) Evaluating the causal effects between Grave’s disease and diabetes mellitus: a bidirectional Mendelian randomization study. Front. Endocrinol. 15:1420499. doi: 10.3389/fendo.2024.1420499
Received: 20 April 2024; Accepted: 01 October 2024;
Published: 06 November 2024.
Edited by:
Silvia Martina Ferrari, University of Pisa, ItalyReviewed by:
Weichen Song, Shanghai Jiao Tong University, ChinaVânia Gomes, Centro Hospitalar do Tâmega e Sousa, Portugal
Copyright © 2024 Zhang and Fu. This is an open-access article distributed under the terms of the Creative Commons Attribution License (CC BY). The use, distribution or reproduction in other forums is permitted, provided the original author(s) and the copyright owner(s) are credited and that the original publication in this journal is cited, in accordance with accepted academic practice. No use, distribution or reproduction is permitted which does not comply with these terms.
*Correspondence: Liuxiang Fu, OTMxMDE4NjU3QHFxLmNt
 Yuhan Zhang
 Liuxiang Fu1*