 Jianhui Xiao1†
 Li Zhou
 Yong Han
 Zhenhua Huang
- 1Department of Geriatrics, Shenzhen Hospital of Integrated Traditional Chinese and Western Medicine, Shenzhen, China
- 2Department of Emergency Medicine, the First Affiliated Hospital of Shenzhen University, Shenzhen Second People’s Hospital, Shenzhen, China
Objective: Given the limited evidence on the relationship between the triglyceride-glucose (TyG) index and the risk of prediabetes among young adults, our study aimed to investigate the potential impact of the TyG index on the future development of prediabetes in young individuals.
Methods: This retrospective cohort study included 125,327 healthy adults aged 20 to 45 years. We utilized Cox proportional hazards regression models, combined with cubic spline functions and smooth curve fitting, to assess the relationship between baseline TyG index and the risk of prediabetes among young adults, exploring its non-linear association. A series of sensitivity analyses and subgroup analyses were conducted to ensure the robustness of our findings.
Results: After adjusting for covariates, the study found a positive correlation between the TyG index and the risk of prediabetes (HR=1.81, 95%CI: 1.54–2.13, p<0.0001). The risk of prediabetes increased progressively across quartiles of the TyG index (Q1 to Q4), with Q4 showing a significantly higher risk compared to Q1 (adjusted HR=2.33, 95% CI=1.72–3.16). Moreover, a non-linear relationship was identified between the TyG index and the risk of prediabetes, with an inflection point at 9.39. To the left of the inflection point, the HR was 2.04 (95% CI: 1.69 to 2.46), while to the right, the HR was 0.89 (95% CI: 0.48 to 1.65).
Conclusion: Our study reveals a non-linear relationship and a saturation effect between the TyG index and the development of prediabetes among young individuals in China, with an inflection point at 9.39. Understanding this non-linear relationship can assist clinicians in identifying young individuals at high risk and implementing targeted interventions to reduce their risk of progressing to diabetes.
Introduction
Prediabetes is characterized by elevated blood glucose levels below the diagnostic threshold for diabetes but is associated with a higher risk of developing diabetes (1). The standardized prevalence of prediabetes in Chinese adults was 35.2% (33.5% to 37.0%) (2). Approximately 70% of prediabetes patients will progress to diabetes within 10 years, and the incidence of diabetes exceeds 90% within 20 years (3). Prediabetes is also associated with a high burden of cardiometabolic risk factors and poor outcomes (4). In a large meta-analysis of prospective studies (53 studies, 1.6 million individuals, median follow-up duration 9.5 years) examining the risks of cardiovascular disease and death in persons with prediabetes compared with normal glycemia (5), prediabetes was associated with an increased risk of cardiovascular disease and all-cause mortality. Several cohort studies have shown that individuals with prediabetes have a higher all-cause mortality rate compared to those with normal glycemia (6–12). Similarly, individuals with prediabetes have a high risk of hospitalization (11). Age is a significant risk factor for prediabetes, with evidence showing a strong association between the increase in prediabetes and age. In a 2011–2012 National Health and Nutrition Examination Survey (NHANES) analysis, in adults, the prevalence of prediabetes was 38.0%, while among young individuals aged 20–44 years, it reached up to 28.2% (13). Prediabetes is commonly considered a warning sign; nevertheless, many prediabetic patients, particularly younger individuals, tend to neglect this metabolic abnormality and underestimate its importance.
The triglyceride-glucose (TyG) index is calculated as the product of fasting plasma glucose (FPG) levels and triglyceride (TG) (14). Due to its convenience and ease of calculation, the TyG index has been widely used in various clinical settings (15–20). Insulin resistance (IR) is a key factor in metabolic disorders such as metabolic syndrome, non-alcoholic fatty liver disease (NAFLD), diabetes, and obesity (21, 22). IR is a major contributor to the progression from normal glucose resistance to prediabetes and then to diabetes. The TyG index is considered a novel marker of IR that accurately and reliably reflects the extent of IR (23, 24). Evidence suggests an association between the TyG index and the prevalence of prediabetes in middle-aged and older adults, but it is unclear whether this association exists in young adults (25).
Due to economic growth, lifestyle, and diet changes, diabetes rates are rising, with younger people increasingly affected. Young diabetics may show unusual symptoms and be overlooked, making early risk identification and intervention critical (26, 27). This study used existing data to examine the TyG index and prediabetes risk in individuals aged 20–45, aiming to support its clinical use for early prediabetes detection.
Methods
Study design
This study utilized data from a previous retrospective cohort study conducted by Chinese researchers (Chen et al.) (28). The target independent variable was the TyG at baseline. The outcome variable was the development from normoglycemia to prediabetes at follow-up.
Data source
Access to the original dataset was granted at no cost through the DATADRYAD platform (www.datadryad.org), courtesy of Ying Chen et al. In accordance with Dryad’s usage policy, the data is available for academic and research purposes, allowing users to share, adapt, alter, and build upon the material, provided it is not for commercial use and proper attribution is given to the original authors and source. The dataset was sourced from a publicly accessible study published in 2018 titled “Association of body mass index and age with diabetes onset in Chinese adults: a population-based cohort study,” which can be found at http://dx.doi.org/10.1136/bmjopen-2018–021768. For those interested, the dataset can be retrieved from the following link: https://doi.org/10.5061/dryad.ft8750v (28). Given that the current study involves a secondary analysis of existing data, there was no need for obtaining informed consent or additional ethical approval.
Research population
The primary research included 685,277 healthy individuals aged 20 years and above, all of whom had undergone a minimum of two health assessments. The study focused on participants who, during follow-up, had FPG levels ranging from 110 to 125 mg/dL without any prior diagnosis of diabetes. The initial selection excluded participants based on several factors (1): lack of detailed information regarding weight, height, or gender (2); BMI values outside the normal range (<15 kg/m2 or >55 kg/m2) (3); intervals between visits shorter than 2 years (4); missing fasting plasma glucose readings (5); individuals diagnosed with diabetes at the start or with uncertain diabetes status at the time of follow-up. Following these criteria, the study retained 211,833 participants.
Further analysis led to the exclusion of an additional 86,506 participants for reasons including: 1) absence of follow-up FPG readings, 2) baseline FPG levels ≥100 mg/dL, 3) diabetes diagnosis at follow-up, 4) had no available TG value, and 5) lack of TG values or being over 45 years of age. Young people are defined as those aged 45 years old or younger (29). Ultimately, the study included 125,327 healthy participants. The process of selecting participants for this study is depicted in Figure 1.
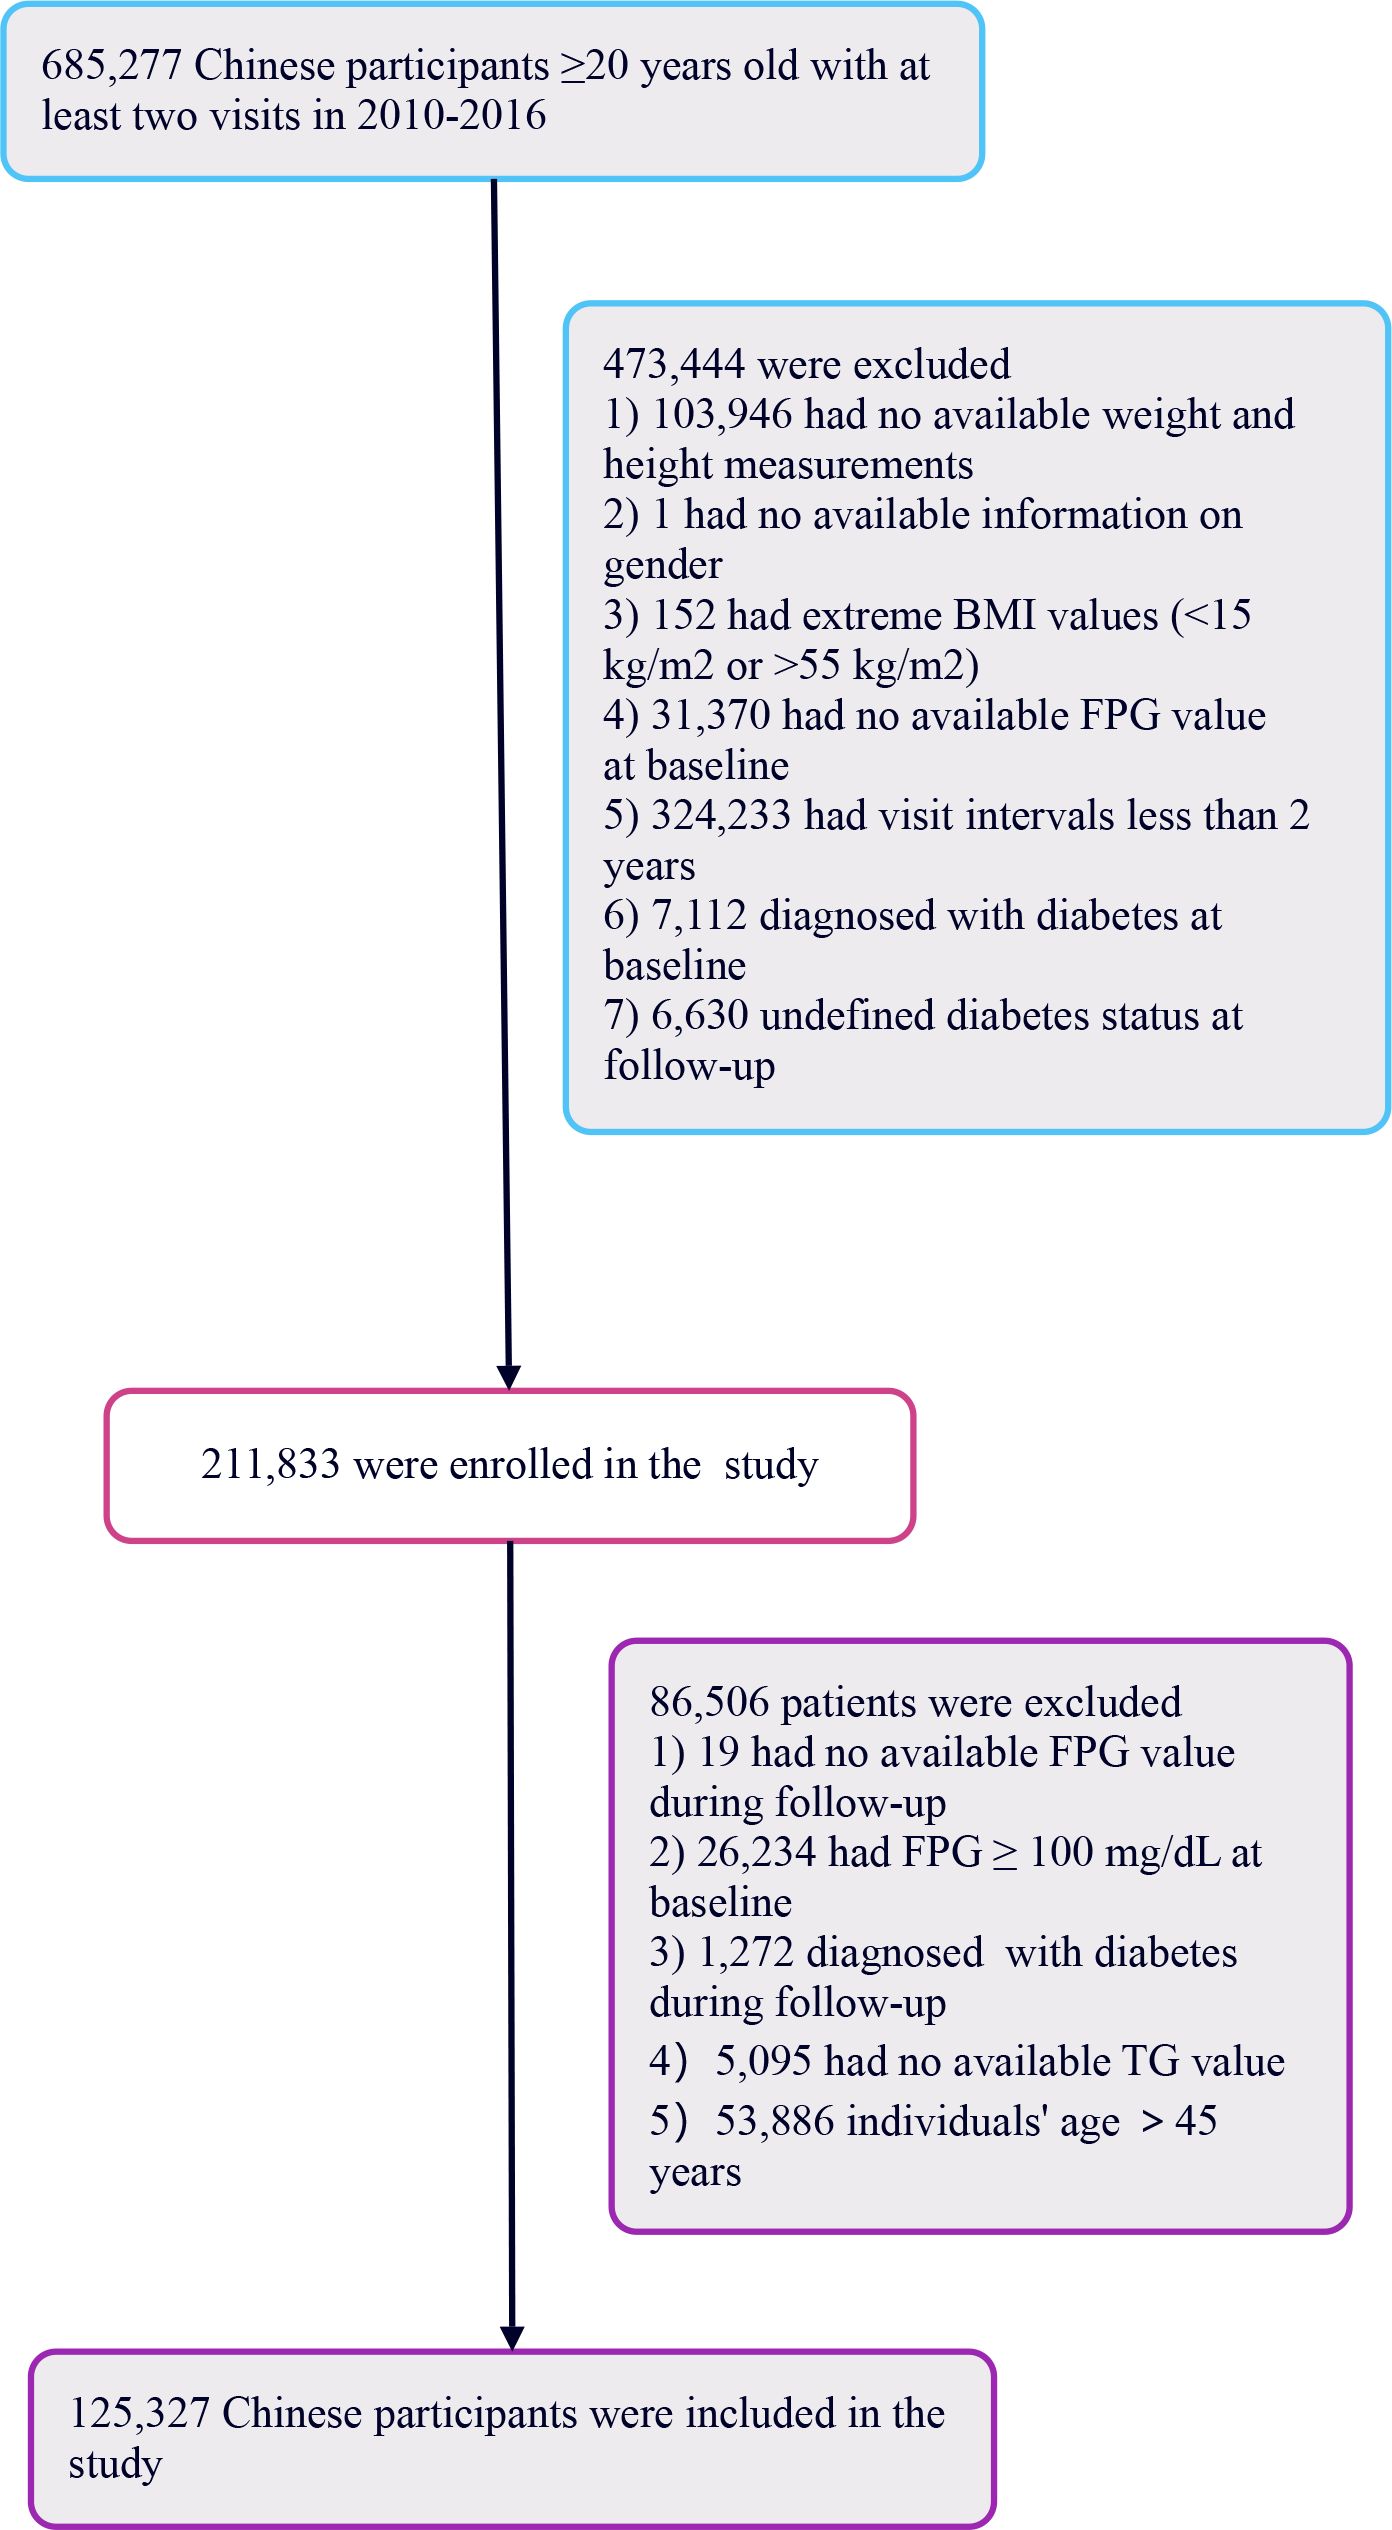
Figure 1. Flowchart illustrating the selection process of study participants.
Data collection
In this study, data collection included demographic information such as age, systolic blood pressure (SBP), diastolic blood pressure (DBP), height, and weight, from which body mass index (BMI) was calculated. To ensure consistency in data collection, staff received specialized training focusing on demographic data and key measurements, including blood pressure. Tests were uniformly conducted in a standardized laboratory environment for FPG, serum creatinine (Scr), TG, total cholesterol (TC), blood urea nitrogen (BUN), alanine aminotransferase (ALT), low-density lipoprotein cholesterol (LDL-c), and high-density lipoprotein cholesterol (HDL-c). Additionally, the study collected information on the patients’ smoking and drinking histories, defining current drinking as 1, former drinking as 2, never drinking as 3. Similarly, current smoking was coded as 1, former smoking as 2, never smoking as 3.
Outcome measures
Our primary outcome was the occurrence of prediabetes, defined by FPG levels in the range of 100–125 mg/dL at follow-up without reported incident diabetes (30).
Statistical analysis
The TyG index, the primary exposure variable in this study, is defined as follows: TyG index = ln [FPG (mg/dL) × TG (mg/dL)/2] (31). We divided it into four quartiles and considered it as a continuous variable. For continuous variables following a normal distribution, we reported the mean and standard deviation; for non-normally distributed data, we provided the median. For categorical variables, we presented the frequency and proportion. To compare differences between TyG index groups, we used the Kruskal-Wallis H test (for skewed distributed data), one-way analysis of variance (for normally distributed data), or chi-square test (for categorical variables).
We constructed several models to assess the relationship between the TyG index and prediabetes risk: a baseline model without any adjustments, a simplified model adjusting for gender and age only (Model I), and a comprehensive model adjusting for multiple covariates (Model II: including age, gender, BMI, systolic blood pressure, diastolic blood pressure, alanine aminotransferase, urea nitrogen, aspartate aminotransferase, total cholesterol, high-density lipoprotein cholesterol, low-density lipoprotein cholesterol, serum creatinine, family history of diabetes, alcohol consumption, and smoking status). We recorded the effect size (hazard ratio, HR) and its 95% confidence interval (CI) for each model.
We adjusted for potential confounding factors based on clinical experience, literature review, and univariate analysis results. Additionally, we used a multivariable Cox proportional hazards model and introduced cubic spline functions and smooth curve fitting to explore the possible nonlinear relationship between the TyG index and prediabetes risk. We also used a segmented Cox proportional hazards model to further clarify this nonlinear relationship. Unmeasured confounding between TyG and Prediabetes risk was assessed by calculating E-values.
To validate our findings, we conducted a series of sensitivity analyses. By incorporating continuous variables into a generalized additive model (GAM) in curve form, we further confirmed the robustness of the results. Additionally, we conducted analyses using stratified Cox proportional hazards models in different subgroups (such as age, gender, blood pressure, smoking, and drinking status). Finally, we used likelihood ratio tests to examine whether there were interactions in the model, both in models including interaction terms and those without. All analyses were performed using Empower Stats (X&Y Solutions, Inc., Boston, MA, http://www.empowerstats.com), with a statistical significance level set at a two-sided P value less than 0.05.
Result
The characteristics of participants
We conducted a comprehensive analysis of the baseline characteristics of participants to investigate the relationship between the TyG index and the risk of prediabetes. The results are summarized in Table 1, demonstrating significant differences between normal and prediabetes groups across various parameters. The median follow-up duration of our study was 3.00 years, ranging from 2.00 to 6.20 years. The prediabetes group exhibited a slightly higher mean age (35.70 years) compared to the normal group (34.31 years), along with increased height, weight, and BMI. SBP and DBP were also notably elevated in the prediabetes group. The prediabetes group displayed higher levels of FPG, TG, and the TyG index, indicating a potential link between these parameters and the development of prediabetes. Additionally, AST, ALT, BUN, and Scr levels were higher in the prediabetes group. In addition, higher percentage of males, current smokers, and current drinkers were observed in the prediabetes group, along with a greater prevalence of family history of diabetes. Furthermore, the average follow-up duration was slightly longer in the prediabetes group compared to the normal group. As illustrated in Figure 2, a detailed Distribution of TyG index was conducted. It presented a normal distribution, ranging from 4.65 to 11.78, with a mean of 8.23.

Table 1. The baseline characteristics of participants.
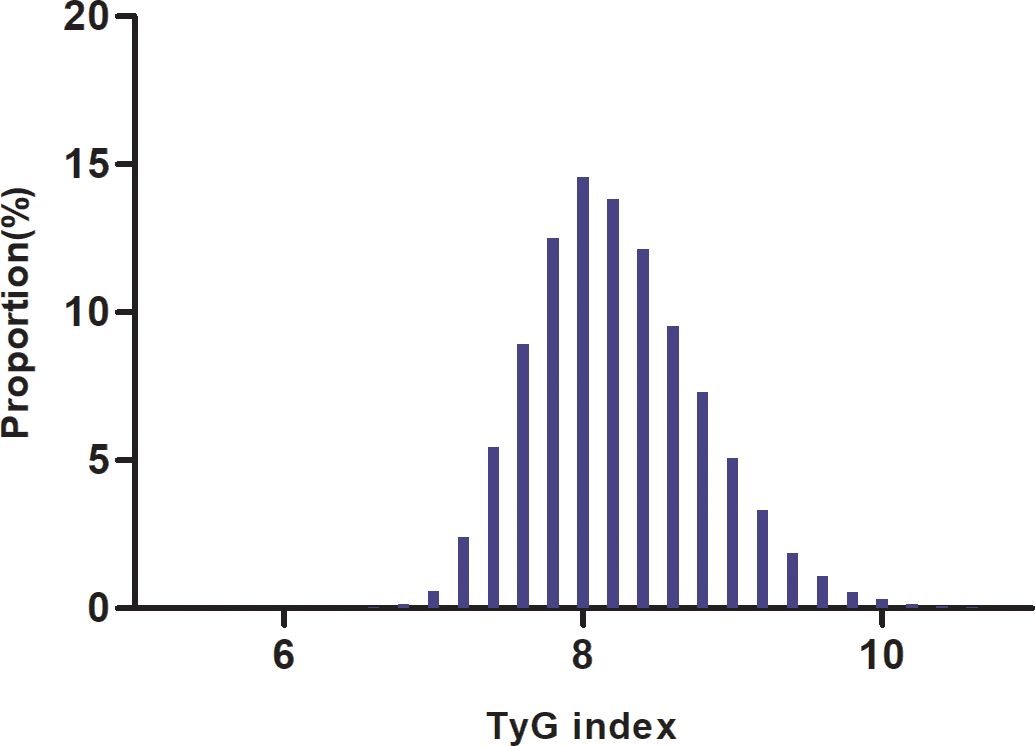
Figure 2. Distribution of TyG index. It presented a normal distribution, ranging from4.65 to 11.78, with a mean of 8.23.
Incidence of prediabetes in participants
Table 2 and Figure 3 describe the incidence rates of prediabetes. Among the participants, 10,328 (8.24%) developed prediabetes. Participants were divided into subgroups based on the quartiles of the TyG index. The incidence rates of prediabetes per 1000 person-years were 14.426, 20.012, 27.066, and 44.490 for each TyG index quartile. The incidence rates of prediabetes in each TyG index quartile were as follows: Q1: 4.68%, Q2: 6.27%, Q3: 8.33%, and Q4: 13.69%. Participants with the highest TyG index (Q4) had a higher risk of developing prediabetes compared to those with the lowest TyG index (Q1) (trend p < 0.001).
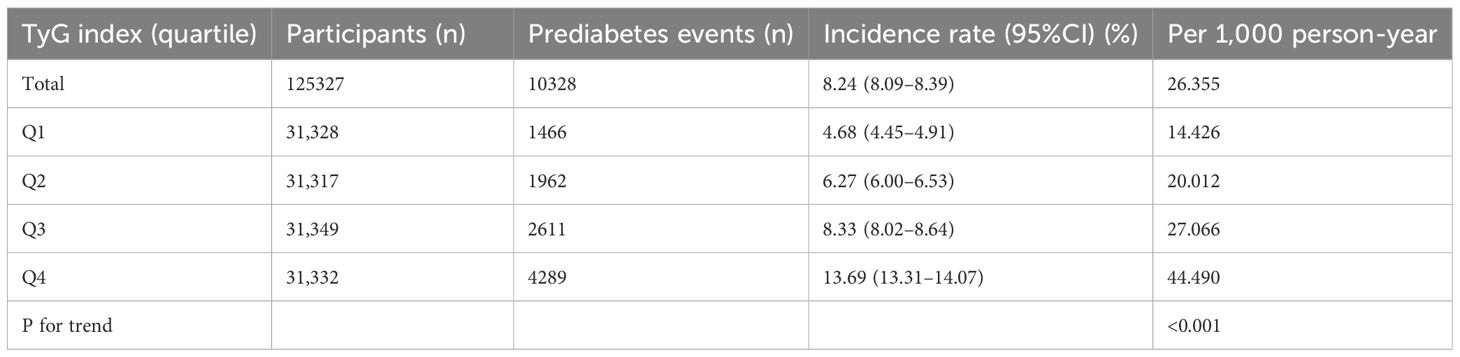
Table 2. The Incidence rate of prediabetes (% or Per 1,000 person-year).
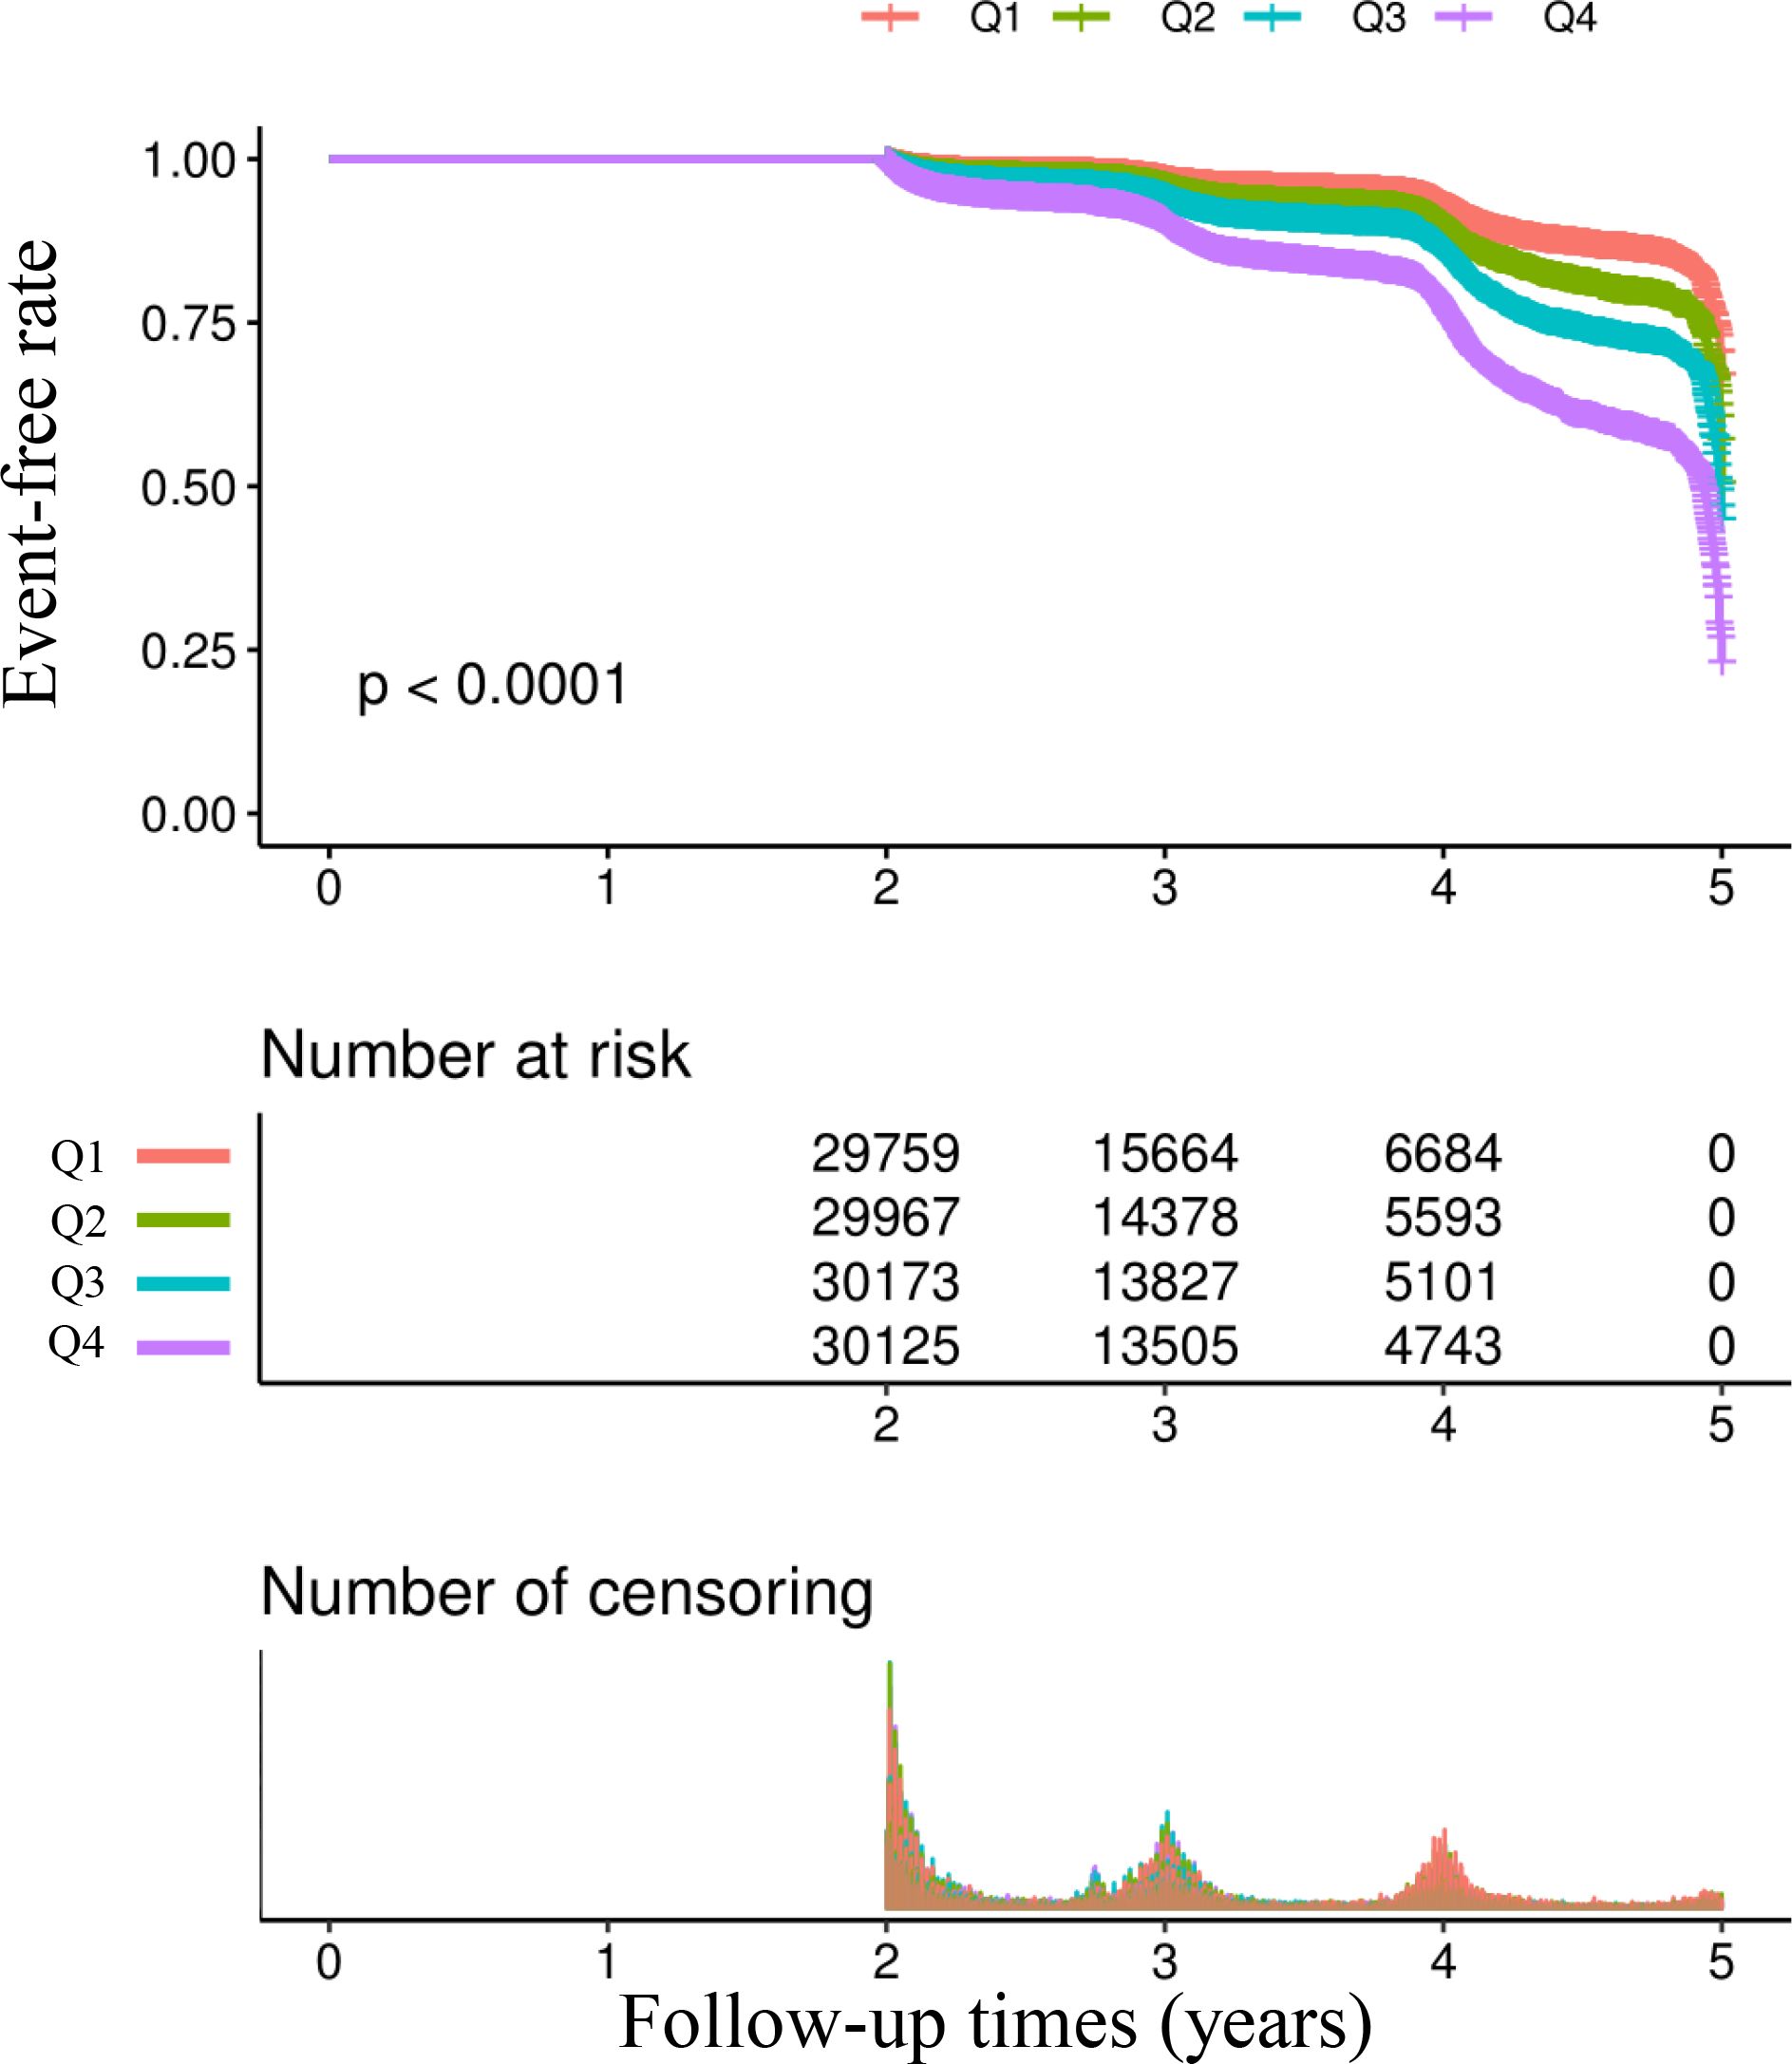
Figure 3. Kaplan–Meier event-free survival curve. Kaplan–Meier analysis of incident prediabetes based on two group (log-rank, P < 0.0001).
Multivariable analysis using Cox proportional hazards regression model
In Table 3, the relationship between the TyG index and the risk of prediabetes is presented across different models. The results are as follows: In the crude model, the HR for the TyG index was 2.17 (95%CI 2.11–2.24, P < 0.0001). After adjusting for age and sex (Model I), the HR decreased to 1.94 (95%CI 1.88–2.00, P < 0.0001). Further adjustments in Model II, which included age, sex, SBP, DBP, BMI, ALT, AST, BUN, Scr, TC, LDL-C, HDL-c, family history of diabetes, drinking status, and smoking status, resulted in an HR of 1.81 (95%CI 1.54–2.13, P < 0.0001).
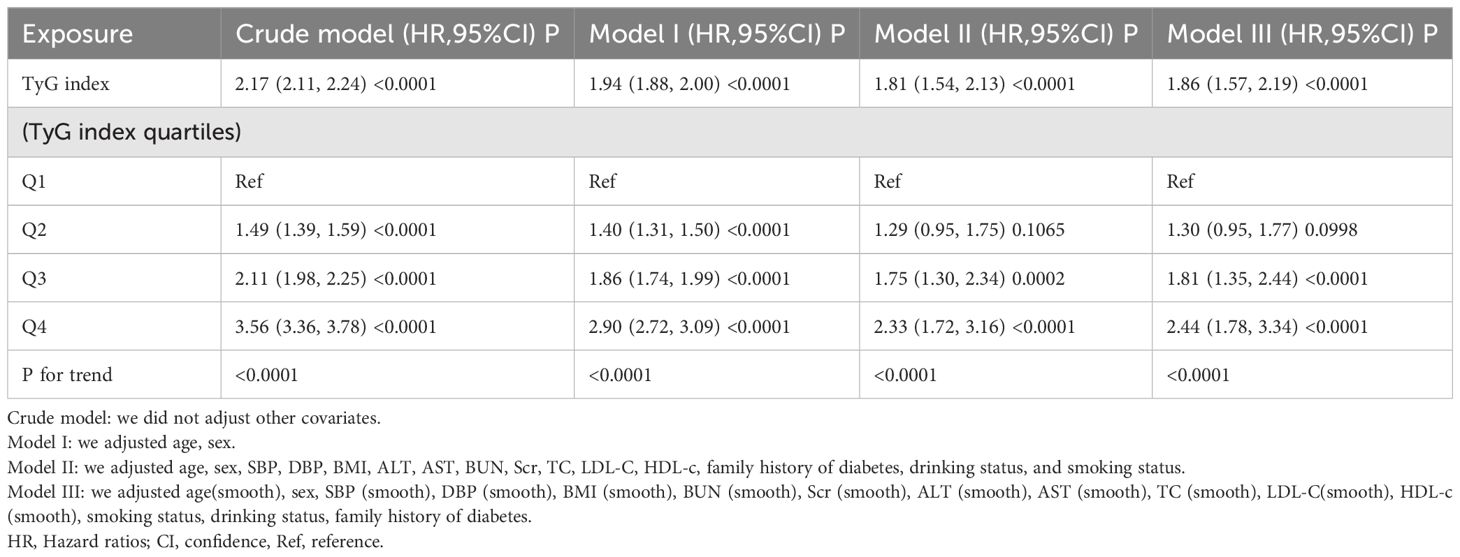
Table 3. Relationship between TyG index and risk of prediabetes in different models.
After adjustments, similar trends were observed across all quartiles, indicating a significant association between the TyG index quartiles and the risk of prediabetes (P for trend < 0.0001 for all models).
Sensitivity analysis
We performed a series of sensitivity analyses to confirm the reliability of our conclusions. Initially, the generalized additive model (GAM) in Model III, which included additional smooth terms for various variables, showed an HR of 1.86 (95%CI 1.57–2.19, P < 0.0001) (Table 3). Secondly, participants with a BMI ≥ 28 kg/m2 were excluded (32). After controlling for confounding variables, the results demonstrated a persistent positive association between the TyG index and the risk of prediabetes (HR= 1.82, 95% CI: 1.52–2.17, p < 0.0001). Furthermore, we performed a sensitivity analysis excluding patients aged ≥ 40 years. After adjusting for confounding variables, the results continued to demonstrate a positive association between the TyG index and the risk of prediabetes (HR = 1.99, 95% CI: 1.64–2.42, p < 0.0001). Additionally, we conducted an analysis on participants without a family history of diabetes, revealing a risk ratio of 1.83 (95% confidence interval: 1.54–2.16, p < 0.0001). Based on all sensitivity analyses, we concluded that our findings are reliable (Table 4).
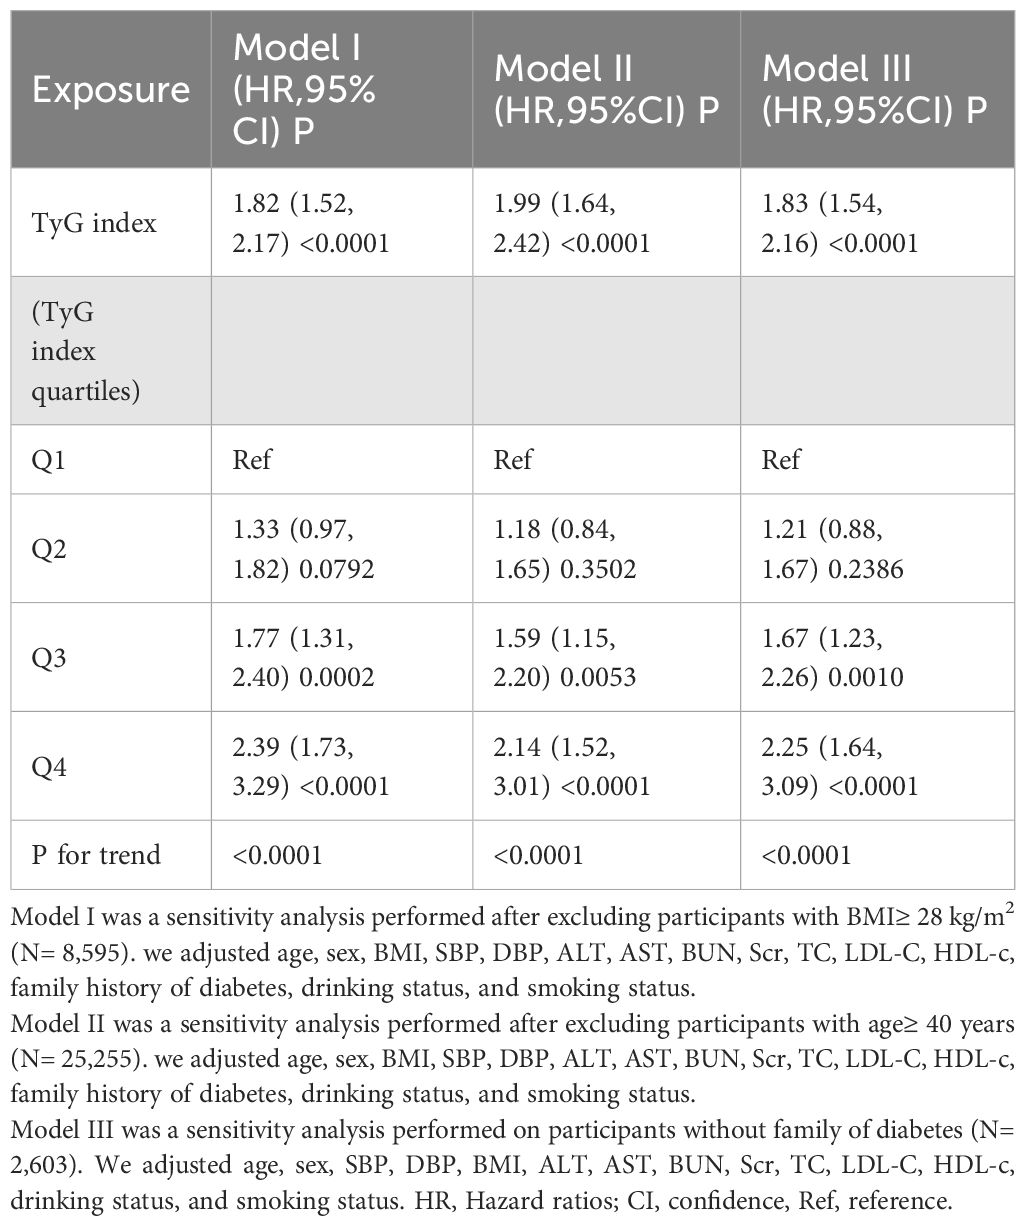
Table 4. Relationship between TyG index and the risk of prediabetes in different sensitivity analyses.
Results of the two-piece Cox proportional hazards regression model
We identified a non-linear relationship between the TyG index and the risk of prediabetes (Figure 4 and Table 5). Firstly, we used a Cox proportional hazards regression model with cubic spline functions to evaluate the relationship between the TyG index and prediabetes risk. The result showed that the relationship between the TyG index and prediabetes risk was non-linear. We employed a two-piecewise Cox proportional hazards regression model to investigate the relationship between the TyG index and the risk of developing prediabetes. The standard Cox regression model revealed a HR of 1.81 (95% CI: 1.54, 2.13) with a P value of <0.0001, indicating a significant association between the TyG index and prediabetes risk. In addition, we identified an inflection point in the TyG index at 9.39. Below this inflection point (<9.39), there is a significant positive correlation between the TyG index and the risk of prediabetes (HR: 2.04, 95% CI: 1.69, 2.46, P <0.0001). Conversely, Conversely, when the TyG index is 9.39 or higher, their relationship is not statistically significant (HR: 0.89, 95% CI: 0.48, 1.65, P=0.7019).
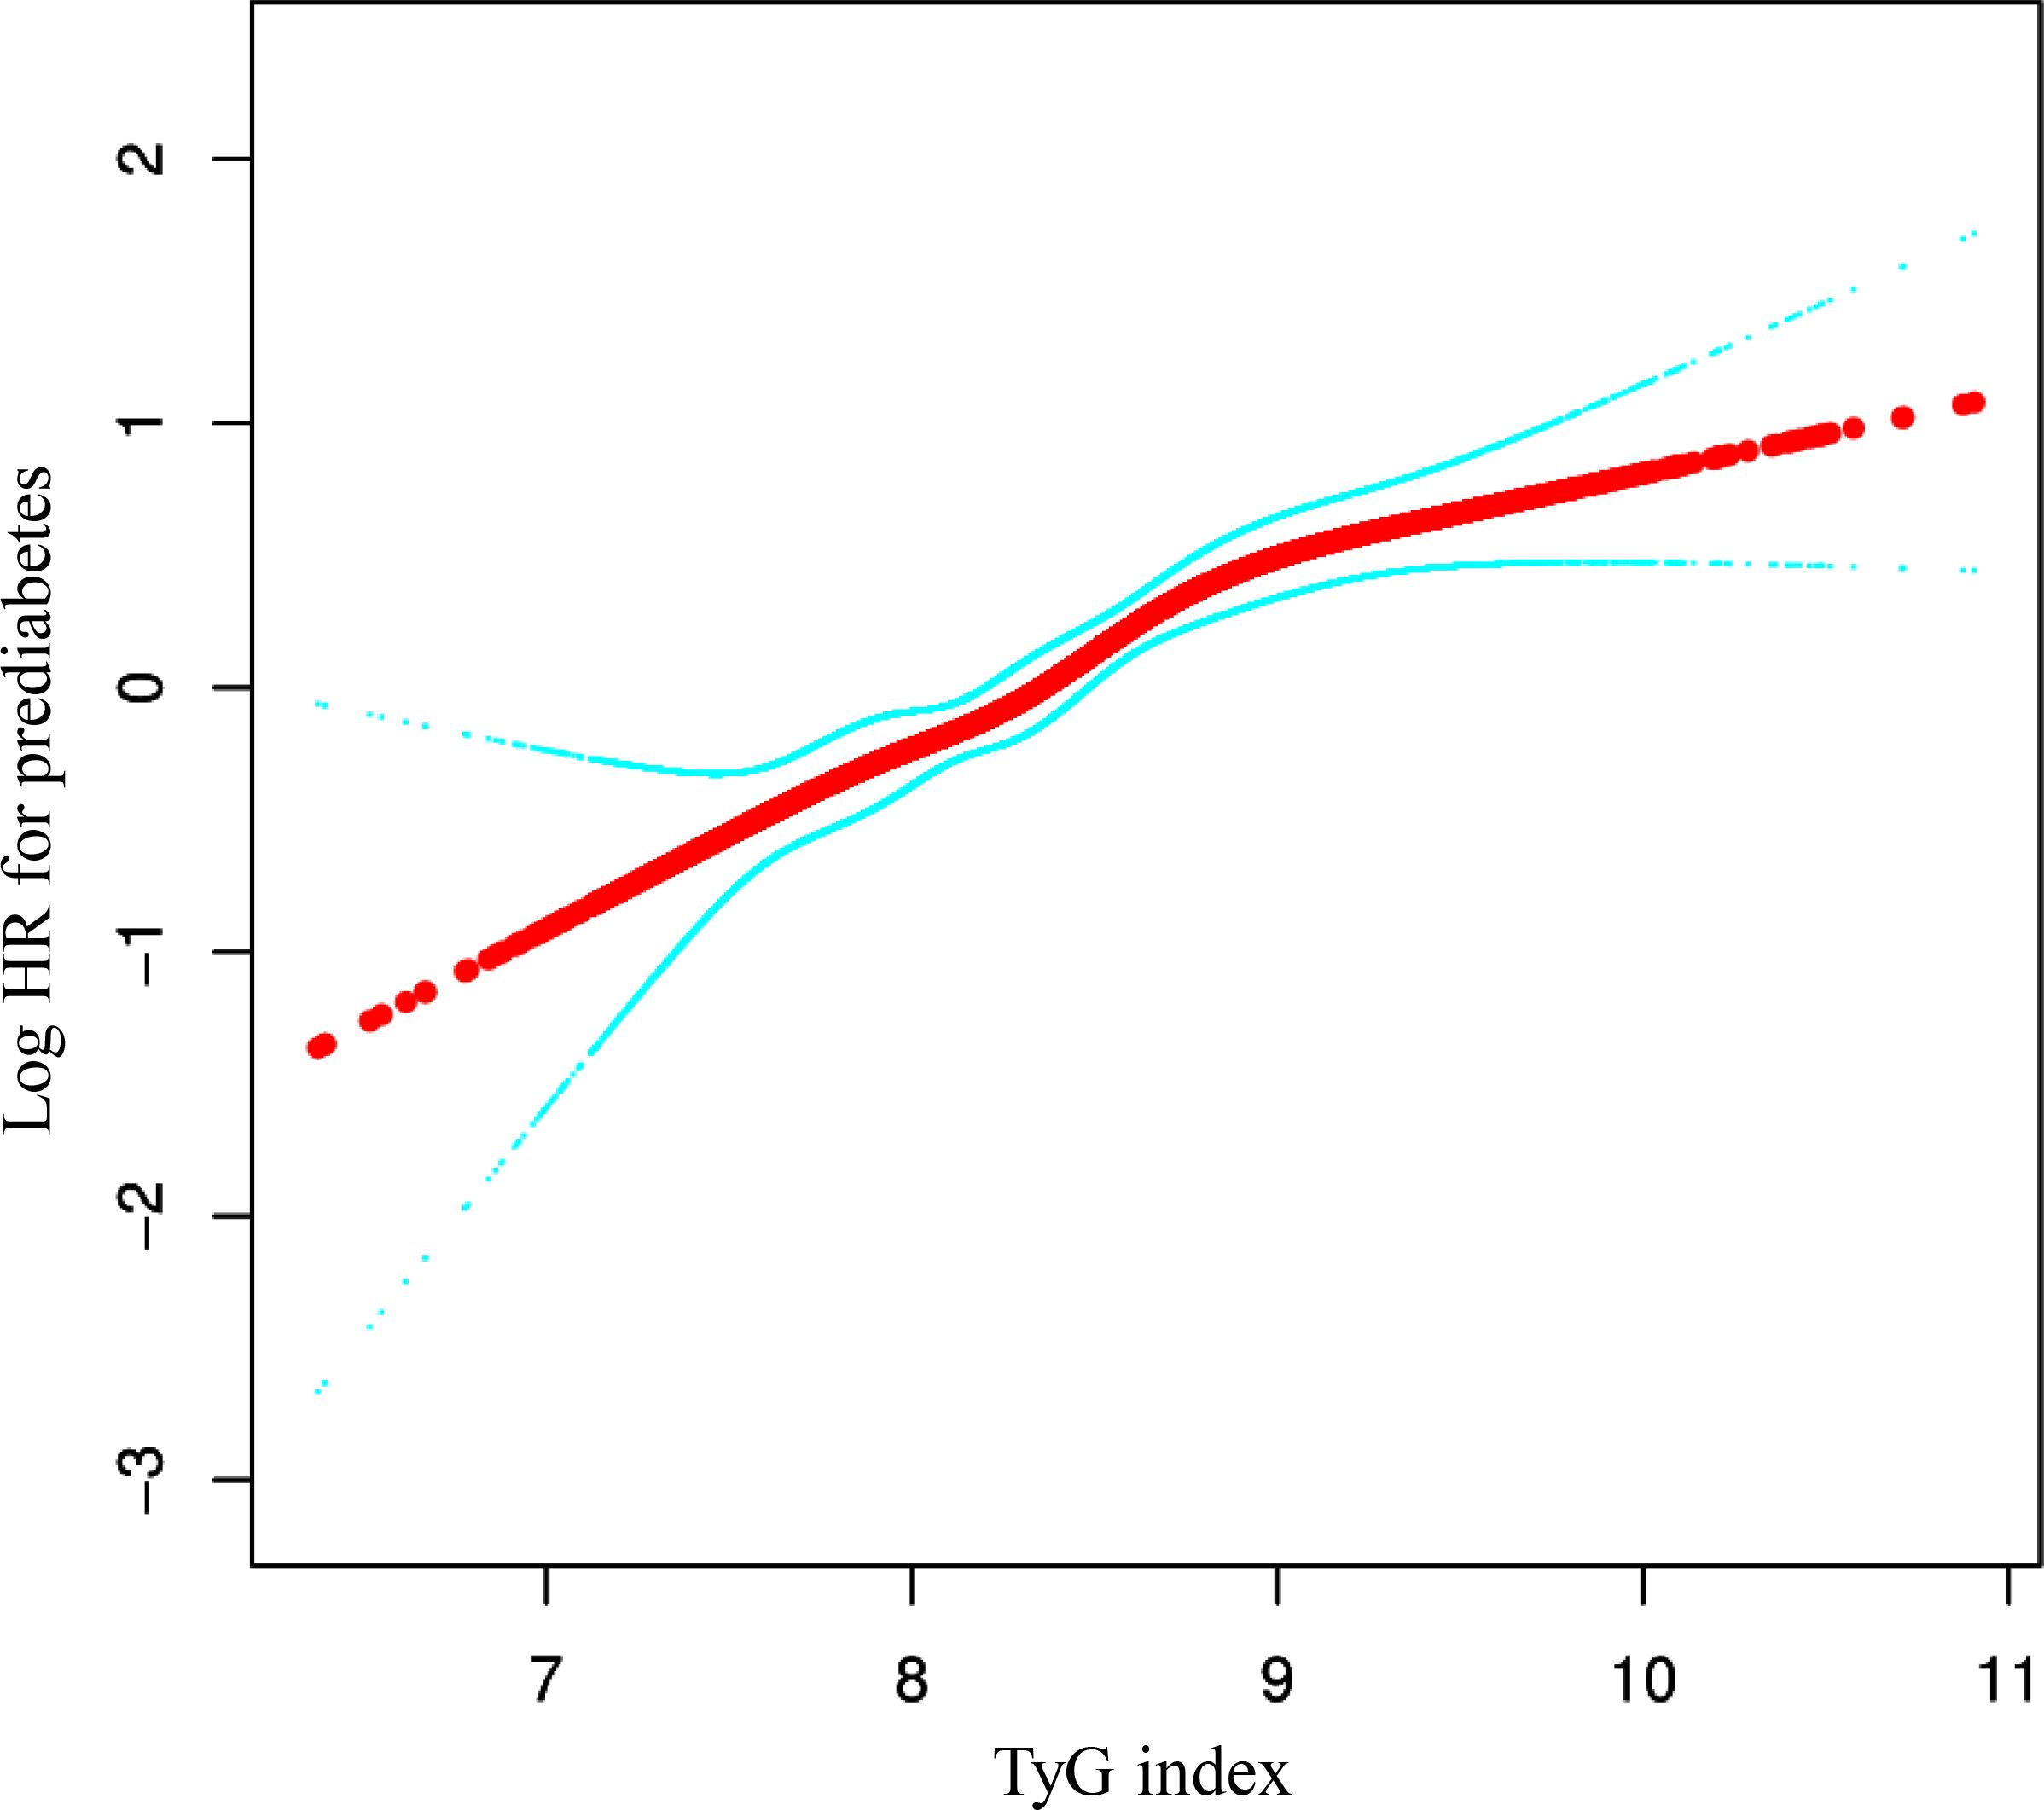
Figure 4. The non-linear relationship between TyG index and the risk of prediabetes in participants. We used a Cox proportional hazards regression model with cubic spline functions to evaluate the relationship between the TyG index and prediabetes risk. We adjusted age, sex, SBP, DBP, BMI, ALT, AST, BUN, Scr, TC, LDL-C, HDL-c, family history of diabetes, drinking status, and smoking status. The result showed that the relationship between the TyG index and prediabetes risk was non-linear, with the inflection point of TyG index being 9.39.
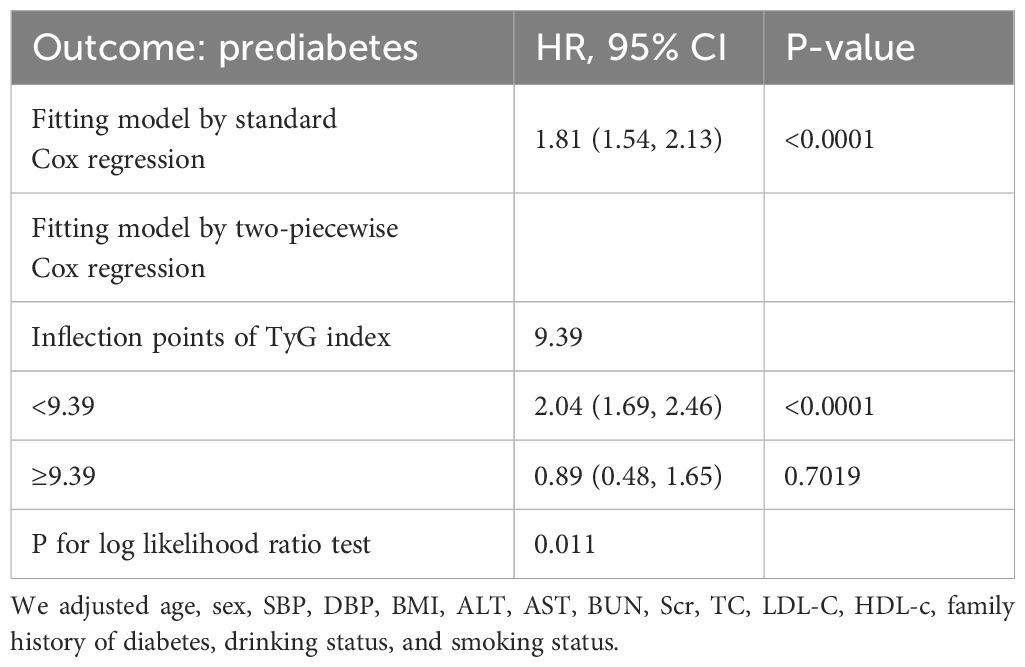
Table 5. The result of the two-piecewise Cox proportional hazards regression model.
Subgroup analysis results
As illustrated in Table 6, a detailed subgroup analysis was conducted. Gender, age, BMI, systolic and diastolic blood pressures, smoking and drinking habits, and a family history of diabetes did not alter the association between the TyG index and the risk of prediabetes. Thus, no significant interactions were observed between these variables and the TyG index (all interaction P > 0.05).
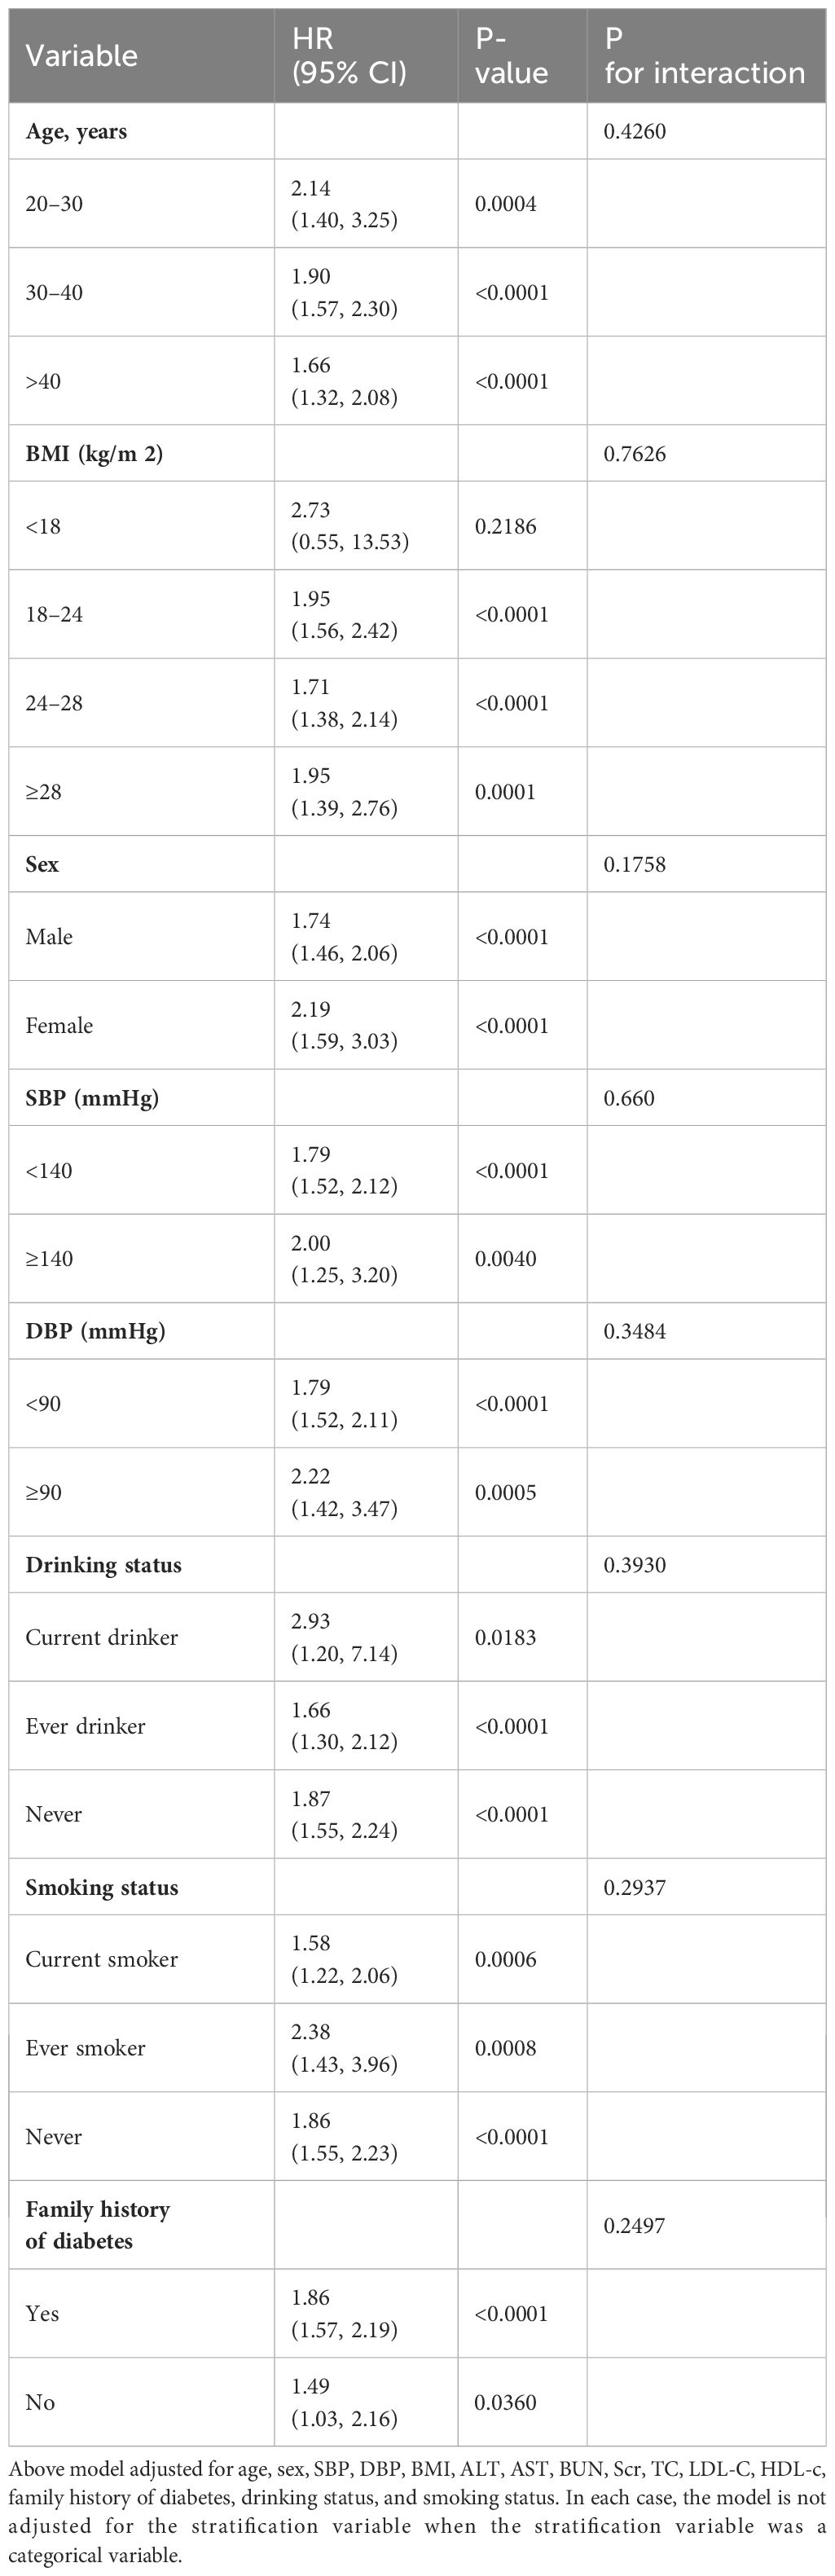
Table 6. Effect size of TyG index on prediabetes in prespecified and exploratory subgroups.
Discussion
This retrospective cohort study revealed that a higher TyG index independently predicts an increased risk of prediabetes in Chinese adults aged 20–45. Furthermore, a nonlinear relationship was observed, indicating that the risk of prediabetes tends to rise with an increasing TyG index. Individuals in the highest TyG index quartile had a 2.33-fold increased risk of developing prediabetes compared to those in the lowest quartile. Additionally, a threshold effect curve was identified, revealing varying relationships between the TyG index and prediabetes risk across the inflection point.
Initially, the TyG index has been widely validated as an indicator of IR in various epidemiological studies. A cross-sectional study conducted in Mexico involving 99 individuals identified the TyG index as an optimal tool for assessing IR, showing a high sensitivity (96.5%) and good specificity (85.0%) compared to the gold standard, HIEC (23). Research involving 82 Brazilian subjects corroborated the TyG index as a more precise predictor of IR compared to HOMA-IR (33). Numerous studies have indicated an association between the TyG index and cardiovascular disease (CVD) risk (34–37). A study involving 4,340 American patients under the age of 65 with prediabetes or diabetes found that an increase in the TyG index is associated with a higher incidence of CVD, including congestive heart failure (CHF), coronary heart disease (CHD), atherosclerotic cardiovascular disease (ASCVD), heart attack, angina, and stroke (34). Additionally, several studies have found a close relationship between the TyG index and coronary artery disease (35–37). Furthermore, recent studies have identified a significant correlation between the TyG index and both cognitive and physical impairments in elderly individuals with prefrail hypertension (38).
Recently, there has been a growing body of research exploring the relationship between the TyG index and the risk of diabetes (39–42). A prospective cohort study conducted in rural China suggests that an increasing TyG index is associated with a higher cumulative risk of developing incident T2DM among individuals with normal weight (43). Another retrospective cohort study demonstrated a link between elevated TyG index levels and an augmented risk of diabetes within the Chinese population (44). Additionally, recent studies have indicated that there is a positive correlation between the TyG index and the risk of diabetes (45). It is noteworthy that prediabetes is a critical period for promoting, preventing, or delaying the development of diabetes mellitus (DM).
But research on the TyG index’s association with prediabetes is limited. An initial study demonstrated that the TyG index is comparable to HbA1C as a diagnostic marker for prediabetes (46). Findings from a case-control study conducted in Palembang, Indonesia, involving 570 participants without a family history of T2DM (265 prediabetes cases and an equal number of age-matched controls), indicated that the TyG index was the primary risk predictor for prediabetes (47). A prospective cohort study in China indicated that the predictive capacity of the TyG index in forecasting prediabetes surpassed that of obesity, lipid profiles, and other non-insulin-based IR indices (48). A cross-sectional study conducted in the United States, involving 25,159 participants, found that 23.88% had prediabetes and 16.22% were diagnosed with diabetes. The study revealed a positive relationship between the TyG index and the prevalence of prediabetes and diabetes (49). Interestingly, a cohort study conducted in China indicated that, among prediabetic patients, an elevated TyG-BMI might reduce the likelihood of returning to normal glucose levels in the future (50). However, no specific studies have investigated the association between TyG index and prediabetes in a young population.
Therefore, we hypothesize that the TyG index is positively correlated with the risk of prediabetes in young populations. Therefore, our study investigates the TyG index’s role in identifying prediabetes risk factors among young individuals, aiming to enhance prevention strategies for diabetes onset and progression within this demographic. Initially, our findings indicate the TyG index as a reliable predictor of prediabetes and an independent risk factor, consistent with existing research [45–46]. Furthermore, our study has shown a positive correlation between the TyG index and prediabetes, consistent with our research hypothesis. That is for every 1-unit increase in the TyG index, the risk of prediabetes will increase by 81% (HR: 1.81, 95% CI 1.54–2.13, P < 0.0001). Similarly, a cohort study conducted in China also identified a positive correlation between TyG and the risk of prediabetes after adjusting for variables (48). However, there are significant differences between the two studies in terms of subjects, outcomes, and adjusted variables. Their study sample is relatively small compared to ours. They also adjusted for different variables, such as age, cigarette smoking, alcohol consumption, education level, family history of diabetes, hypertension, and cardiovascular disease history, which differs slightly from our study. Additionally, they did not use the Cox proportional hazards regression model combined with cubic splines and smoothing curve fits to examine the nonlinear association between the TyG index and the risk of prediabetes. A study in the United States also found a nonlinear relationship between the TyG index and the prevalence of prediabetes and diabetes, identifying an inflection point at 8 (49), which is very similar to our conclusion but with some notable differences. Firstly, their study was cross-sectional, which has limitations such as a smaller sample size, unclear causality, and selection bias. Secondly, there are differences in the age distribution of the study populations between the two studies. Additionally, variations in the adjusted variables between the two studies may impact the research outcomes. Although both studies confirm a nonlinear relationship, we identified a critical threshold of 9.39. Our study focused on prediabetes as the outcome, while their study included both prediabetes and diabetes, which could be the primary reason for the earlier inflection point in their findings.
Our study has significant clinical implications. We have identified a non-linear relationship with a saturation effect between the TyG index and the risk of prediabetes in young individuals. Monitoring TyG index values can facilitate early interventions in young individuals to decrease the occurrence of prediabetes. Specifically, when the TyG index is below 9.39, by lowering FBG and TG, we can significantly reduce the risk of prediabetes. However, when the TyG index exceeds 9.39, merely controlling FBG and TG is insufficient to reduce the risk of prediabetes. Thus, it is necessary to manage other related risk factors such as BMI, smoking, and alcohol consumption to better prevent the onset of the disease. Consequently, it is advisable for young people to start making lifestyle changes early, including reducing the intake of high-fat foods, increasing physical activity, and controlling blood sugar levels. These measures can effectively help reduce the risk of developing prediabetes.
This study has some advantages. Firstly, we first identified a nonlinear relationship between the TyG index and prediabetes risk in young individuals. Furthermore, this study included a large sample of 125,327 young adults, minimizing potential biases. Sensitivity analysis was conducted to ensure the reliability and robustness of the results, and a two-stage Cox proportional hazards regression model was applied to determine the inflection point of the TyG index. These findings underscore the critical threshold between the TyG index and diabetes risk, emphasizing the importance of TyG index monitoring and early intervention strategies in diabetes prevention efforts. Additionally, subgroup analysis and interaction tests were performed. The results revealed variations in the impact of the TyG index on prediabetes risk across different subgroups, yet interaction analysis did not indicate significant interactions between the TyG index and factors such as drinking status, smoking status, or family history of diabetes. This further validates the stability of the results.
This study has several limitations. Firstly, as all participants were of Chinese descent, further research is needed to determine the relationship between the TyG index and the risk of prediabetes in individuals with different genetic backgrounds. Secondly, since this large-scale cohort study only focused on young adults in China, these findings may not be applicable to other racial groups and specific populations, such as children and the elderly. Thirdly, the average follow-up time for participants was relatively short. Future research could benefit from extending follow-up duration to mitigate potential misinterpretations or chance findings from short-term observations. Fourthly, there was no data available on serum insulin levels to compare the predictive value of the TyG index and HOMA-IR; additionally, there was also no data on the use of lipid-lowering medications, which could potentially impact the results. Fively, this report represents a secondary analysis of existing databases. Although adjustments were made for many confounding factors, variables not included in the database were not adjusted for. However, we calculated the E value to quantify the potential impact of unmeasured confounders and found that unmeasured confounders were unlikely to explain the results. sixly, The current diagnostic criteria for prediabetes have some limitations, primarily relying on impaired fasting glucose and not considering oral glucose tolerance tests, glycated hemoglobin, and multiple fasting glucose measurements. This single-index approach may lead to underdiagnosis of prediabetes. Therefore, future studies evaluating the incidence of prediabetes should consider measuring additional variables, including oral glucose tolerance tests, glycated hemoglobin, and multiple fasting glucose measurements, to improve diagnostic accuracy and comprehensiveness. Additionally, this retrospective observational study provides an associative inference rather than establishing a causal relationship between the TyG index and the risk of prediabetes. Lastly, this study only measured the TyG index and other parameters at baseline and did not consider changes in the TyG index over time. Therefore, in the future, we should collect as much information as possible, including information on changes in the TyG index.
Conclusion
This study reveals a nonlinear relationship and a saturation effect between the TyG index and the risk of prediabetes among individuals aged 20 to 45 in China. There is a significant positive correlation between the TyG index and the risk of prediabetes to the left of the inflection point at a TyG index of 9.39. Reducing FBG and TG levels can significantly decrease the risk of prediabetes. Conversely, when the TyG index reaches or exceeds 9.39, its relationship with the risk of prediabetes is no longer statistically significant; merely lowering the TyG index is not enough to reduce the risk of prediabetes. It is also necessary to comprehensively control other factors such as BMI, smoking, and alcohol consumption. Understanding this non-linear relationship can help clinicians identify high-risk young individuals and implement focused interventions to reduce the risk of developing diabetes.
Data availability statement
Publicly available datasets were analyzed in this study. This data can be found here: https://bmjopen.bmj.com/content/8/9/e021768.
Ethics statement
The studies involving humans were approved by The Rich Healthcare Group Review Board. The ethics committee waived the need for written informed consent. The studies were conducted in accordance with the local legislation and institutional requirements. Written informed consent for participation in this study was provided by the participants’ legal guardians/next of kin.
Author contributions
JX: Data curation, Writing – original draft, Writing – review & editing. LZ: Formal analysis, Writing – original draft, Writing – review & editing. CL: Data curation, Formal analysis, Writing – review & editing. YH: Formal analysis, Writing – review & editing. ZH: Formal analysis, Writing – original draft, Writing – review & editing.
Funding
The author(s) declare financial support was received for the research, authorship, and/or publication of this article. The Guangdong Provincial Medical Science and Technology Research Fund project (NO: A2024429).
Conflict of interest
The authors declare that the research was conducted in the absence of any commercial or financial relationships that could be construed as a potential conflict of interest.
Publisher’s note
All claims expressed in this article are solely those of the authors and do not necessarily represent those of their affiliated organizations, or those of the publisher, the editors and the reviewers. Any product that may be evaluated in this article, or claim that may be made by its manufacturer, is not guaranteed or endorsed by the publisher.
References
1. Rooney MR, Fang M, Ogurtsova K, Ozkan B, Echouffo-Tcheugui JB, Boyko EJ, et al. Global prevalence of prediabetes. Diabetes Care. (2023) 46:1388–94. doi: 10.2337/dc22-2376
2. Li Y, Teng D, Shi X, Qin G, Qin Y, Quan H, et al. Prevalence of diabetes recorded in mainland China using 2018 diagnostic criteria from the American Diabetes Association: national cross sectional study. BMJ. (2020) 369:m997. doi: 10.1136/bmj.m997
3. Rooney MR, Rawlings AM, Pankow JS, Echouffo Tcheugui JB, Coresh J, Sharrett AR, et al. Risk of progression to diabetes among older adults with prediabetes. JAMA Intern Med. (2021) 181:511–9. doi: 10.1001/jamainternmed.2020.8774
4. American Diabetes Association Professional Practice Committee, ElSayed NA, Aleppo G, Bannuru RR, Bruemmer D, Collins BS, et al. Prevention or delay of diabetes and associated comorbidities: standards of care in diabetes—2024. Diabetes Care. (2024) 47:S43–51. doi: 10.2337/dc24-S003
5. Huang Y, Cai X, Mai W, Li M, Hu Y. Association between prediabetes and risk of cardiovascular disease and all cause mortality: systematic review and meta-analysis. BMJ. (2016) 355:i5953. doi: 10.1136/bmj.i5953. England.
6. Barr ELM, Boyko EJ, Zimmet PZ, Wolfe R, Tonkin AM, Shaw JE. Continuous relationships between non-diabetic hyperglycaemia and both cardiovascular disease and all-cause mortality: the Australian Diabetes, Obesity, and Lifestyle (AusDiab) study. Diabetologia. (2009) 52:415–24. doi: 10.1007/s00125-008-1246-y
7. Barr ELM, Zimmet PZ, Welborn TA, Jolley D, Magliano DJ, Dunstan DW, et al. Risk of cardiovascular and all-cause mortality in individuals with diabetes mellitus, impaired fasting glucose, and impaired glucose tolerance: the Australian Diabetes, Obesity, and Lifestyle Study (AusDiab). Circulation. (2007) 116:151–7. doi: 10.1161/CIRCULATIONAHA.106.685628
8. Wen CP, Cheng TYD, Tsai SP, Hsu HL, Wang SL. Increased mortality risks of pre-diabetes (impaired fasting glucose) in Taiwan. Diabetes Care. (2005) 28:2756–61. doi: 10.2337/diacare.28.11.2756
9. The DECODE study group on behalf of the Europe an Diabetes Epidemiology Group. Glucose tolerance and mortality: comparison of WHO and American Diabetes Association diagnostic criteria. The DECODE study group. European Diabetes Epidemiology Group. Diabetes Epidemiology: Collaborative analysis Of Diagnostic criteria in Europe. Lancet. (1999) 354:617–21. doi: 10.1016/S0140-6736(98)12131-1
10. Nakagami T, DECODA Study Group. Hyperglycaemia and mortality from all causes and from cardiovascular disease in five populations of Asian origin. Diabetologia. (2004) 47:385–94. doi: 10.1007/s00125-004-1334-6
11. Saydah SH, Loria CM, Eberhardt MS, Brancati FL. Subclinical states of glucose intolerance and risk of death in the U.S. Diabetes Care. (2001) 24:447–53. doi: 10.2337/diacare.24.3.447
12. Sorkin JD, Muller DC, Fleg JL, Andres R. The relation of fasting and 2-h postchallenge plasma glucose concentrations to mortality: data from the Baltimore Longitudinal Study of Aging with a critical review of the literature. Diabetes Care. (2005) 28:2626–32. doi: 10.2337/diacare.28.11.2626
13. Menke A, Casagrande S, Geiss L, Cowie CC. Prevalence of and trends in diabetes among adults in the United States, 1988–2012. JAMA. (2015) 314:1021–9. doi: 10.1001/jama.2015.10029
14. Simental-Mendía LE, Rodríguez-Morán M, Guerrero-Romero F. The product of fasting glucose and triglycerides as surrogate for identifying insulin resistance in apparently healthy subjects. Metab Syndr Relat Disord. (2008) 6:299–304. doi: 10.1089/met.2008.0034
15. Yang Y, Huang X, Wang Y, Leng L, Xu J, Feng L, et al. The impact of triglyceride-glucose index on ischemic stroke: a systematic review and meta-analysis. Cardiovasc Diabetol. (2023) 22:2. doi: 10.1186/s12933-022-01732-0
16. Xu A-R, Jin Q, Shen Z, Zhang J, Fu Q. Association between the risk of hypertension and triglyceride glucose index in Chinese regions: a systematic review and dose-response meta-analysis of a regional update. Front Cardiovasc Med. (2023) 10:1242035. doi: 10.3389/fcvm.2023.1242035
17. Yan F, Yan S, Wang J, Cui Y, Chen F, Fang F, et al. Association between triglyceride glucose index and risk of cerebrovascular disease: systematic review and meta-analysis. Cardiovasc Diabetol. (2022) 21:226. doi: 10.1186/s12933-022-01664-9
18. Wang J, Yan S, Cui Y, Chen F, Piao M, Cui W. The diagnostic and prognostic value of the triglyceride-glucose index in metabolic dysfunction-associated fatty liver disease (MAFLD): A systematic review and meta-analysis. Nutrients. (2022) 14:4969. doi: 10.3390/nu14234969
19. Tao L-C, Xu J-N, Wang T-T, Hua F, Li J-J. Triglyceride-glucose index as a marker in cardiovascular diseases: landscape and limitations. Cardiovasc Diabetol. (2022) 21:68. doi: 10.1186/s12933-022-01511-x
20. Tahapary DL, Pratisthita LB, Fitri NA, Marcella C, Wafa S, Kurniawan F, et al. Challenges in the diagnosis of insulin resistance: Focusing on the role of HOMA-IR and Tryglyceride/glucose index. Diabetes Metab Syndr. (2022) 16:102581. doi: 10.1016/j.dsx.2022.102581
21. McCracken E, Monaghan M, Sreenivasan S. Pathophysiology of the metabolic syndrome. Clinics Dermatol. (2018) 36:14–20. doi: 10.1016/j.clindermatol.2017.09.004
22. Barazzoni R, Gortan Cappellari G, Ragni M, Nisoli E. Insulin resistance in obesity: an overview of fundamental alterations. Eat Weight Disord. (2018) 23:149–57. doi: 10.1007/s40519-018-0481-6
23. Guerrero-Romero F, Simental-Mendia LE, Gonzalez-Ortiz M, Martínez-Abundis E, Ramos-Zavala MG, Hernández-González SO, et al. The product of triglycerides and glucose, a simple measure of insulin sensitivity. Comparison with the euglycemic-hyperinsulinemic clamp. J Clin Endocrinol Metab. (2010) 95:3347–51. doi: 10.1210/jc.2010-0288
24. Lee EY, Yang HK, Lee J, Kang B, Yang Y, Lee S-H, et al. Triglyceride glucose index, a marker of insulin resistance, is associated with coronary artery stenosis in asymptomatic subjects with type 2 diabetes. Lipids Health Dis. (2016) 15:155. doi: 10.1186/s12944-016-0324-2
25. Ramdas Nayak VK, Satheesh P, Shenoy MT, Kalra S. Triglyceride Glucose (TyG) Index: A surrogate biomarker of insulin resistance. J Pak Med Assoc. (2022) 72:986–8. doi: 10.47391/JPMA.22-63
26. Ma H, Li Y, Hou T, Li J, Yang L, Guo H, et al. Sevoflurane postconditioning attenuates hypoxia/reoxygenation injury of cardiomyocytes under high glucose by regulating HIF-1α/MIF/AMPK pathway. Front Pharmacol. (2020) 11:624809. doi: 10.3389/fphar.2020.624809
27. World health statistics overview 2019: monitoring health for the SDGs, sustainable development goals. Geneva: World Health Organization (2019). (WHO/DAD/2019.1). Licence: CC BY-NC-SA 3.0 IGO.
28. Chen Y, Zhang X-P, Yuan J, Cai B, Wang X-L, Wu X-L, et al. Association of body mass index and age with incident diabetes in Chinese adults: a population-based cohort study. BMJ Open. (2018) 8:e021768. doi: 10.1136/bmjopen-2018-021768
29. Santosa KB, Qi J, Kim HM, Hamill JB, Pusic AL, Wilkins EG. Effect of patient age on outcomes in breast reconstruction: results from a multicenter prospective study. J Am Coll Surg. (2016) 223:745–54. doi: 10.1016/j.jamcollsurg.2016.09.003
30. American Diabetes Association. 2. Classification and diagnosis of diabetes: standards of medical care in diabetes-2021. Diabetes Care. (2021) 44:S15–33. doi: 10.2337/dc21-S002
31. Qin Y, Tang H, Yan G, Wang D, Qiao Y, Luo E, et al. A high triglyceride-glucose index is associated with contrast-induced acute kidney injury in chinese patients with type 2 diabetes mellitus. Front Endocrinol (Lausanne). (2020) 11:522883. doi: 10.3389/fendo.2020.522883
32. Liu D, Yu D-M, Zhao L-Y, Fang H-Y, Zhang J, Wang J-Z, et al. Exposure to famine during early life and abdominal obesity in adulthood: findings from the great chinese famine during 1959–1961. Nutrients. (2019) 11:903. doi: 10.3390/nu11040903
33. Vasques ACJ, Novaes FS, de Oliveira M da S, Souza JRM, Yamanaka A, Pareja JC, et al. TyG index performs better than HOMA in a Brazilian population: a hyperglycemic clamp validated study. Diabetes Res Clin Pract. (2011) 93:e98–e100. doi: 10.1016/j.diabres.2011.05.030
34. Liu C, Liang D. The association between the triglyceride-glucose index and the risk of cardiovascular disease in US population aged ≤ 65 years with prediabetes or diabetes: a population-based study. Cardiovasc Diabetol. (2024) 23:168. doi: 10.1186/s12933-024-02261-8
35. Wu X, Qiu W, Yang H, Chen YJ, Liu J, Zhao G. Associations of the triglyceride-glucose index and atherogenic index of plasma with the severity of new-onset coronary artery disease in different glucose metabolic states. Cardiovasc Diabetol. (2024) 23:76. doi: 10.1186/s12933-024-02163-9
36. Li L, Cai G, Lu W, Li F, Yu L, Xiao J. Interaction between triglyceride-glucose index and thyroid hormones on coronary artery disease risk in patient with euthyroid. Front Endocrinol (Lausanne). (2023) 14:1255656. doi: 10.3389/fendo.2023.1255656
37. Zhu J, Niu M, Wang C, Liang Y, Guo R, He F. Correlation between triglyceride glucose index and collateral circulation formation in patients with chronic total occlusion of coronary arteries in different glucose metabolic states. Cardiovasc Diabetol. (2024) 23:26. doi: 10.1186/s12933-023-02080-3
38. Santulli G, Visco V, Varzideh F, Guerra G, Kansakar U, Gasperi M, et al. Prediabetes increases the risk of frailty in older adults with prefrail hypertension: beneficial effects of metformin. Hypertension. (2024) 16:1637–43. doi: 10.1161/HYPERTENSIONAHA.124.23087
39. Lee S-H, Kwon H-S, Park Y-M, Ha H-S, Jeong SH, Yang HK, et al. Predicting the development of diabetes using the product of triglycerides and glucose: the Chungju Metabolic Disease Cohort (CMC) study. PloS One. (2014) 9:e90430. doi: 10.1371/journal.pone.0090430
40. Lee J-W, Lim N-K, Park H-Y. The product of fasting plasma glucose and triglycerides improves risk prediction of type 2 diabetes in middle-aged Koreans. BMC Endocr Disord. (2018) 18:33. doi: 10.1186/s12902-018-0259-x
41. Low S, Khoo KCJ, Irwan B, Sum CF, Subramaniam T, Lim SC, et al. The role of triglyceride glucose index in development of Type 2 diabetes mellitus. Diabetes Res Clin Pract. (2018) 143:43–9. doi: 10.1016/j.diabres.2018.06.006
42. Navarro-González D, Sánchez-Íñigo L, Pastrana-Delgado J, Fernández-Montero A, Martinez JA. Triglyceride-glucose index (TyG index) in comparison with fasting plasma glucose improved diabetes prediction in patients with normal fasting glucose: The Vascular-Metabolic CUN cohort. Prev Med. (2016) 86:99–105. doi: 10.1016/j.ypmed.2016.01.022
43. Zhang M, Wang B, Liu Y, Sun X, Luo X, Wang C, et al. Cumulative increased risk of incident type 2 diabetes mellitus with increasing triglyceride glucose index in normal-weight people: The Rural Chinese Cohort Study. Cardiovasc Diabetol. (2017) 16:30. doi: 10.1186/s12933-017-0514-x
44. Li X, Li G, Cheng T, Liu J, Song G, Ma H. Association between triglyceride-glucose index and risk of incident diabetes: a secondary analysis based on a Chinese cohort study : TyG index and incident diabetes. Lipids Health Dis. (2020) 19:236. doi: 10.1186/s12944-020-01403-7
45. Martin BC, Warram JH, Krolewski AS, Bergman RN, Soeldner JS, Kahn CR. Role of glucose and insulin resistance in development of type 2 diabetes mellitus: results of a 25-year follow-up study. Lancet. (1992) 340:925–9. doi: 10.1016/0140-6736(92)92814-V
46. Darshan An V, Rajput R, Meena, Mohini, Garg R, Saini S. Comparison of triglyceride glucose index and HbA1C as a marker of prediabetes - A preliminary study. Diabetes Metab Syndr. (2022) 16:102605. doi: 10.1016/j.dsx.2022.102605
47. Liberty IA, Septadina IS, Rizqie MQ, Ananingsih ES, Hasyim H, Sitorus RJ. Predictors of prediabetes among communities without a family history of type 2 diabetes mellitus: A case-control study. Cureus. (2023) 15:e44131. doi: 10.7759/cureus.44131
48. Wen J, Wang A, Liu G, Wang M, Zuo Y, Li W, et al. Elevated triglyceride-glucose (TyG) index predicts incidence of Prediabetes: a prospective cohort study in China. Lipids Health Dis. (2020) 19:226. doi: 10.1186/s12944-020-01401-9
49. Zhang L, Zeng L. Non-linear association of triglyceride-glucose index with prevalence of prediabetes and diabetes: a cross-sectional study. Front Endocrinol (Lausanne). (2023) 14:1295641. doi: 10.3389/fendo.2023.1295641
Keywords: TyG index, relationship, prediabetes, young people, non-linear, Chinese adults
Citation: Xiao J, Zhou L, Luo C, Han Y and Huang Z (2024) Non-linear relationship between TyG index and the risk of prediabetes in young people: a 5-year retrospective cohort study in Chinese young adults. Front. Endocrinol. 15:1414402. doi: 10.3389/fendo.2024.1414402
Received: 11 April 2024; Accepted: 31 July 2024;
Published: 16 August 2024.
Edited by:
Åke Sjöholm, Gävle Hospital, SwedenReviewed by:
Changchun Cao, Dapeng New District Nan’ao People’s Hospital, ChinaXiang Hu, First Affiliated Hospital of Wenzhou Medical University, China
Copyright © 2024 Xiao, Zhou, Luo, Han and Huang. This is an open-access article distributed under the terms of the Creative Commons Attribution License (CC BY). The use, distribution or reproduction in other forums is permitted, provided the original author(s) and the copyright owner(s) are credited and that the original publication in this journal is cited, in accordance with accepted academic practice. No use, distribution or reproduction is permitted which does not comply with these terms.
*Correspondence: Yong Han, aGFueW9uZzUxMTAyM0AxNjMuY29t; Zhenhua Huang, aHVhbmd6aGgxMjMwNkAxNjMuY29t
†These authors have contributed equally to this work