 Yuhao Yang
 Zengxiang Wu
 Zhenmei An
 Shuangqing Li1*
94% of researchers rate our articles as excellent or good
Learn more about the work of our research integrity team to safeguard the quality of each article we publish.
Find out more
ORIGINAL RESEARCH article
Front. Endocrinol., 20 June 2024
Sec. Systems Endocrinology
Volume 15 - 2024 | https://doi.org/10.3389/fendo.2024.1414075
This article is part of the Research TopicCellular and Molecular Mechanisms in Metabolic Disorders: Role of Inflammation and Oxidative StressView all 9 articles
Background: Oxidative Balance Score (OBS) is a novel indicator of the overall antioxidant/oxidant balance, providing a comprehensive reflection of the body’s overall oxidative stress status, with higher OBS suggesting more substantial antioxidant exposures. We aimed to investigate the possible relationship between OBS with serum uric acid (SUA) and hyperuricemia.
Methods: Data utilized in this study were sourced from the 2011–2018 National Health and Nutrition Examination Survey (NHANES). Participants under 18 years old, those with ≤16 complete data out of 20 OBS components, incomplete serum uric acid data, and missing covariates were excluded from the analysis. OBS was computed by evaluating 16 nutrients and 4 lifestyle factors, encompassing 5 pro-oxidants and 15 antioxidants, guided by a priori knowledge of their relationship with oxidative stress.
Results: A total of 1,5096 individuals were included in our analysis with 49.7% being male, and an average age of 49.05 ± 17.56 years. The mean OBS was 19.76 ± 7.17. Hyperuricemia was present in 19.28% of participants. Due to the right-skewed distribution of the OBS, a natural log transformation was applied to address this issue, and Quartiles of lnOBS 1, 2, 3, and 4 were 1.10–2.56 (N=3526), 2.64–2.94 (N=3748), 3.00–3.22 (N=4026), and 3.26–3.61 (N=3796), respectively. Multivariable logistic regression showed that higher lnOBS quantiles were correlated with lower serum uric acid levels. Compared with the lowest lnOBS quantile, participants in the highest lnOBS quantile had a significant serum uric acid decrease of 16.94 μmol/L for each unit increase in lnOBS (β=-16.94, 95% CI: -20.44, -13.45). Similar negative associations were observed in the second-highest (β=-8.07, 95% CI: -11.45, -4.69) and third-highest (β=-11.69, 95% CI: -15.05, -8.34) lnOBS quantiles. The adjusted odds ratios (ORs) for hyperuricemia in Quartiles 1, 2, 3, and 4 were 1.00, 0.84 (95% CI: 0.75, 0.95), 0.78 (95% CI: 0.69, 0.88), and 0.62 (95% CI: 0.55, 0.71), respectively. Compared to Quartile 1, participants in Quartile 4 had a 38% lower prevalence of hyperuricemia. Subgroup analysis and interaction test showed that there was a significant dependence of sex between OBS and serum uric acid (p for interaction <0.05), but not hyperuricemia (p for interaction >0.05). Subgroup analysis stratified by age, BMI, hypertension, diabetes, and hyperlipidemia showed there is no significant dependence on these negative correlations (all p for interaction >0.05).
Conclusions: The serum uric acid levels and prevalence of hyperuricemia in US adults exhibited a negative association with OBS. By exploring this connection, our research aims to gain a better understanding of how oxidative balance affects the prevalence of hyperuricemia. This could provide valuable insights for developing preventive strategies and interventions for hyperuricemia. Additional large-scale prospective studies are required to explore the role of OBS in hyperuricemia further.
Uric acid, the final oxidation product of purine metabolism, is primarily excreted by the kidneys. Elevated serum uric acid (SUA) levels can lead to hyperuricemia due to uric acid supersaturation (1). Hyperuricemia is commonly defined as serum uric acid concentrations exceeding 7.0 mg/dL in men or 6.0 mg/dL in women (2). While uric acid serves as a vital antioxidant in plasma, it also contributes to blood pressure regulation and resilience against oxidative stress (3). However, intracellular uric acid has been linked to elevated inflammation and heightened oxidative stress (4). Extensive research has identified high serum uric acid levels as an independent risk factor for various chronic kidney and joint disorders (5), including gout (6), chronic arthritis (7), joint deformity, and uric acid kidney stones (8), as well as chronic metabolic diseases such as hypertension (9), diabetes (10), and metabolic syndrome, along with cardiovascular disease (11).
Oxidative stress is a condition where the cell’s antioxidant scavenging system is overwhelmed by the overproduction of ROS, leading to an oxygen paradox. This paradox occurs when free radicals, necessary for cellular processes, are produced in excessive amounts and begin to interfere with essential metabolic processes (12). Current evidence suggests a correlation between hyperuricemia and elevated levels of oxidative stress, as evidenced by increased serum pro-oxidant-antioxidant balance values (13). Pro-oxidants are implicated in inducing oxidative stress through the generation of reactive oxygen species (ROS) or by impeding the defensive capacity of the antioxidant system (14). A multitude of studies have investigated the relationship between hyperuricemia and oxidative stress, establishing that elevated blood uric acid levels promote oxidative stress within the body (15), thereby triggering inflammation (16).
Despite this, there is a notable gap in the research exploring the fluctuations in individual antioxidant/oxidant balance status and their impact on the development of hyperuricemia. The OBS is an effective tool that allows us to evaluate an individual’s antioxidant status by ranking the antioxidant and pro-oxidant components of their diet and lifestyle factors. Numerous epidemiological studies have investigated the association between OBS and conditions such as diabetes, non-alcoholic fatty liver disease (17), periodontitis (18), lung health (19), and vascular endothelial function (20).
In this study, we aim to use data from the National Health and Nutrition Examination Survey (NHANES) to perform a cross-sectional analysis among adults in the United States. Our goal is to assess the relationship between OBS and hyperuricemia. By exploring this connection, our research aims to gain a better understanding of how oxidative balance affects serum uric acid levels and the prevalence of hyperuricemia. This could provide valuable insights for developing preventive strategies and interventions.
The primary research question of this study is to investigate the association between OBS and hyperuricemia among adults in the United States. We hypothesize that higher OBS is associated with lower serum uric acid levels and a reduced risk of hyperuricemia.
The NHANES has a complex multistage probabilistic sampling design. It annually examines a nationally representative sample of 5000 individuals at 15 different sites selected from a sampling frame of all counties in the United States (21). It is conducted by the National Center for Health Statistics (NCHS) and is a periodic survey approved by the NCHS Ethics Review Board. All participants provide informed consent before participation. NHANES data collection takes place throughout the year, including weekdays and weekends. It involves a household interview, a visit to a mobile examination center (MEC), and follow-up activities after the MEC visit. In the household screening interview, eligible household members are identified using a computer-assisted personal interview tool. Potential participants receive a comprehensive list of topics and categories, such as health examination, blood- and urine-based tests, and dietary intake, that will be assessed. After obtaining informed consent, a detailed in-person interview is conducted in the homes of consenting individuals. This interview covers demographic, socioeconomic, dietary (including supplement use), and health-related questions (22). The data are released in 2-year cycles. four consecutive NHANES 2-year cycles (2011–2012, 2013–2014, 2015–2016, and 2017–2018) are collected. All NHANES data are publicly available at https://www.cdc.gov/nchs/nhanes/.
From the NHANES 2011−2018 dataset, a total of 39,156 individuals were identified to investigate the relationship between OBS and hyperuricemia. Exclusion criteria comprised individuals below 18 years of age (n=15,331), those with ≤16 complete data out of 20 OBS components (n=3,144), incomplete SUA data (n=1,149), and missing other covariates (n=4,436). Ultimately, 15,096 eligible participants were included in the final analysis (Figure 1).
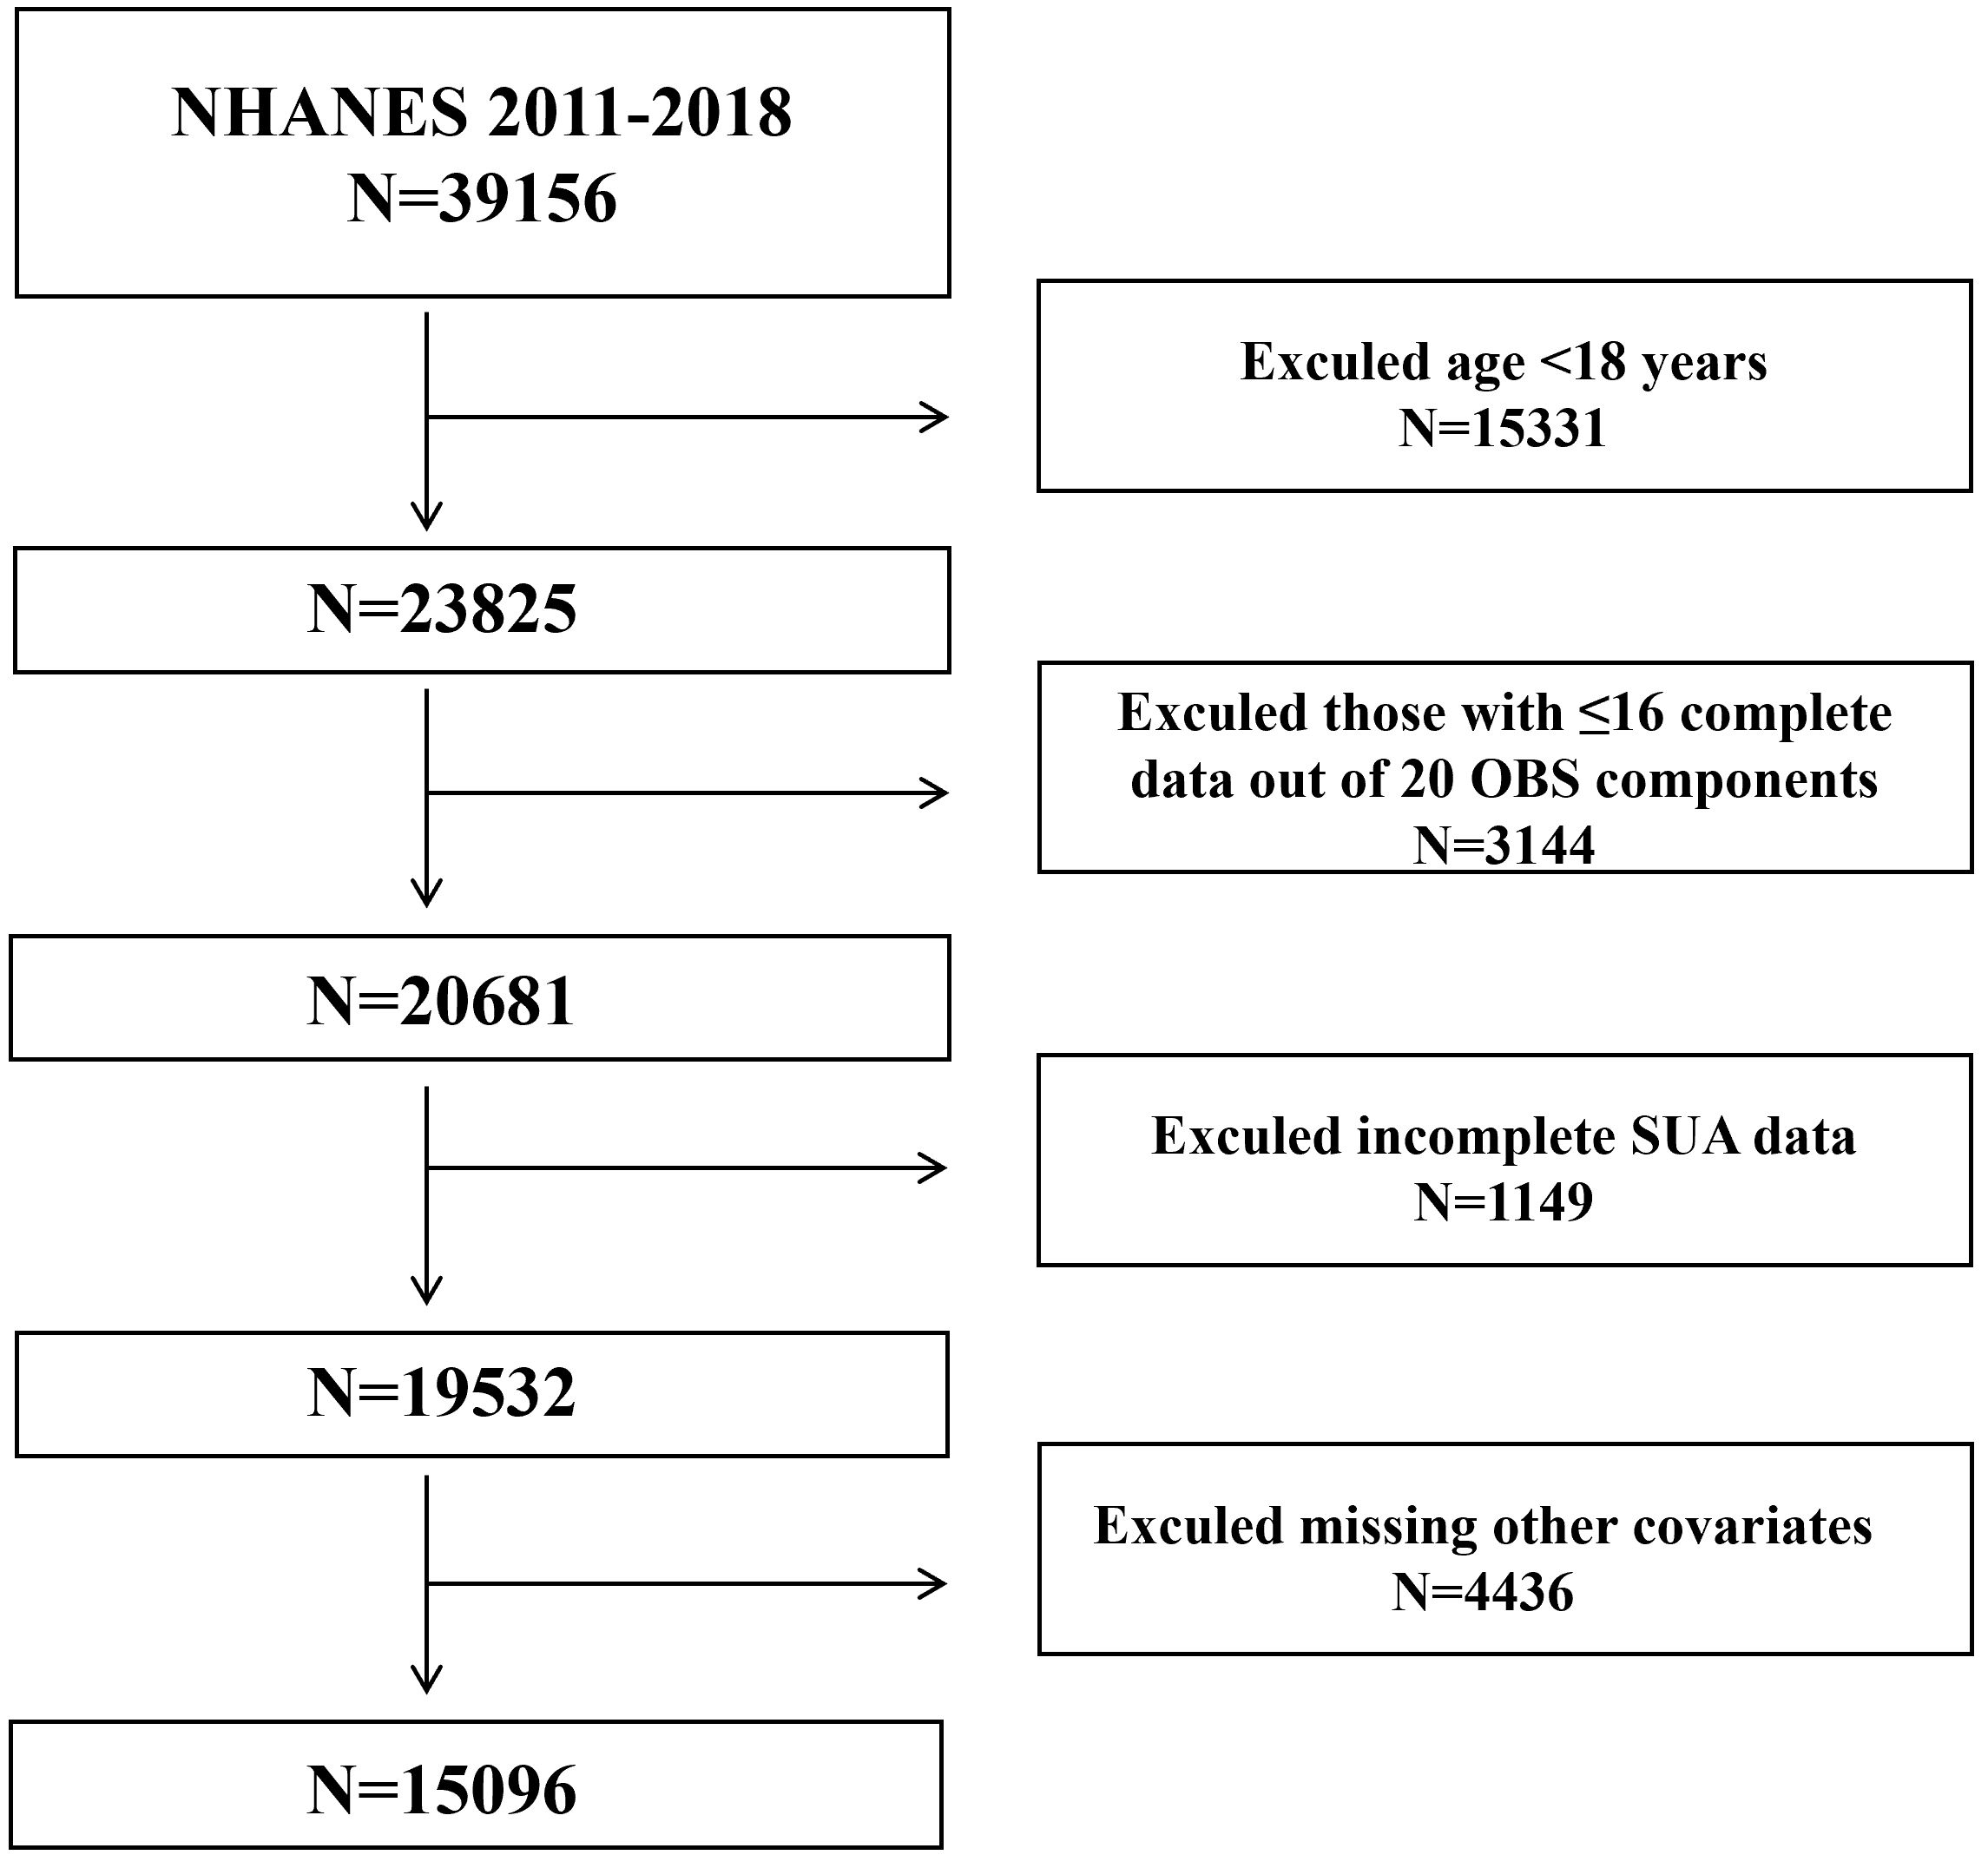
Figure 1 Flow diagram of clinical research from NHANES 2011–2018.
Serum samples were obtained from participants and stored at –30°C until transported to the National Center for Health Statistics (NCHS) at the Centers for Disease Control and Prevention (CDC) for serum uric acid (SUA) testing. Hyperuricemia was defined as an SUA level ≥416 μmol/L (7 mg/dL) in men and ≥357 μmol/L (6 mg/dL) in women (23).
The OBS was computed by assessing 16 nutrients and 4 lifestyle factors, comprising 5 pro-oxidants and 15 antioxidants, based on a priori knowledge of their association with oxidative stress. OBS components were categorized into four groups: (1) dietary antioxidants (fiber, β-carotene, riboflavin, niacin, vitamin B6, total folate, vitamin B12, vitamin C, vitamin E, calcium, magnesium, zinc, copper, and selenium), (2) dietary pro-oxidants (total fat and iron), (3) lifestyle antioxidants (physical activity), and (4) lifestyle pro-oxidants (alcohol, smoking, and body mass index [BMI]). Alcohol consumption was stratified into three groups: heavy drinkers (≥15 g/d for women and ≥30 g/d for men), non-heavy drinkers (0–15 g/d for women and 0–30 g/d for men), and non-drinkers, with corresponding scores of 0, 1, and 2 points, respectively. Subsequently, other components were stratified by sex and divided into tertiles. Antioxidants were assigned points on a scale from 0 to 2 for tertile groups 1 to 3, respectively, with higher points indicating increased antioxidant levels. Conversely, pro-oxidants were assigned points inversely, with 0 points for the highest tertile and 2 points for the lowest tertile, reflecting higher pro-oxidant levels (24). Refer to Table 1 for the specific calculation method of OBS. The overall OBS was calculated by summing the points assigned for each component, ranging from 3 to 37, with higher scores indicating greater antioxidant exposure.
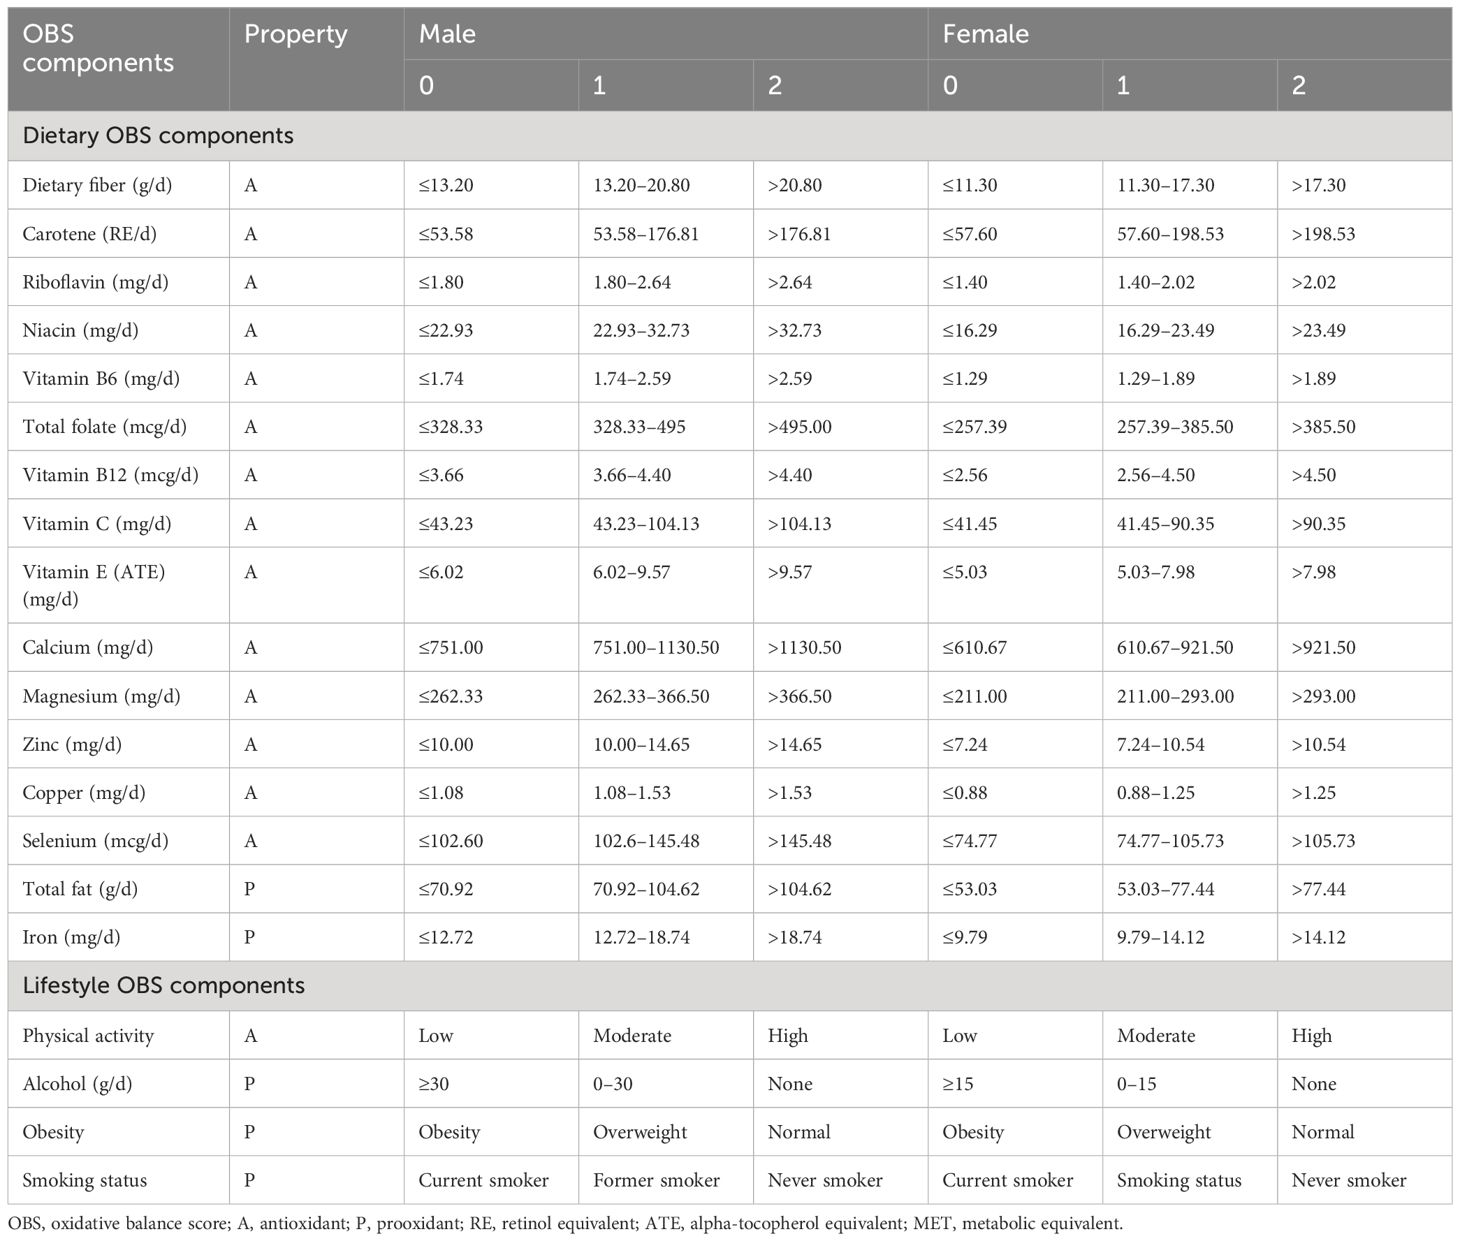
Table 1 Ingredients that make up the oxidative balance score.
Our study incorporated various covariates potentially influencing the outcome, including gender, age, race, education level, poverty-to-income ratio (PIR), body mass index (BMI), drinking status, smoking status, hypertension, diabetes, and hyperlipidemia. Race/ethnicity categories comprised Non-Hispanic White, Non-Hispanic Black, Mexican American, Other Hispanic, or Other Race. Body mass index (BMI) was calculated as weight in kilograms divided by height in meters squared and categorized as underweight (<18.5 kg/m²), normal weight (18.5–24.9 kg/m²), overweight (25.0–29.9 kg/m²), and obese (≥30.0 kg/m²). Education level was classified as less than 9th grade, 9–11th grade, high school graduate, college degree, and college graduate or above. Smoking status was categorized as never smoking (defined as smoking < 100 cigarettes in life) or current smoking (defined as smoking ≥ 100 cigarettes in life) while drinking status was divided into non-drinking (defined as drinking < 12 times in the last year) or drinking (defined as drinking ≥ 12 times in the last year). Information on the prevalence of hypertension, diabetes, and hyperlipidemia among participants was obtained through self-reported questionnaires.
All statistical analyses followed the guidelines outlined by the Centers for Disease Control and Prevention (CDC). Continuous variables were reported as means with standard error (SE), while categorical variables were presented as proportions. Differences among participants stratified by OBS quantiles were evaluated using either a weighted Student’s t-test (for continuous variables) or a weighted chi-square test (for categorical variables). Multivariable logistic regression, adjusted for various covariates, was employed to investigate the association between continuous OBS or quartile OBS and SUA levels, as well as hyperuricemia. Model 1 represented the unadjusted model, Model 2 was adjusted for age, sex, and race/ethnicity, and Model 3 adjusted for all covariates. Beta (β) coefficients with 95% confidence intervals (CIs) were used to evaluate the association between OBS and SUA levels. In comparison, odds ratios (ORs) with 95% confidence intervals (CIs) were used to assess the association between OBS and hyperuricemia. Subgroup analyses were conducted to explore the association between OBS and SUA levels, and hyperuricemia across gender, age, BMI, hypertension, diabetes, and hyperlipidemia subgroups. Due to the right-skewed distribution of OBS, natural log transformation was applied, and OBS values were categorized into four subgroups based on quartiles for inclusion in the models as continuous and categorical variables.
The statistical study was carried out using the statistical computing and graphics software R (version 4.1.3) and EmpowerStats (version 2.0).
A total of 15,096 participants were enrolled in the study, with 49.7% being male, and an average age of 49.05 ± 17.56 years. The mean OBS concentration was 19.96 ± 7.17. When the population was divided into hyperuricemia and non-hyperuricemia groups, we found that hyperuricemia was present in 19.28% (N=2911) of participants. The average age of individuals with hyperuricemia was 52.96 ± 17.72 years, with an average OBS of 18.22 ± 7.03. In contrast, the average age of individuals without hyperuricemia was 48.12 ± 17.40 years, with an average OBS of 20.12 ± 7.15 (Figure 2). The clinical characteristics of participants, stratified by hyperuricemia status, are detailed in Table 2. We can use the education level as an example. Among participants with hyperuricemia, those with an education level of 9–11th grade accounted for 10.96% (N=319) of the total education levels (N=2911). In contrast, among participants without hyperuricemia, those with an education level of 9–11th grade accounted for 12.00% (N=1462) of the total education levels (N=12185). Significant associations were observed between hyperuricemia and age, sex, race, education level, BMI, hypertension, hyperlipidemia, diabetes, smoking status, and OBS (p < 0.05). Participants with hyperuricemia tended to be older, male, obese, have lower OBS, and have a higher proportion of hypertension, hyperlipidemia, diabetes, and smoking status compared to those without hyperuricemia.
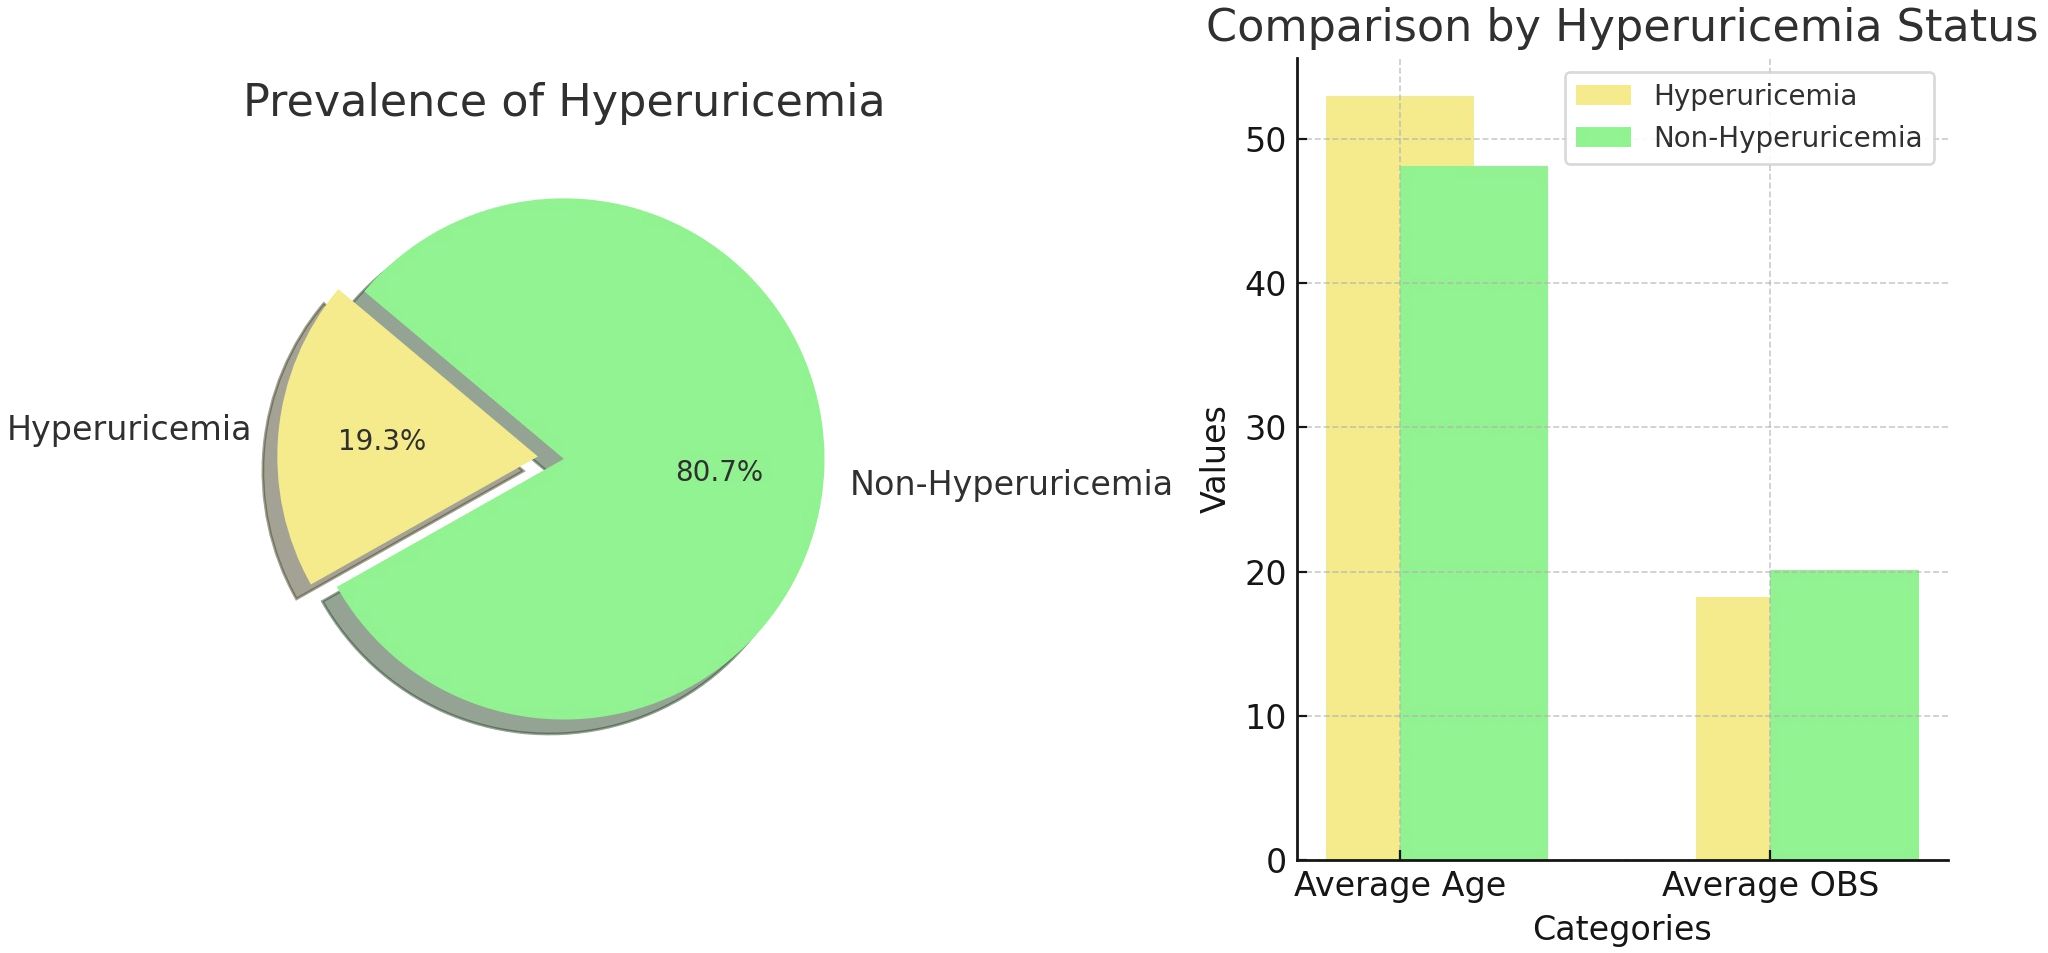
Figure 2 Hyperuricemia Prevalence and Demographic Analysis.
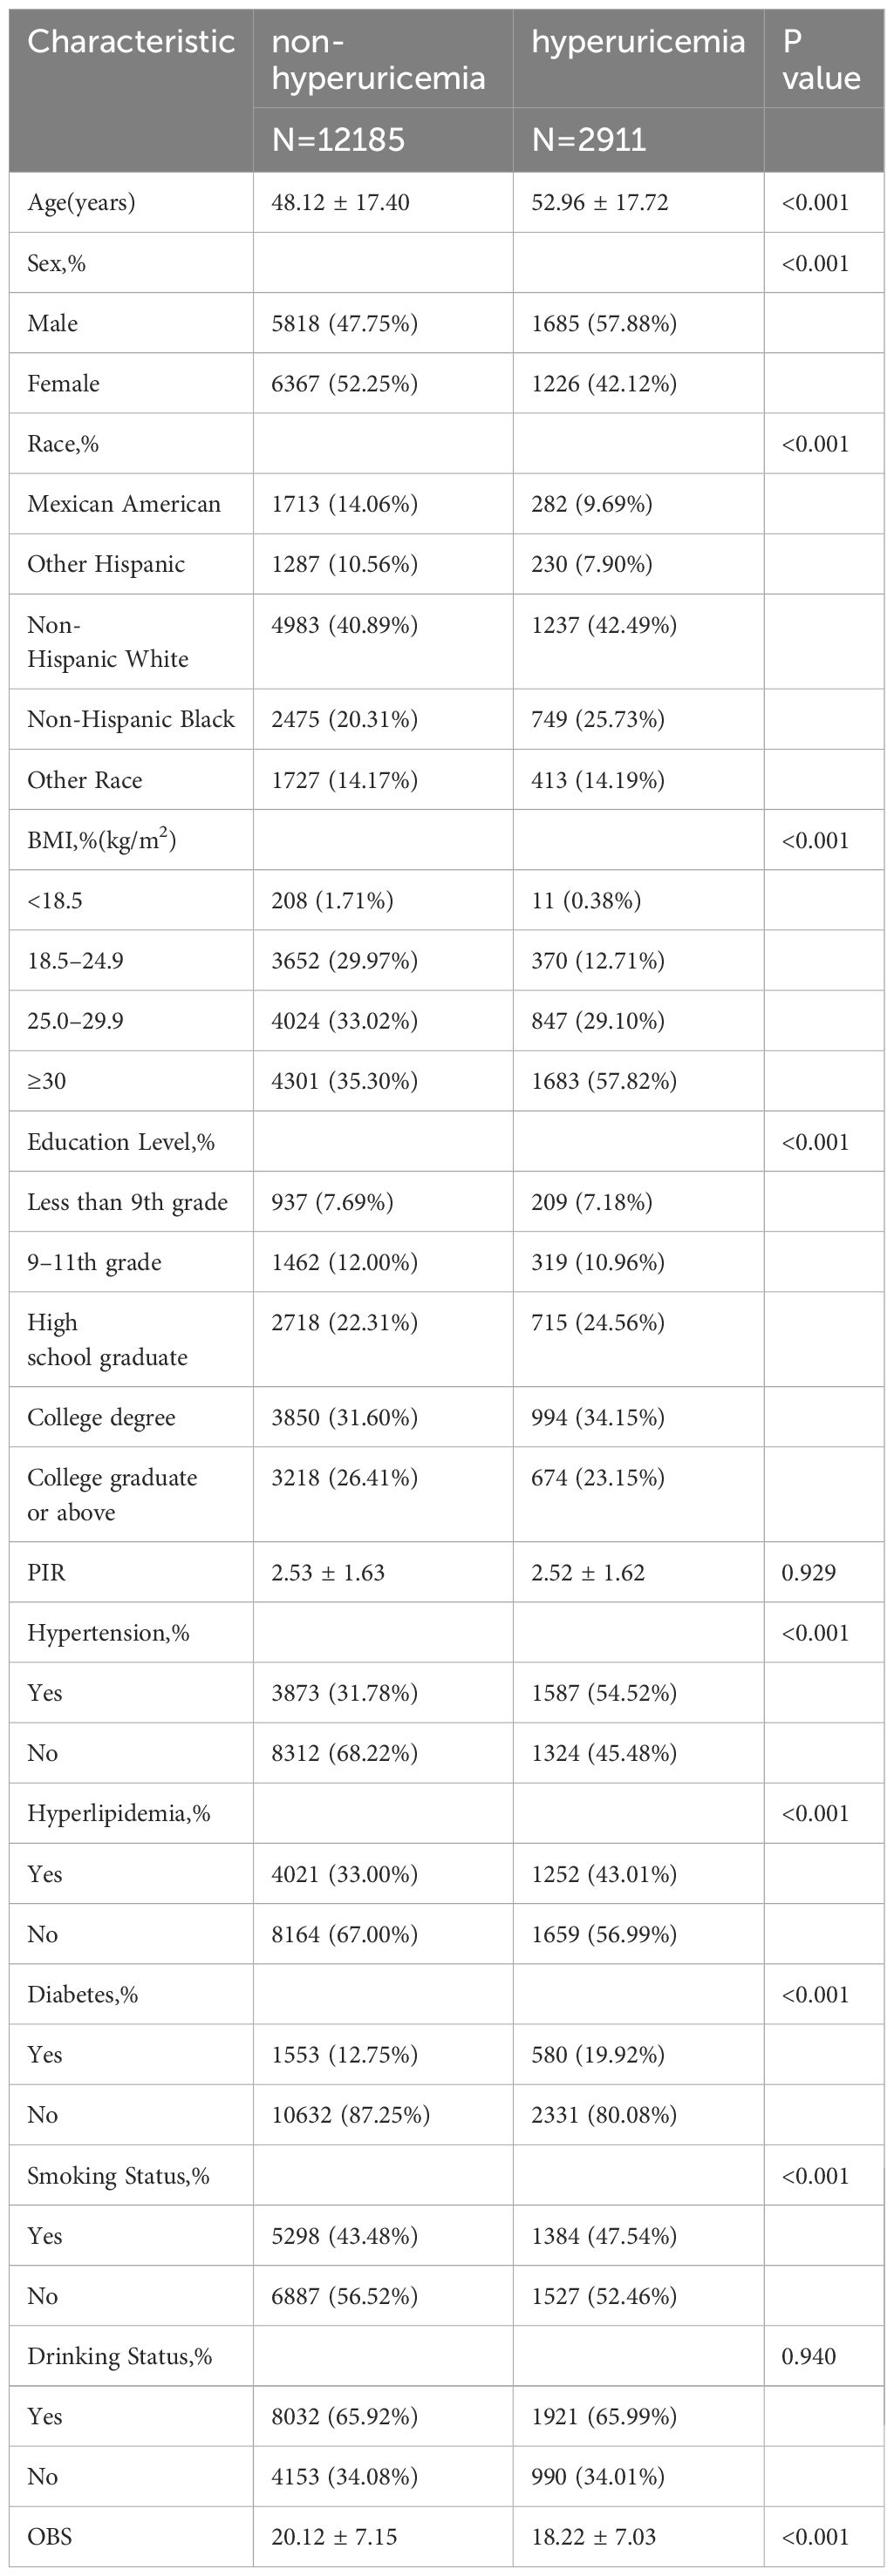
Table 2 Baseline characteristics of participants according to hyperuricemia.
Table 3 displays the clinical characteristics of participants based on quartiles of OBS. The mean OBS was 19.96 ± 7.17, ranging from 3 to 37. Quartiles of OBS 1, 2, 3, and 4 were 3–13 (N=3526), 14–19 (N=3748), 20–25 (N=4026), and 26–37 (N=3796), respectively. The average age of individuals in Quartiles 1–4 was 50.98 ± 17.88, 50.02 ± 17.73, 48.57 ± 17.44, and 46.82 ± 16.95. The SUA levels of Quartiles 1–4 were 339.15 ± 92.37 umol/L, 327.89 ± 84.98 umol/L, 320.90 ± 83.99 umol/L, and 309.84 ± 80.71 umol/L, respectively. We observed that compared to Quartile 1 (24.73%), the prevalence of hyperuricemia was lower in Quartile 2 (20.57%), Quartile 3 (18.53%), and Quartile 4 (13.75%) (Figure 3). Significant differences were observed across OBS quartiles in age, race, BMI, SUA levels, PIR, education level, hypertension, hyperlipidemia, diabetes, hyperuricemia, drinking status, and smoking status (all p < 0.05). Participants in higher OBS quartiles tended to be younger, have higher income, normal weight, lower SUA levels, and a lower proportion of hypertension, hyperlipidemia, diabetes, hyperuricemia, and smoking status, with a higher proportion of drinking status compared to those in the lowest OBS quartile (p < 0.05).
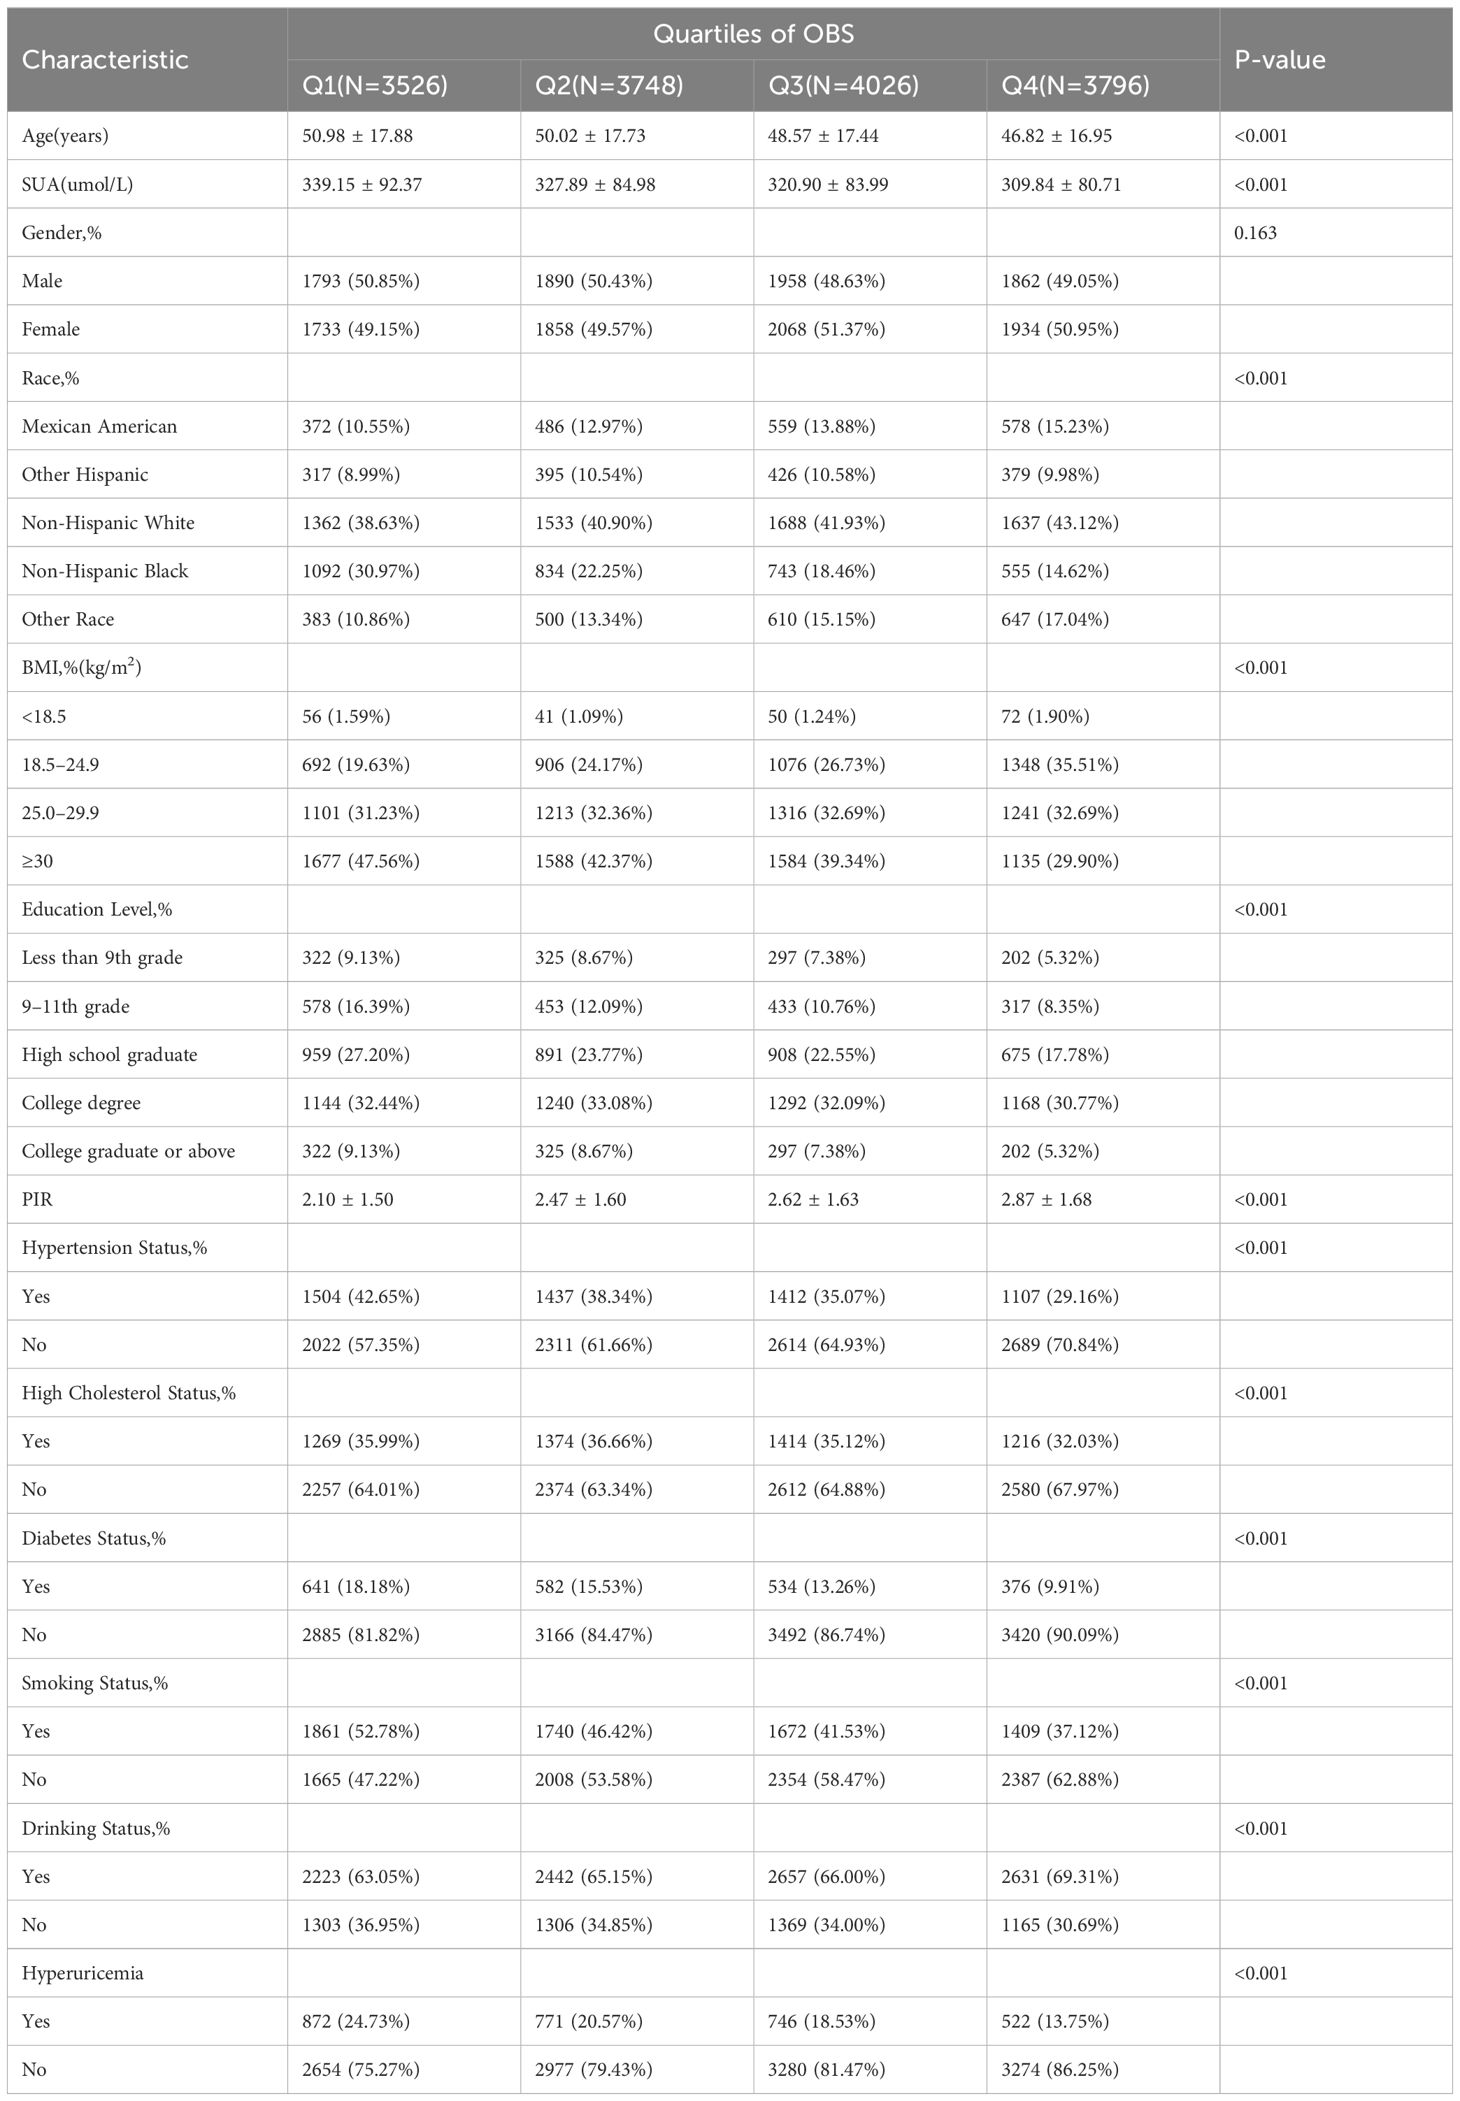
Table 3 Baseline characteristics of participants according to the oxidative balance score’s quartile.
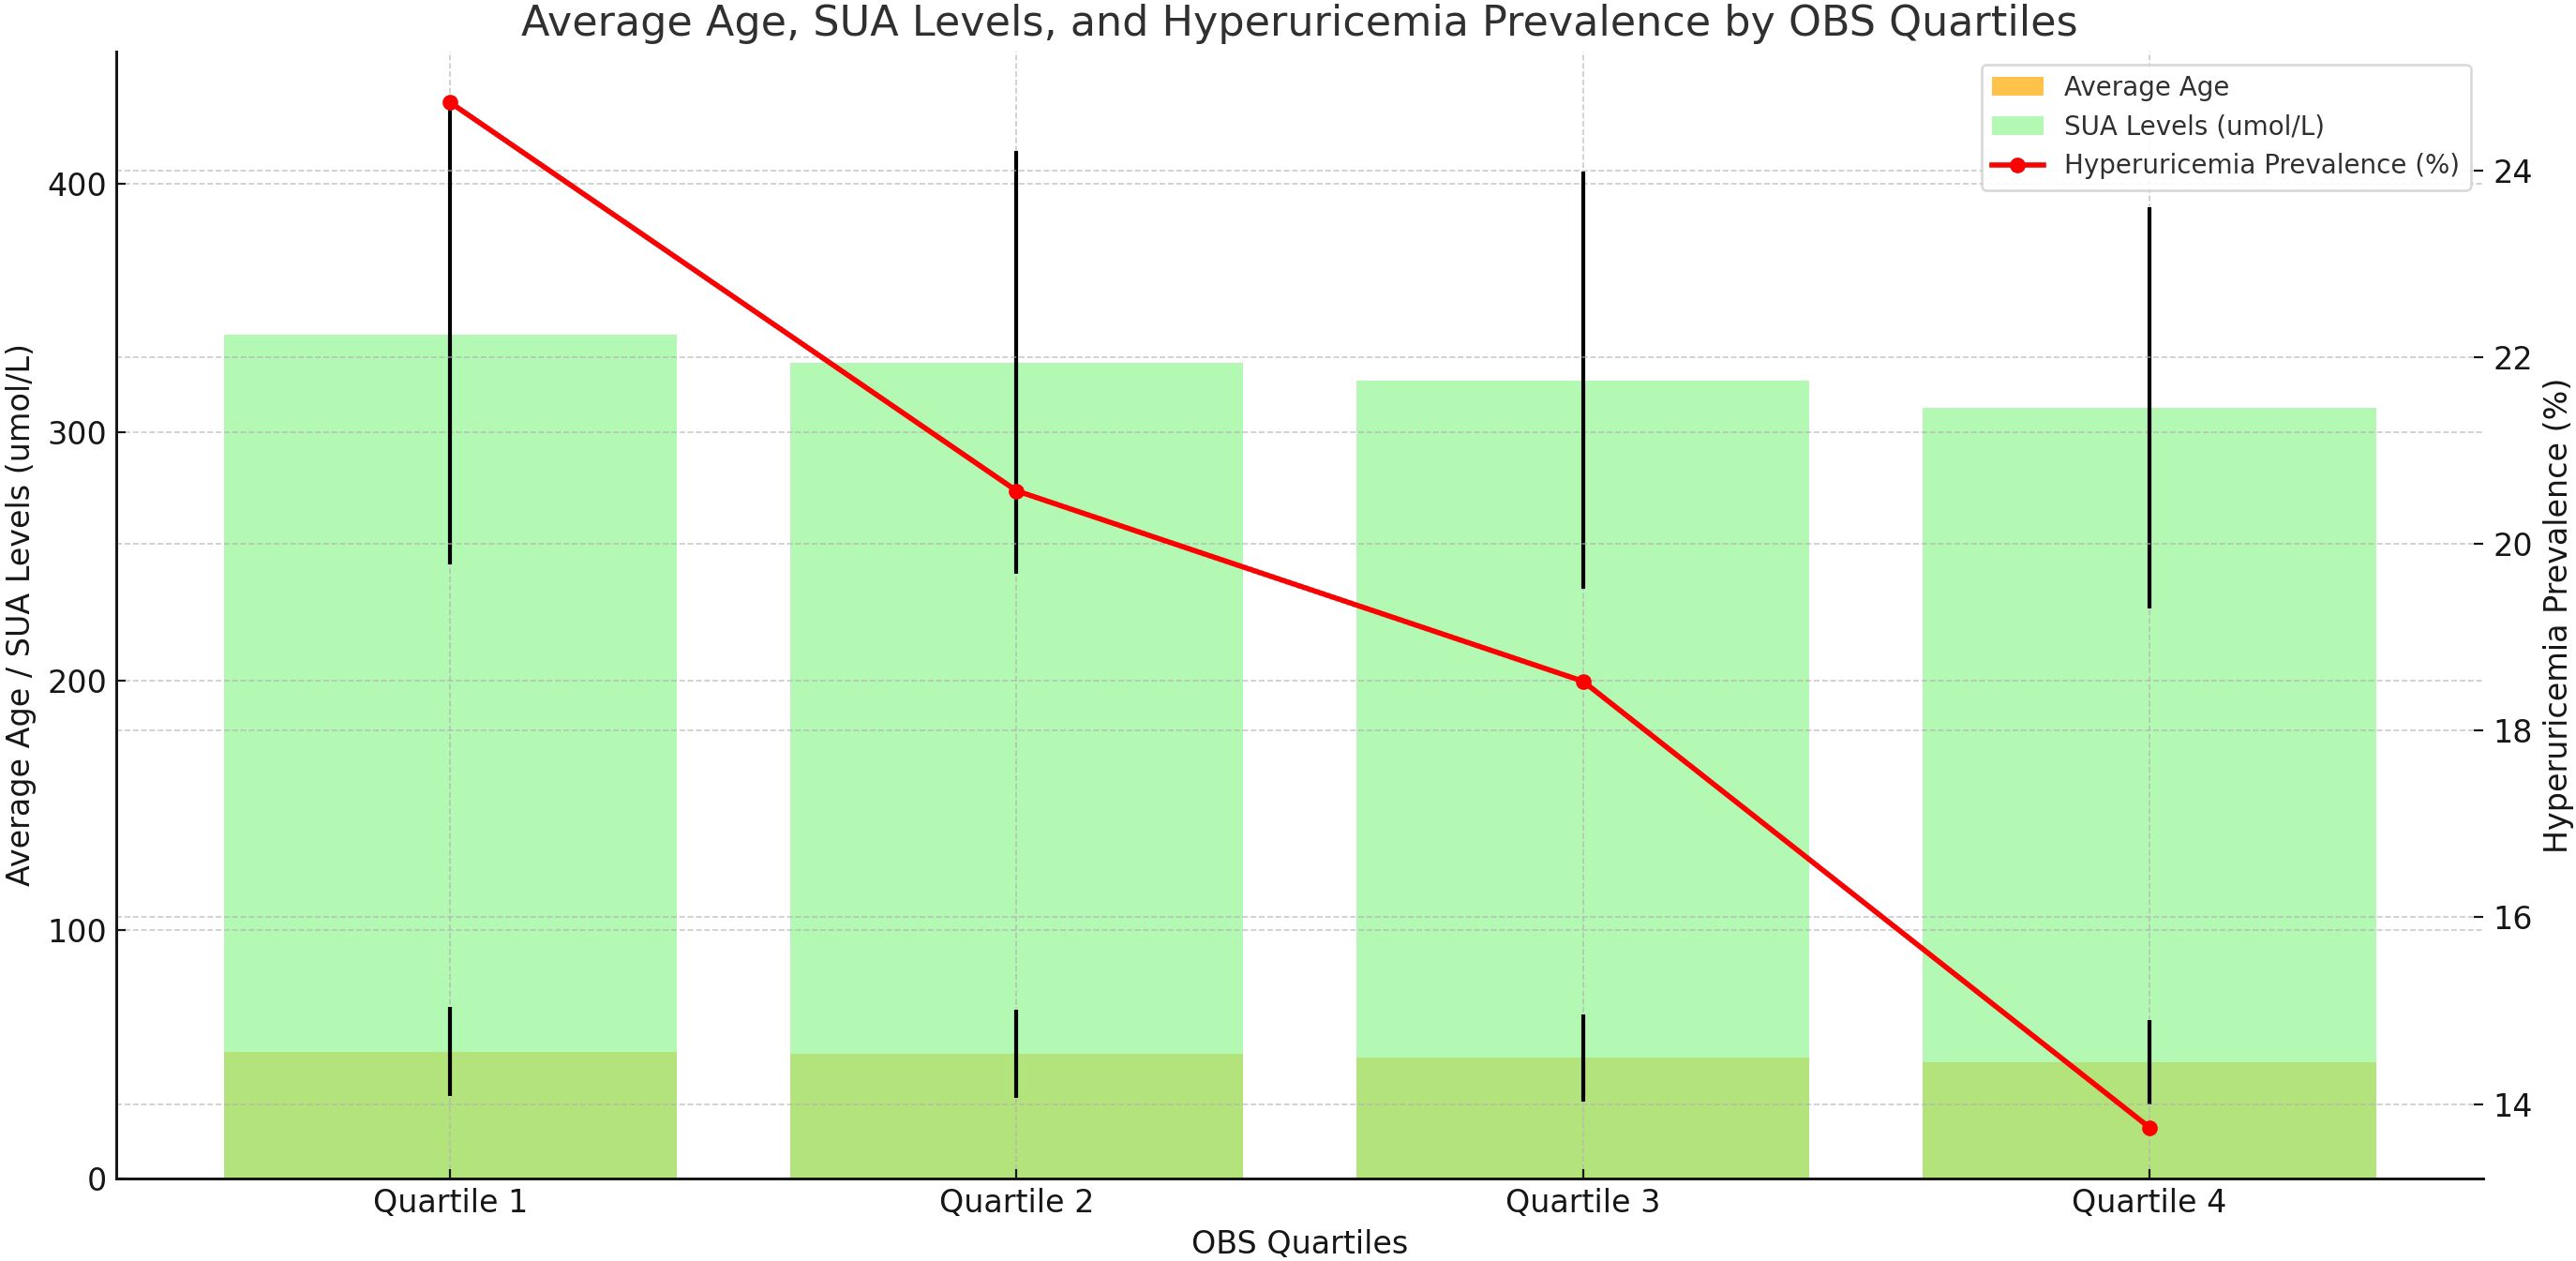
Figure 3 Distribution of Average Age, Serum Uric Acid Levels, and Hyperuricemia Prevalence Across OBS Quartiles.
A natural log transformation was applied to address the right-skewed distribution of the OBS and Quartiles of lnOBS 1, 2, 3, and 4 were 1.10–2.56 (N=3526), 2.64–2.94 (N=3748), 3.00–3.22 (N=4026), and 3.26–3.61 (N=3796), respectively. Table 4 shows the results of the multivariate regression analysis. In the unadjusted model, lnOBS exhibited a negative association with SUA levels (β=25.33, 95% CI: -28.59, -22.06). Even after full adjustment for age, sex, body mass index (BMI), race/ethnicity, educational level, smoking, drinking, diabetes, hypertension, and hyperlipidemia, the negative association between lnOBS and SUA levels remained consistent (β=-14.47, 95% CI: -17.41, -11.53). This indicated that each unit increase in lnOBS was associated with a decrease of 14.47 μmol/L in SUA levels, suggesting that higher OBS was correlated with lower SUA levels. We further converted the lnOBS from a continuous variable to a categorical variable (quantiles) to conduct a comparison. Compared with the lowest lnOBS quantile, participants in the highest lnOBS quantile had a significant serum uric acid decrease of 16.94 μmol/L when each unit of lnOBS increased with statistical significance (β=-16.94, 95% CI: -20.44, -13.45). Similar negative associations were observed in the second-highest (β=-8.07, 95% CI: -11.45, -4.69) and third-highest (β=-11.69, 95% CI: -15.05, -8.34) lnOBS quantiles.
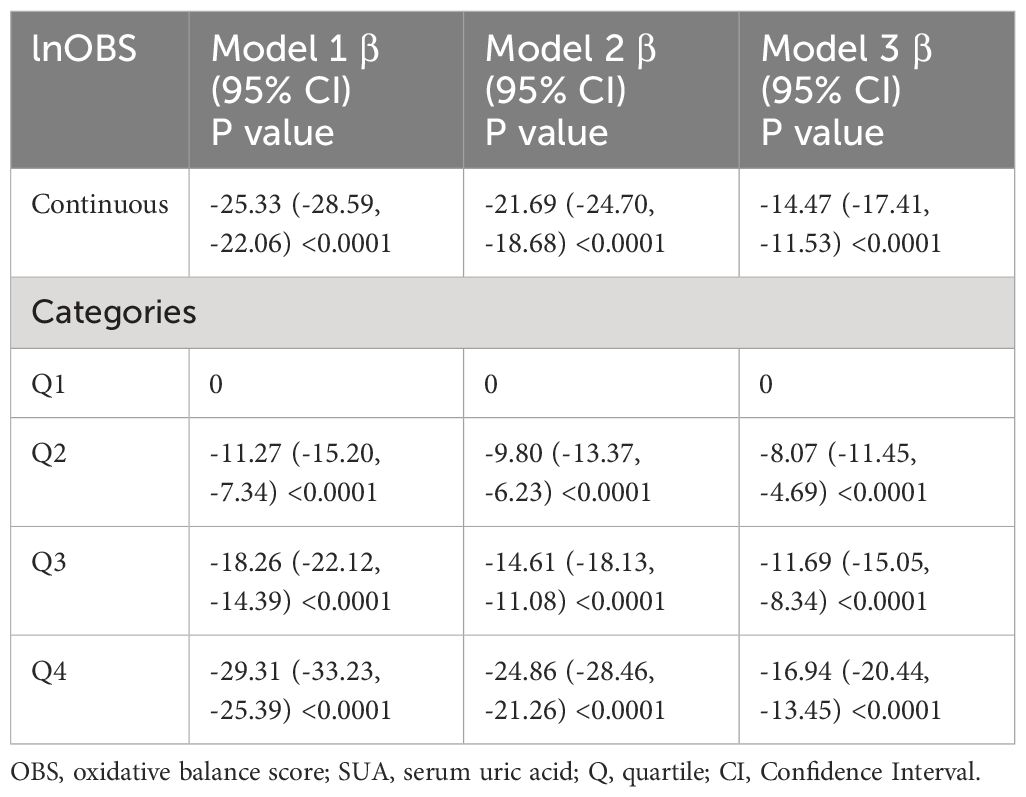
Table 4 Multiple logistic regression associations of lnOBS with SUA in adults.
Table 5 shows that a negative association was observed between lnOBS and hyperuricemia (OR 0.68, 95% CI 0.61, 0.75) in multiple logistic regression analysis adjusting for all covariates. This indicates that a one-unit increase in lnOBS is associated with a 32% lower prevalence of hyperuricemia. When lnOBS was categorized into quartiles, similar negative associations were observed compared to continuous lnOBS. The adjusted odds ratios (ORs) for Quartiles 1, 2, 3, and 4 in model 3 were 1.00, 0.84 (95% CI 0.75, 0.95), 0.78 (95% CI 0.69, 0.88), and 0.62 (95% CI 0.55, 0.71), respectively. Compared to Quartile 1, participants in Quartile 4 had a 38% lower prevalence of hyperuricemia.
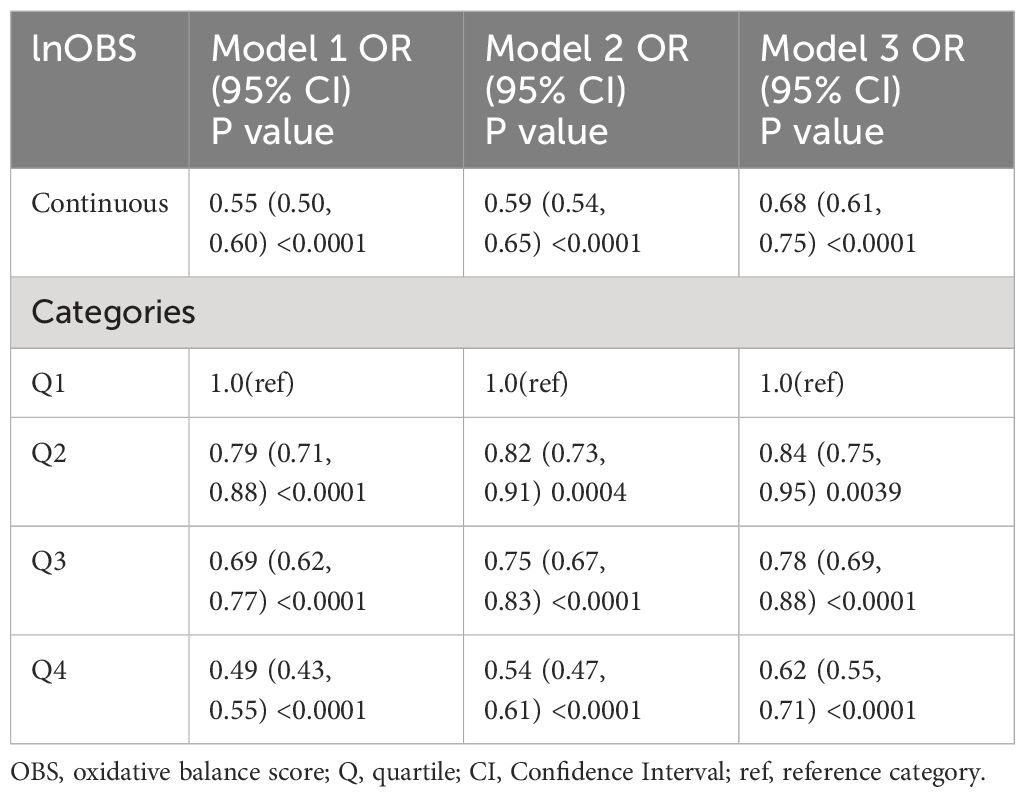
Table 5 Multiple logistic regression associations of lnOBS with hyperuricemia in adults.
We conducted a subgroup analysis to assess the stability of the relationship between lnOBS and SUA levels across different population settings (Figure 4). Stratification by gender revealed a significant and independently negative association between lnOBS and SUA levels in both men and women (p for interaction < 0.05). However, for other stratifications including age, BMI, hypertension, diabetes, and hyperlipidemia status, the negative association between lnOBS and SUA levels remained unaffected and was not significantly influenced (p for interaction > 0.05).
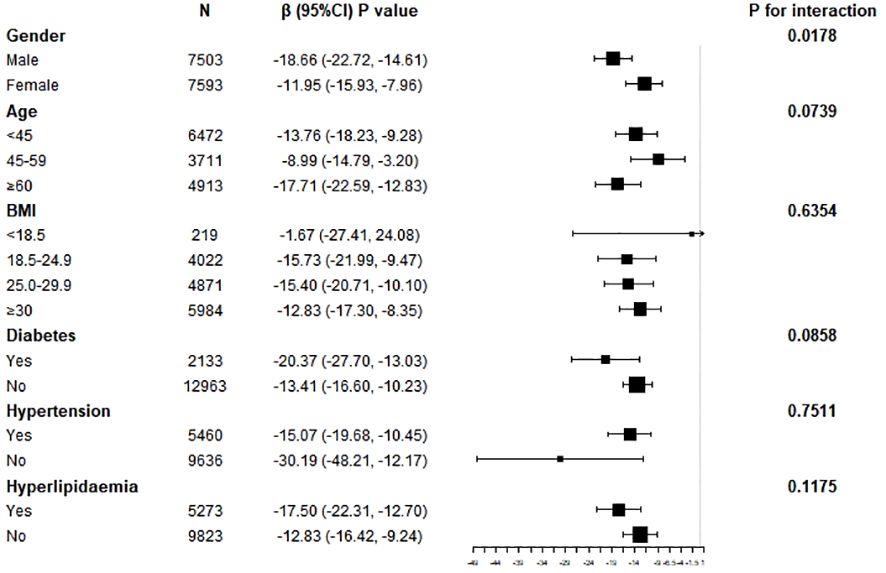
Figure 4 Subgroup analysis for the association between OBS and SUA in adults.
Further stratified analyses between lnOBS and hyperuricemia were conducted (Figure 5). These analyses indicated that gender, age, BMI, hypertension, diabetes, and hyperlipidemia status did not significantly influence the modification of the association between lnOBS and hyperuricemia (all P for interaction > 0.05).
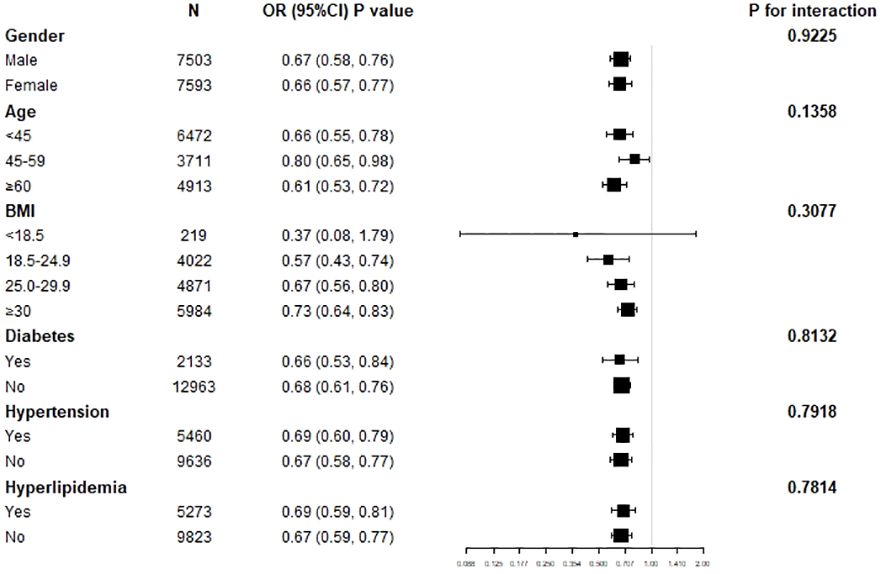
Figure 5 Subgroup analysis for the association between OBS and hyperuricemia in adults.
In the cross-sectional study involving 15,096 participants, our research demonstrated a significant negative association between OBS and both SUA and hyperuricemia, indicating that increased OBS may contribute to lower SUA levels and decreased hyperuricemia prevalence. The association remained stable after covariate adjustment. Subgroup analysis stratified by sex, age, BMI, hypertension, diabetes, and hyperlipidemia showed that there is a significant sex dependence on lowering SUA levels but not hyperuricemia. No significant dependence was observed for age, BMI, hypertension, diabetes, or hyperlipidemia.
As far as we know, this is the first study to assess the relationship between OBS and both SUA and hyperuricemia based on NHANES (from 2011 to March 2018). Previous studies have explored the relationship between oxidative stress and SUA (25) or hyperuricemia (16). The dietary components of OBS include many ingredients, and many of them have been proven to have antioxidant effects in previous studies. Studies found increasing dietary fiber intake could increase probiotics in the gut which is closely related to the occurrence and development of hyperuricemia by participating in the synthesis of purine metabolizing enzymes and the release of inflammatory factors (26). Some clinical studies support the beneficial role of vitamin B, C, D, and E supplementation in reducing SUA levels amongst healthy adults and, consequently, hyperuricemia (25, 27–29). A cross-sectional study presented a negative correlation between dietary magnesium intake and hyperuricemia in both males and females among US adults after adjusting for major confounding factors (30). In addition, a basic study also suggested that Cu or Cu-containing compounds significantly inhibited xanthine dehydrogenase (XDH) activity and reduced uric acid production by XDH in mouse liver homogenates (31). A significant positive association between higher serum iron and the risk of hyperuricemia was demonstrated in an observational cohort study of different regions of the Chinese population (32). However, some recent studies suggest that antioxidants do not provide significant benefits to the body and may even pose certain health risks. For instance, a prospective study involving 345,000 people found no significant association between antioxidant use and all-cause, cancer, or non-cancer mortality (33). Additionally, other research indicates that antioxidant supplementation may interfere with the body’s defense mechanisms and possess pro-oxidant properties, potentially increasing the risk of cancer and cardiovascular diseases (34). Therefore, it is important to note that a single component of trace elements may not be adequate to fully elucidate its antioxidant effects on the body.
The impact of lifestyle on hyperuricemia has been extensively explored in numerous studies. A cross-sectional analysis involving 38,855 participants revealed that higher sitting time was independently associated with an increased prevalence of hyperuricemia, whereas engaging in vigorous physical activity was associated with a decreased prevalence of hyperuricemia (35). Additionally, a Mendelian randomization study conducted on Korean hyperuricemic individuals indicated a significant causal relationship between increased alcohol consumption and the incidence of hyperuricemia (36). Furthermore, two nationwide cross-sectional surveys of the non-institutionalized Korean population suggested that cotinine-verified smoking was significantly associated with serum uric acid levels in women, and the risk of hyperuricemia increased in a dose-response manner with higher smoking exposure (37, 38). Additionally, we observed a positive association between obesity and hyperuricemia, which appears to be mediated by insulin resistance (39). In this study, the OBS serves as an indicator of the overall antioxidant/oxidant balance, providing a more comprehensive reflection of the body’s overall oxidative stress status (40).
Oxidative stress denotes a pathological imbalance between pro-oxidative and anti-oxidative factors, favoring the generation of pro-oxidants, which often manifests as an overproduction of reactive oxygen species (ROS) (14). Chronic inflammation leads to a pro-oxidative state, which is closely linked to the development or progression of cardiovascular disease (CVD) (41), hypertension (42) and metabolic syndrome (43). In many disease states, the expression of oxidase-producing enzymes, the primary sources of ROS, is upregulated (44). In humans and great apes, uric acid represents the end product of purine metabolism, with xanthine oxidase (XOR) acting as the rate-limiting enzyme in purine catabolism (45). XOR catalyzes the final two steps of purine catabolism, converting hypoxanthine to xanthine and then to uric acid, a process accompanied by ROS production, thereby contributing to oxidative stress (46). This oxidative stress can lead to damage to proteins, lipids, DNA, and RNA, and participate in various cellular processes such as cell signaling, cardiovascular disease, inflammation, aging, and cancer (47). The intricate relationship between oxidative stress and serum uric acid concentration has been the focus of research for decades (16). Numerous observational cross-sectional studies have affirmed the association of individual pro-oxidative and oxidative factors with uric acid and hyperuricemia. However, determining the precise impact of individual oxidative stress-related components on serum uric acid poses a considerable challenge (18). Moreover, pro-oxidants and antioxidants may exhibit antagonistic or synergistic effects. Furthermore, antioxidants can promote oxidation at high doses, while exhibiting poor solubility, low permeability, and lacking stability and specificity in biofilms (48). Hence, we employed the OBS as a comprehensive evaluation index to assess individual oxidative balance. Our findings revealed a negative correlation between higher OBS and SUA levels, suggesting that elevated OBS is associated with a reduced prevalence of hyperuricemia.
This phenomenon can be explained through the following mechanisms: 1. Impact of Antioxidants on Uric Acid Production: Antioxidants such as vitamin C (49), vitamin E (50), and zinc (51) have been shown to reduce serum uric acid levels. Vitamin C, for example, can alter the activity of URAT1 in renal tubular epithelial cells, promoting uric acid excretion and thus lowering serum uric acid levels (52, 53). Antioxidants reduce uric acid production by inhibiting pathways that generate uric acid. 2. Relief of Oxidative Stress by Antioxidants: Oxidative stress, characterized by an imbalance between ROS production and antioxidant defense, is closely related to hyperuricemia (46). Behaviors such as smoking and alcohol consumption increase oxidative stress, and antioxidants can neutralize these oxidants, reducing oxidative damage to cells. Since uric acid has antioxidant properties, reduced oxidative stress would decrease the body’s need for uric acid as an antioxidant, thus lowering serum uric acid levels (36, 38). 3. Protection of Renal Function: Antioxidants protect renal function by preventing oxidative damage to glomeruli and renal tubules. The kidneys play a crucial role in uric acid excretion, and renal damage can directly affect uric acid clearance. By preserving renal function, antioxidants facilitate normal uric acid excretion, thereby reducing serum uric acid levels (54, 55). 4. Improvement of Metabolism: The OBS includes antioxidants that play a significant role in improving insulin resistance and metabolic syndrome. Insulin resistance is closely linked to hyperuricemia because it increases uric acid production and decreases its excretion. By improving insulin sensitivity, antioxidants help maintain normal uric acid metabolism and reduce the risk of hyperuricemia (56, 57). 5. Antioxidants and Gut Health Synergistic Uric Acid Reduction: The intake of antioxidants and gut health have a closely linked bidirectional relationship, which plays a crucial role in reducing uric acid levels and preventing hyperuricemia. Antioxidants reduce oxidative stress and inflammation-induced damage to intestinal epithelial cells, thereby decreasing intestinal permeability, promoting cell repair, and enhancing gut barrier function. Additionally, antioxidants inhibit the production and release of inflammatory mediators, protecting the gut microbiota and maintaining the balance and integrity of the gut flora (58–60). A healthy gut environment aids in the absorption and utilization of antioxidants, further enhancing their bioactivity. Certain gut microbes can metabolize antioxidants, converting them into more effective forms, thus boosting their antioxidant effects (61–63). This positive feedback loop not only helps lower uric acid levels in the body but also promotes uric acid excretion by regulating uric acid transporters in the gut, effectively preventing and controlling hyperuricemia.
Subgroup analysis and interaction tests were employed to observe gender differences in the effect of OBS on SUA, revealing that the increase of lnOBS by one unit led to a greater reduction in SUA levels in men compared to women. We analyzed and speculated that several factors may contribute to this phenomenon. Firstly, relevant literature indicates that men have higher levels of physical activity compared to women. This higher level of physical activity helps men manage their weight more effectively, resulting in lower obesity rates among men compared to women. Additionally, in the OBS index, physical activity acts as an antioxidant, while obesity is a pro-oxidant. This may explain why uric acid levels decrease more rapidly in men than in women (64, 65). Moreover, sex-specific differences in physiological responses of the respiratory, musculoskeletal, and cardiovascular systems to physical activity result in a higher prevalence of metabolic syndrome in women (66). Metabolic syndrome, characterized by insulin resistance, enhances uric acid reabsorption and reduces uric acid excretion through upregulation of urate transporter 1 (URAT1) expression (67). Secondly, sex hormones also influence blood uric acid levels (68). Studies have shown that testosterone can directly regulate uric acid excretion by affecting the function of the URAT (69). Additionally, the binding degree of testosterone to hormone-binding globulin can also impact blood uric acid levels (70). Estradiol can promote intestinal urate excretion by regulating the intestinal ATP binding cassette subfamily G member 2 (ABCG2), thereby affecting uric acid levels (71). However, no significant difference was observed in the reduction of hyperuricemia prevalence among subgroups with different gender, ages, weight, diabetes statuses, hypertension status, and hyperlipidemia status. This is because the occurrence of hyperuricemia is the result of multiple factors and may not be solely influenced by oxidative balance. Genetic background (72), physiological factors (73), metabolic factors (74), medication effects (75), and environmental factors (76) may all play significant roles in the development of hyperuricemia. Therefore, although OBS can affect uric acid levels, relying solely on OBS regulation may not be sufficient to significantly reduce the incidence of hyperuricemia. This suggests that a comprehensive approach considering multiple factors is necessary for effective intervention and prevention.
This study possesses several strengths. Firstly, it is the first to establish associations between OBS and SUA levels as well as hyperuricemia within a US population. Secondly, the utilization of data from the NHANES, a nationwide population-based sample acquired through standardized protocols, enhances the robustness of our findings. The stratified, multistage sampling method employed in the NHANES ensures the representation of the noninstitutionalized population, thus increasing the external validity of our results. Thirdly, sophisticated statistical methods were employed to ensure comprehensive and reliable outcomes. Complex models were developed, accounting for multiple confounders, and OBS were adjusted to accommodate continuous and categorical variables, mitigating potential effects on the observed associations. Additionally, subgroup analyses were conducted to explore the potential influence of other factors on the association between OBS and SUA levels as well as hyperuricemia. However, our study also has limitations. Firstly, due to its cross-sectional design, we cannot infer a causal relationship between OBS and SUA levels as well as hyperuricemia. Prospective studies are needed to further validate the predictive value of OBS in hyperuricemia. What’s more, the self-reported dietary and lifestyle data in the NHANES database have limitations, including recall bias and social desirability bias. These biases may affect the accuracy of the data and the reliability of the study results, so they should be considered when interpreting the findings. Lastly, while our study revealed a significant difference in uric acid reduction between genders, no significant difference was observed in the reduction of hyperuricemia prevalence. However, previous relevant trials have suggested a sex difference. Therefore, further studies are warranted to elucidate this correlation.
In conclusion, findings from a nationally representative sample of US adults indicated a negative correlation between OBS and SUA levels as well as hyperuricemia. Both an antioxidant-rich diet and improvements in lifestyle were found to be crucial in reducing SUA levels and decreasing the prevalence of hyperuricemia. Furthermore, we observed that the negative correlation between OBS and SUA levels was more pronounced among male participants compared to female participants. Future research should explore the mechanisms behind gender differences in the relationship between OBS and uric acid levels, particularly in the metabolism of antioxidants and pro-oxidants. Investigating how gender differences influence the occurrence and development of hyperuricemia is also essential. More randomized controlled trials are needed to assess whether improving OBS through dietary changes, such as increasing antioxidant intake or reducing pro-oxidant exposure, can effectively lower uric acid levels and reduce hyperuricemia incidence. Additionally, long-term cohort studies are necessary to determine the lasting impact of OBS on uric acid levels and the development of hyperuricemia over time, as well as to evaluate potential cumulative effects.
Publicly available datasets were analyzed in this study. This data can be found here: https://www.cdc.gov/nchs/nhanes/.
The studies involving humans were approved by National Center for Health Statistics Ethics Review Board. The studies were conducted in accordance with the local legislation and institutional requirements. The participants provided their written informed consent to participate in this study.
YY: Writing – original draft, Writing – review & editing. ZW: Writing – original draft, Writing – review & editing. ZA: Formal analysis, Methodology, Project administration, Validation, Writing – review & editing. SL: Conceptualization, Funding acquisition, Investigation, Methodology, Project administration, Validation, Writing – review & editing.
The author(s) declare financial support was received for the research, authorship, and/or publication of this article. This study received funding from the Sichuan Province International Science and Technology Innovation Cooperation/Hong Kong, Macao, and the Taiwan Science and Technology Task contract of innovation cooperation project (no. 2021YFH168).
We would like to express our gratitude to Dr. Shuangqing Li for providing valuable assistance with statistical methodology consultation.
The authors declare that the research was conducted in the absence of any commercial or financial relationships that could be construed as a potential conflict of interest.
All claims expressed in this article are solely those of the authors and do not necessarily represent those of their affiliated organizations, or those of the publisher, the editors and the reviewers. Any product that may be evaluated in this article, or claim that may be made by its manufacturer, is not guaranteed or endorsed by the publisher.
1. Crawley WT, Jungels CG, Stenmark KR, Fini MA. U-shaped association of uric acid to overall-cause mortality and its impact on clinical management of hyperuricemia. Redox Biol. (2022) 51:102271. doi: 10.1016/j.redox.2022.102271
2. Park JH, Jo YI, Lee JH. Renal effects of uric acid: hyperuricemia and hypouricemia. Korean J Intern Med. (2020) 35:1291–304. doi: 10.3904/kjim.2020.410
3. Joosten LAB, Crişan TO, Bjornstad P, Johnson RJ. Asymptomatic hyperuricaemia: a silent activator of the innate immune system. Nat Rev Rheumatol. (2020) 16:75–86. doi: 10.1038/s41584-019-0334-3
4. Gherghina ME, Peride I, Tiglis M, Neagu TP, Niculae A, Checherita IA. Uric acid and oxidative stress-relationship with cardiovascular, metabolic, and renal impairment. Int J Mol Sci. (2022) 23:3188. doi: 10.3390/ijms23063188
5. Lee Y, Hwang J, Desai SH, Li X, Jenkins C, Kopp JB, et al. Efficacy of xanthine oxidase inhibitors in lowering serum uric acid in chronic kidney disease: A systematic review and meta-analysis. J Clin Med. (2022) 11:2468. doi: 10.3390/jcm11092468
6. Borghi C, Perez-Ruiz F. Urate lowering therapies in the treatment of gout: a systematic review and meta-analysis. Eur Rev Med Pharmacol Sci. (2016) 20:983–92. doi: 10.1002/14651858.CD010156.pub2
7. Andrés M, Sivera F, Buchbinder R, Pardo Pardo J, Carmona L. Dietary supplements for chronic gout. Cochrane Database Syst Rev. (2021) 11:Cd010156. doi: 10.1002/14651858.CD010156.pub3
8. Mazzierli T, Cirillo L, Palazzo V, Ravaglia F, Becherucci F. Clinical features suggesting renal hypouricemia as the cause of acute kidney injury: a case report and review of the literature. J Nephrol. (2023) 36:651–7. doi: 10.1007/s40620-022-01494-8
9. Caliceti C, Calabria D, Roda A, Cicero AFG. Fructose intake, serum uric acid, and cardiometabolic disorders: A critical review. Nutrients. (2017) 9:395. doi: 10.3390/nu9040395
10. Ismail L, Materwala H, Al Kaabi J. Association of risk factors with type 2 diabetes: A systematic review. Comput Struct Biotechnol J. (2021) 19:1759–85. doi: 10.1016/j.csbj.2021.03.003
11. Li X, Meng X, Timofeeva M, Tzoulaki I, Tsilidis KK, Ioannidis JP, et al. Serum uric acid levels and multiple health outcomes: umbrella review of evidence from observational studies, randomised controlled trials, and Mendelian randomisation studies. Bmj. (2017) 357:j2376. doi: 10.1136/bmj.j2376
12. Valko M, Leibfritz D, Moncol J, Cronin MT, Mazur M, Telser J. Free radicals and antioxidants in normal physiological functions and human disease. Int J Biochem Cell Biol. (2007) 39:44–84. doi: 10.1016/j.biocel.2006.07.001
13. Zhou Y, Zhao M, Pu Z, Xu G, Li X. Relationship between oxidative stress and inflammation in hyperuricemia: Analysis based on asymptomatic young patients with primary hyperuricemia. Med (Baltimore). (2018) 97:e13108. doi: 10.1097/MD.0000000000013108
14. Sies H. Oxidative stress: a concept in redox biology and medicine. Redox Biol. (2015) 4:180–3. doi: 10.1016/j.redox.2015.01.002
15. Lu Z, Pu C, Zhang Y, Sun Y, Liao Y, Kang Z, et al. Oxidative stress and psychiatric disorders: evidence from the bidirectional mendelian randomization study. Antioxidants (Basel). (2022) 11:1386. doi: 10.3390/antiox11071386
16. Liu N, Xu H, Sun Q, Yu X, Chen W, Wei H, et al. The role of oxidative stress in hyperuricemia and xanthine oxidoreductase (XOR) inhibitors. Oxid Med Cell Longev. (2021) 2021:1470380. doi: 10.1155/2021/1470380
17. Moon ME, Jung DH, Heo SJ, Park B, Lee YJ. Oxidative balance score and new-onset type 2 diabetes mellitus in korean adults without non-alcoholic fatty liver disease: korean genome and epidemiology study-health examinees (KoGES-HEXA) cohort. Antioxidants (Basel). (2024) 13:107. doi: 10.3390/antiox13010107
18. Qu H. The association between oxidative balance score and periodontitis in adults: a population-based study. Front Nutr. (2023) 10:1138488. doi: 10.3389/fnut.2023.1138488
19. Xu Z, Xue Y, Wen H, Chen C. Association of oxidative balance score and lung health from the National Health and Nutrition Examination Survey 2007–2012. Front Nutr. (2022) 9:961950. doi: 10.3389/fnut.2022.961950
20. Hernández-Ruiz Á, García-Villanova B, Guerra-Hernández E, Amiano P, Ruiz-Canela M, Molina-Montes E. A review of A priori defined oxidative balance scores relative to their components and impact on health outcomes. Nutrients. (2019) 11:77. doi: 10.3390/nu11040774
21. Ahluwalia N, Dwyer J, Terry A, Moshfegh A, Johnson C. Update on NHANES dietary data: focus on collection, release, analytical considerations, and uses to inform public policy. Adv Nutr. (2016) 7:121–34. doi: 10.3945/an.115.009258
22. Zipf G, Chiappa M, Porter KS, Ostchega Y, Lewis BG, Dostal J. National health and nutrition examination survey: plan and operations, 1999–2010. Vital Health Stat 1. (2013) 56):1–37.
23. Latourte A, Dumurgier J, Paquet C, Richette P. Hyperuricemia, gout, and the brain-an update. Curr Rheumatol Rep. (2021) 23:82. doi: 10.1007/s11926-021-01050-6
24. Chen X, Wang C, Dong Z, Luo H, Ye C, Li L, et al. Interplay of sleep patterns and oxidative balance score on total cardiovascular disease risk: Insights from the National Health and Nutrition Examination Survey 2005–2018. J Glob Health. (2023) 13:04170. doi: 10.7189/jogh.14.04170
25. Rapa SF, Di Iorio BR, Campiglia P, Heidland A, Marzocco S. Inflammation and oxidative stress in chronic kidney disease-potential therapeutic role of minerals, vitamins and plant-derived metabolites. Int J Mol Sci. (2019) 21:263. doi: 10.3390/ijms21010263
26. Cao J, Liu Q, Hao H, Bu Y, Tian X, Wang T, et al. Lactobacillus paracasei X11 ameliorates hyperuricemia and modulates gut microbiota in mice. Front Immunol. (2022) 13:940228. doi: 10.3389/fimmu.2022.940228
27. Brzezińska O, Styrzyński F, Makowska J, Walczak K. Role of vitamin C in prophylaxis and treatment of gout-A literature review. Nutrients. (2021) 13:701. doi: 10.3390/nu13020701
28. Zhang Y, Qiu H. Folate, vitamin B6 and vitamin B12 intake in relation to hyperuricemia. J Clin Med. (2018) 7:210. doi: 10.3390/jcm7080210
29. Zhang YY, Qiu HB, Tian JW. Association between vitamin D and hyperuricemia among adults in the United States. Front Nutr. (2020) 7:592777. doi: 10.3389/fnut.2020.592777
30. Zhang Y, Qiu H. Dietary magnesium intake and hyperuricemia among US adults. Nutrients. (2018) 10:296. doi: 10.3390/nu10030296
31. Steunou AS, Babot M, Durand A, Bourbon ML, Liotenberg S, Miotello G, et al. Discriminating susceptibility of xanthine oxidoreductase family to metals. Microbiol Spectr. (2023) 11:e0481422. doi: 10.1128/spectrum.04814-22
32. Huang C, Gao E, Xiao F, Wu Q, Liu W, Luo Y, et al. The relative and interactive effects of urinary multiple metals exposure on hyperuricemia among urban elderly in China. Front Public Health. (2023) 11:1015202. doi: 10.3389/fpubh.2023.1015202
33. Behrendt I, Eichner G, Fasshauer M. Association of antioxidants use with all-cause and cause-specific mortality: A prospective study of the UK biobank. Antioxidants (Basel). (2020) 9:1287. doi: 10.3390/antiox9121287
34. Bjelakovic G, Gluud C. Surviving antioxidant supplements. J Natl Cancer Inst. (2007) 99:742–3. doi: 10.1093/jnci/djk211
35. Dong X, Li Y, Zhang L, Liu X, Tu R, Wang Y, et al. Independent and interactive effect of sitting time and physical activity on prevalence of hyperuricemia: the Henan Rural Cohort Study. Arthritis Res Ther. (2021) 23:7. doi: 10.1186/s13075-020-02385-8
36. Jee YH, Jung KJ, Park YB, Spiller W, Jee SH. Causal effect of alcohol consumption on hyperuricemia using a Mendelian randomization design. Int J Rheum Dis. (2019) 22:1912–9. doi: 10.1111/1756-185X.13668
37. Kim Y, Kang J. Association of urinary cotinine-verified smoking status with hyperuricemia: Analysis of population-based nationally representative data. Tob Induc Dis. (2020) 18:84. doi: 10.18332/tid/127269
38. Kim T, Kim Y, Kang J. Association of electronic cigarette exposure with serum uric acid level and hyperuricemia: 2016–2017 Korea National Health and Nutritional Examination Survey. PloS One. (2021) 16:e0247868. doi: 10.1371/journal.pone.0247868
39. Zhang M, Zhu X, Wu J, Huang Z, Zhao Z, Zhang X, et al. Prevalence of hyperuricemia among chinese adults: findings from two nationally representative cross-sectional surveys in 2015–16 and 2018–19. Front Immunol. (2021) 12:791983. doi: 10.3389/fimmu.2021.791983
40. Lei X, Xu Z, Chen W. Association of oxidative balance score with sleep quality: NHANES 2007–2014. J Affect Disord. (2023) 339:435–42. doi: 10.1016/j.jad.2023.07.040
41. Senoner T, Dichtl W. Oxidative stress in cardiovascular diseases: still a therapeutic target? Nutrients. (2019) 11:2090. doi: 10.3390/nu11092090
42. Griendling KK, Camargo LL, Rios FJ, Alves-Lopes R, Montezano AC, Touyz RM. Oxidative stress and hypertension. Circ Res. (2021) 128:993–1020. doi: 10.1161/CIRCRESAHA.121.318063
43. Furukawa S, Fujita T, Shimabukuro M, Iwaki M, Yamada Y, Nakajima Y, et al. Increased oxidative stress in obesity and its impact on metabolic syndrome. J Clin Invest. (2004) 114:1752–61. doi: 10.1172/JCI200421625
44. Filomeni G, De Zio D, Cecconi F. Oxidative stress and autophagy: the clash between damage and metabolic needs. Cell Death Differ. (2015) 22:377–88. doi: 10.1038/cdd.2014.150
45. Bortolotti M, Polito L, Battelli MG, Bolognesi A. Xanthine oxidoreductase: One enzyme for multiple physiological tasks. Redox Biol. (2021) 41:101882. doi: 10.1016/j.redox.2021.101882
46. Battelli MG, Bortolotti M, Polito L, Bolognesi A. The role of xanthine oxidoreductase and uric acid in metabolic syndrome. Biochim Biophys Acta Mol Basis Dis. (2018) 1864:2557–65. doi: 10.1016/j.bbadis.2018.05.003
47. Ndrepepa G. Uric acid and cardiovascular disease. Clin Chim Acta. (2018) 484:150–63. doi: 10.1016/j.cca.2018.05.046
48. Nasri H, Shirzad H, Baradaran A, Rafieian-Kopaei M. Antioxidant plants and diabetes mellitus. J Res Med Sci. (2015) 20:491–502. doi: 10.4103/1735-1995.163977
49. Sun Y, Sun J, Wang J, Gao T, Zhang H, Ma A. Association between vitamin C intake and risk of hyperuricemia in US adults. Asia Pac J Clin Nutr. (2018) 27:1271–6. doi: 10.6133/apjcn.201811_27(6).0014
50. Zhang L, Shi X, Yu J, Zhang P, Ma P, Sun Y. Dietary vitamin E intake was inversely associated with hyperuricemia in US adults: NHANES 2009–2014. Ann Nutr Metab. (2020) 76:354–60. doi: 10.1159/000509628
51. Zhang Y, Liu Y, Qiu H. Association between dietary zinc intake and hyperuricemia among adults in the United States. Nutrients. (2018) 10:568. doi: 10.3390/nu10050568
52. Eck P, Kwon O, Chen S, Mian O, Levine M. The human sodium-dependent ascorbic acid transporters SLC23A1 and SLC23A2 do not mediate ascorbic acid release in the proximal renal epithelial cell. Physiol Rep. (2013) 1:e00136. doi: 10.1002/phy2.136
53. Wu TK, Wei CW, Pan YR, Cherng SH, Chang WJ, Wang HF, et al. Vitamin C attenuates the toxic effect of aristolochic acid on renal tubular cells via decreasing oxidative stress−mediated cell death pathways. Mol Med Rep. (2015) 12:6086–92. doi: 10.3892/mmr.2015.4167
54. Alugoju P, Krishna Swamy VKD, Anthikapalli NVA, Tencomnao T. Health benefits of astaxanthin against age-related diseases of multiple organs: A comprehensive review. Crit Rev Food Sci Nutr. (2023) 63:10709–74. doi: 10.1080/10408398.2022.2084600
55. Ratliff BB, Abdulmahdi W, Pawar R, Wolin MS. Oxidant mechanisms in renal injury and disease. Antioxid Redox Signal. (2016) 25:119–46. doi: 10.1089/ars.2016.6665
56. Alam MA, Subhan N, Rahman MM, Uddin SJ, Reza HM, Sarker SD. Effect of citrus flavonoids, naringin and naringenin, on metabolic syndrome and their mechanisms of action. Adv Nutr. (2014) 5:404–17. doi: 10.3945/an.113.005603
57. Gantenbein KV, Kanaka-Gantenbein C. Mediterranean diet as an antioxidant: the impact on metabolic health and overall wellbeing. Nutrients. (2021) 13:1951. doi: 10.3390/nu13061951
58. Ray SK, Mukherjee S. Evolving interplay between dietary polyphenols and gut microbiota-an emerging importance in healthcare. Front Nutr. (2021) 8:634944. doi: 10.3389/fnut.2021.634944
59. Wan MLY, Co VA, El-Nezami H. Dietary polyphenol impact on gut health and microbiota. Crit Rev Food Sci Nutr. (2021) 61:690–711. doi: 10.1080/10408398.2020.1744512
60. Xiao L, Sun Y, Tsao R. Paradigm shift in phytochemicals research: evolution from antioxidant capacity to anti-inflammatory effect and to roles in gut health and metabolic syndrome. J Agric Food Chem. (2022) 70:8551–68. doi: 10.1021/acs.jafc.2c02326
61. Vaiserman AM, Koliada AK, Marotta F. Gut microbiota: A player in aging and a target for anti-aging intervention. Ageing Res Rev. (2017) 35:36–45. doi: 10.1016/j.arr.2017.01.001
62. Wang J, Chen Y, Zhong H, Chen F, Regenstein J, Hu X, et al. The gut microbiota as a target to control hyperuricemia pathogenesis: Potential mechanisms and therapeutic strategies. Crit Rev Food Sci Nutr. (2022) 62:3979–89. doi: 10.1080/10408398.2021.1874287
63. Yang S, Liu H, Fang XM, Yan F, Zhang Y. Signaling pathways in uric acid homeostasis and gout: From pathogenesis to therapeutic interventions. Int Immunopharmacol. (2024) 132:111932. doi: 10.1016/j.intimp.2024.111932
64. Brazo-Sayavera J, Aubert S, Barnes JD, González SA, Tremblay MS. Gender differences in physical activity and sedentary behavior: Results from over 200,000 Latin-American children and adolescents. PloS One. (2021) 16:e0255353. doi: 10.1371/journal.pone.0255353
65. Westrop SC, Melville CA, Muirhead F, McGarty AM. Gender differences in physical activity and sedentary behaviour in adults with intellectual disabilities: A systematic review and meta-analysis. J Appl Res Intellect Disabil. (2019) 32:1359–74. doi: 10.1111/jar.12648
66. Green DJ, Hopkins ND, Jones H, Thijssen DH, Eijsvogels TM, Yeap BB. Sex differences in vascular endothelial function and health in humans: impacts of exercise. Exp Physiol. (2016) 101:230–42. doi: 10.1113/EP085367
67. Barghouthy Y, Corrales M, Somani B. The relationship between modern fad diets and kidney stone disease: A systematic review of literature. Nutrients. (2021) 13:4270. doi: 10.3390/nu13124270
68. Faulkner JL, Belin de Chantemèle EJ. Sex hormones, aging and cardiometabolic syndrome. Biol Sex Differ. (2019) 10:30. doi: 10.1186/s13293-019-0246-6
69. Cheng X, Klaassen CD. Tissue distribution, ontogeny, and hormonal regulation of xenobiotic transporters in mouse kidneys. Drug Metab Dispos. (2009) 37:2178–85. doi: 10.1124/dmd.109.027177
70. Song P, Wang H, Xia W, Chang X, Wang M, An L. Prevalence and correlates of hyperuricemia in the middle-aged and older adults in China. Sci Rep. (2018) 8:4314. doi: 10.1038/s41598-018-22570-9
71. Liu L, Zhao T, Shan L, Cao L, Zhu X, Xue Y. Estradiol regulates intestinal ABCG2 to promote urate excretion via the PI3K/Akt pathway. Nutr Metab (Lond). (2021) 18:63. doi: 10.1186/s12986-021-00583-y
72. Zhang T, Gu Y, Meng G, Zhang Q, Liu L, Wu H, et al. Genetic risk, adherence to a healthy lifestyle, and hyperuricemia: the TCLSIH cohort study. Am J Med. (2023) 136:476–83.e5. doi: 10.1016/j.amjmed.2023.01.004
73. Mandal AK, Leask MP, Sumpter NA, Choi HK, Merriman TR, Mount DB. Genetic and physiological effects of insulin-like growth factor-1 (IGF-1) on human urate homeostasis. J Am Soc Nephrol. (2023) 34:451–66. doi: 10.1681/ASN.0000000000000054
74. Borghi C, Agabiti-Rosei E, Johnson RJ, Kielstein JT, Lurbe E, Mancia G, et al. Hyperuricaemia and gout in cardiovascular, metabolic and kidney disease. Eur J Intern Med. (2020) 80:1–11. doi: 10.1016/j.ejim.2020.07.006
75. Ben Salem C, Slim R, Fathallah N, Hmouda H. Drug-induced hyperuricaemia and gout. Rheumatol (Oxford). (2017) 56:679–88. doi: 10.1093/rheumatology/kew293
Keywords: oxidative balance score (OBS), Serum uric acid (sUA), hyperuricemia, national health and nutrition examination survey (NHANES), oxidative stress
Citation: Yang Y, Wu Z, An Z and Li S (2024) Association between oxidative balance score and serum uric acid and hyperuricemia: a population-based study from the NHANES (2011–2018). Front. Endocrinol. 15:1414075. doi: 10.3389/fendo.2024.1414075
Received: 08 April 2024; Accepted: 07 June 2024;
Published: 20 June 2024.
Edited by:
Syed Anees Ahmed, East Carolina University, United StatesReviewed by:
Anna Kęska, Józef Piłsudski University of Physical Education in Warsaw, PolandCopyright © 2024 Yang, Wu, An and Li. This is an open-access article distributed under the terms of the Creative Commons Attribution License (CC BY). The use, distribution or reproduction in other forums is permitted, provided the original author(s) and the copyright owner(s) are credited and that the original publication in this journal is cited, in accordance with accepted academic practice. No use, distribution or reproduction is permitted which does not comply with these terms.
*Correspondence: Shuangqing Li, MTI1OTU5NDQ3MUBxcS5jb20=
†These authors have contributed equally to this work and share first authorship
Disclaimer: All claims expressed in this article are solely those of the authors and do not necessarily represent those of their affiliated organizations, or those of the publisher, the editors and the reviewers. Any product that may be evaluated in this article or claim that may be made by its manufacturer is not guaranteed or endorsed by the publisher.
Research integrity at Frontiers
Learn more about the work of our research integrity team to safeguard the quality of each article we publish.