 Junyi Liu
 Jinghua Li1†
- 1Department of Ophthalmology, The Second Affiliated Hospital of Kunming Medical University, Kunming, China
- 2Department of Ophthalmology, Dali Bai Autonomous Prefecture People’s Hospital, Dali, China
Background: Diabetic retinopathy (DR) is considered one of the most severe complications of diabetes mellitus, but its pathogenesis is still unclear. We hypothesize that certain genes exert a pivotal influence on the progression of DR. This study explored biomarkers for the diagnosis and treatment of DR through bioinformatics analysis.
Methods: Within the GSE221521 and GSE189005 datasets, candidate genes were acquired from intersections of genes obtained using WGCNA and DESeq2 packages. Mendelian randomization (MR) analysis selected candidate biomarkers exhibiting causal relationships with DR. Receiver Operating Characteristic (ROC) analysis determined the diagnostic efficacy of biomarkers, the expression levels of biomarkers were verified in the GSE221521 and GSE189005 datasets, and a nomogram for diagnosing DR was constructed. Enrichment analysis delineated the roles and pathways associated with the biomarkers. Immune infiltration analysis analyzed the differences in immune cells between DR and control groups. The miRNet and networkanalyst databases were then used to predict the transcription factors (TFs) and miRNAs, respectively, of biomarkers. Finally, RT-qPCR was used to verify the expression of the biomarkers in vitro.
Results: MR analysis identified 13 candidate biomarkers that had causal relationships with DR. The ROC curve demonstrated favorable diagnostic performance of three biomarkers (OSER1, HIPK2, and DDRGK1) for DR, and their expression trends were consistent across GSE221521 and GSE189005 datasets. The calibration curves and ROC curves indicated good predictive performance of the nomogram. The biomarkers were enriched in pathways of immune, cancer, amino acid metabolism, and oxidative phosphorylation. Ten immune cell lines showed notable disparities between the DR and control groups. Among them, effector memory CD8+ T cells, plasmacytoid dendritic cells, and activated CD4+ T cells exhibited good correlation with biomarker expression. The TF-mRNA-miRNA network suggested that hsa-mir-92a-3p, GATA2, and RELA play important roles in biomarker targeting for DR. RT-qPCR results also demonstrated a notably high expression of HIPK2 in patients with DR, whereas notably low expression of OSER1.
Conclusion: OSER1, HIPK2, and DDRGK1 were identified as biomarkers for DR. The study findings provide novel insights into the pathogenesis of DR.
1 Introduction
Diabetic retinopathy (DR) is a disease that causes vision loss in adults aged 20 to 74 years (1). The incidence of visual impairment and blindness caused by DR in low- and middle-income countries has increased significantly due to the increasing incidence of type 2 diabetes (2). About one-third of the 260 million people with diabetes have DR, and one-third of these patients are diagnosed with advanced DR or diabetic macular edema, and most of these patients have severe vision loss and a serious impact on their quality of life (3). In China, the incidence of diabetes is steadily increasing, with projections indicating that by 2045, approximately 174 million individuals will be diagnosed with diabetes (4). The diagnosis of DR mainly depends on history of diabetes and changes in the fundus of the eye as assessed by fundus photography, optical coherence tomography, and fundus fluorescence angiography (5). At present, DR is diagnosed solely based on the clinical manifestations, and the corresponding symptomatic treatment is based on the findings of fundus evaluation, but there is a lack of predictive and effective evaluation methods for DR. Among the many risk factors for DR, the most relevant factors are diabetes progression and poor glycemic control (6). The pathogenesis of DR is complicated, involving multiple molecular and biochemical mechanisms related to the homeostasis of retinal blood vessels and cells. The treatment for DR mainly includes intravitreous drug injection and retinal laser photocoagulation (7)Due to our lack of understanding of DR pathogenesis, there is also a lack of effective clinical treatment options. Therefore, it becomes vital to identify robust biomarkers for DR and further investigate the mechanisms underlying DR pathogenesis. The ideal therapeutic strategy for the clinical identification and management of DR should aim to enhance the patients’ quality of life to the fullest.
Mendelian randomization (MR) is a novel epidemiological design tool that follows the genetic law of random distribution of alleles from parents to offspring (8). This tool has been increasingly used for establishing causal relationships between exposure factors and disease risks, made possible through advancements in statistical techniques, availability of extensive datasets, progress in epigenetics research, and the emergence of various ‘omics’ technologies (9). Therefore, in this study, we used MR to screen for biomarkers that exhibit a causal relationship with DR.
We hypothesize that certain genes, which are biomarkers, exert a pivotal influence on the progression of DR. In this study, differential expression analysis, weighted gene co-expression network analysis (WGCNA), functional annotation analysis, protein-protein interaction (PPI) network construction, and MR analysis of data related to DR in the Gene Expression Omnibus (GEO) and the Integrative Epidemiology Unit (IEU) Open genome-wide association study (GWAS) databases identified three biomarkers with a causal relationship with DR. Furthermore, functional enrichment analysis, immune infiltration analysis, regulatory network construction, and drug prediction were performed, and the expression levels of these biomarkers were verified in the two datasets by RT-qPCR. Finally, a diagnostic nomogram was constructed, which could provide new insights into the diagnosis and treatment of DR. The flowchart illustrating the entire analysis process was depicted in Figure 1.
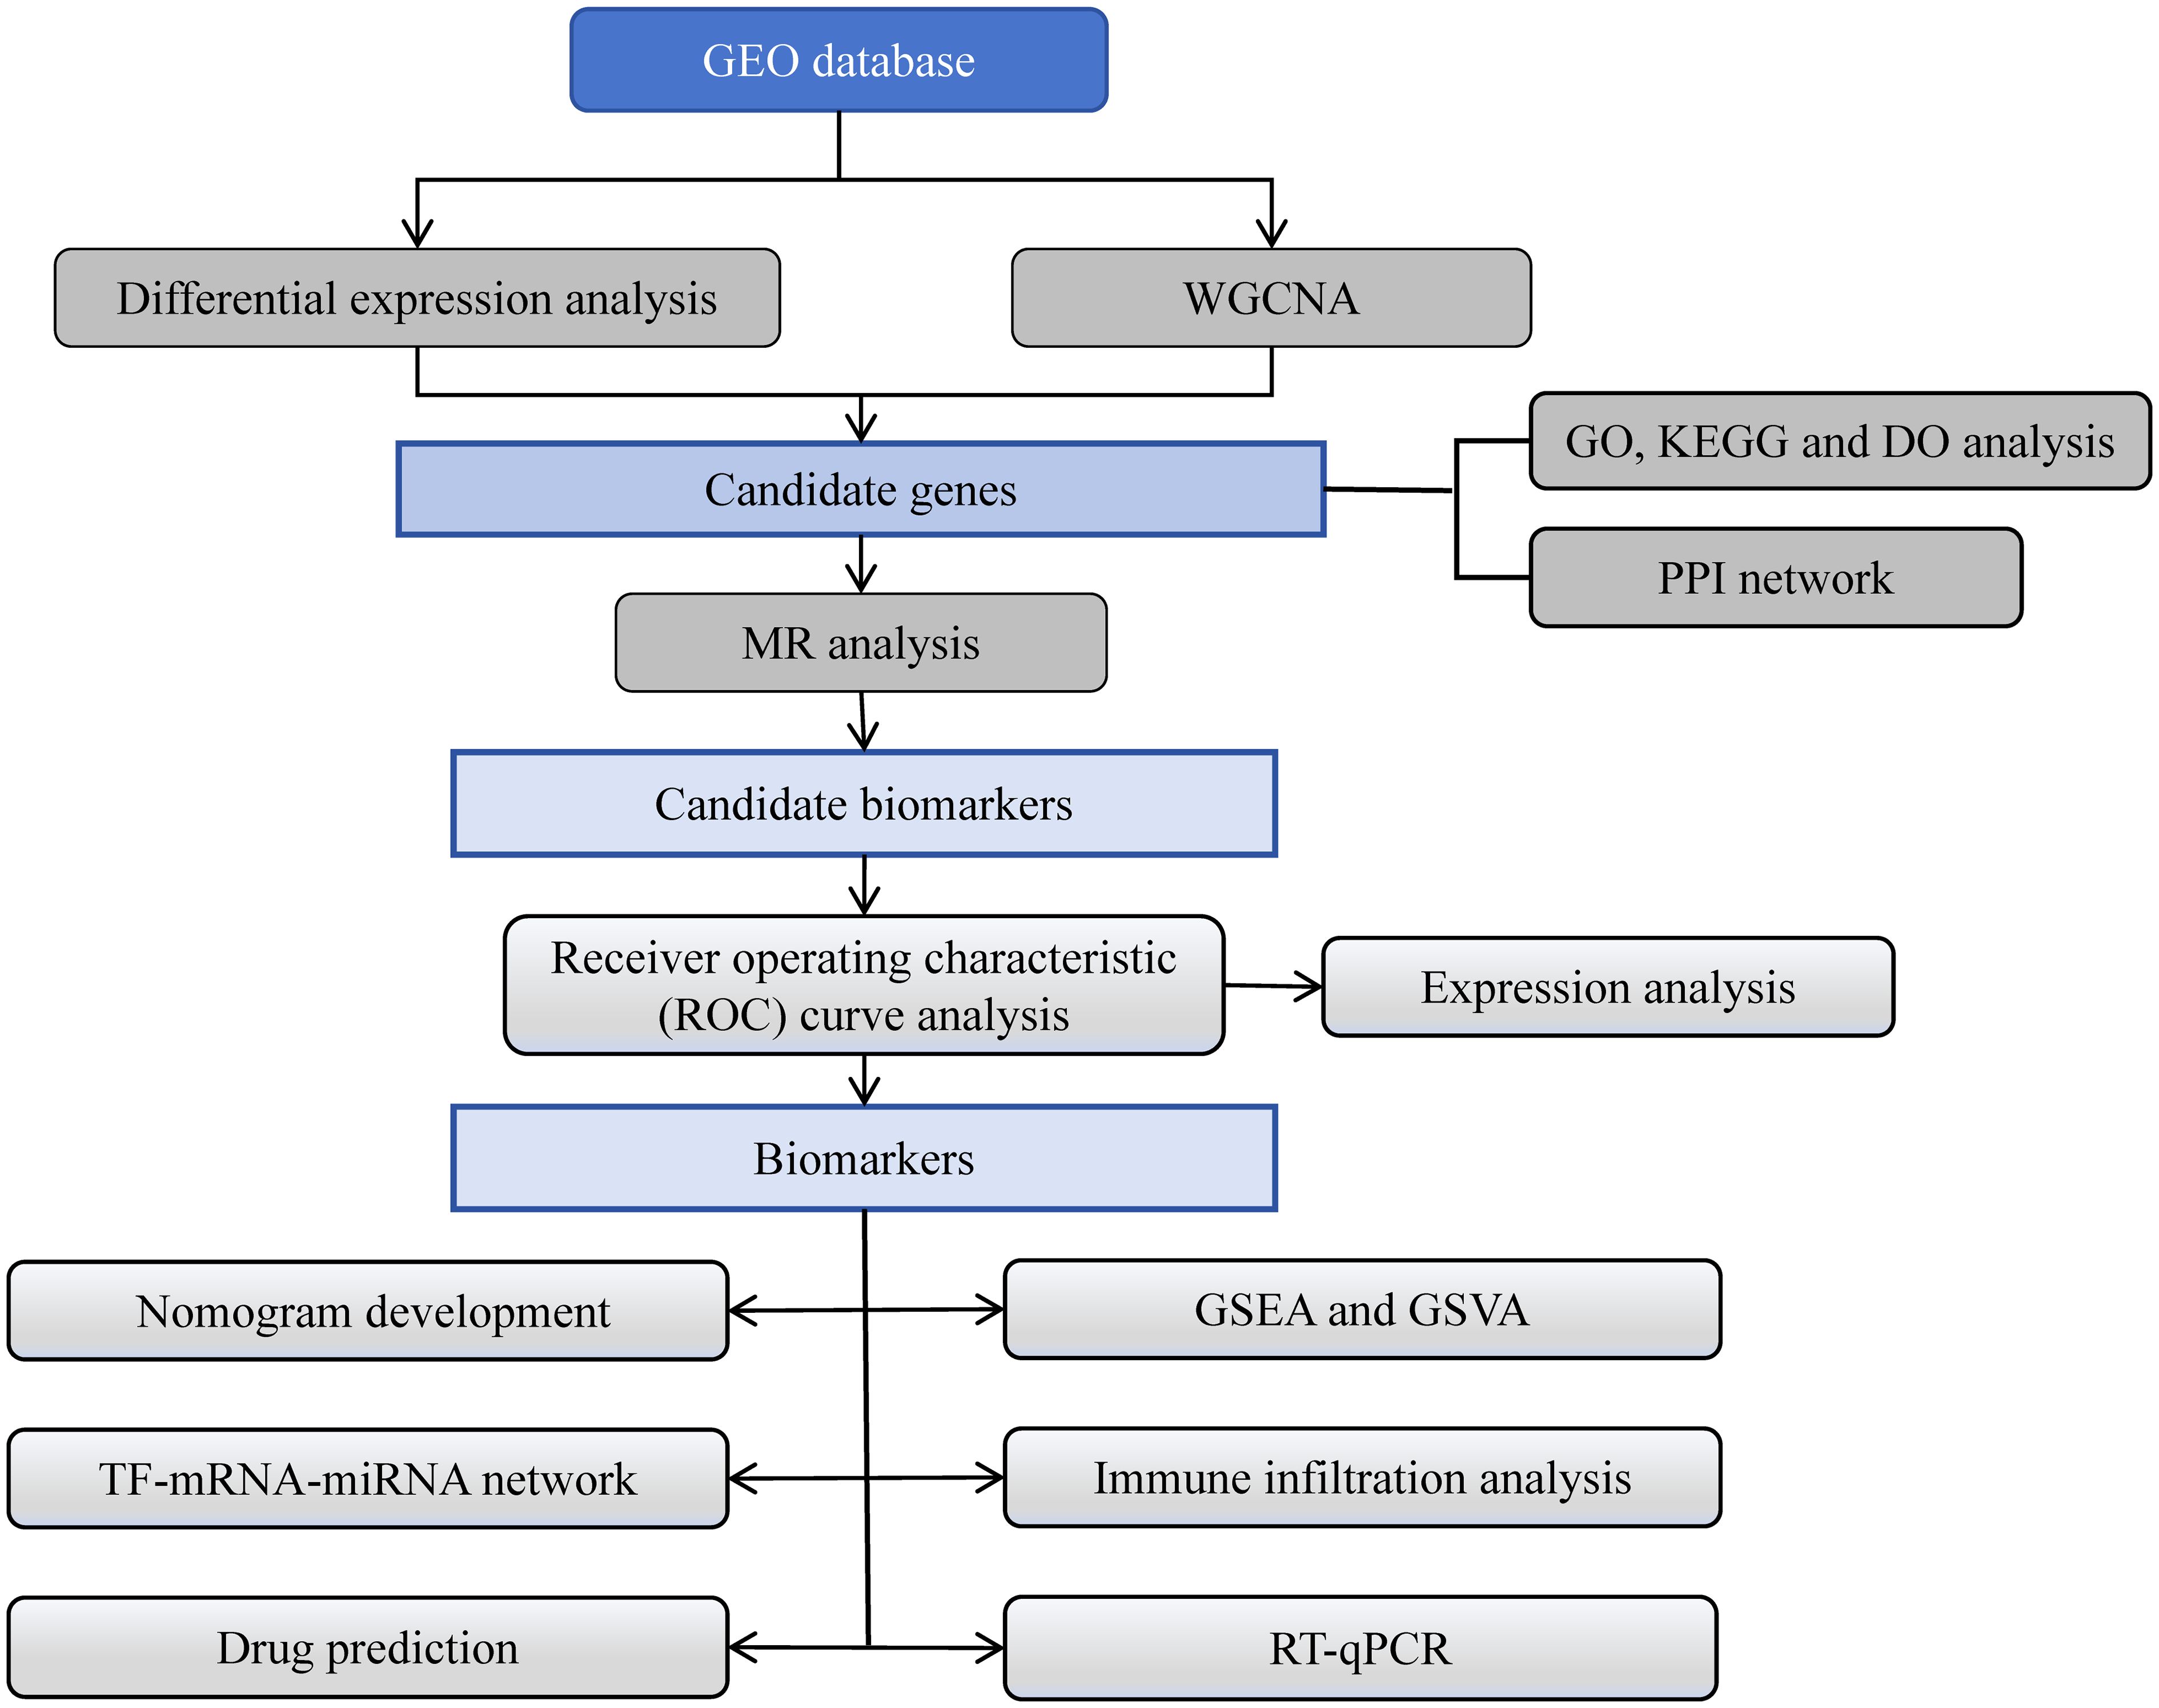
Figure 1 The flowchart of entire analysis process.
2 Materials and methods
2.1 Data source
The GEO database (https://www.ncbi.nlm.nih.gov/) was used to acquire mRNA expression profile of the GSE221521 and GSE189005 datasets with the GPL24676 and GPL23126 platforms, respectively. The study included 41 and 50 venous blood samples of DR and normal samples, respectively, in GSE221521 as the training set. GSE189005 consisted of 10 and 9 venous blood samples of DR and normal samples, respectively. The IEU OpenGWAS database (https://gwas.mrcieu.ac.uk/) was employed to obtain the GWAS ID and data for exposure factors and DR. DR was considered as the outcome (finn-b-DM_RETINOPATHY). The finn-b-DM_RETINOPATHY dataset comprised of 14,584 DR samples and 16,380,459 single nucleotide polymorphisms (SNPs).
2.2 Differential expression analysis
In the GSE221521 dataset, DR-differentially expressed genes (DEGs) between DR and normal samples were identified conducted utilizing the DESeq2 package (v 1.34.0) (|Log2FC| > 0.5, p < 0.05) (10). The P value was corrected by Benjamini-Hochberg (BH) method. The volcano map and heat map were drawn employing the ggplot2 (v 3.4.1) and ComplexHeatmap (v 2.16.0) packages, respectively (11, 12).
2.3 WGCNA
The WGCNA was implemented to seek DR key module genes. The WGCNA package (v 1.71) was used to perform hierarchical clustering of all samples in the GSE221521 dataset, and outliers were removed (13). Then, the optimal soft threshold (β) was determined by realizing scale-free distribution and setting R2 above 0.85. Based on the β value, the module was segmented by applying the standard of hybrid dynamic tree cutting algorithm (deepSplit = 2, mergeCutHeight = 0.3), with each module containing at least 100 genes. Modules with an absolute correlation greater than 0.6 with DR were further analyzed, and genes in these module were DR key module genes.
2.4 Identification and functional annotation analysis of candidate genes
The ggVennDiagram package (v 1.2.2) was used to determine the overlap between DR-DEGs and DR key module genes, and candidate genes were identified if there was overlap (14). The clusterProfiler package (v 4.6.0) was used to perform functional annotation analysis, including the Gene Ontology (GO) functions, Kyoto Encyclopedia of Genes and Genomes (KEGG) pathways, and the disease ontology (DO) enrichment analysis (p < 0.05) (15). The STRING database (https://string-db.org/) was employed to predict interactions between proteins corresponding to candidate genes with a confidence score threshold of 0.4. The protein-protein interaction (PPI) network was subsequently displayed adopting Cytoscape (v 3.10.0) (16).
2.5 MR analysis
The candidate genes served as exposure factors, and DR was used as the outcome for MR analysis. In MR studies, the following three assumptions were made: (a) the presence of a significant correlation between instrumental variables (IVs) and exposure factors is imperative, (b) IVs should not be affected by confounding factors related to exposure factors or outcome, and (c) IVs can affect the outcome only through exposure factors.
The mv harmonize data function in the TwoSampleMR package (v 0.5.6) was used to unify effect alleles and effect sizes (17). Next, SNPs exhibiting significant correlation with candidate genes were selected as IVs (p<5×10⁻⁸), and IVs for linkage disequilibrium (LD) were removed (clump=TRUE, R2 = 0.001, kb=10000). The function extract instruments of TwoSampleMR package (v 0.5.8) was employed for this procedure (17). MR analysis of causality was carried out by five methods—MR Egger, Weighted median, Inverse variance weighted (IVW), Simple mode, Weighted mode), of which results of the IVW were the primary reference (p<0.05) (18–22). Scatter plots, forest plots, and funnel plots were prepared to visualize the results. An odds ratio (OR) greater than 1 indicated that the gene was a risk factor for DR, while the value was less than 1, the gene was considered a protective factor.
2.6 Sensitivity analysis for MR analysis
The reliability of MR analysis was assessed via sensitivity analysis, consisting of heterogeneity and horizontal pleiotropy tests, as well as Leave-One-Out (LOO) analysis. Initially, the Cochran’s Q test for heterogeneity was conducted, with p>0.05 indicating the absence of heterogeneity. Subsequently, a horizontal pleiotropy test was performed by employing the MR pleiotropy test function, with p>0.05 indicating that SNPs affected the outcome only through exposure factors. Finally, the LOO analysis was conducted using the MR leave one out function to determine whether a single SNP could significantly alter the overall effects. Genes exhibiting causal relationships with the outcome and passing the sensitivity analysis were identified as potential.
2.7 Receiver operating characteristic curve analysis and nomogram development
The pROC (v 1.18.0) (23) package was employed to plot ROC curves of potential biomarkers in the GSE221521 and GSE189005 datasets, and genes exhibiting area under the curve (AUC) values greater than 0.7 were considered reliable biomarkers. Subsequently, the biomarker expression levels in the GSE221521 and GSE189005 datasets were validated. Based on the expression of biomarkers, the rms package (v 6.5.0) was used to develop a diagnosis nomogram for DR patients (24). Calibration curves and ROC curves were constructed to evaluate the accuracy and reliability of the nomogram predictions. The calibration curve was plotted using the calibrate function and boot method.
2.8 Gene set enrichment analysis and gene set variation analysis
Using c2.cp.kegg.v2023.1.Hs.symbols.gmt as the background gene set, GSEA of biomarkers was conducted with R clusterProfiler (v 4.6.0) (p<0.05) (15). Based on biomarker expression, all samples in the GSE221521 dataset were reorganized into high and low expression groups. The GSVA package (v 1.46.0) was used for GSVA of biomarkers in these two groups (25).
2.9 Immune infiltration analysis
The single sample GSEA (ssGSEA) algorithm was used to assess the abundance of 28 immune cells in the samples of DR and control groups. The Wilcoxon test was used to compare the difference in immune cell infiltration between the two groups (p<0.05). The Spearman correlation coefficient between distinct immune cells, as well as between biomarkers and these cells was computed (|r|>0.3, p<0.05).
2.10 Construction of regulatory network and drug prediction
The miRNA targeting biomarkers were predicted using the miRNet database (https://www.mirnet.ca), while the transcription factors (TFs) regulating biomarkers were obtained from the networkanalyst database (http://www.networkanalyst.ca). Cytoscape (v 3.10.0) was then used to construct a regulatory network involving TF-mRNA-miRNA interactions (16). In order to explore potential drugs for the treatment of DR, targeted drugs for biomarkers were searched based on Drug Signatures Database (DSigDB) database (http://tanlab.ucdenver.edu/DSigDB), and results with p < 0.05 were selected.
2.11 Reverse transcription-quantitative polymerase chain reaction
Peripheral venous blood samples were collected from 20 patients in the Second affiliated Hospital of Kunming Medical University, including 10 patients with DR and 10 patients without DR. These samples were divided into two parts, each comprising of five DR samples and five control samples, and RT-qPCR was performed on each part to verify the screened biomarkers. This experiment was approved by the Institutional Review Board of the Second affiliated Hospital of Kunming Medical University (Review -PJ- Research -2024–134). TRIzol (Ambion, Austin, TX) was used to separate total RNA from 10 samples following the manufacturer’s instructions. The concentration of RNA was extracted using NanoPhotometer N50 (IMPLEN GmbH), and the purity of RNA was assessed by measuring the ratio of A260/A280. The SureScript-First-strand-cDRA-synthesis-kit (Servicebio, Wuhan, China) was used for reverse transcription of total RNA into cDNA as per the manufacturer’s instructions. The temperature was set to 25°C for 5 minutes, followed by 50°C for 15 minutes, then raised to 85°C for a duration of 5 seconds. Finally, maintain the temperature at 4°C during reverse transcription. Subsequently, qPCR analysis was performed using the 2xUniversal Blue SYBR Green qPCR Master Mix (Servicebio) according to the provided manual. The amplification conditions were 95°C for 1min, 95°C for 20s, 55°C for 20s, and 72°C for 30s. The primer sequences for PCR are listed in Supplementary Table 1. Gene expression levels were normalized to GAPDH as an internal reference and calculated using the 2−ΔΔCq method (26). The characteristics of patients are listed in Supplementary Table 2.
2.12 Statistical analysis
R software (v 4.2.1) (https://www.R-project.org/.) was utilized to process and analyze data. Statistical analysis was performed using the wilcox.test method in R.
3 Results
3.1 Acquisition of candidate genes
The differential expression analysis between DR and normal samples in GSE221521 yielded 2,283 DR-DEGs, comprising 1,304 upregulated DR-DEGs and 979 downregulated DR-DEGs. The volcano map illustrates both upregulated and downregulated DR-DEGs (Figure 2A). The heatmap displays the expression of the top 50 DR-DEGs, ranked based on p.adj values, in the two groups (Figure 2B).
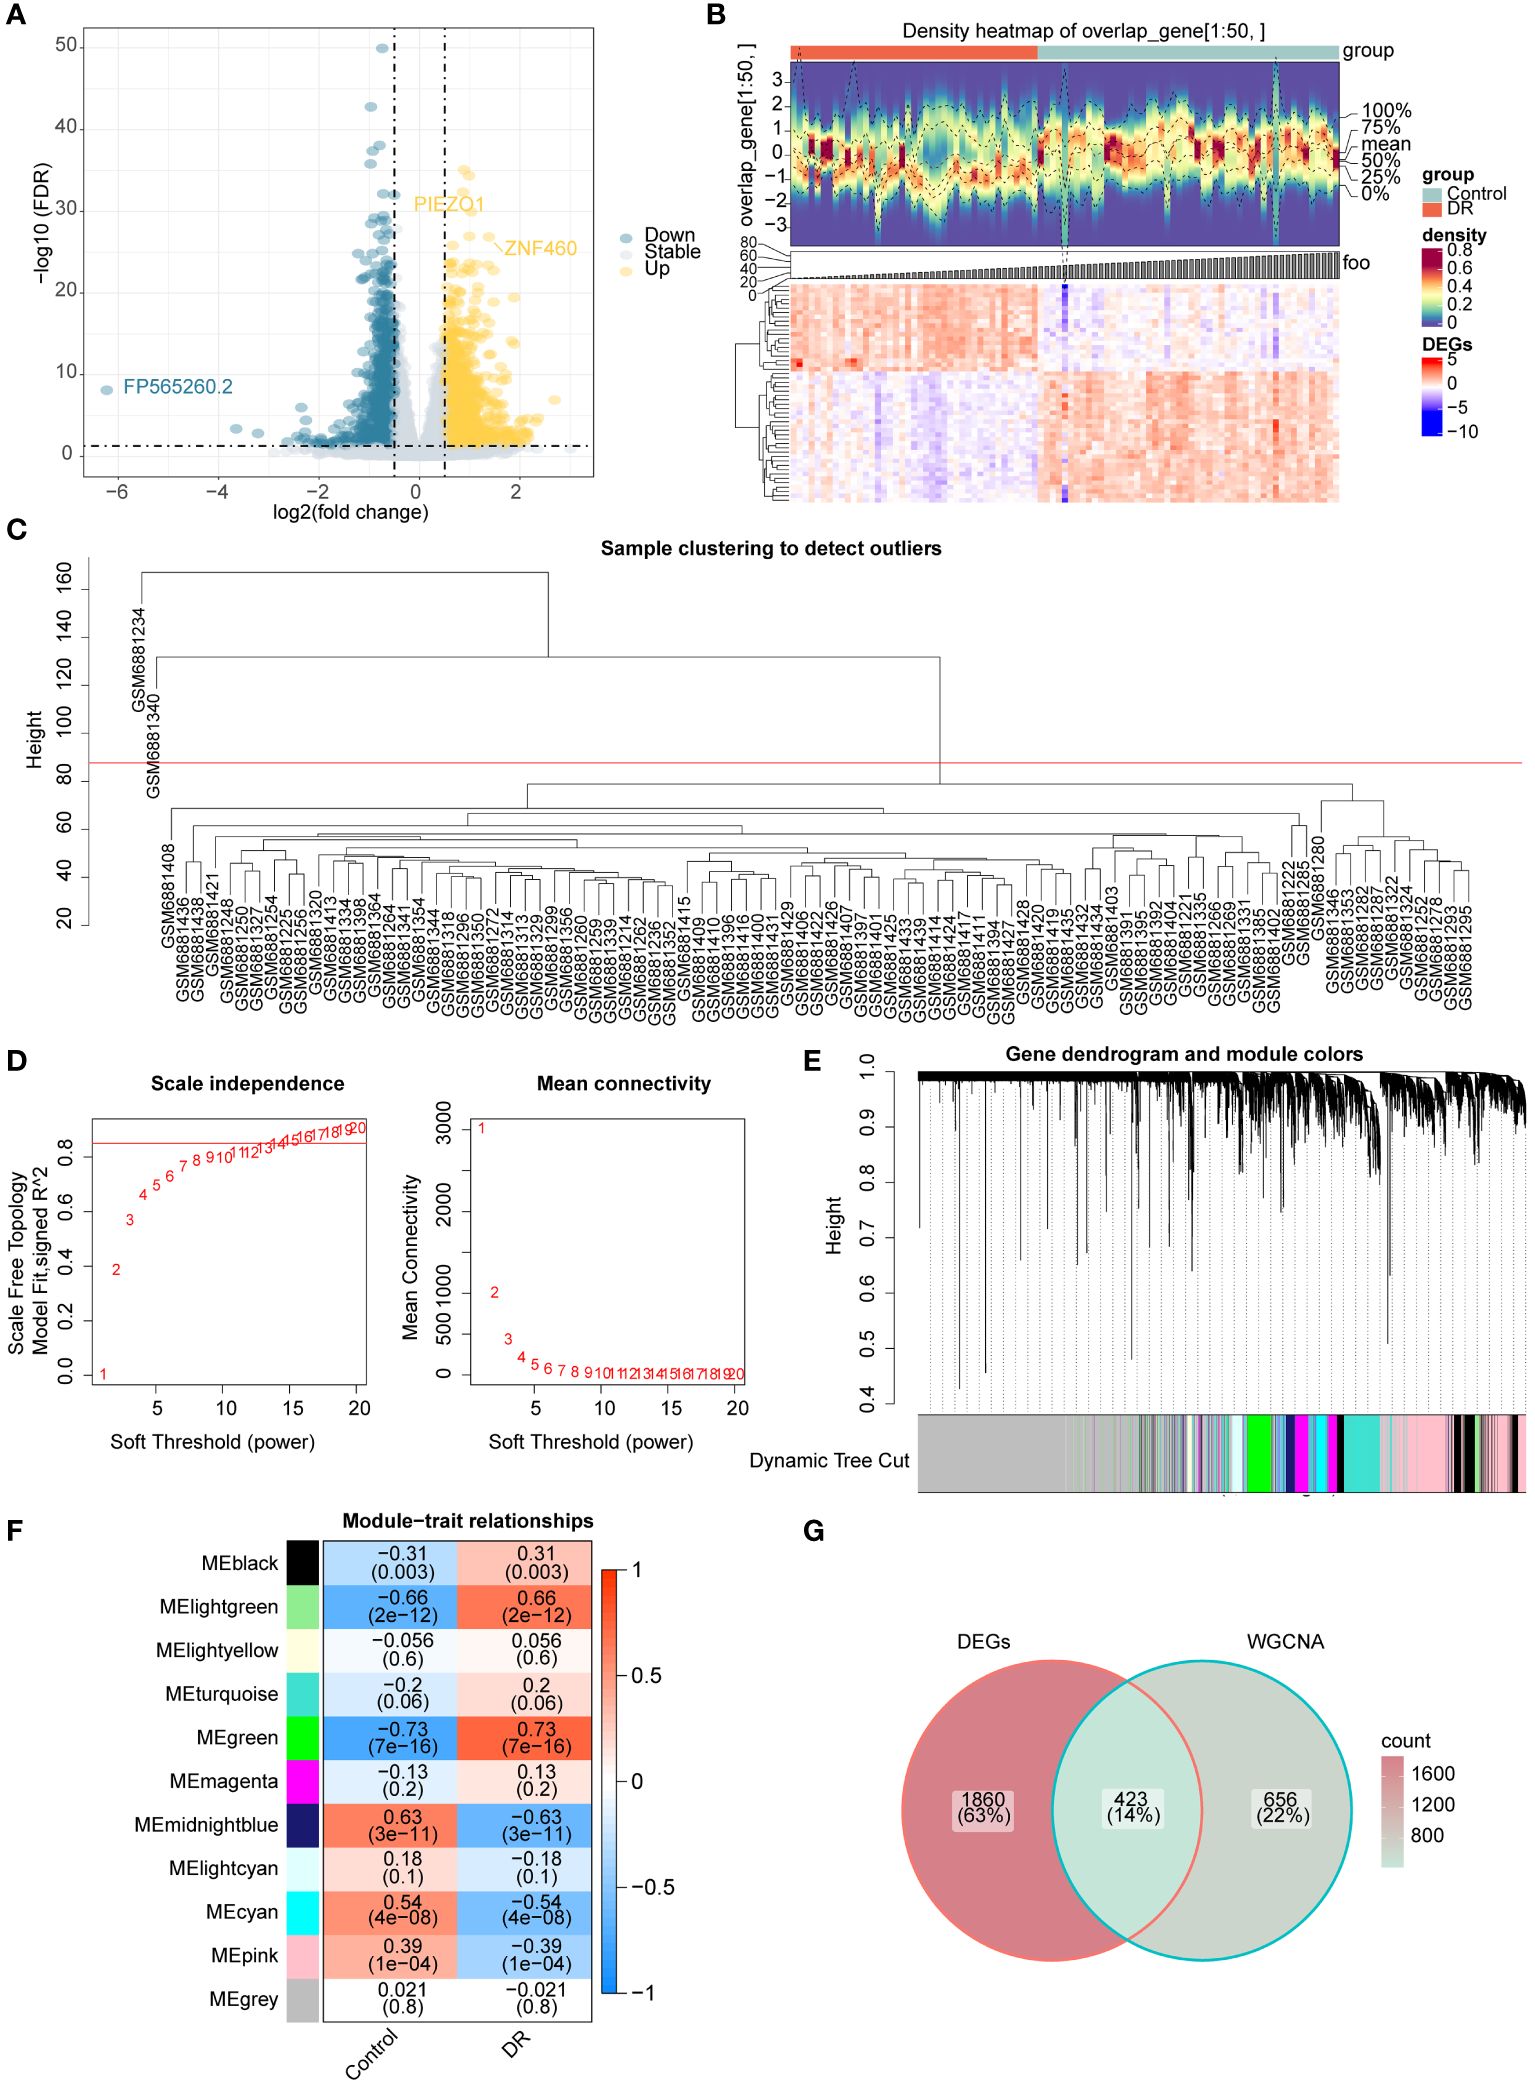
Figure 2 Acquisition of candidate genes (A) Volcano map of DR-DEGs (B) Heat map of DR-DEGs (C-F) WGCNA (C) Sample clustering diagram (D) The selection of soft threshold β (E) Module clustering diagram (F) the relevance heat map of gene modules and DR (G) Venn map of candidate genes.
Sample clustering analysis revealed two outliers (GSM6881234 and GSM6881340) in the GSE221521 dataset and were removed for subsequent analysis (Figure 2C). The β value was determined to be 13 by setting a threshold of scale-free R2 above 0.85 to construct gene modules (Figure 2D). As a result, 10 modules were obtained by the hybrid dynamic tree cutting algorithm (Figure 2E). Subsequently, the correlation between the green (R=0.73), light green (R=0.66), and midnight blue (R=0.63) module genes with DR were greater than 0.6, and a total of 1,079 DR module genes were obtained from these modules (Figure 2F). Finally, 423 candidate genes were determined based on interaction between 2,283 DR-DEGs and 1,079 DR module genes (Figure 2G).
3.2 Enrichment analysis of candidate genes
In order to understand the functions, diseases, and pathways of candidate genes, enrichment analysis was performed. The GO functions of candidate genes included semaphorin receptor complex, semaphorin-plexin signaling pathway involved in axon guidance, and regulation of cell shape (Figure 3A). The KEGG enrichment analysis showed that candidate genes were markedly enriched in endometrial cancer, basal cell carcinoma, fatty acid biosynthesis, and apoptosis (Figure 3B). The DO enrichment analysis showed that candidate genes were significantly related to meningioma, tuberous sclerosis, intracranial arterial disease, and cerebral arterial disease (Figure 3C).
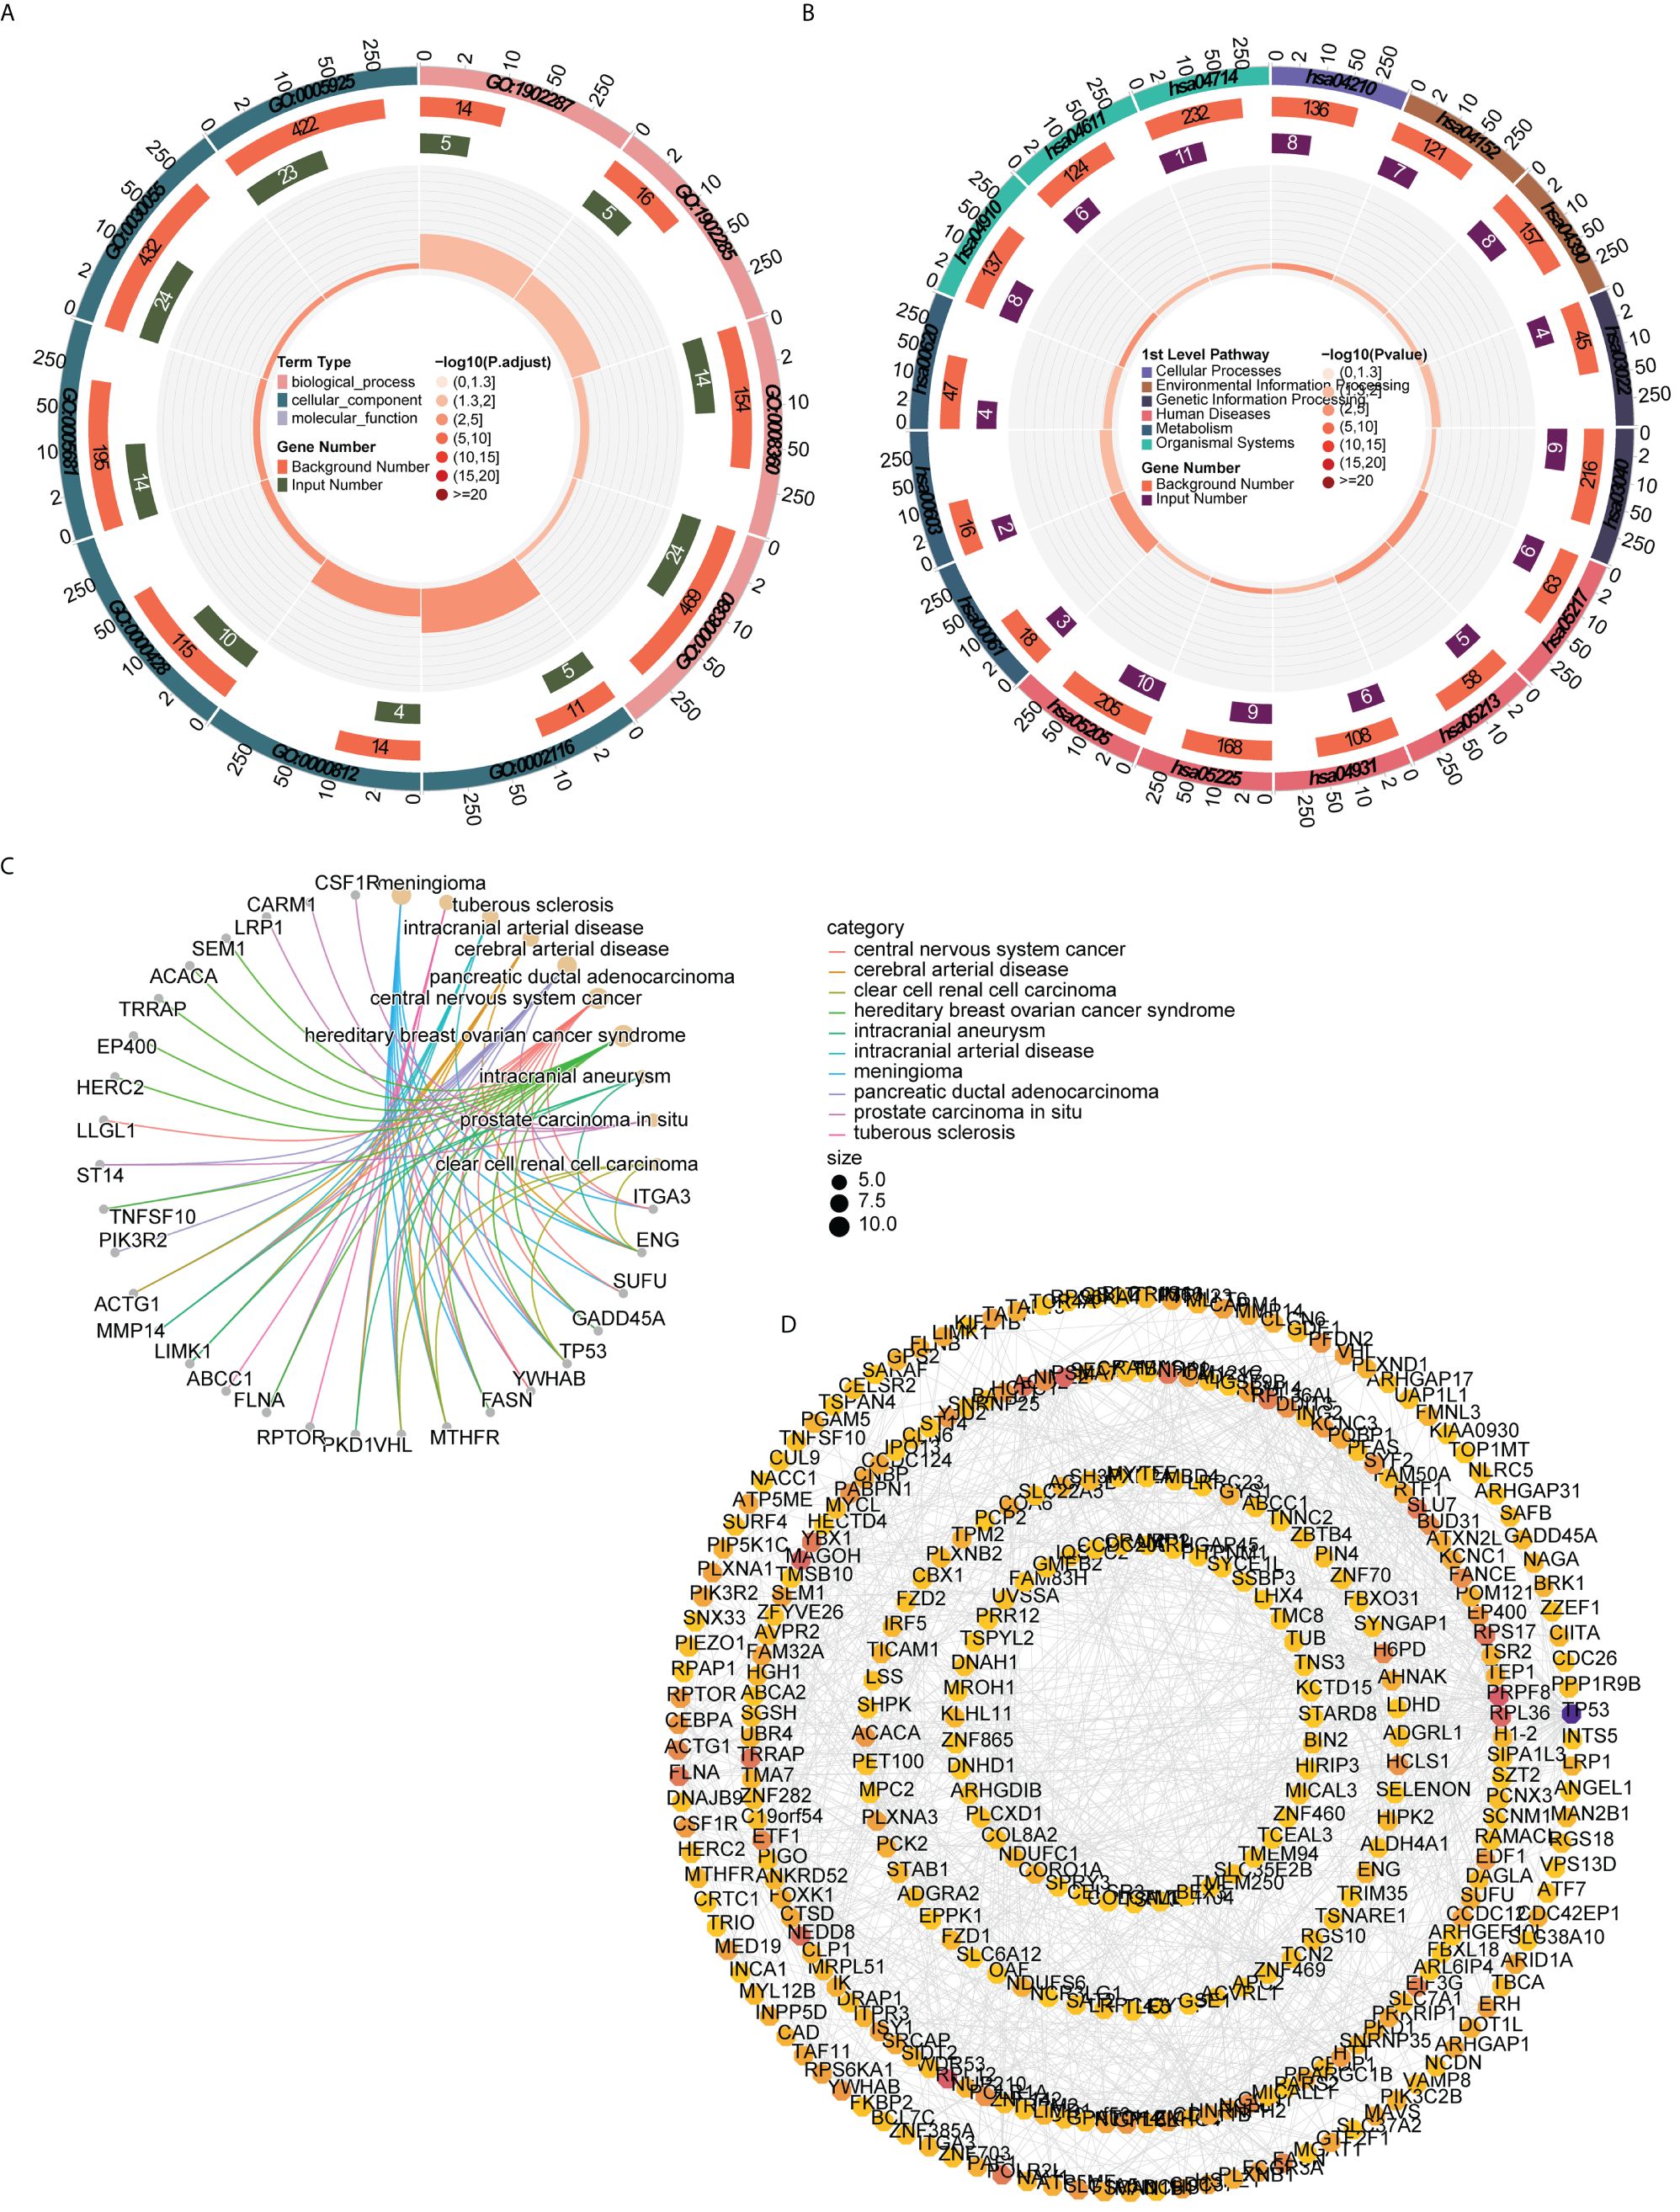
Figure 3 Functional enrichment analysis and PPI network (A) GO functions enriched by candidate genes (B) KEGG pathways enriched by candidate genes (C) Disease enriched by candidate genes (D) PPI network of candidate gene.
The PPI network constructed to investigate the interactions among genes contained 324 nodes and 815 edges. AGO2 had a direct interaction with 18 genes (e.g., CLCN6, UBR4, SIDT2), whereas ACTG1 interacted with 14 genes (e.g., SRCAP, ITGA3, HCLS1) (Figure 3D).
3.3 Candidate biomarkers exhibiting significant causal relationships with DR
The 423 candidate genes served as exposure factors, with 176 genes exhibiting SNPs, and DR was used as the outcome for the MR analysis. The IVW method was used to identify 13 candidate biomarkers (OSER1, HIPK2, DDRGK1, PCK2, IK, IRF5, COLGALT1, TRPM2, SLC38A10, TSNARE1, PAQR7, ZNF142, and ARID1A) that exhibited significant causal relationships with DR (p<0.05). Among them, eight candidate biomarkers (OSER1, HIPK2, DDRGK1, PCK2, TRPM2, SLC38A10, TSNARE1, and ZNF142) exhibited an OR greater than 1 and identified as risk factors for DR. Conversely, five candidate biomarkers (IK, IRF5, COLGALT1, PAQR7, and ARID1A) demonstrated an OR less than 1 and were considered protective factors for DR (Table 1).
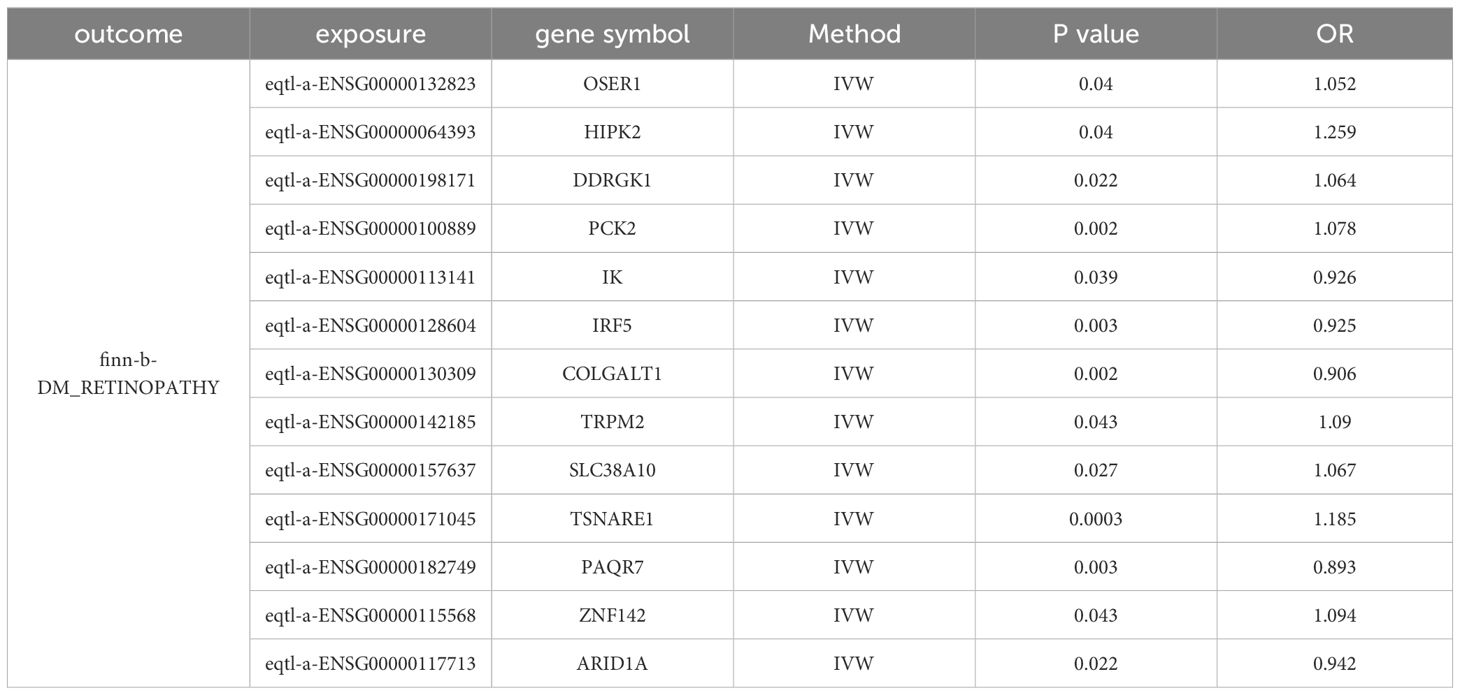
Table 1 MR analysis results (IVW).
In the scatter plot, the effect of SNPs of OSER1, HIPK2, DDRGK1, PCK2,TRPM2, SLC38A10, TSNARE1, and ZNF142 on DR were positively correlated overall, while the effect of SNPs of IK, IRF5, COLGALT1, PAQR7, and ARID1A on DR were negatively correlated overall. These results confirmed the above conclusions (Supplementary Figure 1). Consistent with the previous results, the forest map illustrated that the MR effect size of risk factors for DR exceeded 0 and the MR effect sizes of risk factor were less than 0, providing further evidence that IVs exhibit no or weak correlation with outcome (Supplementary Figure 2). At last, the funnel plot illustrated that MR analysis of 13 candidate biomarkers and DR was consistent with Mendel’s second random law (Supplementary Figure 3).
Sensitivity analysis results showed that all 13 candidate biomarkers passed the tests of horizontal pleiotropy and heterogeneity, and LOO analysis affirming the robustness and reliability of our MR analysis (Supplementary Tables 3, 4, Supplementary Figure 4).
3.4 OSER1, HIPK2, and DDRGK1 served as dependable biomarkers
The AUC values in ROC curves of OSER1, HIPK2, and DDRGK1 were 0.868, 0.815, 0.806, respectively, in GSE221521, and 0.700, 0.833, and 0.722, respectively, in GSE189005 (Figures 4A–F). Given that all the AUC values exceeded 0.7, these three genes could serve as reliable biomarkers. The expression levels of OSER1, DDRGK1 and HIPK2 were consistent in GSE221521 and GSE189005 (Figures 4G, H). RT-qPCR results also demonstrated a significant high expression of HIPK2 in patients with DR, whereas OSER1 exhibited a significant lower expression level (Figures 4I–K, Supplementary Figure S5). A nomogram was constructed based on the expression levels of OSER1, HIPK2, and DDRGK1 (Figure 5A). The AUC value for the nomogram was 0.942, and the calibration curve of the nomogram was almost a straight line, indicating a good predictive performance of the nomogram (Figures 5B, C).
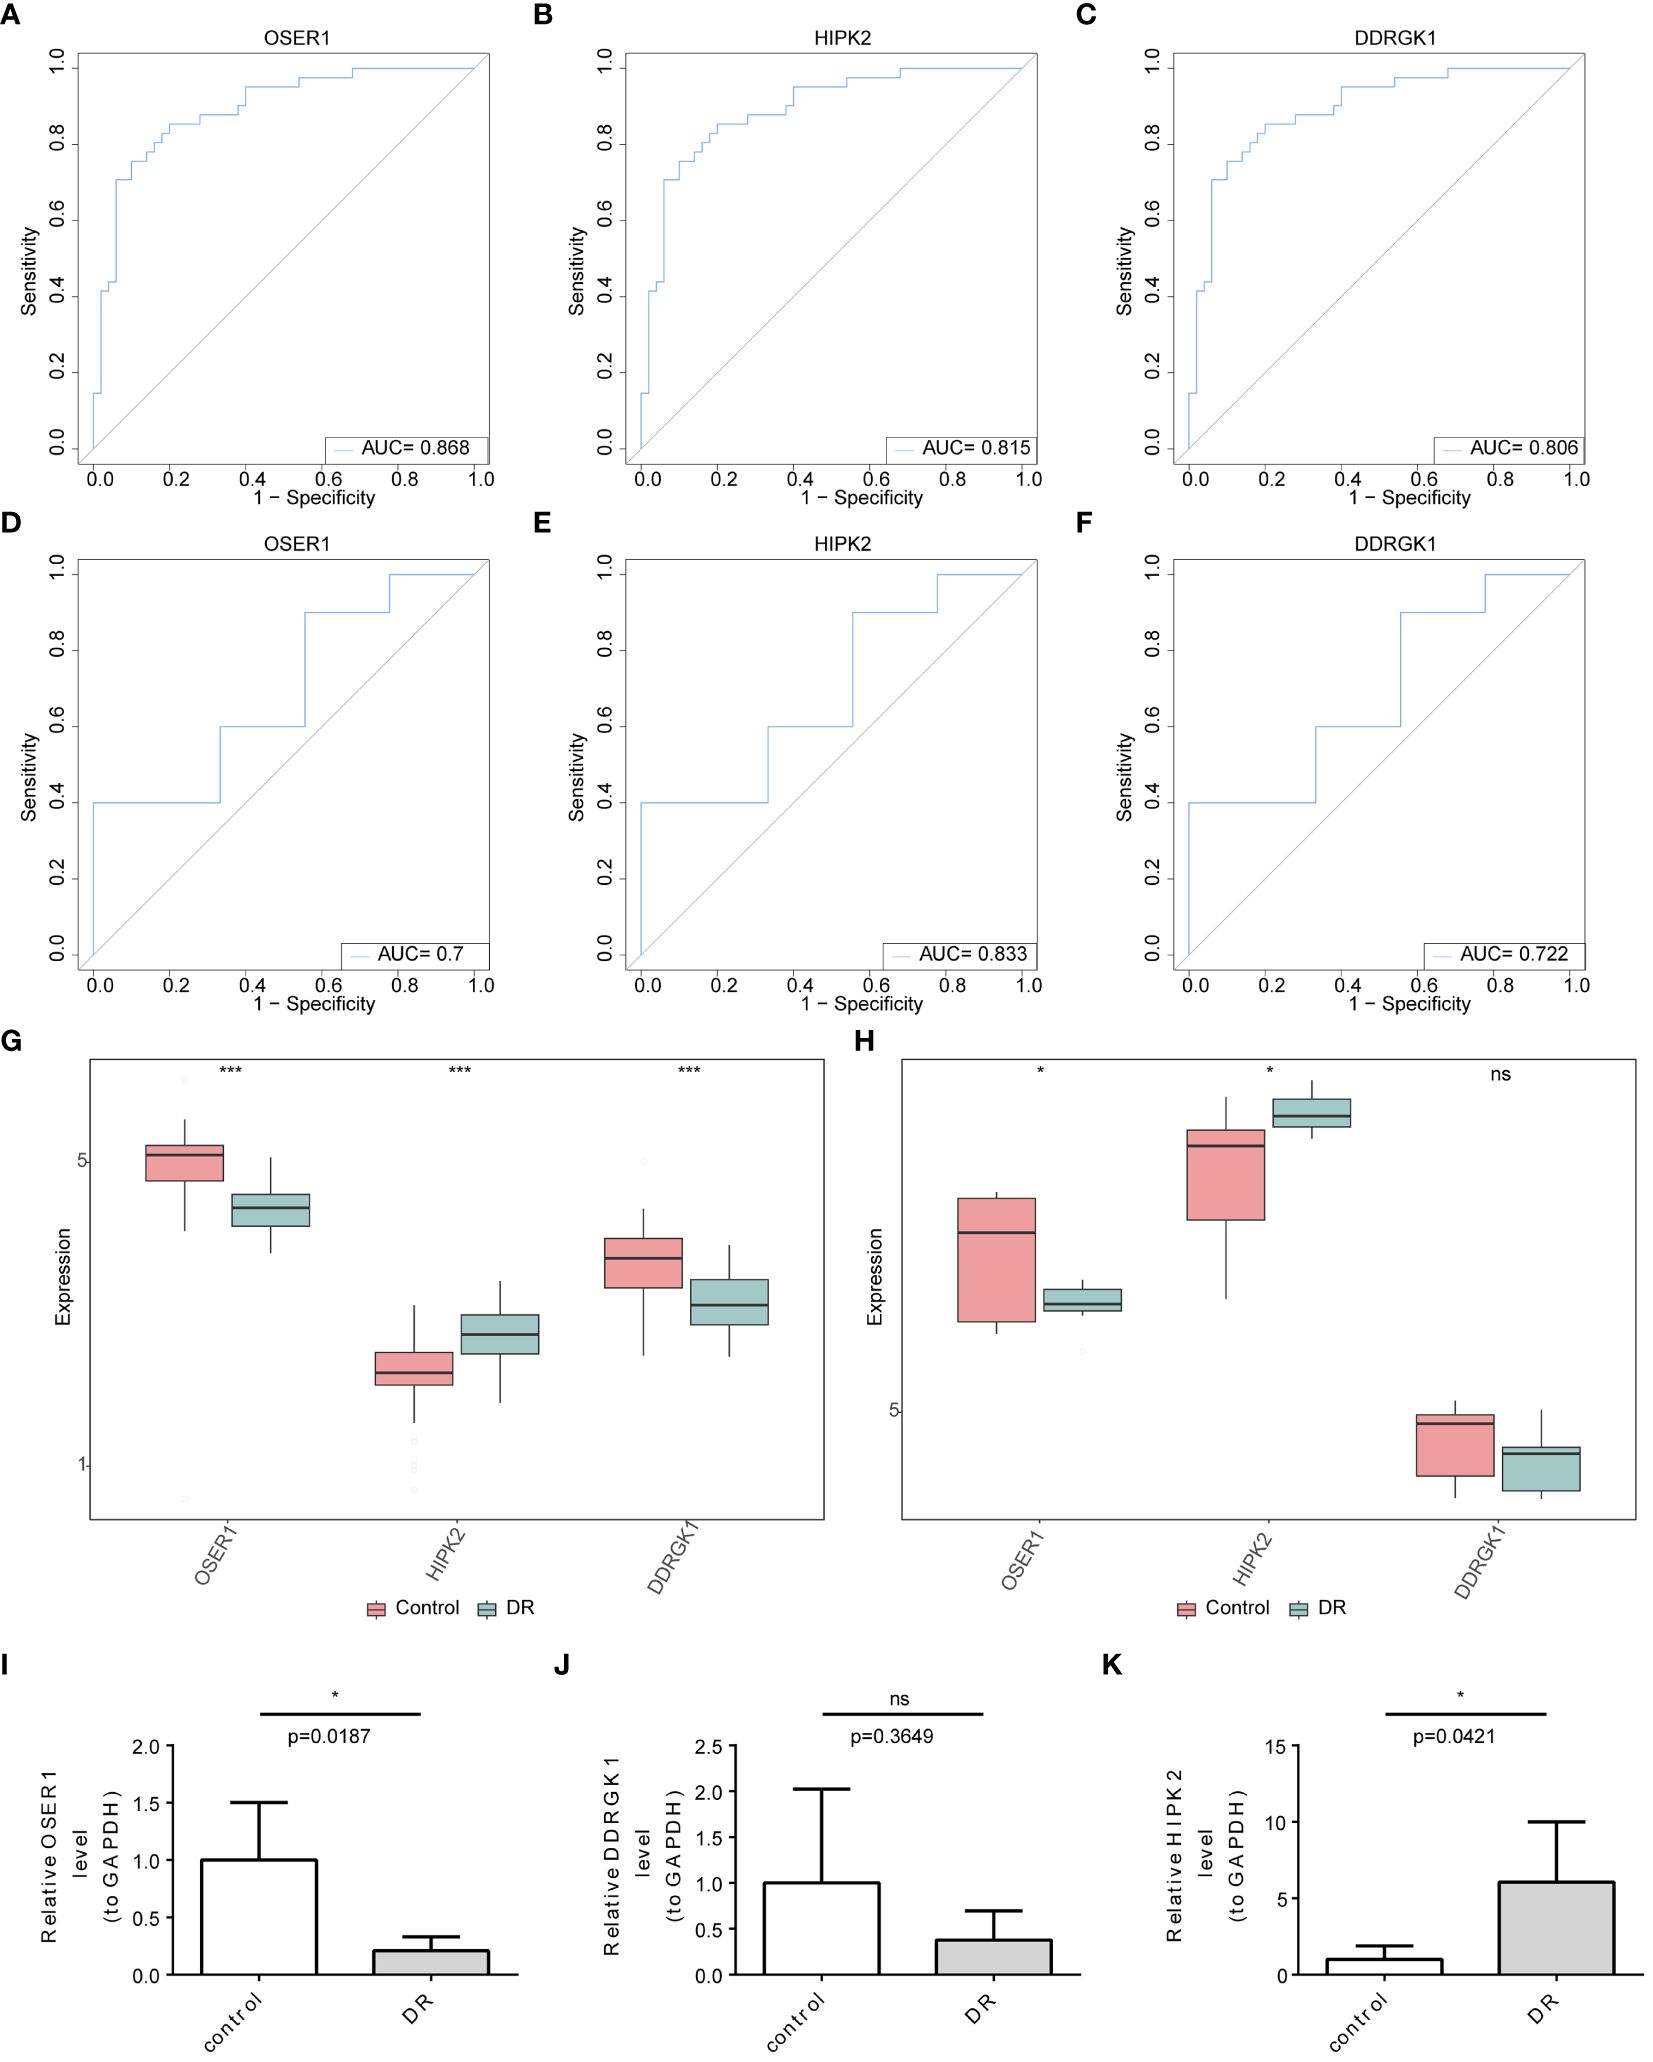
Figure 4 Identification and validation of biomarkers (A–F) ROC curve analysis of candidate biomarkers in GSE221521 and GSE189005 datasets (G, H) The expression levels of OSER1, DDRGK1 and HIPK2 in GSE221521 and GSE189005 datasets (I–K) The expression levels of OSER1, DDRGK1 and HIPK2 in clinical samples by RT-qPCR. *: p < 0.5, ***: p < 0.001, ns: not statistically significant.
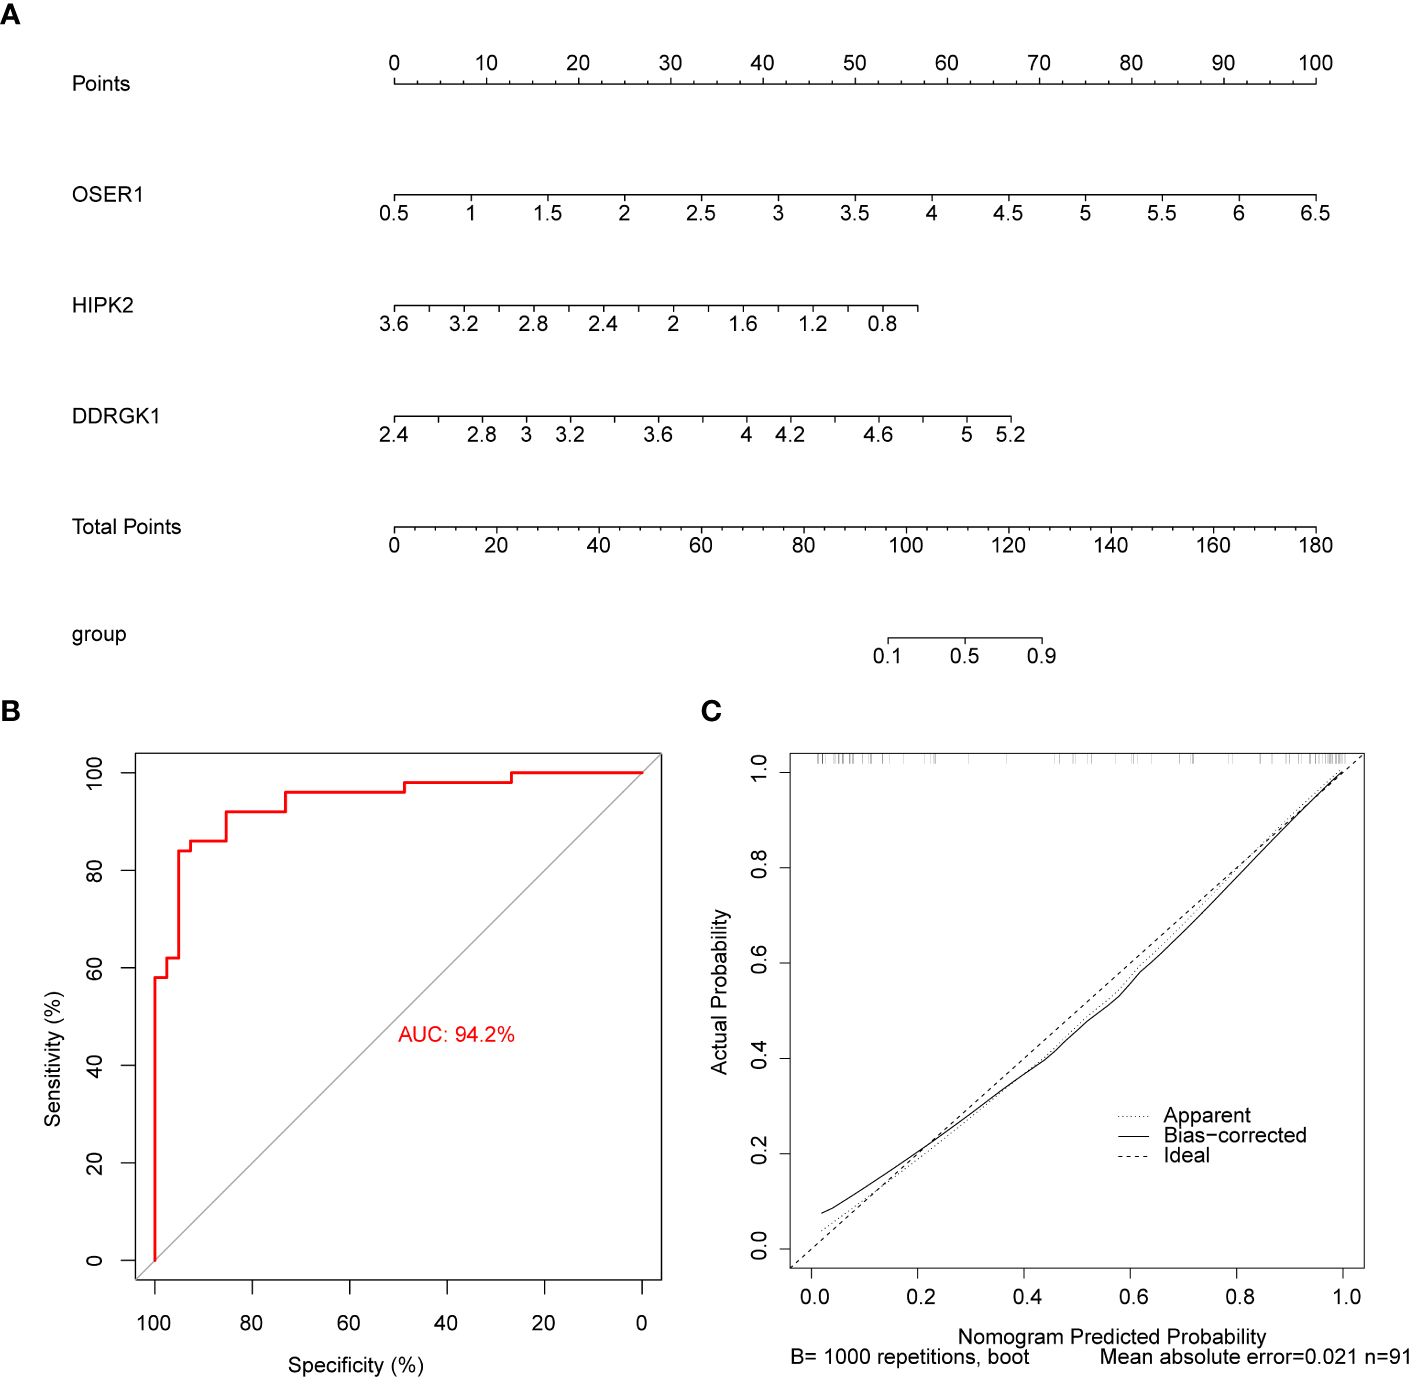
Figure 5 Construction and evaluation of the nomogram (A) Construction of the nomogram (B) Calibration curve of nomogram (C) ROC curve of nomogram.
3.5 GSEA and GSVA of biomarkers
GSEA analysis demonstrated significant associations between HIPK2 and DDRGK1 with ribosome, Parkinson’s disease, oxidative phosphorylation, and other pathways. OSER1 was enriched in spliceosome, neuroactive ligand receptor interaction, and olfactory transduction (Figures 6A–C). The top 20 pathways enriched by DDRGK1, HIPK2 and OSER1 in GSVA are shown in Figures 6D–F. The first three pathways (glycine serine and threonine metabolism, base excision repair, etc.) of DDRGK1 were enriched in the high expression group, while the remaining 17 pathways (such as inositol phosphate metabolism and glioma) were enriched in the low expression group. Similarly, the initial 11 pathways (lysine degradation, prostate cancer, etc.) of HIPK2 were enriched in the high expression group, whereas the remaining nine pathways (glycine serine and threonine metabolism, ribosome, etc.) were enriched in the low expression group. Among pathways related to OSER1, the first 14 (beta alanine metabolism, nitrogen metabolism, etc.) were enriched in the high expression group, and the remaining six (glyoxylate and dicarboxylate metabolism, primary immunodeficiency, etc.) were enriched in the low expression group.
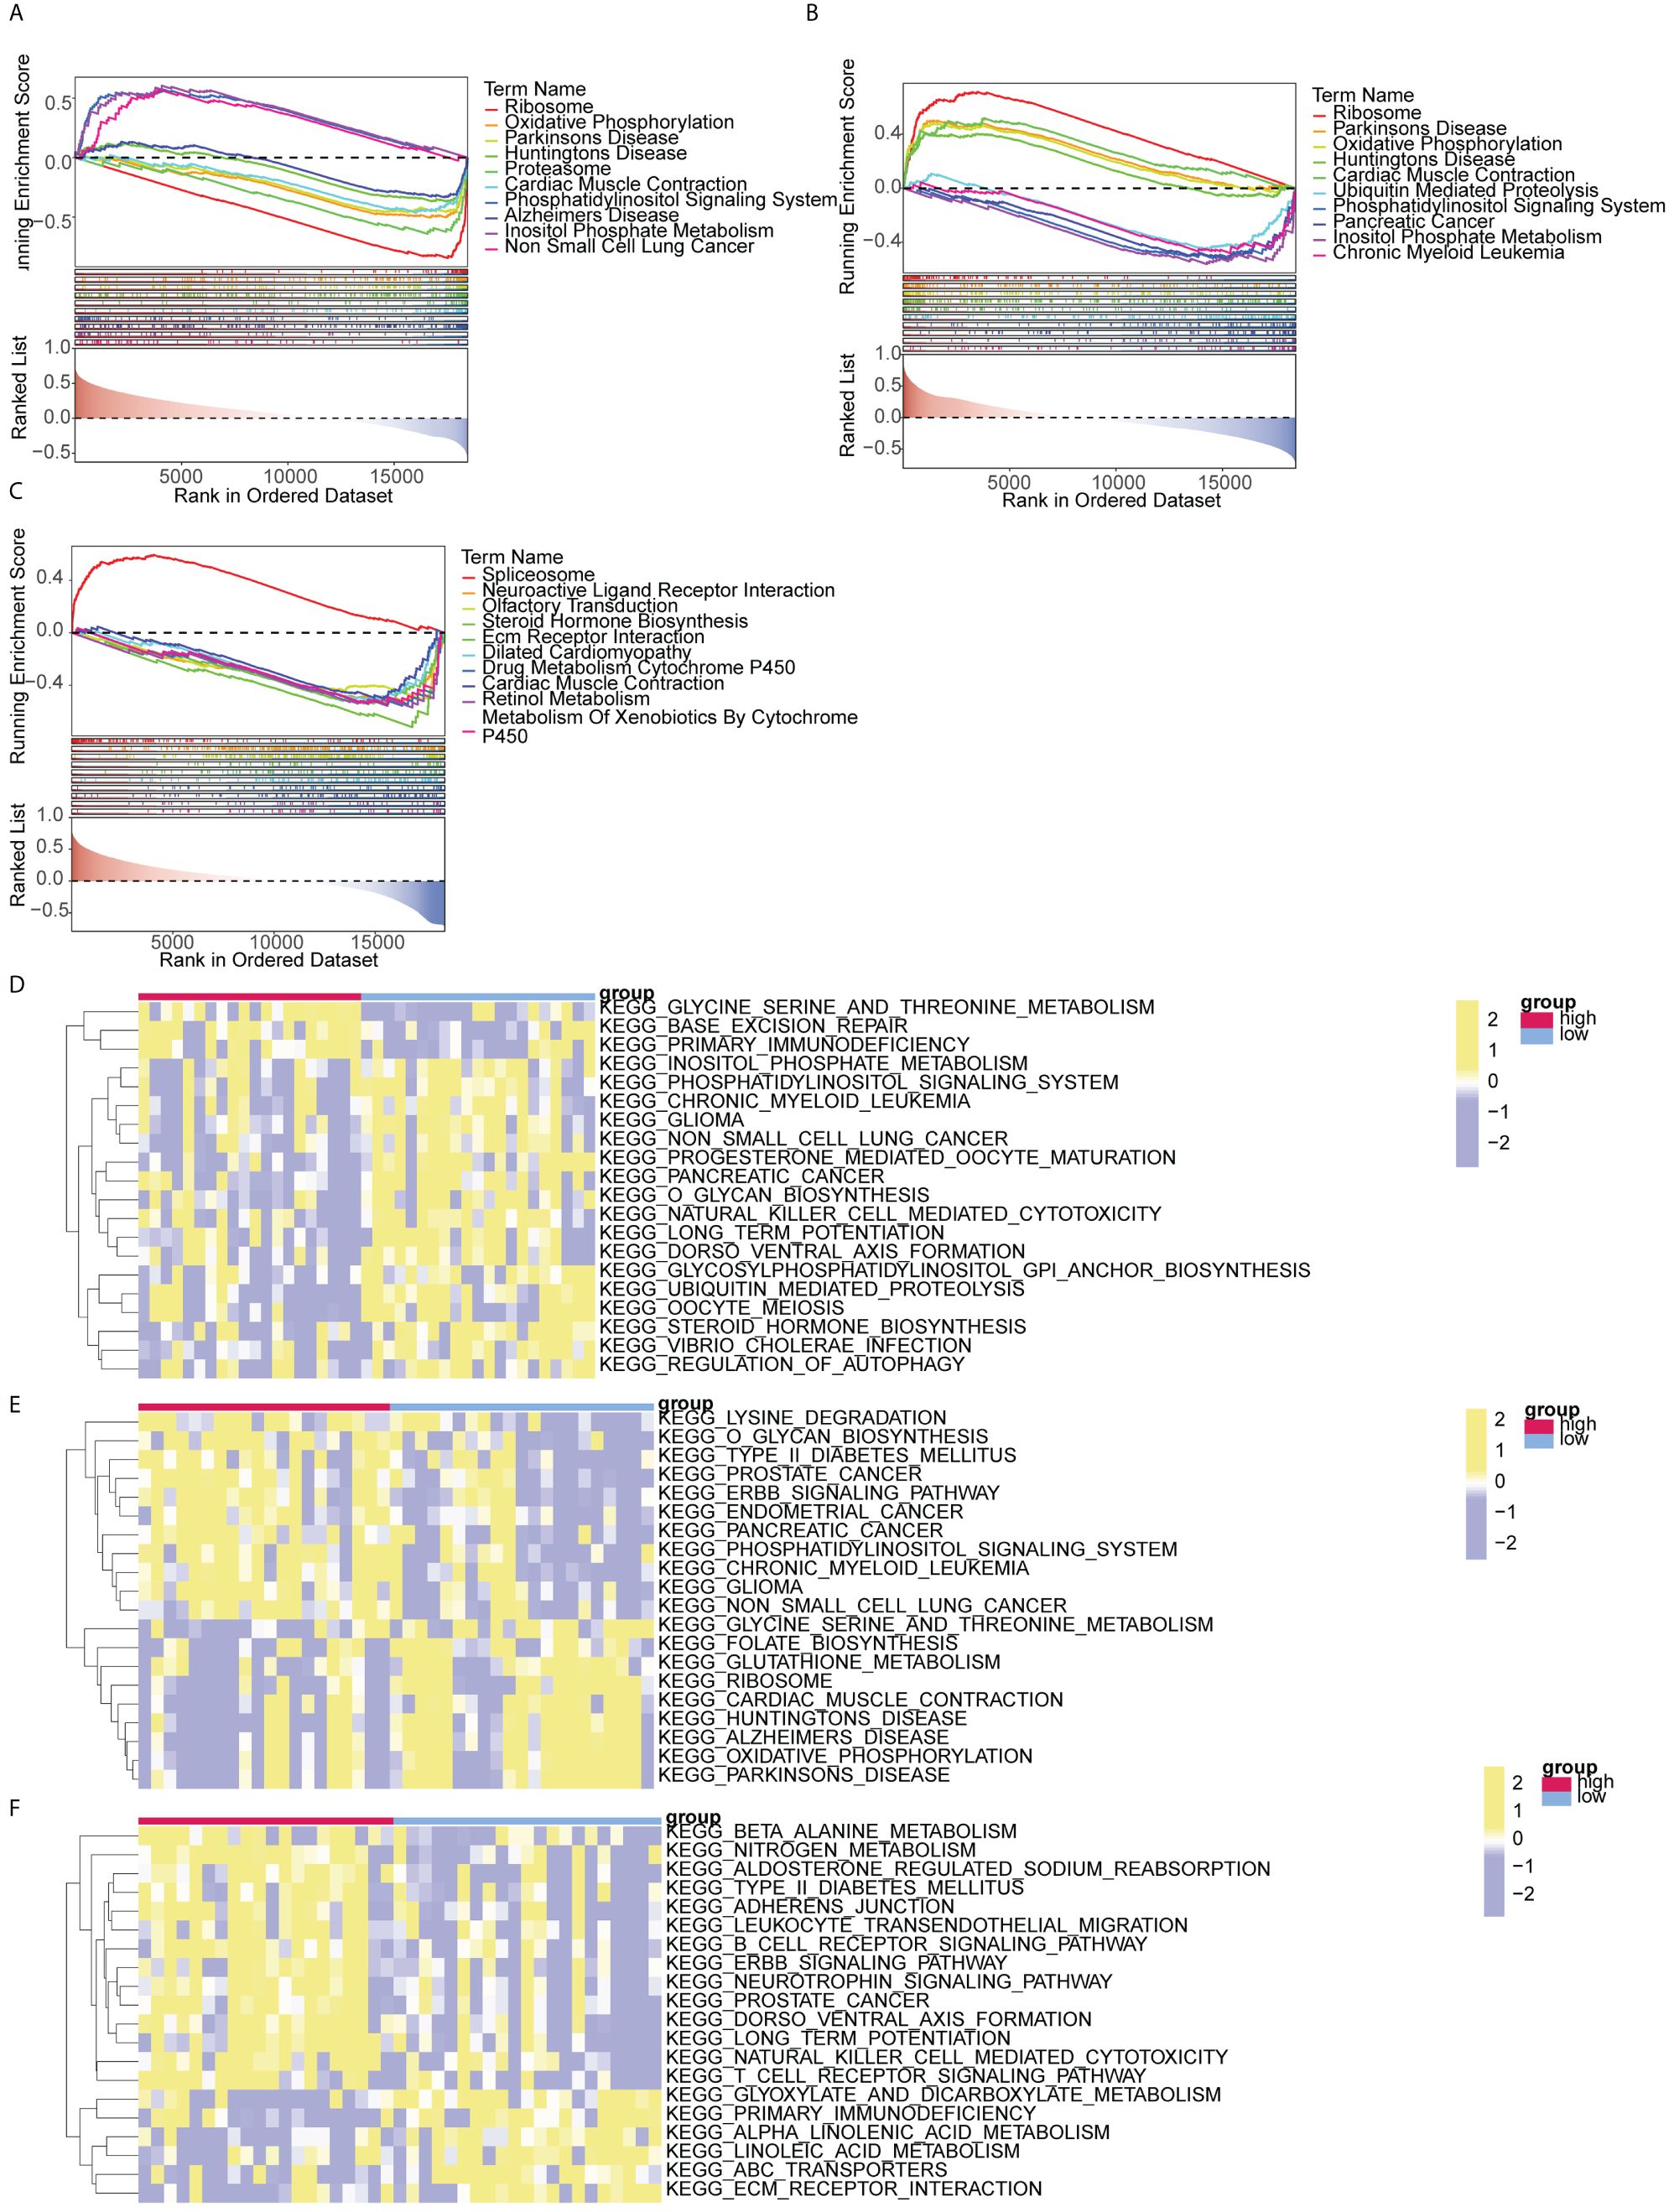
Figure 6 GSEA and GSVA analysis of biomarkers (A-C) GSEA analysis of DDRGK1, HIPK2, and OSER1 (D-F) GSVA analysis of DDRGK1, HIPK2, and OSER1.
3.6 The immune infiltration exhibited notable disparities between the DR and control groups
The distributions of the 28 immune cells in the sample were visualized using a heatmap (Figure 7A). There were 10 immune cell types exhibiting notable disparities between the DR and control groups, such as central memory CD8+ T cells, activated CD8+ T cells, monocytes, effector memory CD8+ T cells, activated CD4+ T cells, and myeloid derived suppressor cells (Figure 7B). There was a significant positive association between activated CD8+ T cells and activated CD4+ T cells (R=0.60). Conversely, a significant negative correlation was identified between monocytes and activated CD4+ T cells (R=-0.52) (Figure 7C). DDRGK1 expression significantly and positively correlated with effector memory CD8+ T cells and negatively with plasmacytoid dendritic cells. Activated CD4+ T cells correlated significantly and positively with OSER1 expression. HIPK2 expression significantly and positively correlated with myeloid derived suppressor cells and negatively with activated CD8+ T cells (Figures 7D–F).
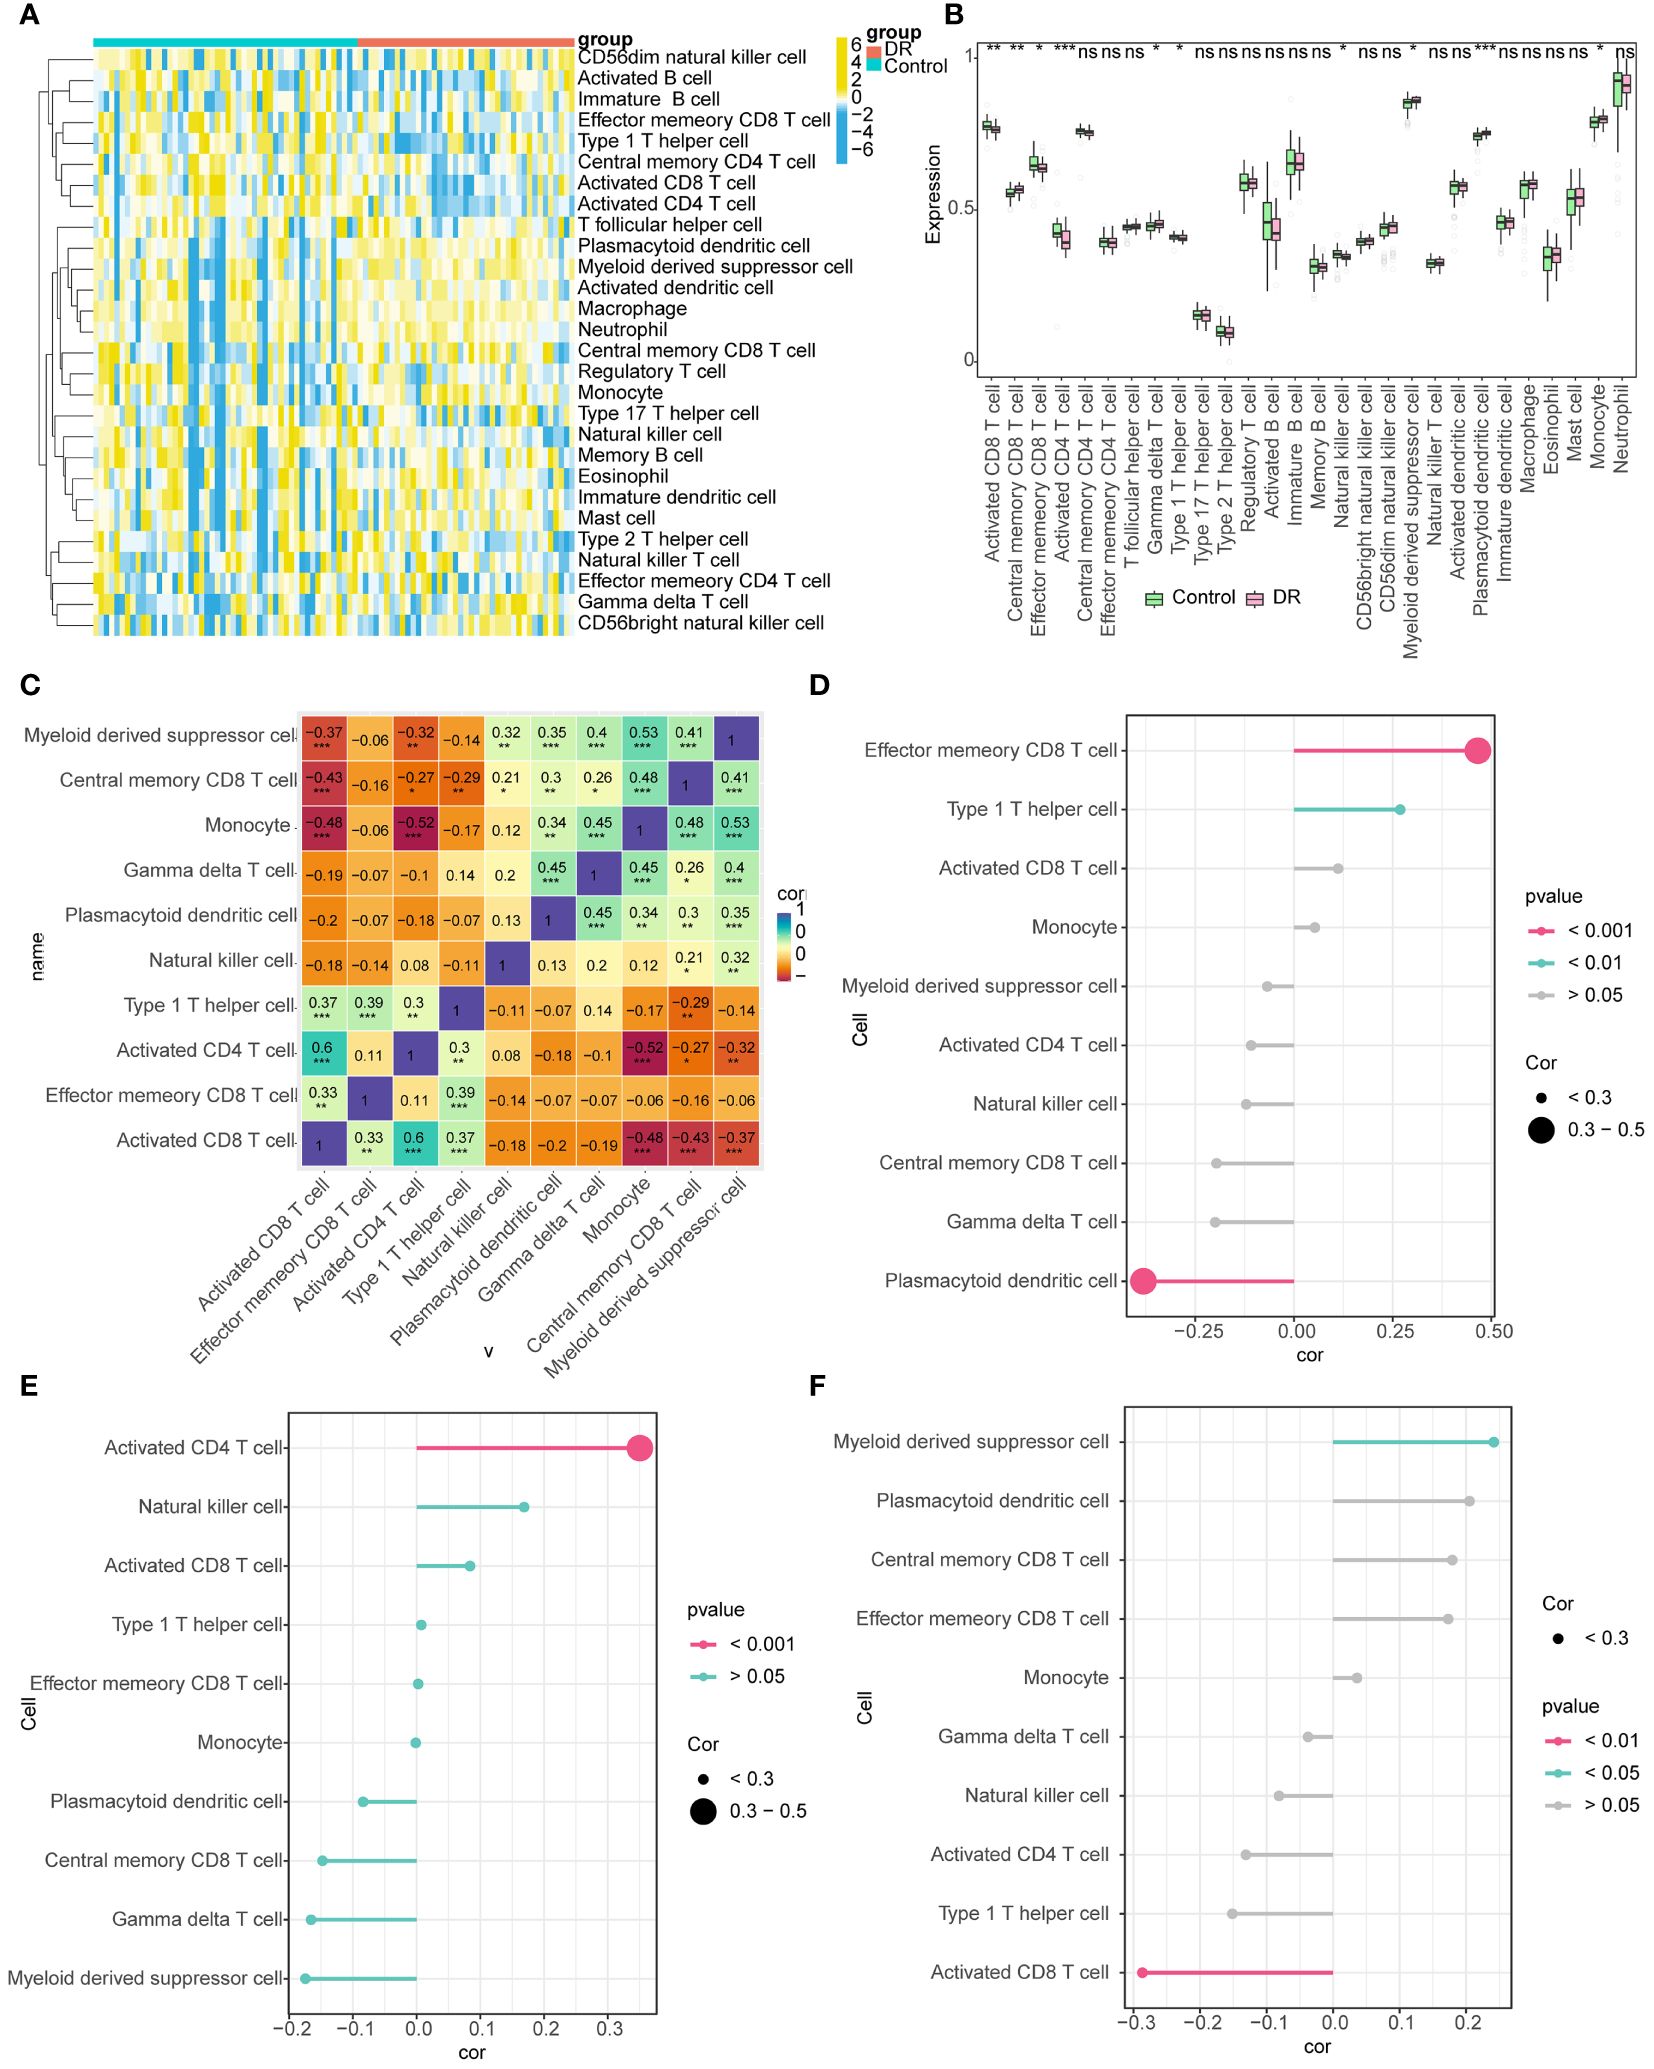
Figure 7 Immune infiltration analysis (A) Heat map of the distributions of the 28 immune cells (B) Differences in the abundance of immune cells in DR and Control groups (C) Differential immune cell correlation heat map (* represents the P-value < 0.05, the number represents the correlation coefficient) (D-F) Lollipop chart analysis of correlation between DDRGK1, HIPK2, and OSER1 with differential immune cells (The size of the circle represents correlation, and different colors represent different P-values). *: p < 0.5, **: p < 0.1, ***: p < 0.001, ns, not statistically significant.
3.7 Regulatory relationships with biomarkers
TF-mRNA-miRNA network was composed of 25 TFs, three biomarkers, and 191 miRNAs, with a total of 219 nodes and 233 edges (Figure 8). The hsa-mir-92a-3p linked with all three biomarkers. GATA2 and RELA had strong associations with HIPK2 and OSER1, thereby highlighting their role in the pathogenesis of DR. The target drugs of HIPK2 mainly included GW5074 (Raf1 Kinase Inhibitor I) MRC, LY-317615 Kinome Scan, and GSK650394A MRC. Furthermore, OSER1 was primarily targeted by Thioguanosine PC3 UP, Elesclomol CTD 00004602, and Gedunin CTD 00003449 (Table 2).
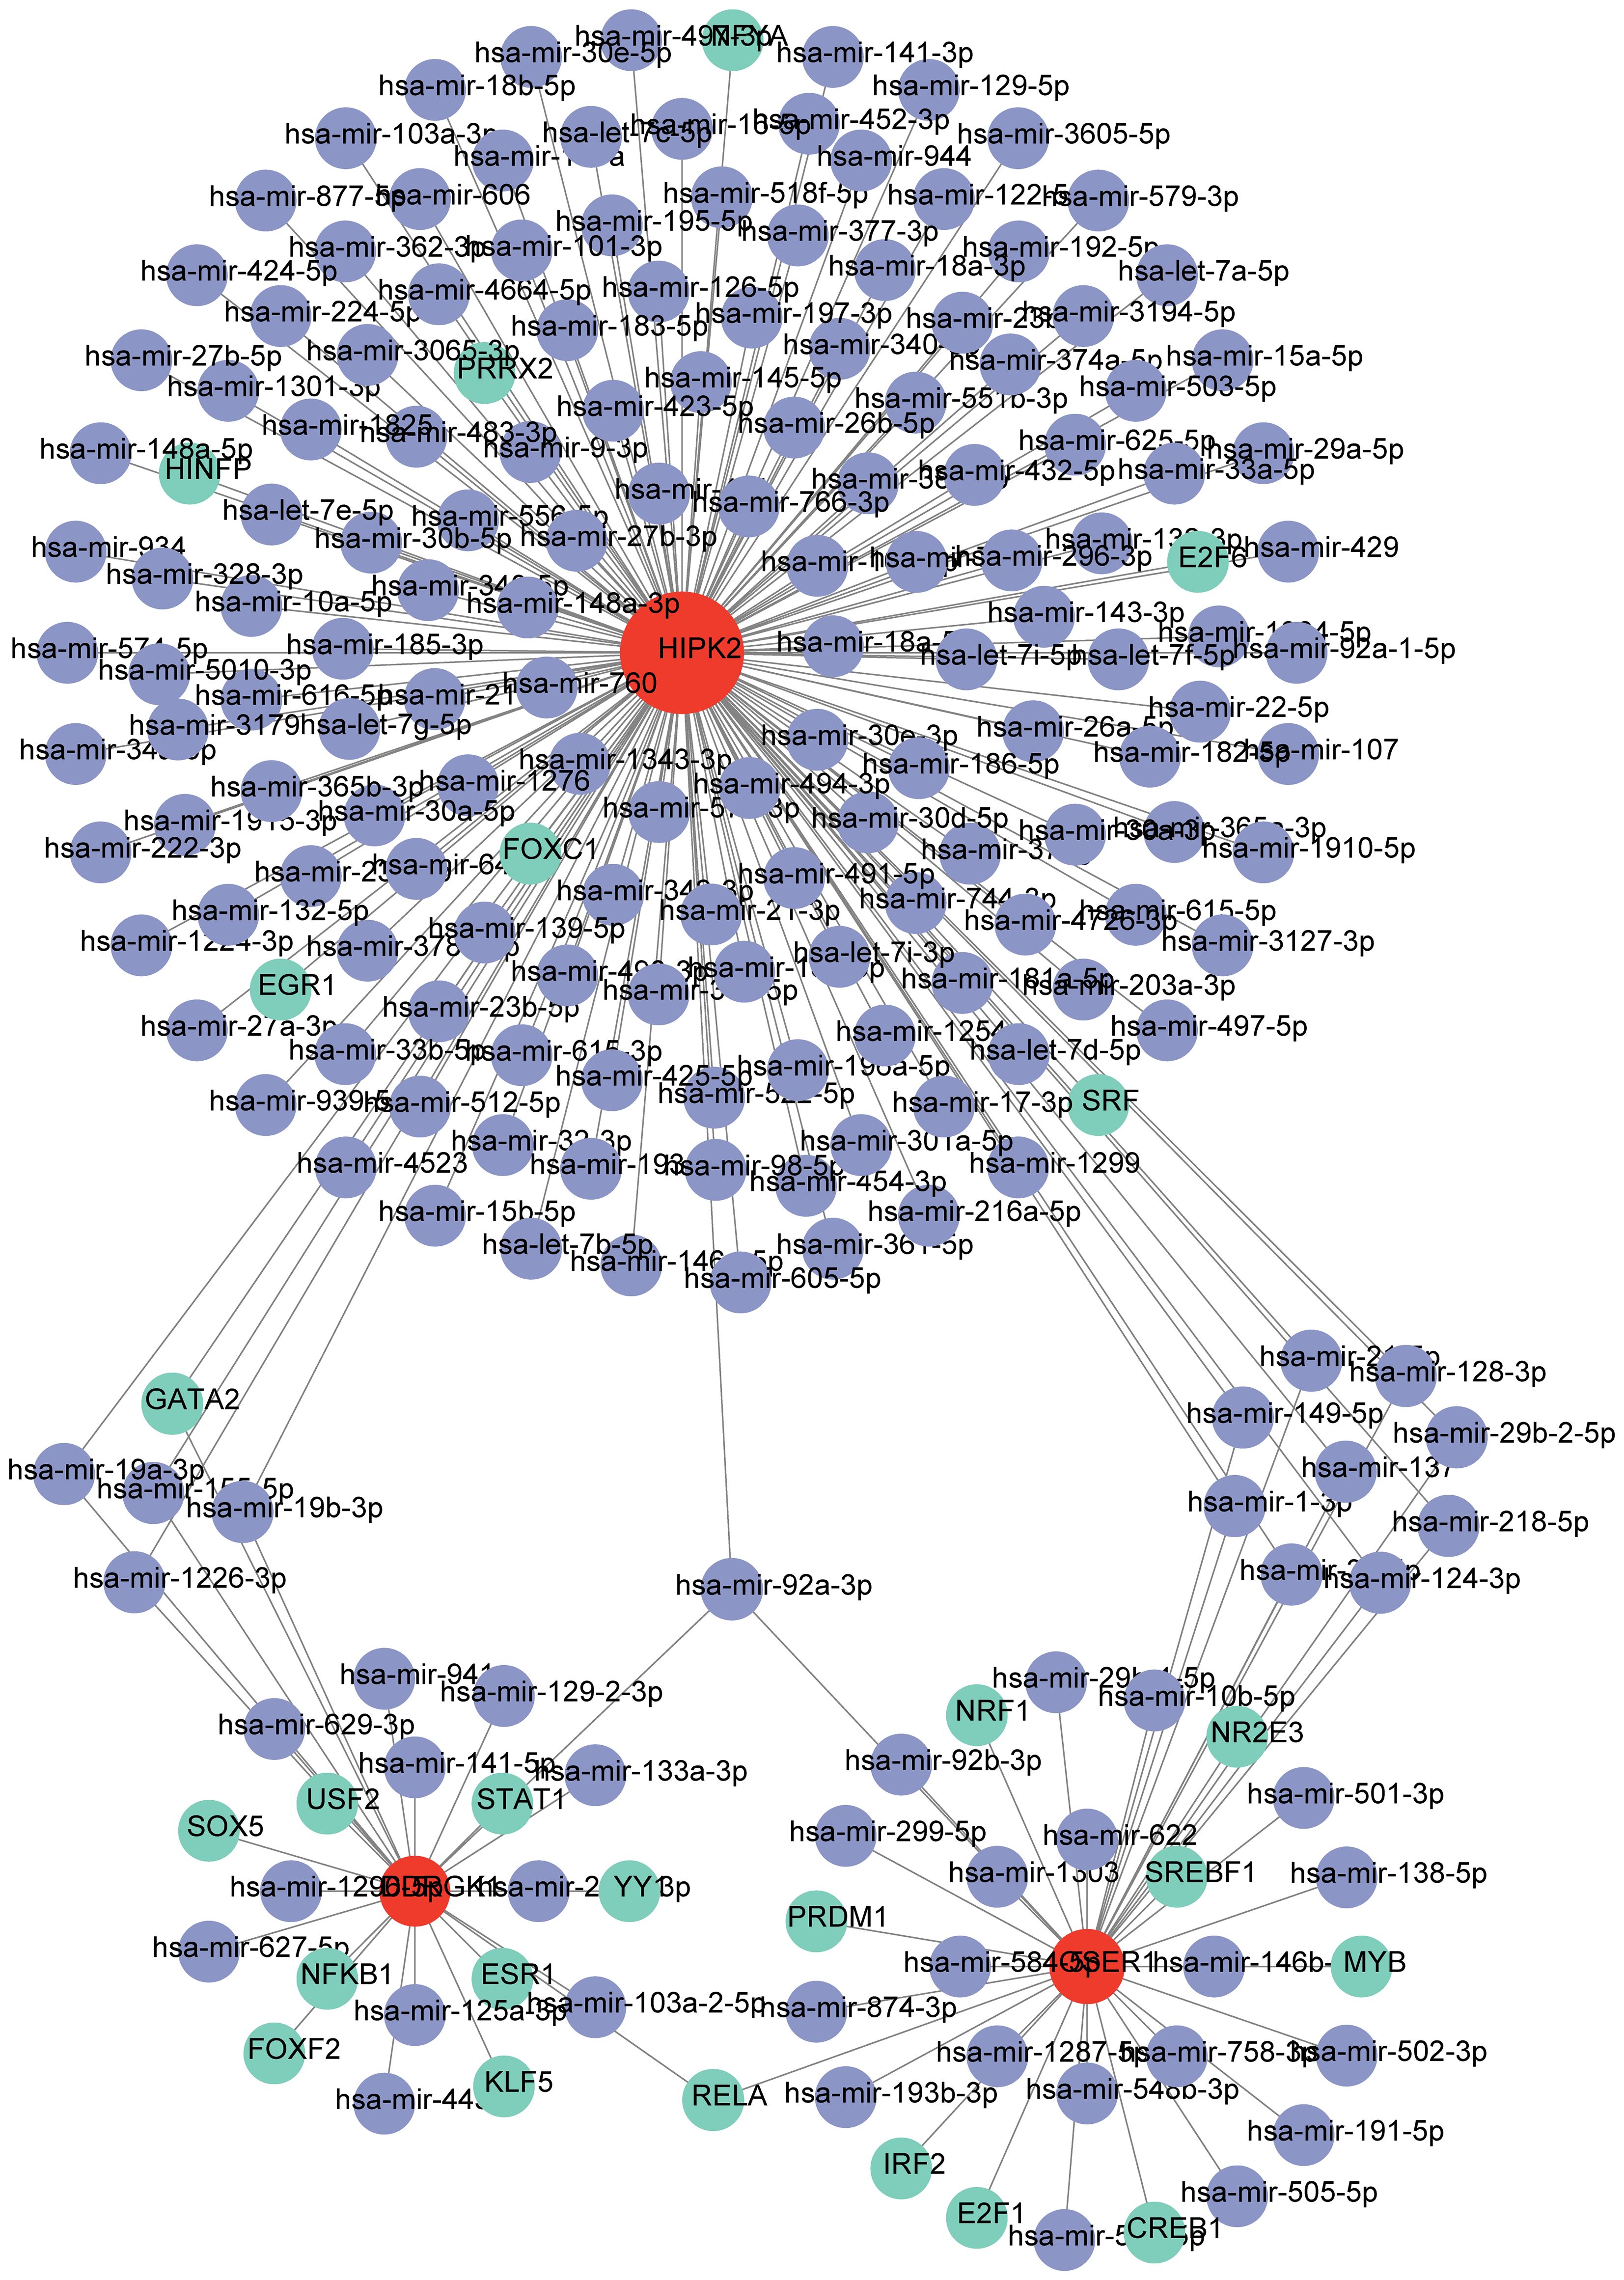
Figure 8 TF-mRNA-miRNA regulatory network (Green represents TF, red represents biomarkers, and purple represents miRNA).
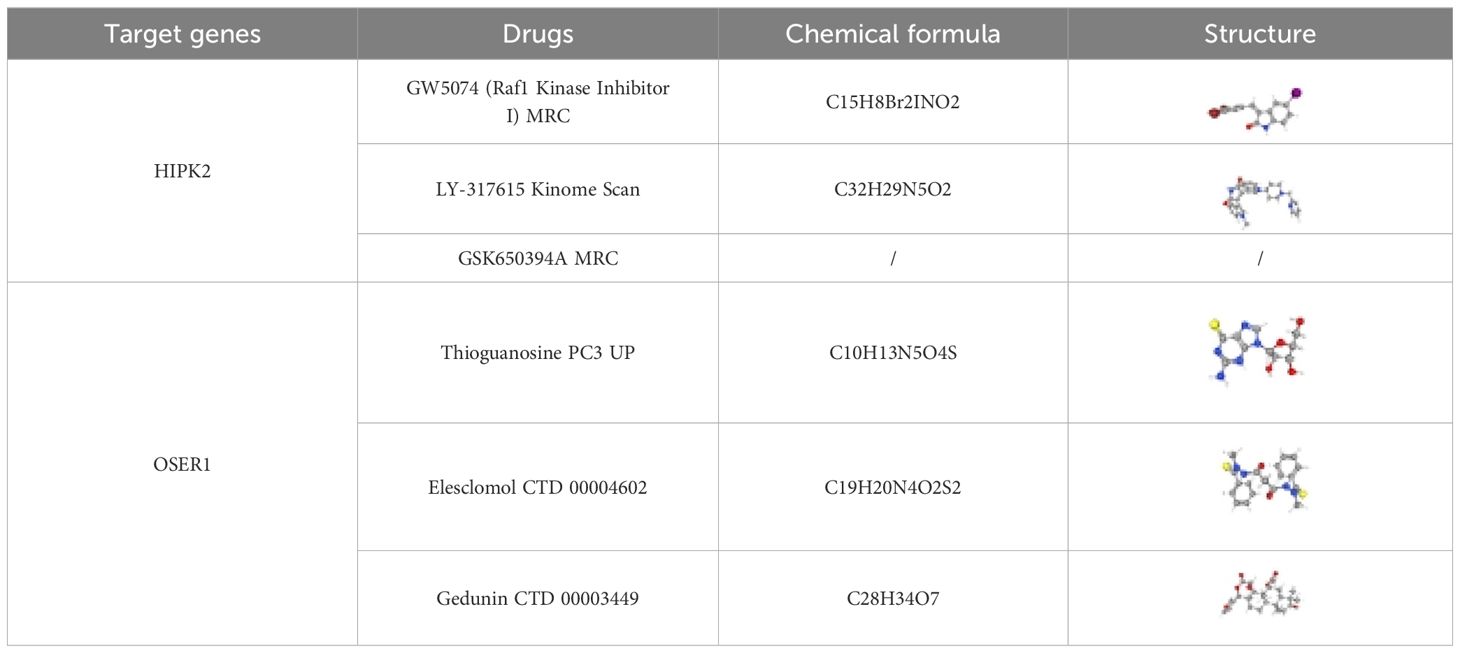
Table 2 Predicted drugs of biomarkers.
4 Discussion
DR is a condition affecting the small blood vessels in the retina, commonly seen in individuals with diabetes. It has emerged as a leading cause of visual impairment among middle-aged people worldwide. Approximately 22.3% of diabetic patients are affected by DR, and about 6.2% experience progressive changes in their retina that can potentially lead to vision loss (27). Timely diagnosis and prompt initiation of treatment can effectively mitigate over 90% of vision loss attributed to DR (28). The occurrence and development of DR are complicated, and its pathogenesis is still unclear. Therefore, it is necessary to investigate further into biomarkers for DR. Bioinformatic analysis techniques, based on the gene expression profiles acquired from databases, have been used to investigate target genes in disease diagnosis (29). For example, inhibition of MAPK3 expression was found through bioinformatics analysis to potentially impact the onset and progression of DR through its regulation of autophagy (30). Likewise, eight potential pyroptosis-related genes involved in the occurrence of DR were analyzed (31). Bioinformatics analysis have allowed us to derive novel insights into the immune mechanisms involved in proliferative diabetic retinopathy, and M2 macrophage-related biomarkers have been recognized to play a role in DR (32). The engagement of hub genes HMOX1 and PTGS2, along with their related TFs and miRNAs, have been shown to potentially play a role in ferroptosis in DR (29).
MR analysis relies on genetic predictors as IVs to investigate the causal association between exposure factors and diseases (33). MR has been used to explore biomarkers of multiple diseases, including diabetes mellitus and DR (34, 35). MR analysis offers crucial evidence regarding the potential causal impacts of numerous alterable exposures, encompassing conventional epidemiological risk factors, lifestyle aspects, and targeted interventions (36).
In this study, based on transcriptome data in the GSE221521 and GSE189005 datasets, candidate genes were identified through differential expression analysis and WGCNA. These candidate genes served as exposure factors, and DR was used as the outcome for MR analysis. A total of 13 candidate biomarkers that exhibited causal relationships with DR were obtained by MR analysis, and the ROC curve demonstrated favorable diagnostic performance of three biomarkers (OSER1, HIPK2, and DDRGK1) for DR. Enrichment analysis delineated pathways associated with the biomarkers, including oxidative phosphorylation, as well as amino acids and glucose. Immune infiltration analysis showed that biomarkers were associated with pro-inflammatory cells such as activated CD4+ T cells or Tfh cells. Moreover, a TF-mRNA-miRNA network was composed of 25 TFs, three biomarkers, and 191 miRNAs, with a total of 219 nodes and 233 edges. Finally, RT-qPCR verified the expression of the biomarkers in vitro. Then, we delve into the in-depth discussion of the roles of OSER1, HIPK2, and DDRGK1 in DR.
The long noncoding RNA OSER1 plays a crucial role in the inflammation and apoptosis of rheumatoid arthritis fibroblasts (37), and its low expression was markedly associated with poor survival of cancer patients (38). In the present study, we found that low OSER1 expression can also contribute to the pathogenesis of DR. Inflammation is a major driver of DR, and OSER1 is known to promote the inflammatory cascades (37), thereby triggering DR.
HIPK2 regulates several pro-fibrotic pathways, such as Wnt/β-catenin, liver and cardiac fibrosis, pulmonary, and renal pathways (TGF-β and Notch signaling) (39). HIPK2 inhibition can result in cardioprotective effects as it would decrease EGR3 and CLEC4D expression levels through ERK1/2-CREB inhibition in cardiomyocytes, as well as through the suppression of Smad3 phosphorylation in cardiac fibroblasts (40). These findings suggest a close link between HIPK2 expression and fibrosis. Diabetes-associated fibrosis reflects the repair of primary injury and is involved in the pathogenesis of diabetic nephropathy, cardiomyopathy, and liver dysfunction, as well as the development of DR and neuropathy (41). In the present study, we found that HIPK2 was upregulated in DR patients, suggesting that HIPK2 may promote the development of DR by promoting the pathological process of retinal cell fibrosis. miR-423–5p is reported to directly bind to HIPK2, and its upregulation in DR patients enhances angiogenesis by inhibiting HIPK2 expression, thereby activating the HIF1α/VEGF signaling pathway (42). This is contrary to the results of the present study, and it is speculated that an increase in the level of VEGF may promote the levels of HIPK2. It is also possible that the discordant result was because our PCR was based on blood samples. In order to clarify the exact relationship between HIPK2 and VEGF, it is necessary to conduct a study using a larger sample size for the extraction and analysis of vitreal fluids.
DDRGK1, a protein containing the DDRGK domain, plays a crucial role in the recently identified ufmylation mechanism. Absence of DDRGK1 leads to significant levels of endoplasmic reticulum (ER) stress (43) and causes a range of conditions, such as malignancies, neurodegenerative disorders, diabetes, and inflammatory disorders (44). Knocking out DDRGK1 has been observed to trigger ER stress and facilitate apoptosis (45). Due to hyperglycemia and insulin resistance, apoptosis causes DR. Aligning with our finding that low DDRGK1 expression in DR patients, it is possible that ER stress induced by decreased DDRGK1 may contribute to the development of DR. However, the large variation in the RT-qPCR results may be related to the small sample size, and more samples are needed for verification of the results.
The present study is the first to demonstrate the association between biomarkers OSER1 and DDRGK1 and DR. We found that HIPK2 may affect fibrosis and VEGF levels through some signaling pathways, suggesting that HIPK2 serves as reliable biomarkers for DR.
The primary pathophysiological alterations observed in DR are attributed to long-term hyperglycemia, which triggers oxidative stress and inflammation within the microvessels of the retina. Consequently, this leads to thickening of the basement membrane surrounding retinal capillaries, increased permeability of retinal blood vessels, and neovascularization (46). Glycemic control is achieved through the coordinated interaction among glycolysis, the Krebs cycle, and oxidative phosphorylation. Disturbing this equilibrium results in various biochemical and molecular alterations in DR (47). GSEA and GSVA of these three biomarkers provided details of the enrichment between these genes and related pathways. The biomarkers were enriched in pathways of oxidative phosphorylation, possibly indicating that hyperglycemia disrupts the balance between glycolysis and oxidative phosphorylation, leading to other biochemical and molecular changes in retinal cells that have been linked to the neural and microvascular complications of DR. In summary, the expression of these biomarkers may influence the imbalance between glycolysis and oxidative phosphorylation caused by hyperglycemia, potentially leading to retinal microvascular changes associated with DR.
Amino acids play a crucial role in the formation of tissues, specialized proteins, hormones, enzymes, and neurotransmitters. They also contribute to energy metabolism through gluconeogenesis and play important roles in various metabolic pathways (48). Glutamine and arginine levels in the peripheral blood tend to increase in DR patients (49, 50), and methionine level decreases in blood samples of DR patients (48). Therefore, these amino acids can also be used as biomarkers for the early diagnosis of DR. In this study, the pathway of glycine, serine, and threonine metabolism was enriched in the high expression group of DDRGK1. Among OSER1-related pathways, beta alanine metabolism, nitrogen metabolism, and other amino acid pathways were enriched in the high expression group. Evidence from previous metabolomics studies and our study suggests that metabolic pathways of many amino acids are involved in the occurrence of DR. Consequently, there may be numerous interactions between metabolic pathways of amino acids and glucose associated with the three biomarkers identified in our study, which require further investigation.
Diabetes is a metabolic disorder, and chronic inflammation plays a vital role in the development of type 2 diabetes. We found 10 immune cell types exhibiting notable disparities between the DR and control groups, including activated CD4+ T cells. It is well established that CD4+ T cells are involved in inflammation (51), and the accumulation of CD4+ T cells, B cells, and macrophages is observed in the vitreous of DR patients (52). Inflammation can also affect retinal vascular pathology in DR through the activation of pro-inflammatory retinal microglia by the innate immune system and the transformation of CD4+ T cells into pro-inflammatory Th1 and Th17 cells (53). OSER1 can affect the inflammatory response in DR patients by affecting activated CD4+ T cells, leading to the occurrence of DR. The number of a relatively new subgroup of circulating CD4+ T cells i.e., follicular helper T (Tfh) cells, which are located at the germinal center, is reported to increase in DR patients compared to healthy individuals (52, 54). The present study also showed that the number of Tfh cells increases in the DR group. These findings further support our results that the number of activated CD4+ T cells significantly and positively correlated with OSER1 expression, suggesting OSER1 may promote inflammation and accelerate vascular injury, leading to the development of DR through activated CD4+ T cells or Tfh cells.
In conclusion, three biomarkers, namely OSER1, HIPK2, and DDRGK1, were found to play a role in DR pathogenesis. The diagnostic nomogram for DR constructed in this study will help further improve the diagnosis of DR. These three biomarkers are expected to become potential targets for the diagnosis and treatment of DR patients. One limitation of the present study is that the results are based on the bioinformatic analysis of a public database, and further experiments are needed to explore the detailed roles of the biomarkers. Additional clinical studies are needed to validate the results. OSER1 and DDRGK1 have not been studied earlier in the context of DR, and additional studies are needed to ascertain their role in DR pathogenesis. Our future studies will focus on these two biomarkers. The relationship between HIPK2 and DR in the present study was found to be opposite of what has been reported earlier; again, further research is needed to explore these pathways.
Data availability statement
Publicly available datasets were analyzed in this study. This data can be found here: https://www.ncbi.nlm.nih.gov/, https://gwas.mrcieu.ac.uk/.
Ethics statement
The studies involving humans were approved by Ethics Committee of the Second Affiliated Hospital of Kunming Medical University. The studies were conducted in accordance with the local legislation and institutional requirements. The participants provided their written informed consent to participate in this study.
Author contributions
JYL: Conceptualization, Methodology, Writing – review & editing. JHL: Conceptualization, Methodology, Writing – review & editing. YT: Conceptualization, Methodology, Writing – original draft. KZ: Formal Analysis, Writing – original draft. XZ: Data curation, Writing – review & editing. JZ: Writing – review & editing. HZ: Conceptualization, Methodology, Project administration, Writing – review & editing.
Funding
The author(s) declare financial support was received for the research, authorship, and/or publication of this article. This research was supported by the mechanism of CDKN2A/B hypomethylation regulating TGF-β/Smad signaling pathway in immune cell activation in diabetic retinopathy (202301AC070418) and the Science and Technology Program of Yunnan Provincial Department of Science and Technology-Basic Research Program (202301AC070418).
Acknowledgments
The authors acknowledge the efforts of the consortia in providing high-quality GEO and GWAS resources for researchers. Data and materials are available from the corresponding GWAS consortium. Thanks to all the authors who join in this research.
Conflict of interest
The authors declare that the research was conducted in the absence of any commercial or financial relationships that could be construed as a potential conflict of interest.
Publisher’s note
All claims expressed in this article are solely those of the authors and do not necessarily represent those of their affiliated organizations, or those of the publisher, the editors and the reviewers. Any product that may be evaluated in this article, or claim that may be made by its manufacturer, is not guaranteed or endorsed by the publisher.
Supplementary material
The Supplementary Material for this article can be found online at: https://www.frontiersin.org/articles/10.3389/fendo.2024.1410066/full#supplementary-material
References
1. Cheung N, Mitchell P, Wong TY. Diabetic retinopathy. Lancet. (2010) 376:124–36. doi: 10.1016/S0140-6736(09)62124-3
2. Teo ZL, Tham Y-C, Yu M, Chee ML, Rim TH, Cheung N, et al. Global prevalence of diabetic retinopathy and projection of burden through 2045. Ophthalmology. (2021) 128:1580–91. doi: 10.1016/j.ophtha.2021.04.027
3. Saaddine JB, Honeycutt AA, Narayan KM, Zhang X, Klein R, Boyle JP. Projection of diabetic retinopathy and other major eye diseases among people with diabetes mellitus: United States, 2005–2050. Arch Ophthalmol. (2008) 126:1740–7. doi: 10.1001/archopht.126.12.1740
4. Sun H, Saeedi P, Karuranga S, Pinkepank M, Ogurtsova K, Duncan BB, et al. IDF Diabetes Atlas: Global, regional and country-level diabetes prevalence estimates for 2021 and projections for 2045. Diabetes Res Clin Pract. (2022) 183. doi: 10.1016/j.diabres.2021.109119
5. Cai S, Liu TYA. The role of ultra-widefield fundus imaging and fluorescein angiography in diagnosis and treatment of diabetic retinopathy. Curr Diabetes Rep. (2021) 21:30. doi: 10.1007/s11892-021-01398-0
6. Sabanayagam C, Banu R, Chee ML, Lee R, Wang YX, Tan G, et al. Incidence and progression of diabetic retinopathy: a systematic review. Lancet Diabetes Endocrinol. (2019) 7:140–9. doi: 10.1016/S2213-8587(18)30128-1
7. Wang W, Lo ACY. Diabetic retinopathy: pathophysiology and treatments. Int J Mol Sci. (2018) 19(6). doi: 10.3390/ijms19061816
8. Davey Smith G, Ebrahim S. ‘Mendelian randomization’: can genetic epidemiology contribute to understanding environmental determinants of disease?*. Int J Epidemiol. (2003) 32:1–22. doi: 10.1093/ije/dyg070
9. Haycock PC, Burgess S, Wade KH, Bowden J, Relton C, Davey Smith G. Best (but oft-forgotten) practices: the design, analysis, and interpretation of Mendelian randomization studies. Am J Clin Nutr. (2016) 103:965–78. doi: 10.3945/ajcn.115.118216
10. Love MI, Huber W, Anders S. Moderated estimation of fold change and dispersion for RNA-seq data with DESeq2. Genome Biol. (2014) 15(12). doi: 10.1186/s13059-014-0550-8
11. Gu Z, Eils R, Schlesner M. Complex heatmaps reveal patterns and correlations in multidimensional genomic data. Bioinformatics. (2016) 32:2847–9. doi: 10.1093/bioinformatics/btw313
12. Gustavsson EK, Zhang D, Reynolds RH, Garcia-Ruiz S, Ryten M. ggtranscript: an R package for the visualization and interpretation of transcript isoforms using ggplot2. Bioinformatics. (2022) 38:3844–6. doi: 10.1093/bioinformatics/btac409
13. Langfelder P, Horvath S. WGCNA: an R package for weighted correlation network analysis. BMC Bioinf. (2008) 9:599. doi: 10.1186/1471-2105-9-559
14. Gao C-H, Yu G, Cai P. ggVennDiagram: an intuitive, easy-to-use, and highly customizable R package to generate Venn diagram. Front Genet. (2021) 12. doi: 10.3389/fgene.2021.706907
15. Wu T, Hu E, Xu S, Chen M, Guo P, Dai Z, et al. clusterProfiler 4.0: A universal enrichment tool for interpreting omics data. Innovation (Camb). (2021) 2:100141. doi: 10.1016/j.xinn.2021.100141
16. Shannon P, Markiel A, Ozier O, Baliga NS, Wang JT, Ramage D, et al. Cytoscape: A software environment for integrated models of biomolecular interaction networks. Genome Res. (2003) 13:2498–504. doi: 10.1101/gr.1239303
17. Hemani G, Zheng J, Elsworth B, Wade KH, Haberland V, Baird D, et al. The MR-Base platform supports systematic causal inference across the human phenome. eLife. (2018) 30(7):e34408. doi: 10.7554/eLife.34408
18. Burgess S, Thompson SG. Interpreting findings from Mendelian randomization using the MR-Egger method. Eur J Epidemiol. (2017) 32:377–89. doi: 10.1007/s10654-017-0255-x
19. Bowden J, Davey Smith G, Haycock PC, Burgess S. Consistent estimation in Mendelian randomization with some invalid instruments using a weighted median estimator. Genet Epidemiol. (2016) 40:304–14. doi: 10.1002/gepi.21965
20. Burgess S, Scott RA, Timpson NJ, Davey Smith G, Thompson SG. Using published data in Mendelian randomization: a blueprint for efficient identification of causal risk factors. Eur J Epidemiol. (2015) 30:543–52. doi: 10.1007/s10654-015-0011-z
21. Chen X, Kong J, Diao X, Cai J, Zheng J, Xie W, et al. Depression and prostate cancer risk: A Mendelian randomization study. Cancer Med. (2020) 9:9160–7. doi: 10.1002/cam4.3493
22. Hu J, Song J, Chen Z, Yang J, Shi Q, Jin F, et al. Reverse causal relationship between periodontitis and shortened telomere length: Bidirectional two-sample Mendelian random analysis. Front Immunol. (2022) 13. doi: 10.3389/fimmu.2022.1057602
23. Robin X, Turck N, Hainard A, Tiberti N, Lisacek F, Sanchez J-C, et al. pROC: an open-source package for R and S+ to analyze and compare ROC curves. BMC Bioinf. (2011) 12:77. doi: 10.1186/1471-2105-12-77
24. Xu J, Yang T, Wu F, Chen T, Wang A, Hou S. A nomogram for predicting prognosis of patients with cervical cerclage. Heliyon. (2023) 9(11). doi: 10.1016/j.heliyon.2023.e21147
25. Hänzelmann S, Castelo R, Guinney J. GSVA: gene set variation analysis for microarray and RNA-seq data. BMC Bioinf. (2013) 14:7. doi: 10.1186/1471-2105-14-7
26. Livak KJ, Schmittgen TD. Analysis of relative gene expression data using real-time quantitative PCR and the 2(-Delta Delta C(T)) Method. Methods. (2001) 25:402–8. doi: 10.1006/meth.2001.1262
27. Tarasewicz D, Conell C, Gilliam LK, Melles RB. Quantification of risk factors for diabetic retinopathy progression. Acta Diabetol. (2023) 60:363–9. doi: 10.1007/s00592-022-02007-6
28. Early photocoagulation for diabetic retinopathy. ETDRS report number 9. Early Treatment Diabetic Retinopathy Study Research Group. Ophthalmology. (1991) 98:766–85. doi: 10.1016/S0161-6420(13)38011-7
29. Huang Y, Peng J, Liang Q. Identification of key ferroptosis genes in diabetic retinopathy based on bioinformatics analysis. PloS One. (2023) 18:e0280548. doi: 10.1371/journal.pone.0280548
30. Wang N, Wei L, Liu D, Zhang Q, Xia X, Ding L, et al. Identification and validation of autophagy-related genes in diabetic retinopathy. Front Endocrinol (Lausanne). (2022) 13:867600. doi: 10.3389/fendo.2022.867600
31. Wang N, Ding L, Liu D, Zhang Q, Zheng G, Xia X, et al. Molecular investigation of candidate genes for pyroptosis-induced inflammation in diabetic retinopathy. Front Endocrinol (Lausanne). (2022) 13:918605. doi: 10.3389/fendo.2022.918605
32. Meng Z, Chen Y, Wu W, Yan B, Meng Y, Liang Y, et al. Exploring the immune infiltration landscape and M2 macrophage-related biomarkers of proliferative diabetic retinopathy. Front Endocrinol (Lausanne). (2022) 13:841813. doi: 10.3389/fendo.2022.841813
33. Davey Smith G, Ebrahim S. What can mendelian randomisation tell us about modifiable behavioural and environmental exposures? Bmj. (2005) 330:1076–9. doi: 10.1136/bmj.330.7499.1076
34. Su Z, Wu Z, Liang X, Xie M, Xie J, Li H, et al. Diabetic retinopathy risk in patients with unhealthy lifestyle: A Mendelian randomization study. Front Endocrinol (Lausanne). (2022) 13:1087965. doi: 10.3389/fendo.2022.1087965
35. Liu K, Zou J, Fan H, Hu H, You Z. Causal effects of gut microbiota on diabetic retinopathy: A Mendelian randomization study. Front Immunol. (2022) 13:930318. doi: 10.3389/fimmu.2022.930318
36. Larsson SC, Butterworth AS, Burgess S. Mendelian randomization for cardiovascular diseases: principles and applications. Eur Heart J. (2023) 44:4913–24. doi: 10.1093/eurheartj/ehad736
37. Fu Q, Song MJ, Fang J. LncRNA OSER1-AS1 regulates the inflammation and apoptosis of rheumatoid arthritis fibroblast like synoviocytes via regulating miR-1298–5p/E2F1 axis. Bioengineered. (2022) 13:4951–63. doi: 10.1080/21655979.2022.2037854
38. Xie W, Wang Y, Zhang Y, Xiang Y, Wu N, Wu L, et al. Single-nucleotide polymorphism rs4142441 and MYC co-modulated long non-coding RNA OSER1-AS1 suppresses non-small cell lung cancer by sequestering ELAVL1. Cancer Sci. (2021) 112:2272–86. doi: 10.1111/cas.14713
39. Garufi A, Pistritto G, D'Orazi G. HIPK2 as a novel regulator of fibrosis. Cancers (Basel). (2023) 15. doi: 10.3390/cancers15041059
40. Zhou Q, Meng D, Li F, Zhang X, Liu L, Zhu Y, et al. Inhibition of HIPK2 protects stress-induced pathological cardiac remodeling. EBioMedicine. (2022) 85:104274. doi: 10.1016/j.ebiom.2022.104274
41. Tuleta I, Frangogiannis NG. Diabetic fibrosis. Biochim Biophys Acta Mol Basis Dis. (2021) 1867:166044. doi: 10.1016/j.bbadis.2020.166044
42. Xiao Q, Zhao Y, Sun H, Xu J, Li W, Gao L. MiR-423–5p activated by E2F1 promotes neovascularization in diabetic retinopathy by targeting HIPK2. Diabetol Metab Syndr. (2021) 13:152. doi: 10.1186/s13098-021-00769-7
43. Cao Y, Li R, Shen M, Li C, Zou Y, Jiang Q, et al. DDRGK1, a crucial player of ufmylation system, is indispensable for autophagic degradation by regulating lysosomal function. Cell Death Dis. (2021) 12:416. doi: 10.1038/s41419-021-03694-9
44. Yang X, Zhou T, Wang X, Xia Y, Cao X, Cheng X, et al. Loss of DDRGK1 impairs IRE1α UFMylation in spondyloepiphyseal dysplasia. Int J Biol Sci. (2023) 19:4709–25. doi: 10.7150/ijbs.82765
45. Liu J, Wang Y, Song L, Zeng L, Yi W, Liu T, et al. A critical role of DDRGK1 in endoplasmic reticulum homoeostasis via regulation of IRE1α stability. Nat Commun. (2017) 8:14186. doi: 10.1038/ncomms14186
46. Liu K, Gao X, Hu C, Gui Y, Gui S, Ni Q, et al. Capsaicin ameliorates diabetic retinopathy by inhibiting poldip2-induced oxidative stress. Redox Biol. (2022) 56:102460. doi: 10.1016/j.redox.2022.102460
47. Yumnamcha T, Guerra M, Singh LP, Ibrahim AS. Metabolic dysregulation and neurovascular dysfunction in diabetic retinopathy. Antioxidants (Basel). (2020) 9. doi: 10.3390/antiox9121244
48. Xia M, Zhang F. Amino acids metabolism in retinopathy: from clinical and basic research perspective. Metabolites. (2022) 9(12). doi: 10.3390/metabo12121244
49. Sun Y, Zou H, Li X, Xu S, Liu C. Plasma metabolomics reveals metabolic profiling for diabetic retinopathy and disease progression. Front Endocrinol (Lausanne). (2021) 12:757088. doi: 10.3389/fendo.2021.757088
50. Rhee SY, Jung ES, Park HM, Jeong SJ, Kim K, Chon S, et al. Plasma glutamine and glutamic acid are potential biomarkers for predicting diabetic retinopathy. Metabolomics. (2018) 14:89. doi: 10.1007/s11306-018-1383-3
51. DeMaio A, Mehrotra S, Sambamurti K, Husain S. The role of the adaptive immune system and T cell dysfunction in neurodegenerative diseases. J Neuroinflammation. (2022) 19:251. doi: 10.1186/s12974-022-02605-9
52. Liu Y, Yang Z, Lai P, Huang Z, Sun X, Zhou T, et al. Bcl-6-directed follicular helper T cells promote vascular inflammatory injury in diabetic retinopathy. Theranostics. (2020) 10:4250–64. doi: 10.7150/thno.43731
53. Jerome JR, Deliyanti D, Suphapimol V, Kolkhof P, Wilkinson-Berka JL. Finerenone, a non-steroidal mineralocorticoid receptor antagonist, reduces vascular injury and increases regulatory T-cells: studies in rodents with diabetic and neovascular retinopathy. Int J Mol Sci. (2023) 24(3). doi: 10.3390/ijms24032334
Keywords: diabetic retinopathy, enrichment analysis, immune infiltration, Mendelian randomization, regulatory network
Citation: Liu J, Li J, Tang Y, Zhou K, Zhao X, Zhang J and Zhang H (2024) Transcriptome analysis combined with Mendelian randomization screening for biomarkers causally associated with diabetic retinopathy. Front. Endocrinol. 15:1410066. doi: 10.3389/fendo.2024.1410066
Received: 31 March 2024; Accepted: 06 June 2024;
Published: 03 July 2024.
Edited by:
Sara Rezzola, University of Brescia, ItalyReviewed by:
Kai Jin, Zhejiang University, ChinaQiqin Shi, Ningbo Hangzhou Bay Hospital, China
Manhong Xu, Tianjin Medical University Eye Hospital, China
Copyright © 2024 Liu, Li, Tang, Zhou, Zhao, Zhang and Zhang. This is an open-access article distributed under the terms of the Creative Commons Attribution License (CC BY). The use, distribution or reproduction in other forums is permitted, provided the original author(s) and the copyright owner(s) are credited and that the original publication in this journal is cited, in accordance with accepted academic practice. No use, distribution or reproduction is permitted which does not comply with these terms.
*Correspondence: Hong Zhang, Wmhhbmdob25nQGttbXUuZWR1
†These authors have contributed equally to this work