 Fan Hu†
 Ying Wang
 Yong Cai
- Public Health Department, International Institute of Medicine, Tongren Hospital, Shanghai Jiao Tong University School of Medicine, Shanghai, China
Background: A common sense is that lower serum cholesterol levels are better. However, a growing number of researches have questioned this especially for the oldest old. The current study was to assess the association between total cholesterol and all-cause mortality in a group of people aged 85 years old and over.
Methods: We selected 903 Chinese old participants who aged ≥85 years from the Chinese Longitudinal Healthy Longevity Survey(CLHLS) at baseline in 2012. The participants were followed up until death or until December 31, 2014. The outcome was all-cause mortality. The univariate and multivariate Cox regression analyses were used to estimate risk levels of all-cause mortality. We stratified the participants into three groups (<3.40, 3.40–4.39, ≥4.39 mmol/L) based on the restricted cubic splines methods. The survival probability according to total cholesterol category was calculated using the Kaplan-Meier curves, and the log-rank test was performed to analyze differences between the groups.
Results: During the follow-up of three years, 282 participants died, 497 survived and 124 lost to follow-up. There was significant relationship between the total cholesterol and lower risk of all-cause mortality in the multivariable Cox regression analysis (HR=0.88, 95% CI: 0.78–1.00). Based on the restricted cubic splines methods, the total cholesterol was converted from a continuous variable to a categorical variable. The populations were divided into three groups (<3.40, 3.40–4.39, ≥4.39 mmol/L) according to the total cholesterol categorized by cutoff values. Compared to the total cholesterol level of <3.40 mmol/L, populations in the total cholesterol level of 3.40–4.39 mmol/L (HR = 0.72, 95% CI: 0.53–0.97) and ≥4.39 mmol/L (HR = 0.71, 95% CI: 0.52–0.96) groups had lower all-cause mortality in multivariate Cox regression analysis and higher survival probability in survival analysis. When two groups were divided, similar results were found among the populations in the total cholesterol level of ≥3.40 mmol/L compared to the populations in the total cholesterol level of <3.40 mmol/L groups.
Conclusion: In oldest old aged 85 and older, serum total cholesterol levels are inversely associated with all-cause mortality. This study suggested that total cholesterol should be maintained to acceptable levels (≥ 3.40 mmol/L) in oldest old to achieve longevity.
Introduction
The global population is living longer and living more years in good health. Global life expectancy at birth has increased from 66.8 years in 2000 to 72.0 years in 2020 (1), and life expectancy per capita in China reached 77.9 years in 2020 (2). Population aging is intensifying: the proportion of the global population aged over 60 years is predicted to nearly double from 12% to 22% between 2015 and 2050 (3). Population aging has led to a rapid growth in the global numbers of oldest-old individuals, defined as those aged over 80 years. Therefore, it is important to ensure that this population experiences healthy longevity.
Cardiovascular diseases are the leading cause of death worldwide (4). Studies of middle-aged and early-old people have found that high cholesterol levels are positively associated with death from ischemic heart disease, and that lowering lipid levels improves health (5, 6). The National Cholesterol Education Program guideline recommends total cholesterol (TC) levels <200 mg/dL as acceptable for healthy persons, levels of 200–239 mg/dL as borderline high, and levels of ≥240 mg/dL as high. A high plasma concentration of cholesterol is one of the main risk factors for atherosclerosis, which is a major cause of cardiovascular disease (7). However, cholesterol plays an important part in regulating many cellular processes, from membrane fluidity and permeability to gene transcription, and is the basis of all steroid hormones and vitamin D analogs (8). Physiological functions change with age and the association between cholesterol level and all-cause mortality may differ according to age. For example, a classic study showed that high TC concentrations are protectively associated with longevity in people older than 85 years (9). The Honolulu Heart Program showed that long-term low cholesterol concentrations actually increase the risk of death (10). A 10-year longitudinal study in Korea found a U-shaped association between TC and all-cause mortality in individuals aged 75–99 years, and showed that the TC level associated with the lowest mortality risk was 210–249 mg/dL, which exceeds the recommended level (11). However, data on the effect of TC among oldest-old adults is scarce and sometimes conflicting. Few studies have established a lower reference limit for cholesterol level, despite the negative association between cholesterol level and all-cause mortality. Furthermore, previous research has lacked large samples and has not examined the older population in China.
The present study used data from the nationwide Chinese Longitudinal Healthy Longevity Survey (CLHLS), which collected health information from more than 10,000 people aged over 65 years. Questionnaire data (2011) and plasma biochemical parameters (2012) from the fifth follow-up survey were analyzed. The aim of this study was to extend knowledge about the association between TC level and all-cause mortality among people aged ≥85 years (which we defined as oldest old) to explore how TC levels affect longevity and to determine a lower limit of safe TC for this population.
Methods
Study population
The study population was drawn from the 2011/2012 and 2014 CLHLS. The CLHLS is the first and largest nationwide, community-based, longitudinal prospective survey in China (12). The CLHLS was designed to investigate the determinants of health and longevity among older adults (aged ≥65 years), particularly oldest-old adults (aged ≥85 years). The CLHLS randomly selected participants from counties or cities in 22 provinces across China, covering about 85% of the total population in China (13). The CLHLS began in 1998, and follow-up surveys were conducted in 2000, 2002, 2005, 2008/2009, 2011/2012, 2014, and 2017/2018 (14). The CLHLS collects many different types of information about older people, including demographics, lifestyle, diet, health status, and daily activities. In 2012, a biomarker substudy was launched in eight longevity regions: Sanshui in Guangdong Province, Yongfu in Guangxi Autonomous Area, Chengmai in Hainan Province, Xiayi in Henan Province, Zhongxiang in Hubei Province, Mayang in Hunan Province, Laizhou in Shandong Province, and Rudong in Jiangsu Province. The CLHLS study was approved by the research ethics committee of Peking University (IRB00001052–13074). All participants provided written informed consent.
Initially, a total of 9765 old Chinese participants were included in the study. Using the following exclusion criteria, we retained 903 participants. We excluded (1) participants younger than 85 years; (2) participants with missing information; (3) participants who had body mass index data outliers. Figure 1 shows the study population flow chart.
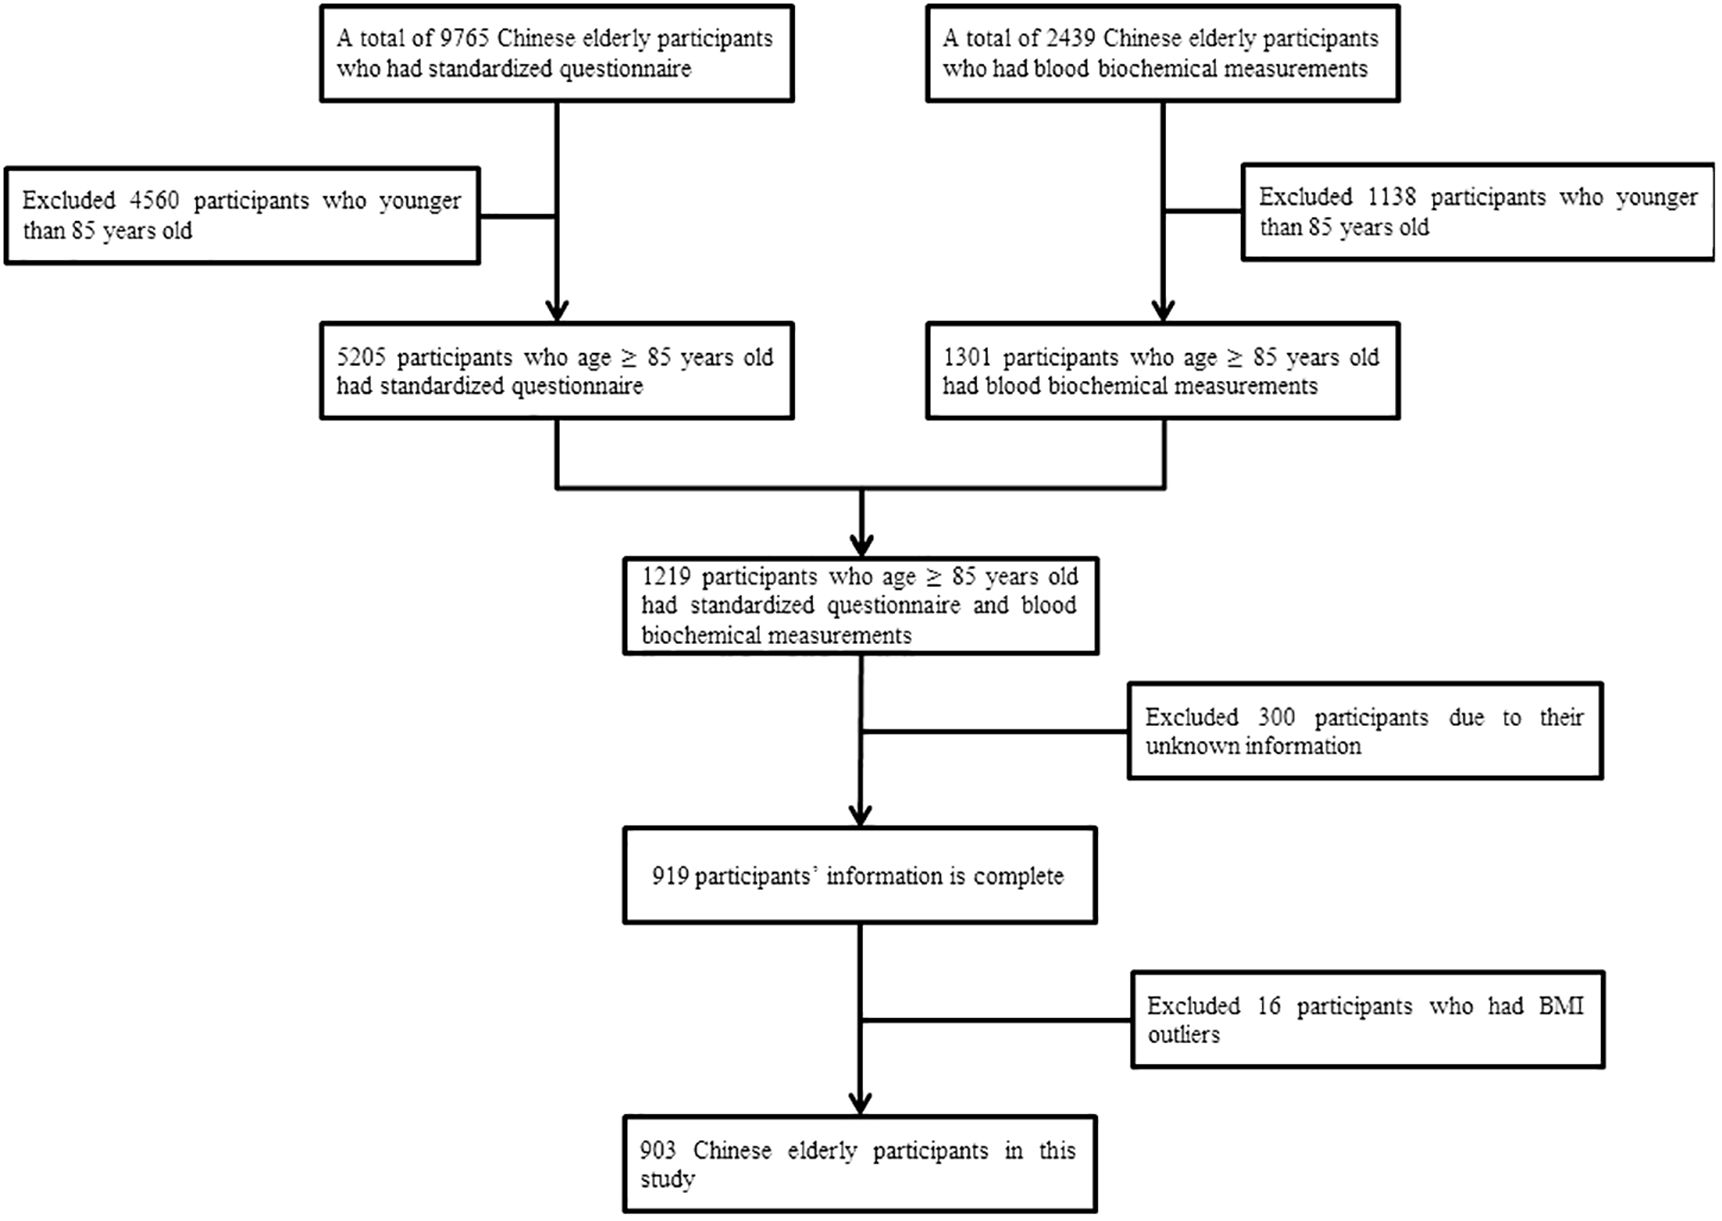
Figure 1 Flow chart on the selection of study population.
Data collection
We collected information using a standardized questionnaire administered during a household interview. The information collected included data on demographics, health-related lifestyle factors, and self-reported medical history. Demographic data comprised age, sex, and residence. Health-related lifestyle data comprised diet (frequency of consuming fresh fruit, vegetables, meat, fish, eggs, beans, sugar, tea, milk products, nut products, and vitamins), smoking, drinking alcohol, and exercise. Self-reported medical history data comprised presence of hypertension, diabetes, heart disease, stroke or cerebrovascular disease, cancer, blood disease, and chronic nephritis. After the household interview, all participants were asked to undergo anthropometric measurements, which included systolic blood pressure (mmHg), diastolic blood pressure (mmHg), and body mass index (kg/m2). The blood biochemistry tests analyzed in this study included blood urea nitrogen (mmol/L), plasma creatine (mmol/L), uric acid (µmol/L), plasma glucose (mmol/L), TC (mmol/L), high-density lipoprotein cholesterol (mmol/L), low-density lipoprotein cholesterol (mmol/L), triglycerides (mmol/L), and vitamin B12 (pmol/L). All the information, including TC levels, which is the main exposure variable, was collected in the 2011/2012 wave.
Biochemical measurements
Fasting venous blood samples were collected by trained medical personnel from all willing participants who had fasted overnight; 5 mL of fasting venous blood was collected in heparin anticoagulant vacuum tubes and centrifuged at 20°C and 2500 rpm for 10 minutes. The plasma was isolated and frozen at −20°C, shipped cold chained to the central laboratory at Capital Medical University in Beijing, and stored at −80°C until biochemical analysis. Blood urea nitrogen, plasma creatine, uric acid, plasma glucose, TC, high-density lipoprotein cholesterol, low-density lipoprotein cholesterol, triglycerides, and vitamin B12 were measured using an automatic biochemistry analyzer (7180; Hitachi, Roche, Basel, Switzerland).
Study outcome during prospective follow-up
The study outcome was all-cause mortality from January 1, 2012, to December 31, 2014. Mortality status was obtained from a CLHLS publicly available dataset, which recorded the vital status of survey participants from baseline to December 31, 2014. If a participant missed the follow-up visit, survival time was defined as the interval between baseline and December 31, 2014.
Statistical analysis
Continuous variables are presented as means ± standard deviations; categorical variables are presented as frequencies (%). Univariate and multivariate Cox regression analysis were used to estimate hazard ratios (HRs) and 95% confidence interval (CI) values for all-cause mortality. Variables with P values <0.05 in the univariate analysis were considered potential influencing factors and included in the multivariate Cox regression analysis. This regression analysis included TC, age, diet (consumption of fresh fruit, fish, eggs, sugar, and nut products), presence of hypertension, systolic blood pressure, and blood urea nitrogen. In this study, we also explored the potentially non-linear relationship between TC and all-cause mortality. To balance best fit and overfitting in the main splines for all-cause mortality, a knot number between three and seven was chosen as the maximum value for the squared multiple correlation coefficient R2 (15). We used multivariate Cox regression models with the restricted cubic splines method, with seven TC knots. To analyze further the relationship between TC and all-cause mortality, we stratified participants into three groups (<3.40, 3.40–4.39, ≥4.39 mmol/L) based on the restricted cubic splines method. To explore differences in the effect of TC on the all-cause mortality for different characteristics, participants were classified into subgroups by age, consumption of fresh fruit, fish, eggs, sugar. The survival probability according to TC category was calculated using the Kaplan–Meier curve, and the log-rank test was used to analyze differences between the groups. The statistical analysis was performed using the R 4.03 statistical package (The R Foundation for Statistical Computing). A two-sided P value of <0.05 was considered to indicate statistical significance.
Results
Baseline characteristics
The baseline characteristics of the study population are summarized in Table 1. Data for 903 participants were analyzed. The mean age of the study population was 95.77 ± 6.40 years. During the 3-year follow-up, 282 participants died, 497 survived, and 124 were lost to follow-up.
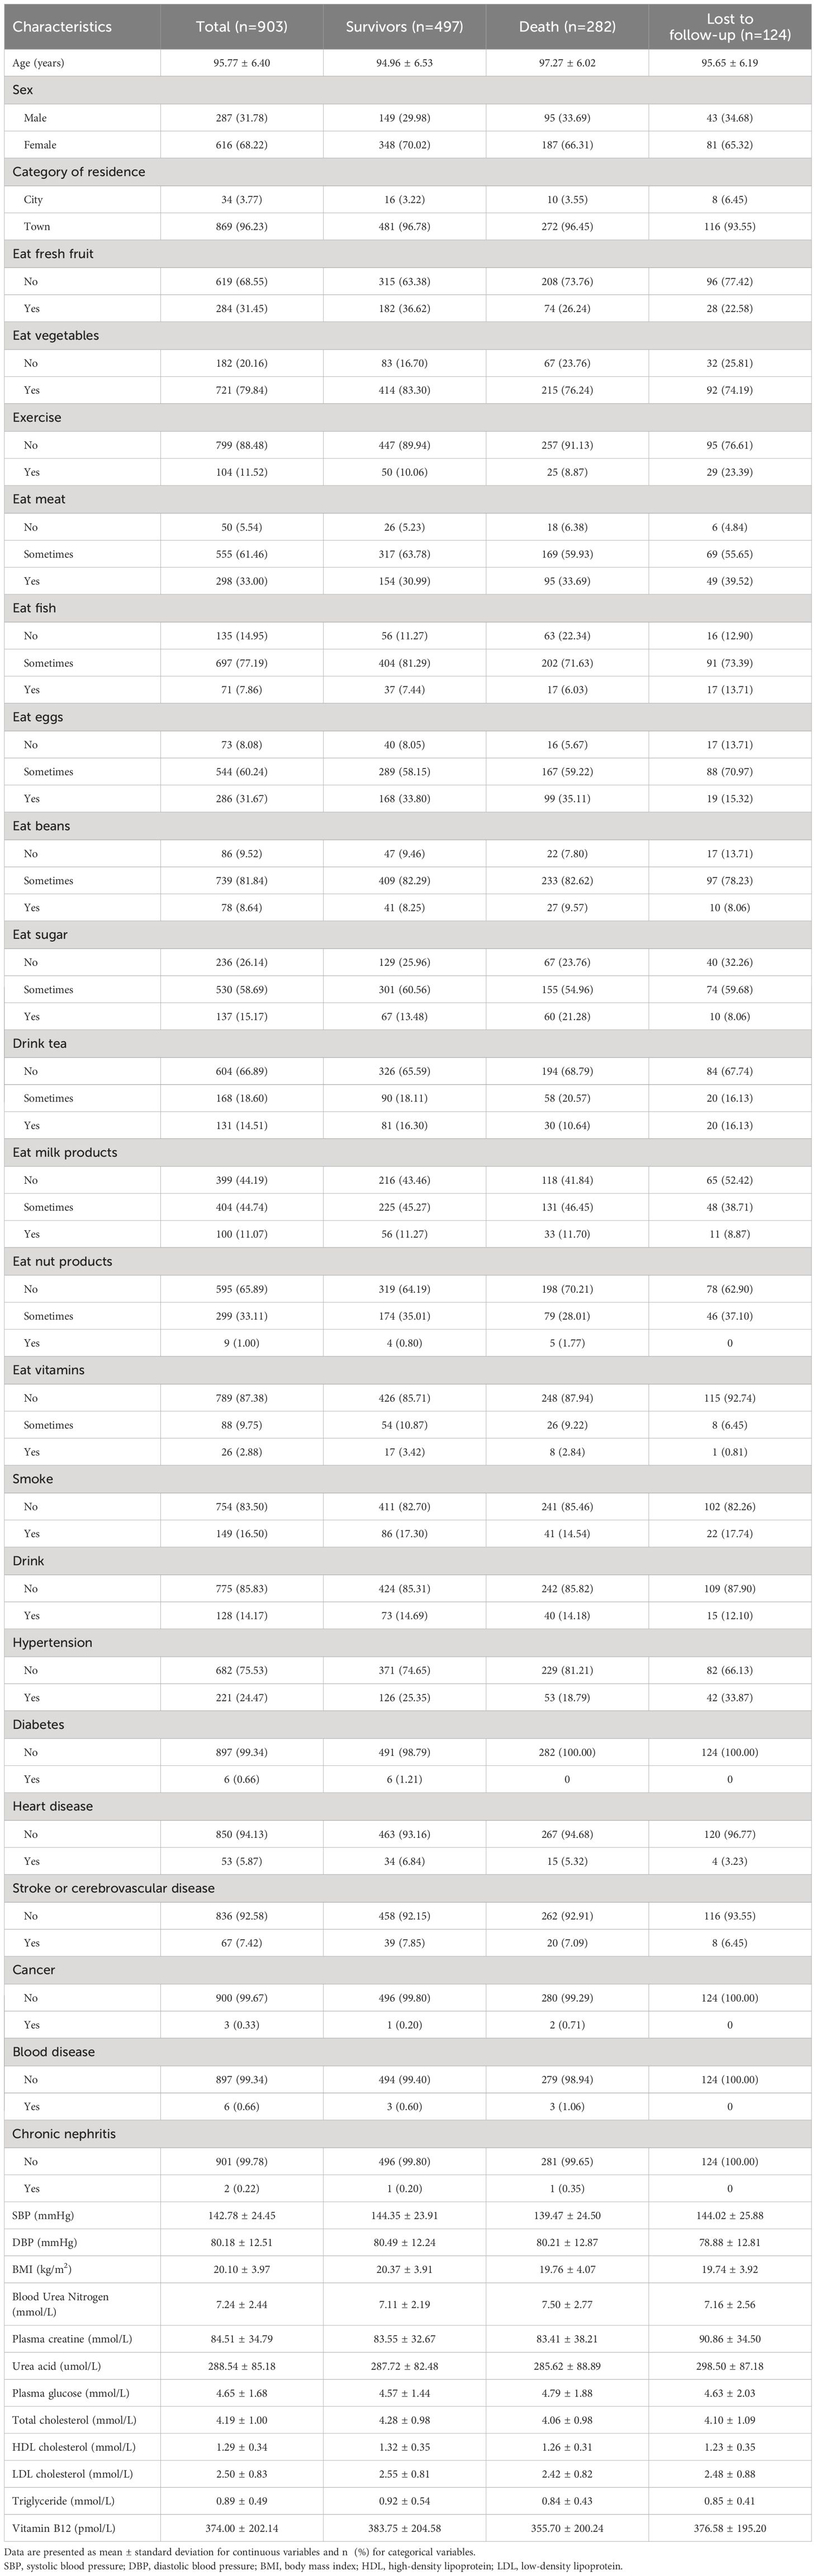
Table 1 Baseline characteristics of the study population.
Association between total cholesterol and all-cause mortality
When TC was used as a continuous variable, there was a significant association between TC and lower risk of all-cause mortality (HR = 0.85, 95% CI: 0.76–0.96; P = 0.011) in the univariate Cox regression analysis. All variables that were significant in the univariate Cox regression analysis were incorporated into the multivariate Cox regression model to assessed the independent predictors of all-cause mortality (Table 2), including age, fresh fruit consumption, fish consumption, egg consumption, sugar consumption, nut product consumption, hypertension, systolic blood pressure, and blood urea nitrogen. After adjusting for these factors, TC remained the primary independent risk factor for all-cause mortality (HR = 0.88, 95% CI: 0.78–1.00; P = 0.043). These results suggest that TC has a protective effect.

Table 2 Hazard ratios for all-cause mortality in the univariate and multivariate Cox regression analysis.
A non-linear relationship between total cholesterol and all-cause mortality
To further evaluate a possible non-linear relationship, the restricted cubic splines method was used to investigate the association between all-cause mortality and TC on a continuous scale. As shown in Figure 2, the multivariate Cox regression models with restricted cubic splines method indicated that the relationship between TC and all-cause mortality might be non-linear. After adjusting for various potential confounders, TC was inversely associated with the risk of all-cause mortality. The optimal TC cutoff values for all-cause mortality were 3.40 mmol/L and 4.39 mmol/L. Lower TC levels (<3.40 mmol/L) were significantly associated with an increased risk of all-cause mortality. However, higher TC levels (≥4.39 mmol/L) were significantly associated with a reduced risk of all-cause mortality. However, the limitation is due to the relatively small sample size and limitations of the modelling method, the confidence intervals of the spline curves included 1 at all TC levels, suggesting that the association between TC and mortality may not be significant, and therefore our derivation of the optimal cut-off point may have been biased.
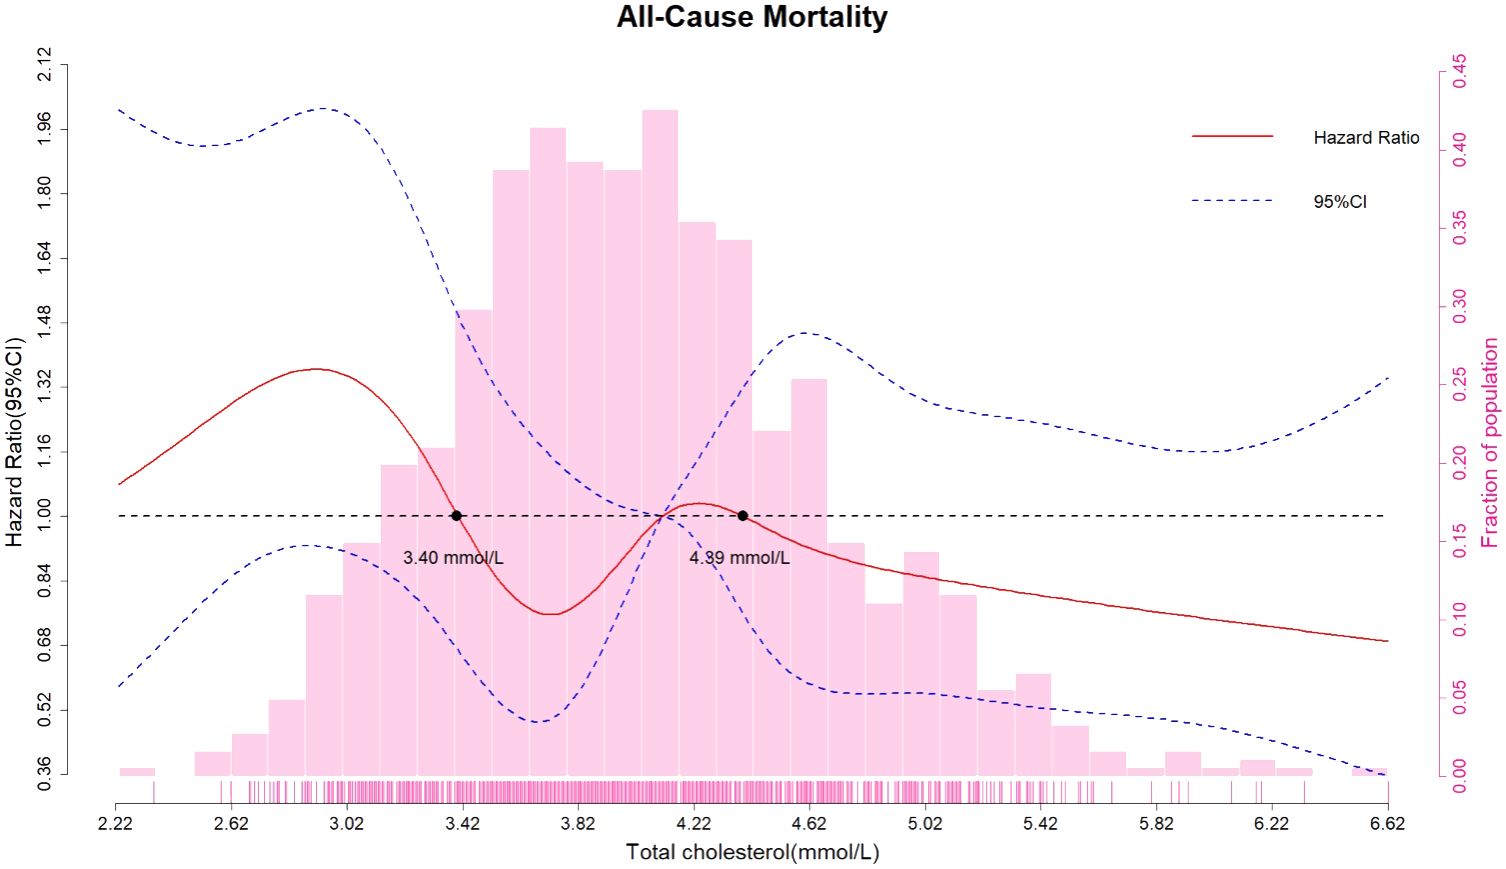
Figure 2 Association between all-cause mortality and total cholesterol on a continuous scale. Hazard ratios (solid red line) and 95% confidence intervals (dashed blue lines) from multivariate Cox regression models using restricted cubic splines method. Reference lines for no association are indicated by the dashed black line (hazard ratio of 1.00). Multivariable adjustment was performed for age, fresh fruit consumption, fish consumption, egg consumption, sugar consumption, nut product consumption, hypertension, systolic blood pressure, and blood urea nitrogen. CI, confidence interval.
All-cause mortality according to total cholesterol categorized by cutoff values
Multivariate Cox regression analysis was used to examine the relationship between TC category and all-cause mortality. Based on the restricted cubic splines method, TC was converted from a continuous variable to a categorical variable. The populations were divided into three groups according to TC categorized by cutoff values. Compared with participants with TC levels of <3.40 mmol/L, participants with TC levels of 3.40–4.39 mmol/L (HR = 0.72, 95% CI: 0.53–0.97; P = 0.029) and ≥4.39 mmol/L (HR = 0.71, 95% CI: 0.52–0.96; P = 0.029) had lower all-cause mortality according to the multivariate Cox regression analysis adjusted for age, fresh fruit consumption, fish consumption, egg consumption, sugar consumption, nut product consumption, hypertension, systolic blood pressure, and blood urea nitrogen (Table 3). In addition, participants with TC levels of ≥3.40 mmol/L (HR = 0.71, 95% CI: 0.54–0.93; P = 0.014) had a significantly lower risk of all-cause mortality than participants with TC levels of <3.40 mmol/L (Table 4).
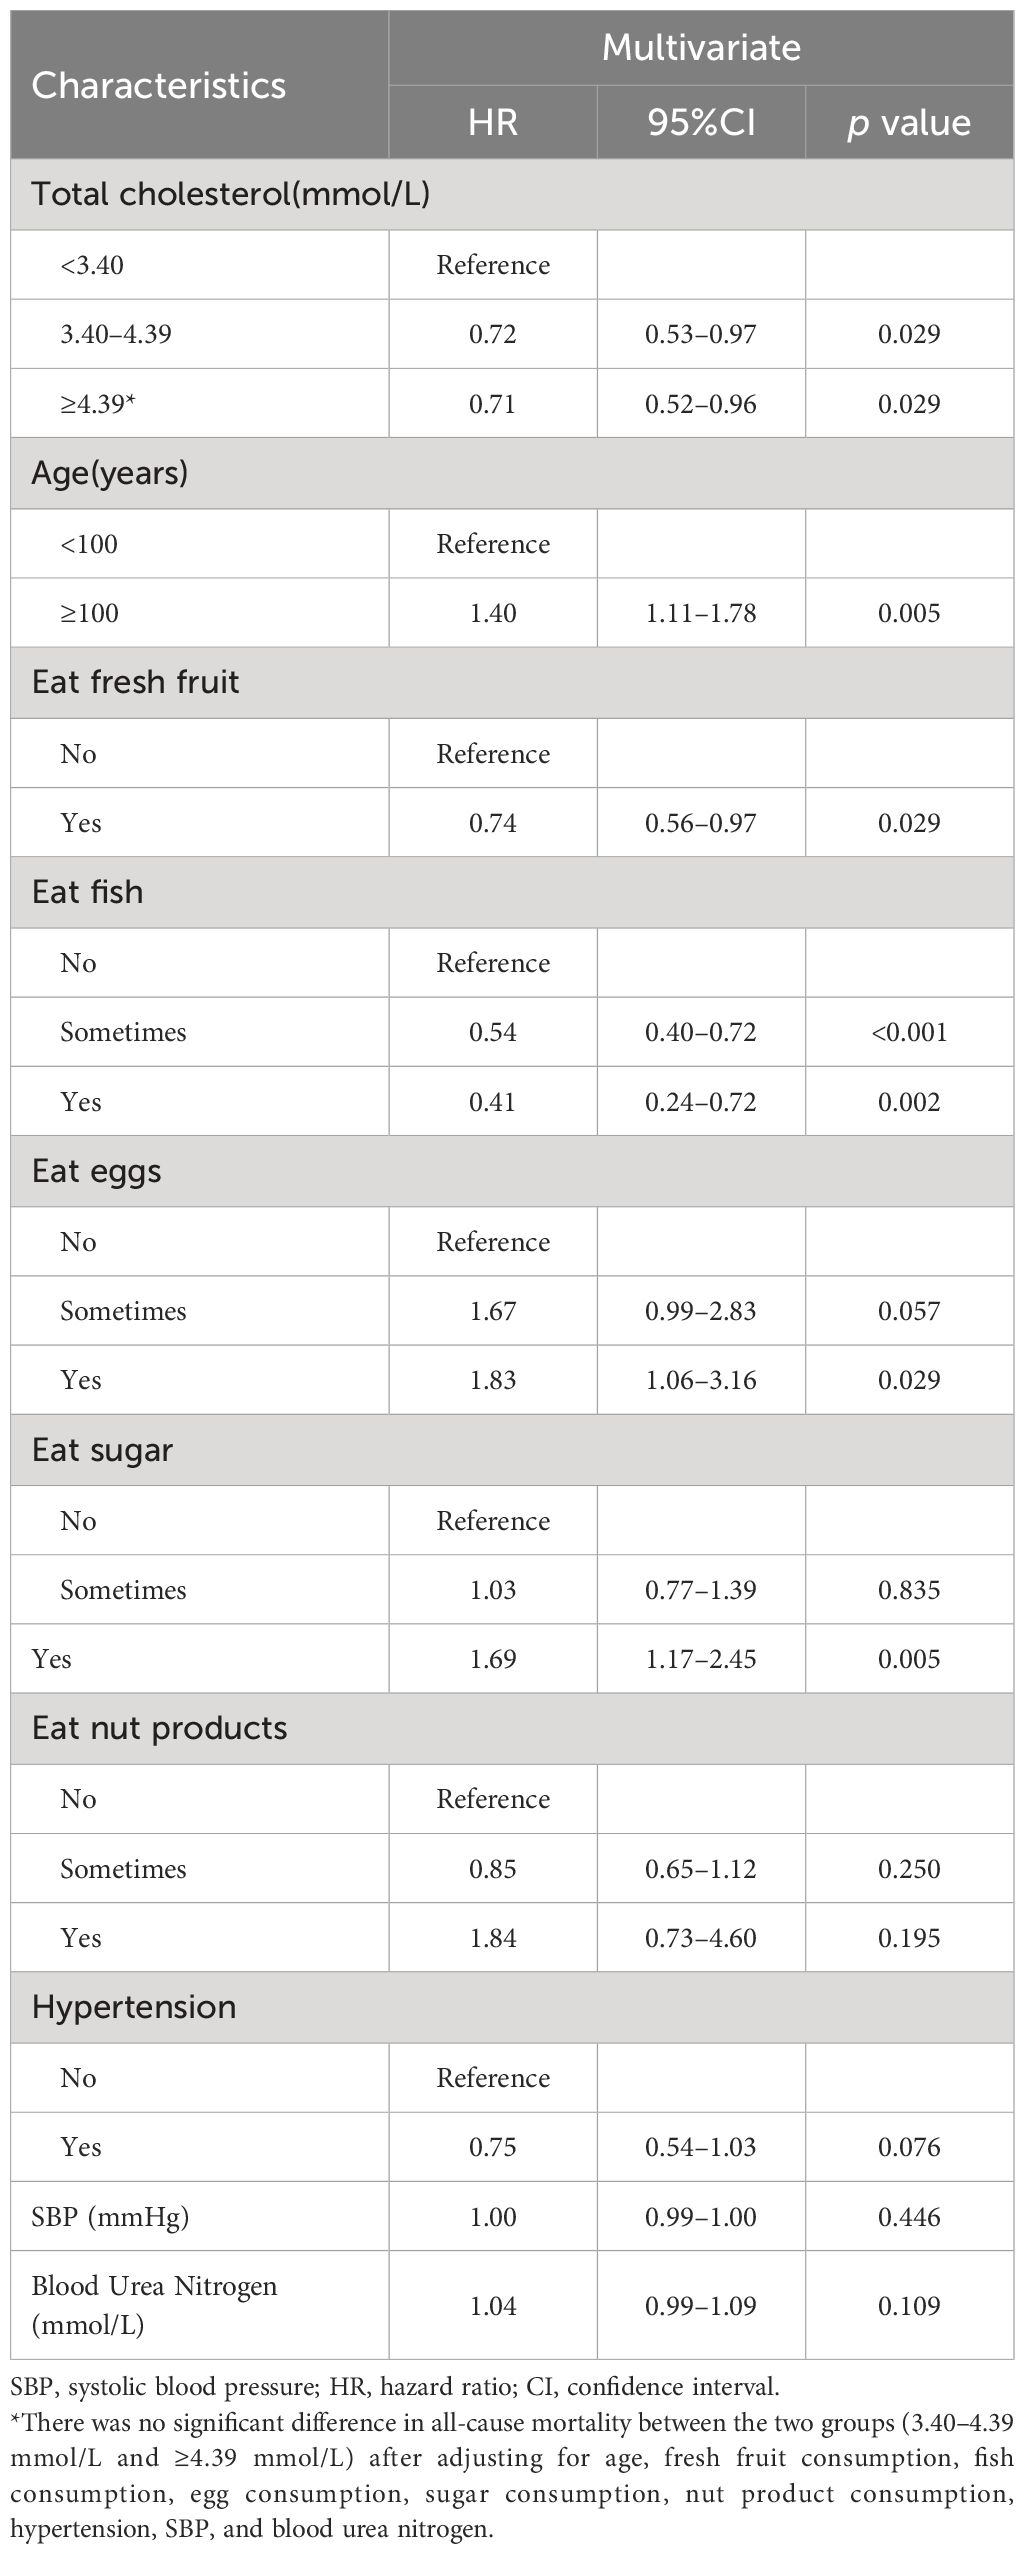
Table 3 Hazard ratios for all-cause mortality according to total cholesterol category: multivariate Cox regression analysis.
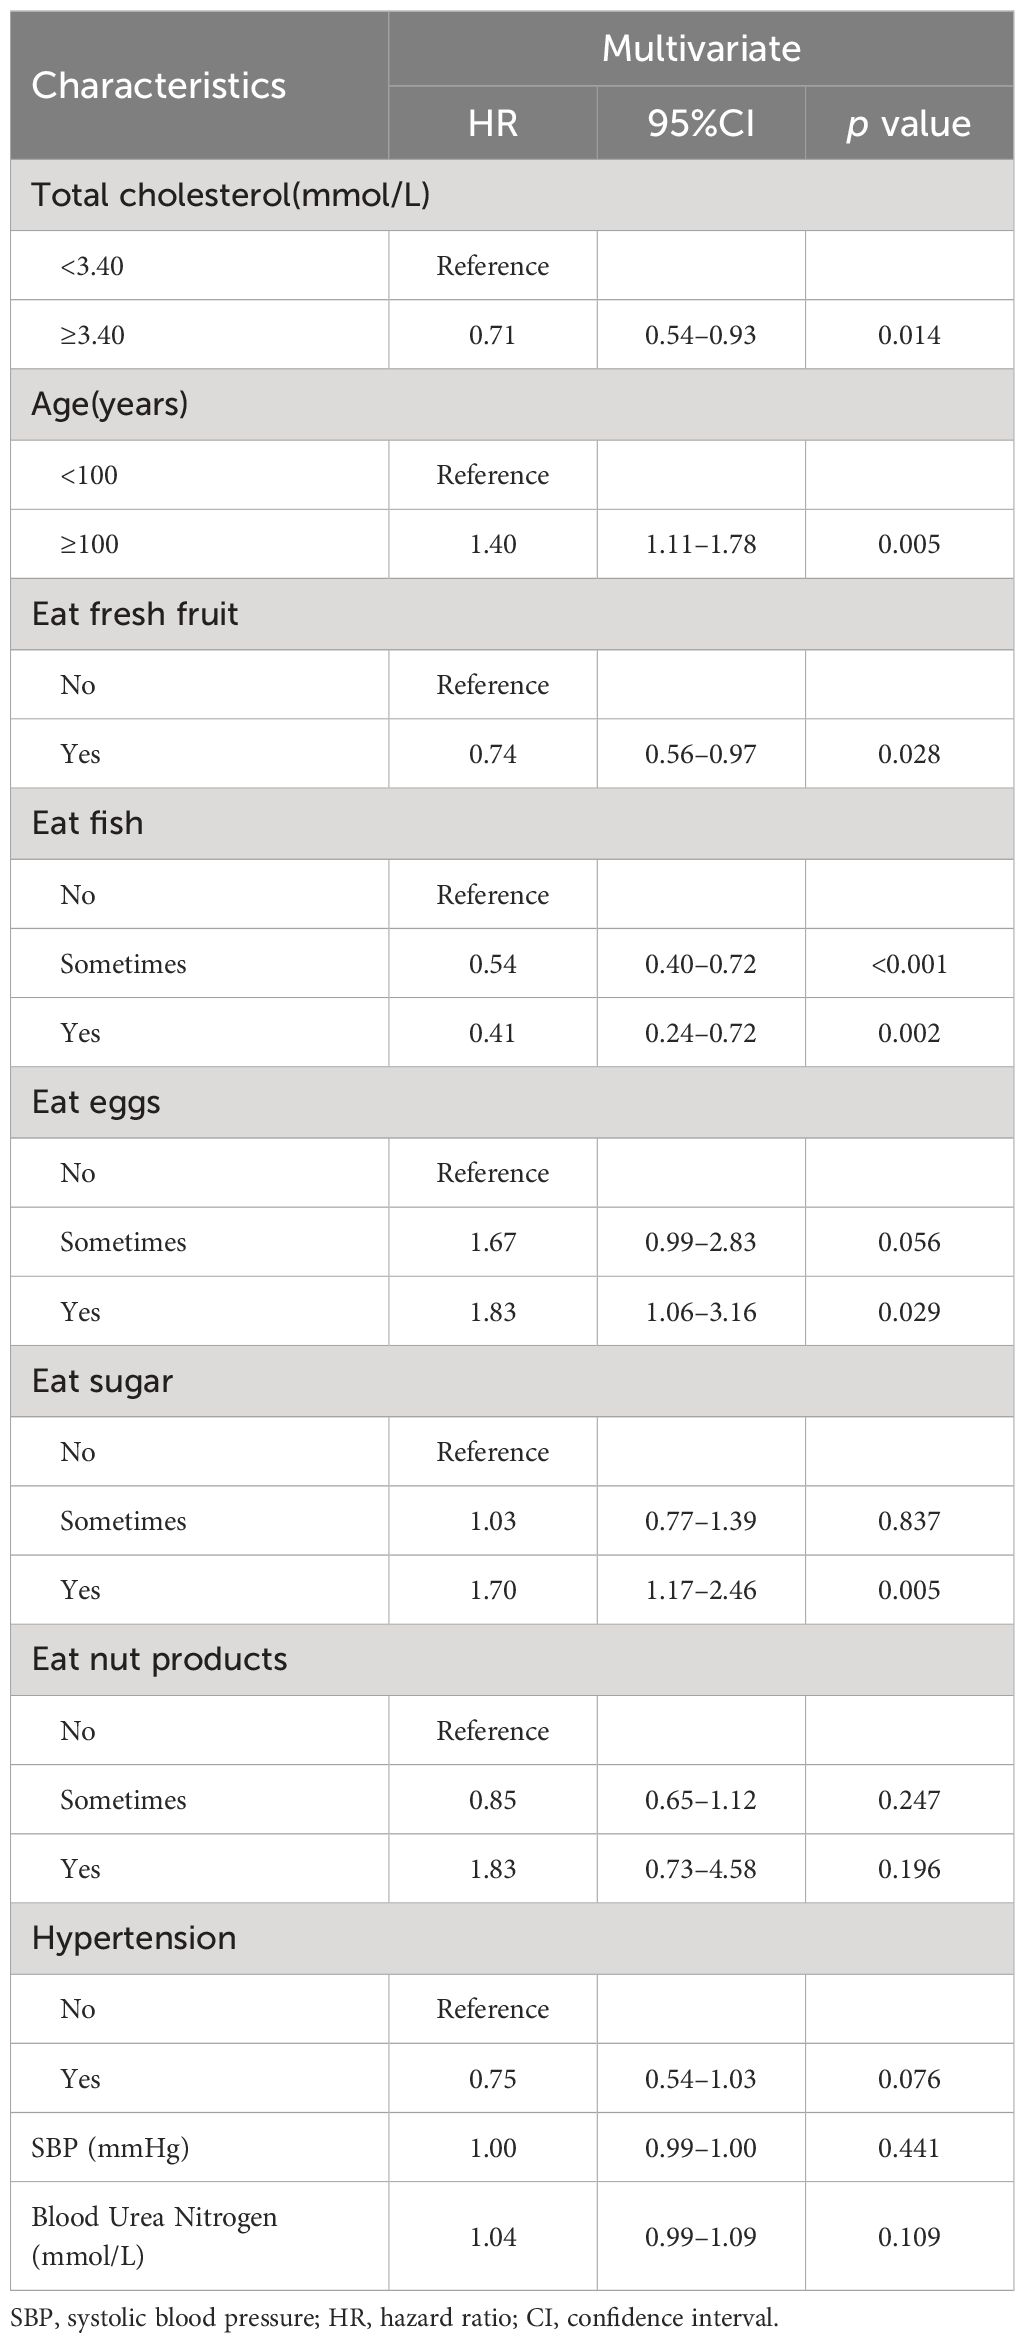
Table 4 Hazard ratios for all-cause mortality according to total cholesterol ≥3.40 mmol/L compared with <3.40 mmol/L: multivariate Cox regression analysis.
Subgroup analysis
Subgroup analysis was performed according to age, consumption of fresh fruit, fish, eggs, sugar (all of which were all-cause mortality potential influencing factors with significant associations in the multivariate analysis). In the subgroup analysis, participants with TC levels of ≥3.40 mmol/L had a significantly lower risk of all-cause mortality than participants with TC levels of <3.40 mmol/L only in the subgroup with age<100 years, sometimes consumption of fish, eggs, sugar. The results of the subgroup analysis are shown in the forest plots in Figure 3.
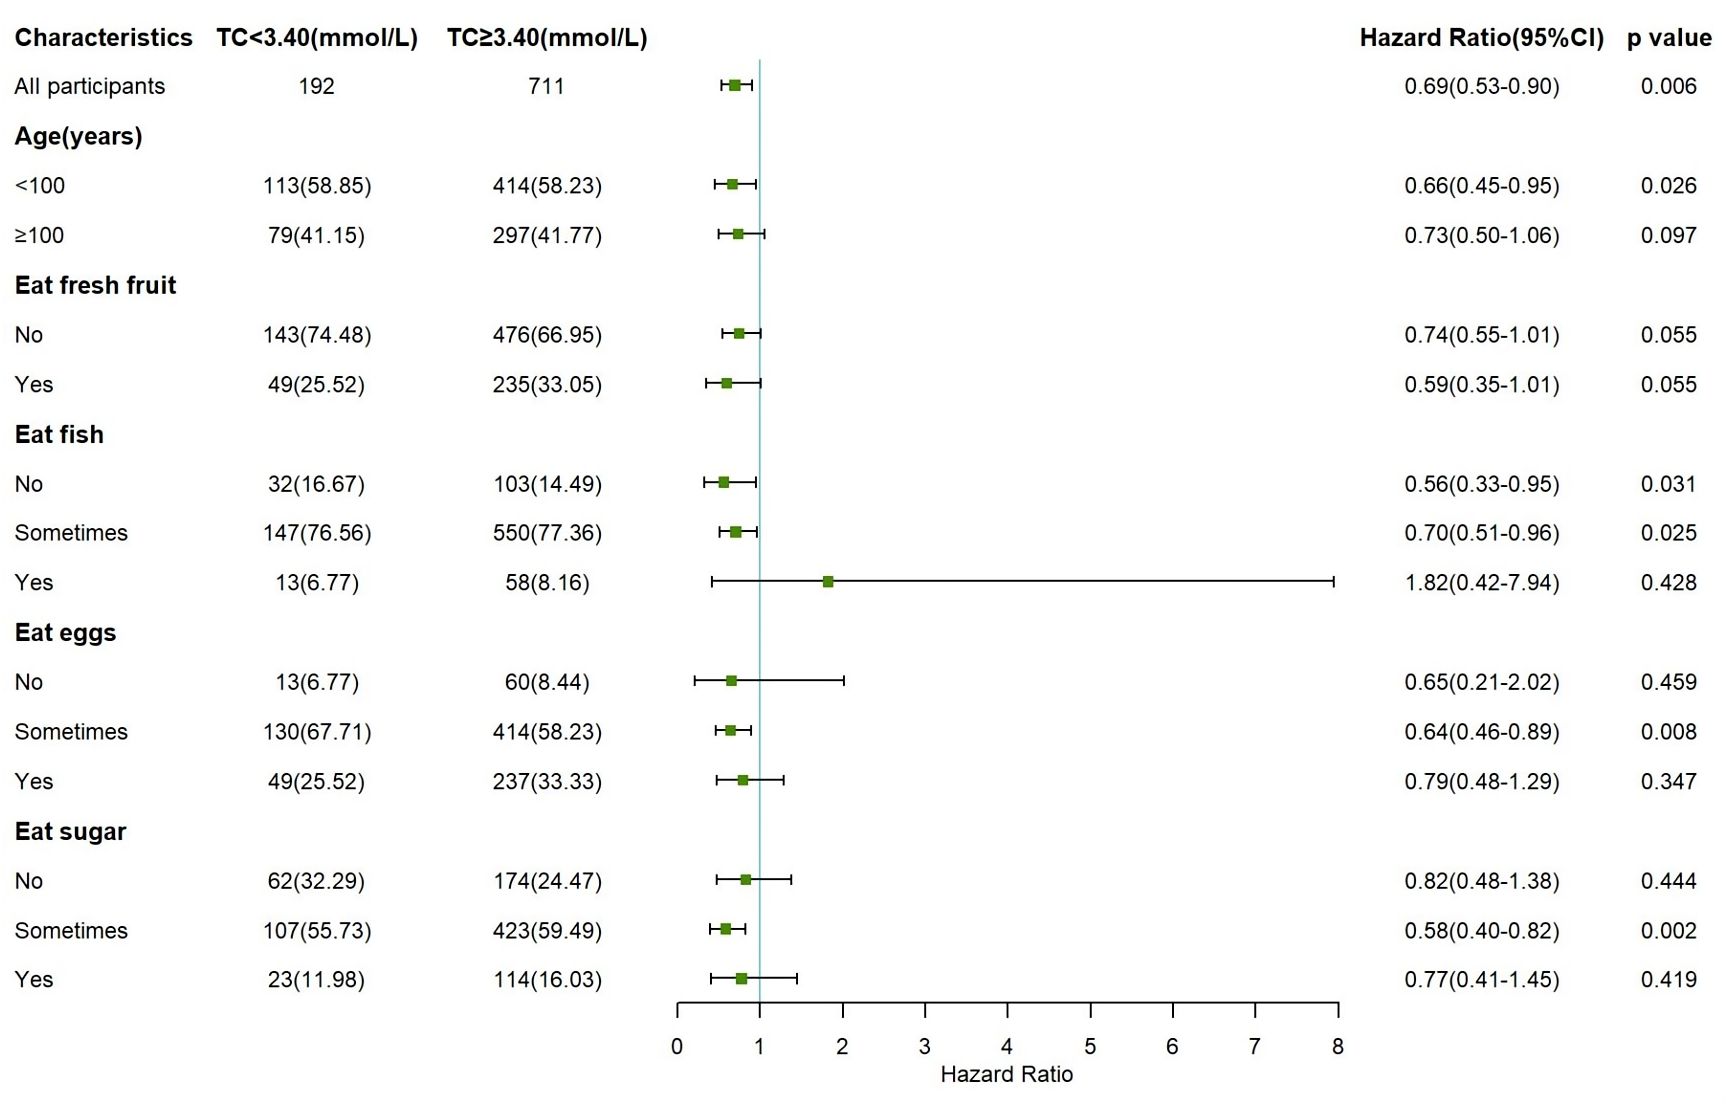
Figure 3 Forest plots showing subgroup analysis of the association between total cholesterol and all-cause mortality according to total cholesterol ≥3.40 mmol/L compared with <3.40 mmol/L (Reference group).
Survival analysis
The Kaplan–Meier survival curves for all-cause mortality according to TC category are shown in Figure 4. Compared with participants with TC < 3.40 mmol/L, participants with TC 3.40 – 4.39 mmol/L and ≥ 4.39 mmol/L had a significantly higher survival probability (P = 0.018). In addition, compared with participants with TC < 3.40 mmol/L, those with TC ≥ 3.40 mmol/L had a significantly higher survival probability (P = 0.006).
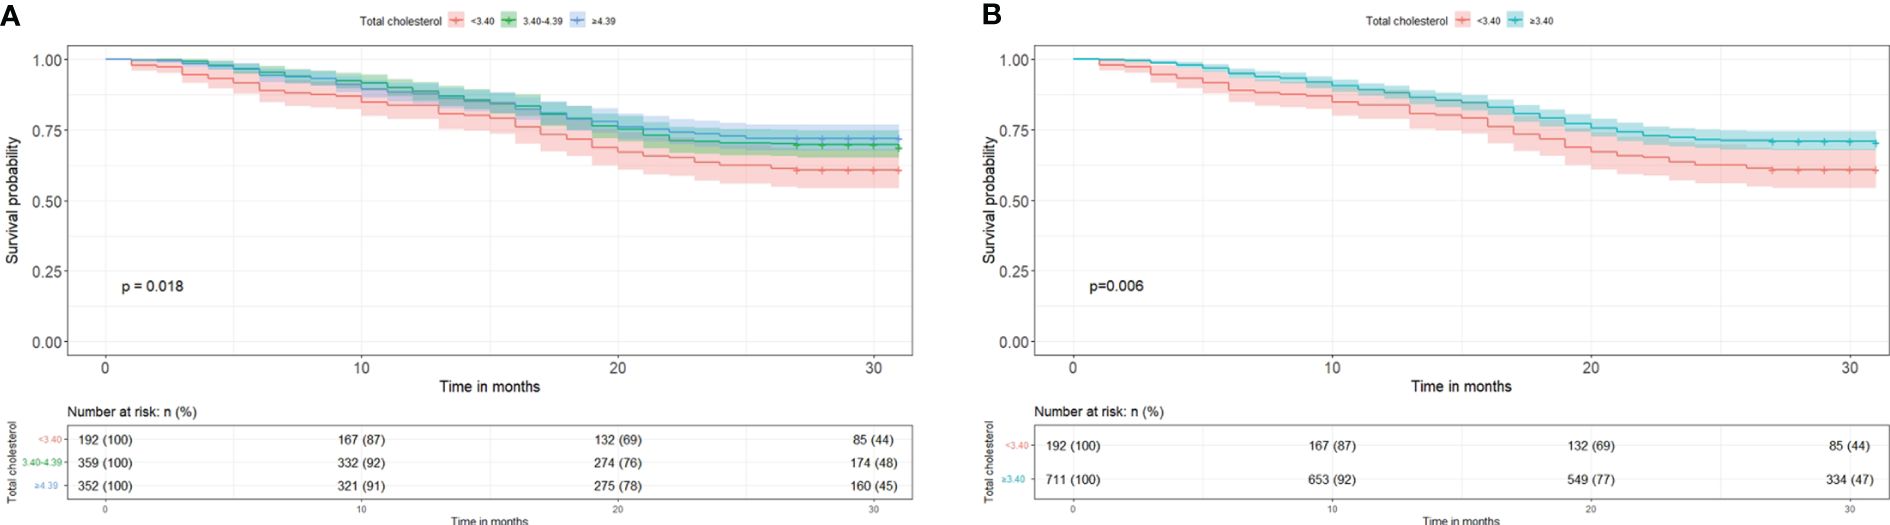
Figure 4 Kaplan–Meier survival curve estimates for all-cause mortality according to total cholesterol category. (A) Total cholesterol was divided into <3.40, 3.40-4.39, and ≥4.39 mmol/L. (B) Total cholesterol was divided into <3.40 and ≥3.40 mmol/L.
Discussion
The present findings showed that a lower TC level was associated with elevated all-cause mortality risk in a population of oldest-old adults (aged ≥85 years). When TC level was used as a continuous variable, the mortality risk increased by 12% with each 1 mmol/L reduction in TC. This is consistent with findings from several previous studies, which demonstrated that a low TC level was a risk factor for all-cause mortality in older people (9, 10). This could be explained by the increased risk of non-cardiovascular mortality (e.g., from cancers and infections) (16). After identifying this inverse association, we further explored the lower limit of TC and found a continuous increment of all-cause mortality risks when TC levels fell below 3.40 mmol/L. This indicates that a TC level <3.40 mmol/L is associated with higher mortality risk among oldest-old adults. To our knowledge, this is the first study to clarify the lower TC cutoff point in this population using the restricted cubic splines method. TC levels decline with age, and it has been suggested that lower TC levels are associated with frailty and chronic disease in seniors (17), which further increases mortality risk.
Some researchers suggest that higher TC levels are associated with better nutritional and chronic health status in the oldest old population; thus, individuals with elevated TC levels are more likely to live longer (18). In the present study, we attempted to exclude the potential effect of dietary or physiological factors by including these variables in the model. In our study, self-reported diabetes, heart disease and stroke were not significantly associated with all-cause mortality, and thus not included as covariates in the final multivariable models. The predictive value of traditional risk factors for mortality may diminish in the oldest old compared to younger populations, as supported by some previous studies (19, 20). As for dietary factors, fresh fruit consumption and fish consumption were protective factors in the multivariable model, whereas daily consumption of eggs and sugar were risk factors for all-cause mortality, which is consistent with previous findings (21–24). Adjustment for dietary behaviors and chronic health conditions did not alter the protective effect of TC on all-cause mortality, indicating that the association between TC and all-cause mortality is independent of nutritional status. Although the biological pathways that link TC to mortality are poorly understood, several mechanisms may explain this inverse association. For example, blood lipids, which are an important component of cell membranes, may affect cell electrophysiology by modulating the distribution and function of some ion channels (25). Low TC levels may contribute to the pathogenesis of some common diseases in older people, such as atrial fibrillation (26). Another potential mechanism is that TC may regulate inflammatory markers such as C-reactive protein and attenuate the biological response to inflammation (27). Therefore, individuals with low TC levels may be more vulnerable to physiological disorders because of enhanced inflammation (28).
The Kaplan–Meier curves showed that during the 3-year follow-up period, individuals with TC levels of 3.40–4.39 mmol/L and ≥4.39 mmol/L had 10.1% and 13.0% higher 2-year survival probabilities, and 6.8% and 12.3% higher 3-year survival probabilities than those with TC levels of <3.40 mmol/L. When we further explored the discrepancy between the 3.40–4.39 mmol/L and ≥4.39 mmol/L groups, in both of which TC served as a protective factor, we found no significant between-group difference in all-cause mortality risk. Previous research suggests that individuals of advanced age may be a select group that has lower TC, because individuals who are susceptible to physiological abnormalities induced by high TC die earlier (10). This is consistent with the distribution of TC levels in the present study, which shifted toward the left. Higher TC levels are associated with increased cardiovascular risk, and the <200 mg/dL (5.18 mmol/L) criteria has been proposed by the National Cholesterol Education Program guideline as a reference for older people to improve survival (7). However, our findings contribute to the growing body of evidence challenging the “lower is better” paradigm for cholesterol levels in older adults, and provide the possibility to limit the optimal TC level between 3.40–5.18 mmol/L. In sum, our study provides valuable data to inform the development of such age-specific guidelines and highlights the need for further research to validate these findings.
There are several study limitations that should be acknowledged. First, the sample size was relatively small and the follow-up period was short owing to the difficulty of obtaining blood samples from the oldest old population. Although our study is one of the largest to date focusing on this population in China, additional studies are needed with larger sample sizes and longer follow-up periods to further investigate the relationship between TC and all-cause mortality in oldest-old adults. Second, comorbidities were self-reported, which might lead to recall bias and underestimation, especially in the oldest old. It thus potentially attenuated the associations between self-reported comorbidities and mortality. Third, although dietary behaviors and chronic health status were included in the multivariable model, other biochemical indexes such as inflammatory markers may also affect the association between TC level and all-cause mortality. Future research should take into account a wider range of potential confounding factors. Fourth, although the data were drawn from a national longitudinal study of older people, they are not representative of the general population and younger seniors. However, the results may still have important implications for the ongoing search for longevity. Besides, we did not obtain information about death-specific mortality, and so could not determine whether lower TC levels are associated with increased mortality risk of cancers, infections, and other diseases. Finally, the last limitation is the lack of interaction tests for the subgroup analyses due to insufficient statistical power with the current sample size. Larger studies are warranted to formally assess potential effect modifiers. Alternatively, future studies could consider applying Bayesian methods to obtain more stable estimates of interaction effects in the presence of low event rates within subgroups.
Data availability statement
The original contributions presented in the study are included in the article/supplementary material. Further inquiries can be directed to the corresponding authors.
Ethics statement
The studies involving humans were approved by research ethics committee of Peking University (IRB00001052-13074). The studies were conducted in accordance with the local legislation and institutional requirements. The participants provided their written informed consent to participate in this study.
Author contributions
FH: Data curation, Formal Analysis, Methodology, Visualization, Writing – original draft. ZW: Data curation, Formal Analysis, Methodology, Visualization, Writing – original draft. YL: Data curation, Methodology, Writing – original draft. YG: Conceptualization, Formal Analysis, Methodology, Writing – original draft. SL: Conceptualization, Investigation, Methodology, Writing – original draft. CX: Conceptualization, Data curation, Investigation, Writing – original draft. YW: Data curation, Methodology, Resources, Writing – original draft. YC: Data curation, Methodology, Resources, Writing – original draft.
Funding
The author(s) declare financial support was received for the research, authorship, and/or publication of this article. Shanghai Three-Year Action Plan for Public Health under Grant (GWVI-11.1-29). Science and Technology Commission Shanghai Municipality (No.20JC1410204). The funders had no role in the study design, data collection and analysis, decision to publish, or preparation of the manuscript.
Acknowledgments
We appreciate the Center for Healthy Aging and Development Studies of National School of Development at Peking University for leading this long-term cohort study, as well as the researchers and investigators who participated during all surveys and follow-ups. We thank Diane Williams, PhD, from Edanz Group China (https://www.liwenbianji.cn) for editing a draft of this manuscript.
Conflict of interest
The authors declare that the research was conducted in the absence of any commercial or financial relationships that could be construed as a potential conflict of interest.
Publisher’s note
All claims expressed in this article are solely those of the authors and do not necessarily represent those of their affiliated organizations, or those of the publisher, the editors and the reviewers. Any product that may be evaluated in this article, or claim that may be made by its manufacturer, is not guaranteed or endorsed by the publisher.
References
1. WHO. World health statistics 2023: monitoring health for the SDGs, sustainable development goals (2023). Available online at: https://www.who.int/publications/i/item/9789240074323.
2. Department of Planning, Development and Information Technology. Statistical Bulletin on the Development of China's health Undertakings in 2021 (2022). Available online at: http://www.nhc.gov.cn/guihuaxxs/s3586s/202207/51b55216c2154332a660157abf28b09d.shtml.
3. WHO. Ageing and health (2021). Available online at: https://www.who.int/news-room/fact-sheets/detail/ageing-and-health.
4. Tian F, Chen L, Qian ZM, Xia H, Zhang Z, Zhang J, et al. Ranking age-specific modifiable risk factors for cardiovascular disease and mortality: evidence from a population-based longitudinal study. EClinicalMedicine. (2023) 64:102230. doi: 10.1016/j.eclinm.2023.102230
5. Prospective Studies Collaboration, Lewington S, Whitlock G, Clarke R, Sherliker P, Emberson J, Halsey J, et al. Blood cholesterol and vascular mortality by age, sex, and blood pressure: a meta-analysis of individual data from 61 prospective studies with 55,000 vascular deaths. Lancet. (2007) 370:1829–39. doi: 10.1016/S0140-6736(07)61778-4
6. MRC/BHF. Heart Protection Study of cholesterol lowering with simvastatin in 20,536 high-risk individuals: a randomised placebo-controlled trial. Lancet. (2002) 360:7–22. doi: 10.1016/S0140-6736(02)09327-3
7. Third Report of the National Cholesterol Education Program (NCEP). Expert Panel on Detection, Evaluation, and Treatment of High Blood Cholesterol in Adults (Adult Treatment Panel III) final report. Circulation. (2002) 106:3143–421.
8. SChade DS, Shey L, Eaton RP. Cholesterol review: A metabolically important molecule. Endocr Pract. (2020) 26:1514–23. doi: 10.4158/EP-2020-0347
9. Weverling-Rijnsburger AW, Blauw GJ, Lagaay AM, Knook DL, Meinders AE, Westendorp RG. Total cholesterol and risk of mortality in the oldest old. Lancet. (1997) 350:1119–23. doi: 10.1016/S0140-6736(97)04430-9
10. Schatz IJ, Masaki K, Yano K, Chen R, Rodriguez BL, Curb JD. Cholesterol and all-cause mortality in elderly people from the Honolulu Heart Program: a cohort study. Lancet. (2001) 358:351–5. doi: 10.1016/S0140-6736(01)05553-2
11. Yi SW, Yi JJ, Ohrr H. Total cholesterol and all-cause mortality by sex and age: a prospective cohort study among 12.8 million adults. Sci Rep. (2019) 9:1596. doi: 10.1038/s41598-018-38461-y
12. Studies CfHAaD. The Chinese Longitudinal Healthy Longevity Survey (CLHLS)-Longitudinal Data(1998–2018). Beijing, China: Peking University Open Research Data Platform (2020).
13. Guo H, Zhang Y, Wang Z, Shen H. Sleep quality partially mediate the relationship between depressive symptoms and cognitive function in older chinese: A longitudinal study across 10 years. Psychol Res Behav management. (2022) 15:785–99. doi: 10.2147/PRBM.S353987
14. Bai W, Zhang J, Smith RD, Cheung T, Su Z, Ng CH, et al. Inter-relationship between cognitive performance and depressive symptoms and their association with quality of life in older adults: A network analysis based on the 2017–2018 wave of Chinese Longitudinal Healthy Longevity Survey (CLHLS). J Affect Disord. (2023) 320:621–7. doi: 10.1016/j.jad.2022.09.159
15. Harrell FE Jr., Lee KL, Mark DB. Multivariable prognostic models: issues in developing models, evaluating assumptions and adequacy, and measuring and reducing errors. Stat Med. (1996) 15:361–87. doi: 10.1002/(SICI)1097-0258(19960229)15:4<361::AID-SIM168>3.0.CO;2-4
16. Liang Y, Vetrano DL, Qiu C. Serum total cholesterol and risk of cardiovascular and non-cardiovascular mortality in old age: a population-based study. BMC Geriatr. (2017) 17:294. doi: 10.1186/s12877-017-0685-z
17. Schupf N, Costa R, Luchsinger J, Tang MX, Lee JH, Mayeux R. Relationship between plasma lipids and all-cause mortality in nondemented elderly. J Am Geriatr Soc. (2005) 53:219–26. doi: 10.1111/j.1532-5415.2005.53106.x
18. Manolio TA, Ettinger WH, Tracy RP, Kuller LH, Borhani NO, Lynch JC, et al. Epidemiology of low cholesterol levels in older adults. The Cardiovascular Health Study. Circulation. (1993) 87:728–37. doi: 10.1161/01.cir.87.3.728
19. Lv YB, Gao X, Yin ZX, Chen SH, Luo JS, Brasher MS, et al. Revisiting the association of blood pressure with mortality in oldest old people in China: community based, longitudinal prospective study. BMJ. (2018) 361:k2158. doi: 10.1136/bmj.k2158
20. van Bemmel T, Gussekloo J, Westendorp RG, Blauw GJ. In a population-based prospective study, no association between high blood pressure and mortality after age 85 years. J Hypertens. (2006) 24:287–92. doi: 10.1097/01.hjh.0000200513.48441.8e
21. Buil-Cosiales P, Zazpe I, Toledo E, Corella D, Salas-Salvadó J, Diez-Espino J, et al. Fiber intake and all-cause mortality in the Prevención con Dieta Mediterránea (PREDIMED) study. Am J Clin Nutr. (2014) 100:1498–507. doi: 10.3945/ajcn.114.093757
22. Burr ML, Fehily AM, Gilbert JF, Rogers S, Holliday RM, Sweetnam PM, et al. Effects of changes in fat, fish, and fibre intakes on death and myocardial reinfarction: diet and reinfarction trial (DART). Lancet. (1989) 2:757–61. doi: 10.1016/S0140-6736(89)90828-3
23. Zhong VW, Van Horn L, Cornelis MC, Wilkins JT, Ning H, Carnethon MR, et al. Associations of dietary cholesterol or egg consumption with incident cardiovascular disease and mortality. Jama. (2019) 321:1081–95. doi: 10.1001/jama.2019.1572
24. Liu K, Stamler J, Trevisan M, Moss D. Dietary lipids, sugar, fiber and mortality from coronary heart disease. Bivariate analysis of international data. Arteriosclerosis. (1982) 2:221–7. doi: 10.1161/01.ATV.2.3.221
25. Balse E, El-Haou S, Dillanian G, Dauphin A, Eldstrom J, Fedida D, et al. Cholesterol modulates the recruitment of Kv1.5 channels from Rab11-associated recycling endosome in native atrial myocytes. Proc Natl Acad Sci U.S.A. (2009) 106:14681–6. doi: 10.1073/pnas.0902809106
26. Lopez FL, Agarwal SK, Maclehose RF, Soliman EZ, Sharrett AR, Huxley RR, et al. Blood lipid levels, lipid-lowering medications, and the incidence of atrial fibrillation: the atherosclerosis risk in communities study. Circ Arrhythm Electrophysiol. (2012) 5:155–62. doi: 10.1161/CIRCEP.111.966804
27. Saito M, Ishimitsu T, Minami J, Ono H, Ohrui M, Matsuoka H. Relations of plasma high-sensitivity C-reactive protein to traditional cardiovascular risk factors. Atherosclerosis. (2003) 167:73–9. doi: 10.1016/S0021-9150(02)00380-5
Keywords: total cholesterol, all-cause mortality, oldest old, Cox regression, cohort study
Citation: Hu F, Wang Z, Liu Y, Gao Y, Liu S, Xu C, Wang Y and Cai Y (2024) Association between total cholesterol and all-cause mortality in oldest old: a national longitudinal study. Front. Endocrinol. 15:1405283. doi: 10.3389/fendo.2024.1405283
Received: 22 March 2024; Accepted: 29 May 2024;
Published: 13 June 2024.
Edited by:
Xilin Yang, Tianjin Medical University, ChinaReviewed by:
Mozhu Ding, Karolinska Institutet (KI), SwedenPei-Liang Chen, Southern Medical University, China
Copyright © 2024 Hu, Wang, Liu, Gao, Liu, Xu, Wang and Cai. This is an open-access article distributed under the terms of the Creative Commons Attribution License (CC BY). The use, distribution or reproduction in other forums is permitted, provided the original author(s) and the copyright owner(s) are credited and that the original publication in this journal is cited, in accordance with accepted academic practice. No use, distribution or reproduction is permitted which does not comply with these terms.
*Correspondence: Yong Cai, Y2FpeW9uZzIwMjAyOEBob3RtYWlsLmNvbQ==; Ying Wang, eWluZ3dhbmd4dW5Ab3V0bG9vay5jb20=
†These authors have contributed equally to this work and share first authorship