 Ruoyu Gou
 Danni Dou2†
 Guanghua Li
- 1School of Public Health, Ningxia Medical University, Yinchuan, Ningxia, China
- 2School of Basic Medicine, Ningxia Medical University, Yinchuan, Ningxia, China
Background: Hyperuricemia (HUA) is a glo\bal public health problem. The etiology of HUA is complex and efficient and accurate assessment metrics are still lacking when conducting large-scale epidemiologic screening. The aim of this study was to evaluate the association of the triglyceride glucose (TyG) index, TyG-body mass index (BMI), TyG-waist-to-height ratio (WHtR) with the risk of HUA.
Methods: Based on data collected from the National Health and Nutrition Examination Survey (NHANES) in the United States and the China Health and Aging Longitudinal Study (CHARLS) in China, a total of 14,286 U.S. adults and 4,620 Chinese adults were included in the analysis. The study examined the levels of TyG, TyG-BMI, TyG-WHtR, and TyG-WC. Multivariate logistic regression was utilized to investigate the relationships between these variables and hyperuricemia (HUA), separately. Additionally, the study used restricted cubic splines (RCS) to explore the linear associations of TyG, TyG-BMI, TyG-WHtR, TyG-WC, and HUA, separately.
Results: The NHANES results showed that TyG [Q2, 1.58(1.26, 1.98); Q3, 2.36 (1.94, 2.88); Q4, 3.21 (2.61, 3.94)], TyG-BMI [Q2, 2.14 (1.74, 2.65); Q3, 3.38 (2.74, 4.17); Q4, 6.70 (5.55, 8.02)], TyG-WHtR [Q2, 1.92 (1.56, 2.36); Q3, 3.14 (2.56, 3.85); Q4, 6.28 (5.12, 7.69)], TyG-WC [Q2, 2.32 (1.85, 2.90); Q3, 3.51 (2.84, 4.34); Q4, 7.32 (5.95, 9.02)] were identified as risk factors for hyperuricemia (HUA). Similarly, the CHARLS results, when fully adjusted for covariates, indicated that TyG [Q4, 2.36 (1.08, 5.15)], TyG-BMI [Q3, 2.60 (1.05, 6.41); Q4, 3.70 (1.64, 8.32)], TyG-WHtR (Q4, 2.84 (1.23, 6.55), TyG-WC [Q4, 2.85 (1.23, 6.5)] were also risk factors for HUA. The predictive ability of each indicator for the risk of developing HUA was stronger in women than in men. Furthermore, there was an observed nonlinear relationship between TyG, TyG-BMI, TyG-WHtR, TyG-WC, and HUA in both the NHANES and CHARLS datasets (P-nonlinearity < 0.05).
Conclusion: These findings suggest that TyG, TyG-BMI, TyG-WHtR and TyG-WC are associated with an increased risk of HUA. They are potential indicators for screening HUA status in the general population in China and the United States.
1 Introduction
Hyperuricemia (HUA) is characterized by elevated serum uric acid (SUA) levels, often attributed to either heightened uric acid synthesis or diminished urinary elimination. Uric acid, a byproduct of purine breakdown, is primarily eliminated via the kidneys, as humans lack the enzyme uricase. Disruptions in purine metabolism, increased uric acid production, or impaired excretion can result in uric acid dysregulation, leading to various complications like gout, kidney stones, metabolic syndrome, hypertension, and cardiovascular disease (1–3), the etiology of HUA has not been fully elucidated. The prevalence of HUA is increasing with the continuous improvement of living standards and changes in people’s dietary habits (4). HUA has been reported in 14.0% of Chinese adults in a 2018 survey (5), and according to the NHANES, approximately 20% of U.S. adults have HUA (6), and it is estimated that approximately 8.9-24.4% of the general population have HUA (7). In recent years, HUA has emerged as a significant global public health concern.
Insulin-normoglycemic clamp is the gold standard for assessing IR status (8). The assessment process for IR is invasive, expensive, and complex, making it less than ideal for routine clinical monitoring. However, there are other practical and feasible tools available that do not rely on serum insulin levels to assess IR status (9). Some novel and simple metrics, such as TyG, TyG-BMI, TyG-WHtR and TyG-WC, and TyG-waist circumference (WC), have been reported as reliable alternatives for assessing IR (10–12). When TyG is combined with other indicators of obesity such as BMI, WC, and WHtR, its effectiveness in assessing IR may be enhanced (13, 14), may be more feasible and practical than other expensive methods. The TyG index demonstrates a high sensitivity of 96.5% and specificity of 85.0% in diagnosing IR when compared to IR (15). This suggests that TyG-associated markers in combination with the obesity index are more effective as surrogate markers than TyG in reflecting the degree of IR (9, 16). A Chinese study pointed out that high levels of TyG-WC are an independent risk factor for First Myocardial Infarction in patients with hypertension and OSA (17) and are associated with an increased risk of CKD (18). Additionally, TyG predicted mortality risk and was synergistic with SUA on mortality risk (19). It is well known that the lower the glomerular filtration rate (GFR), the higher the prevalence of hyperuricemia and gout (20). However, for patients at cardiovascular risk, hyperuricemia is a risk factor for cardiovascular and all-cause mortality in addition to eGFR and proteinuria (21).
Several studies have found a higher prevalence of HUA in diabetic patients compared to non-diabetic individuals. The strong association between HUA and the severity of diabetes mellitus indicates a potential relationship with blood glucose levels (6). Previous studies have shown that insulin resistance (IR) may contribute to HUA (22) and that reducing IR may reduce SUA levels and subsequent risk of gout (23, 24). TyG-derived indices seem to correlate more strongly with the risk of hyperuricemia than TyG indices (15). Additionally, a Mendelian randomization study indicated that pancreatic hyperinsulinemia may induce HUA, Zhu et al. showed that elevated UA levels preceded IR (25), and Hu et al. revealed a correlation between elevated UA levels and elevated risk of IR by Mendelian randomization analysis, but no significant causal relationship was found (26). A study from Jiangxi Province, China, reported that an increase in IR indices was associated with the risk of HUA in hypertensive patients (27). Another study noted that the effect of TyG index on HUA in hypertensive patients was closely related to the degree of hypertension prevalence, and the correlation between TyG index and HUA was significantly higher in patients with grade 1-2 hypertension than in patients with grade 3 hypertension (22). The findings of another study are more clinically relevant, the degree of association between hyperuricemia and lipids varied when different cutoff values were used to diagnose hyperuricemia, in the Uric Acid Right for Heart Health (URRAH) study (28). The study indicated that the diagnostic criteria for uric acidemia was 6.0 mg/dl for women and 7.0 mg/dl for men, but the new finding in the URRAH study was 5.1 mg/dl for women and 5.6 mg/dl for the form (28).
Current research on the relationship between TyG index and SUA levels is limited, with most studies focusing on Chinese populations. This study, however, provides a nationally representative analysis of the impact of four IR substitutes on HUA development in both China and the United States. By utilizing data from CHARLS and NHANES, which offer broad geographic coverage and rigorous implementation procedures, our findings are reflective of the general population in both countries. While previous studies have supported this hypothesis, they often lack generalizability. The hypothesis is that TyG and its derived indices are risk factors for HUA and can increase the risk of developing HUA. Early detection and management of IR in HUA patients, prior to the onset of clinical symptoms, could aid in managing HUA and preventing IR-related comorbidities, with significant insights provided by individual studies.
2 Materials and methods
2.1 Data sources and study population
Two large nationally representative datasets from China [China Health and Aging Longitudinal Study (CHARLS)] and the United States [National Health and Nutrition Examination Survey (NHANES)] were used. For China, we use CHARLS 2011-2012 survey data, and for the U.S., we aggregate data from 10 NHANES cycles from 1999-2018.The details of CHARLS and NHANES have been described elsewhere (29, 30). CHARLS is a nationally representative survey being conducted in China. NHANES is a nationally representative cross-sectional survey of the noninstitutionalized U.S. population. Using stratified multistage probability sampling methods, data were collected in two-year cycles beginning in 1999-2000, selecting a series of nationally representative samples of noninstitutionalized U.S. adults. The NHANES program was approved by the Ethics Review Board of the National Center for Health Statistics. Both CHARLS and NHANES collect information on demographic characteristics, medical history, prescription drug use, and laboratory tests. Results from CHARLS and NHANES can be weighted to obtain nationally representative estimates. CHARLS (http://charls.pku.edu.cn/) and NHANES (http://www.cdc.go/nchs/nhanes.htm) data are available on their respective Web sites All participants provided written informed consent. The participant screening process is illustrated in Figure 1.
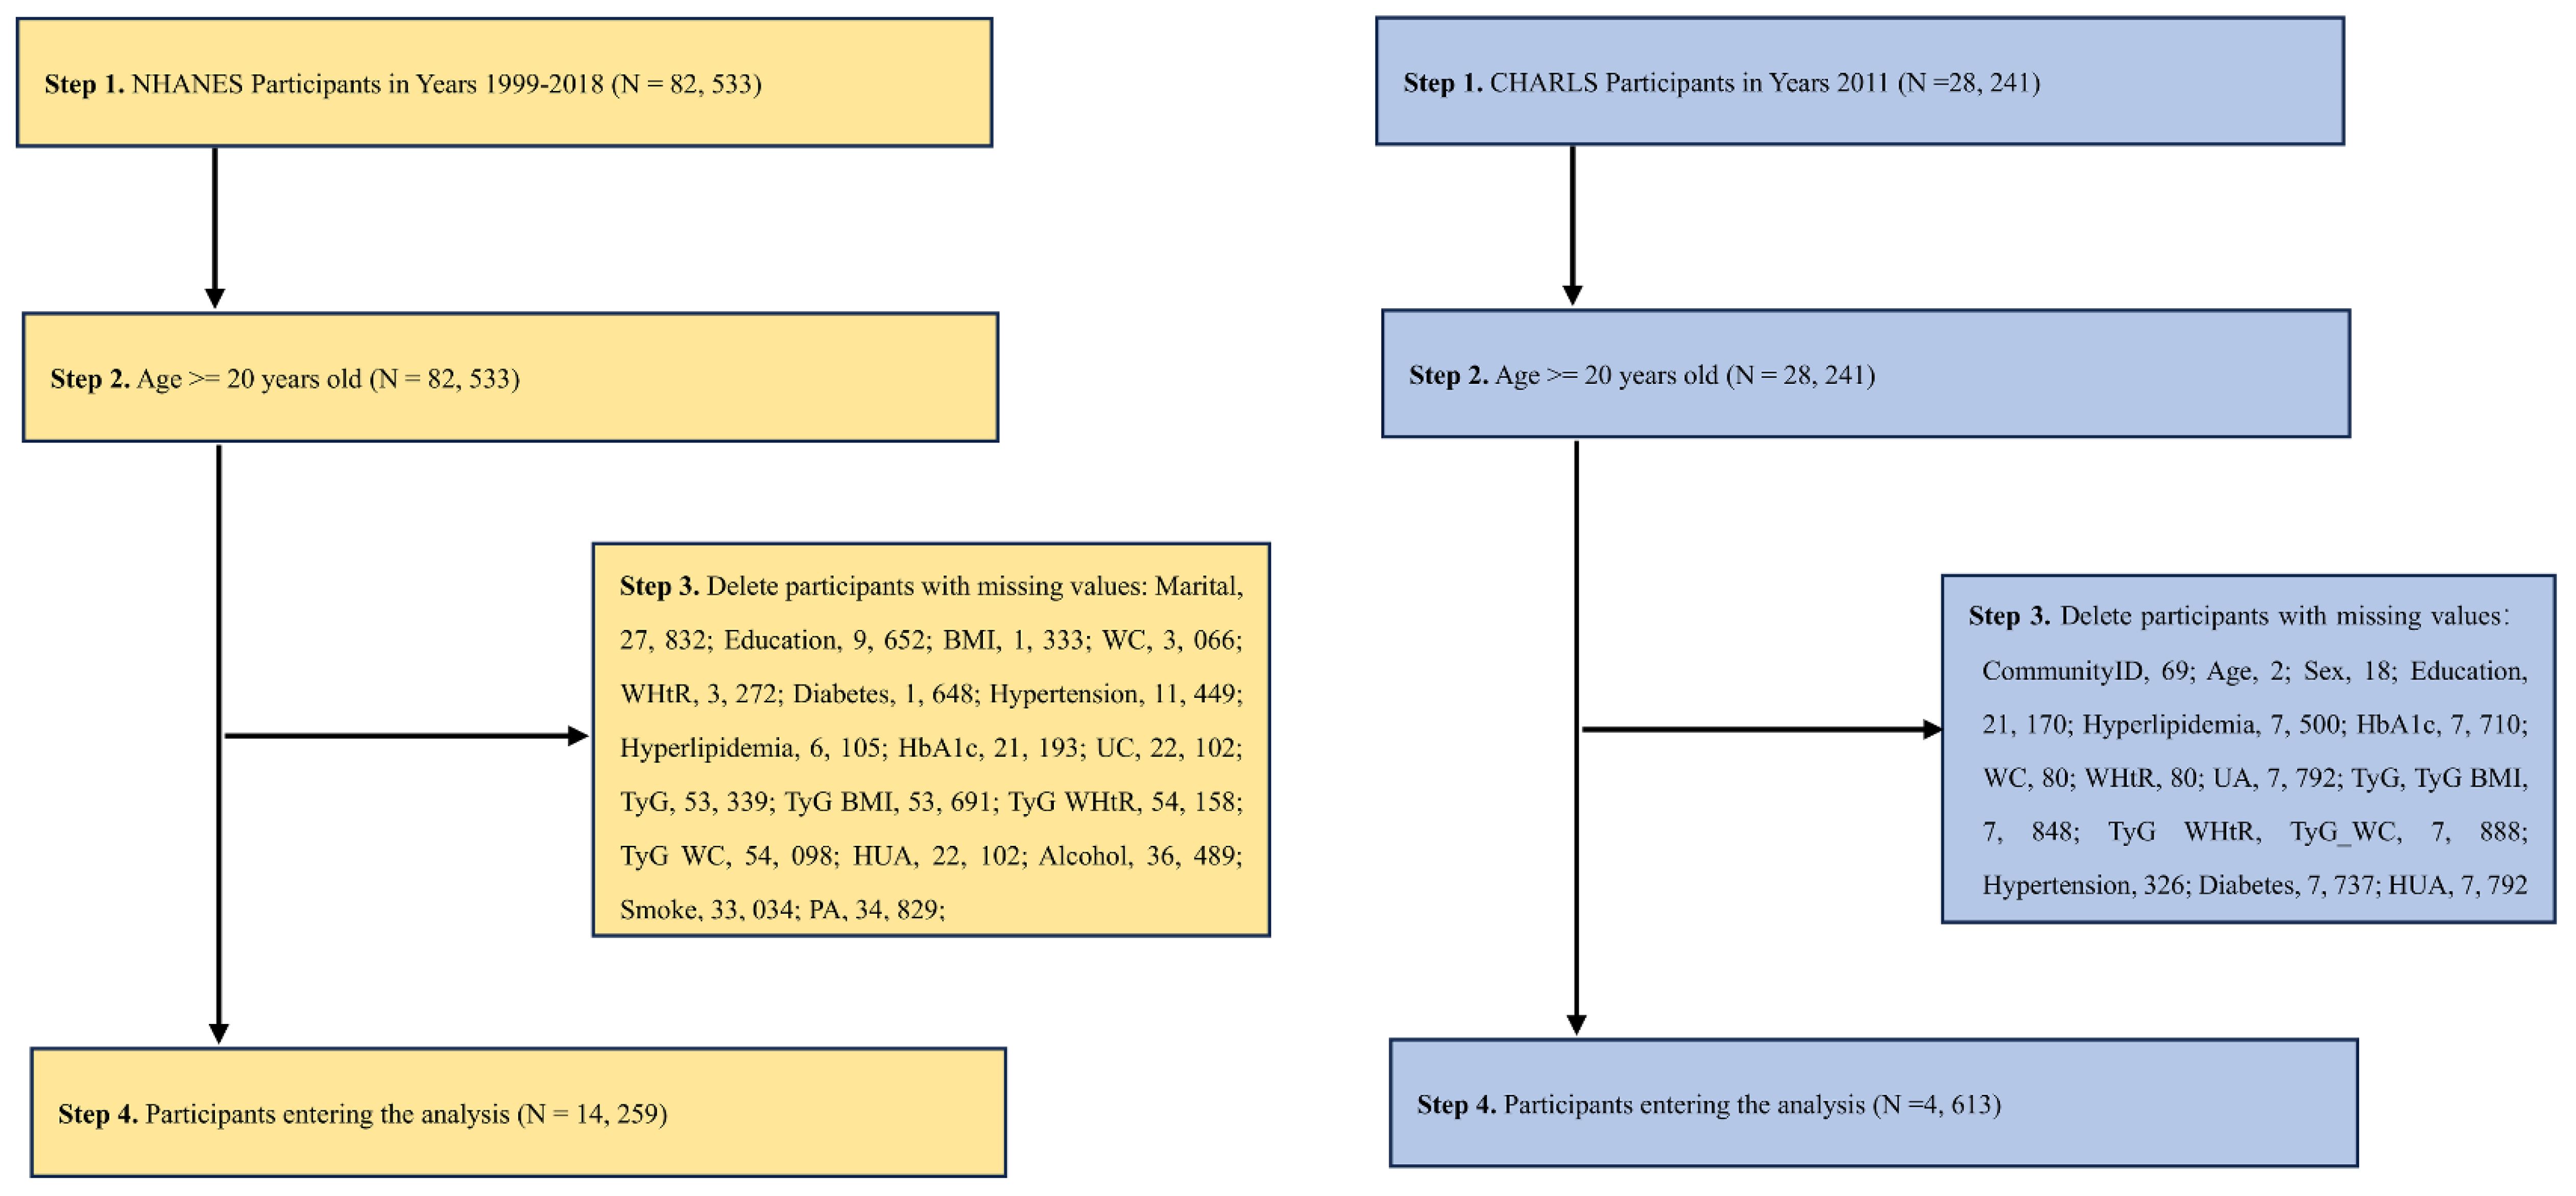
Figure 1 A flow chart of the NHANES [(A) 1999-2018, Year cycle] and CHARLS [(B) 2011-2012 survey data]. The strategy of extracting the variables and then directly calculating the required indicators and then removing the missing values was used.
2.2 Definitions of TyG and TyG related indices
The indices in the study were defined as follows: WHtR is defined as WC divided by body height (31); TyG = ln [fasting triglyceride (mg/dL) × fasting glucose (mg/dL)/2] (11); TyG-BMI = TyG × BMI (12); TyG-WHtR = TyG × WHtR (9); TyG-WC = TyG × WC (12). TyG, TyG-BMI, TyG-WHtR, and TyG-WC were calculated as continuous variables.
2.3 Assessment of lifestyle factors
CHARLS participant Lifestyle Assessment: Lifestyle scores were derived from five factors: smoking, alcohol consumption, social activities, sleep duration, and BMI. Each factor was assigned a score of either 1 for yes or 0 for no. Smoking status was scored as 1 if the participant had never smoked, otherwise it was scored as 0. Similarly, drinking status was scored as 1 if the participant had not consumed alcohol in the past year, otherwise it was scored as 0. Participation in social activities was scored as 1 if the participant engaged in any social activities in the last month, otherwise it was scored as 0. Participants provided yes (1) or no (0) responses for each factor. A sleep duration score of 1 was given if the participant slept more than 6 hours on a typical night, otherwise it was scored as 0. Height and weight measurements were taken using standardized methods, and BMI was calculated as kg/m2. For participants not classified as underweight (BMI ≥18.5 kg/m2), the BMI score was set to 1, otherwise it was set to 0. The composite lifestyle score, ranging from 0 to 5, was calculated by combining the scores of these five factors. We then applied weights to the composite lifestyle scores (32).
NHANES participant Lifestyle Assessment: Because multiple lifestyle factors are interrelated and associated with HUA, we developed a Healthy Lifestyle Score based on a previous NHANES study. This score took into account smoking status, alcohol consumption, physical activity levels, and diet quality. Non-smoking was considered indicative of a healthy lifestyle. Healthy alcohol consumption was defined as one drink or less per day for women and two drinks or less per day for men, in line with the U.S. Dietary Guidelines. Physical activity was measured in metabolic equivalent hours per week, with the top third of participants classified as having a healthy level of physical activity. Dietary quality was evaluated using Healthy Eating Index (HEI) scores. The HEI-2015 is based on the 1999-2014 survey cycle and is consistent with the 2015-2020 Dietary Guidelines for Americans. Healthy eating was defined as a HEI in the top two quintiles of the distribution. For each lifestyle factor, a score of 1 was assigned to healthy levels and 0 to unhealthy levels. Thus, the Healthy Lifestyle Score is a sum of scores ranging from 0 to 5, with higher scores indicating healthier lifestyles. Although this simple cumulative approach has been widely used, with the underlying assumption that the associations between different lifestyle factors and outcomes are the same, this may not be correct. We therefore constructed a weighted lifestyle score in which each lifestyle factor is weighted according to its association with the outcome (33).
2.4 Assessment of HUA and other covariates
According to a previous study, HUA was defined as SUA ≥ 7.0 mg/dL in men and ≥6.0 mg/dL in women (34, 35). Serum uric acid values (continuous variables) were transformed into dichotomous variables (HUA/Non - HUA). Demographic information was collected by questionnaire, including age, sex, marital status (Married, Separated, Never married), Education (Primary school, High school or above), Healthy lifestyle score(It has been described in detail). The diagnosis of diabetes consists of the following components, any of which can be met to be diagnosed with diabetes: (1) the individual has been diagnosed with diabetes by a doctor; (2) glycosylated hemoglobin (HbA1c) (%) > 6.5; (3) fasting blood glucose (DM, mmol/l) ≥ 7.0; (4) random blood glucose (mmol/L) ≥ 11.1 and (5) use of diabetes medication or insulin. Hyperlipidemia was diagnosed by meeting any of the following criteria: hypertriglyceridemia (TG ≥ 150 mg/dL) and/or hypercholesterolemia (TC 240 mg/dL, LDL 160 mg/dL, HDL <40 mg/dL. Definition of hypertension: 1) taking hypertensive medication; 2) being informed by a licensed physician of hypertension or stated in the questionnaire to take prescribed medication for hypertension; 3) measuring the participant’s systolic blood pressure (SBP) mean ≥ 140 mmHg and/or diastolic blood pressure (DBP) ≥ 90 mmHg (mean of three times). Any one of the above three conditions can be diagnosed as hypertension. Since ethnicity information was not published in the CHARLS (2011, years) survey, the ethnicity variable was not adjusted in NHANES for consistency.
2.5 Statistical analysis
All remaining statistical analyses were performed using R software (4.2.2, https://cran.r-project.org/bin/windows/base/old/4.2.2/), with statistical tests being two-sided and considered statistically significant when the P-value < 0.05. To obtain statistics representative of U.S. adults, we utilized oversampling, stratification, and clustering techniques in the NHANES and CHARLS analyses. Weight-adjusted statistical tests were thoroughly taken into account. Demographic characteristics of participants’ HUA status were assessed using the chi-square test and t-test. Continuous variables indicators TyG, TyG-BMI, TyG-WHtR, and TyG-WC were grouped into quartiles. The continuous variables were divided into four groups and transformed into categorical variables. Multivariable logistic regression models were used to estimate the P - value, odds ratio (OR), and 95% confidence interval (CI) between TyG, TyG-BMI, TyG-WHtR, and TyG-WC and the risk of HUA, separately. Additionally, a gender-stratified analysis was conducted using multifactor logistic regression. (Model 1, No adjustment for any potential influence factors; Model 2, Adjusted for Sex, Age; Model 3, Adjusted for Sex, Age, Marital, Education levels and Healthy Lifestyle Score). Restricted Cubic Spline (RCS) plots were used to show trends in the partially significant variables of the multivariate logistic regression, separately. The exposure factors (TyG, TyG-BMI, TyG-WHtR, and TyG-WC) were entered into the RCS model as continuous variables. The RCS was used to test for nonlinear associations between exposure factors (TyG, TyG-BMI, TyG-WHtR, TyG-WC) and HUA, separately. (Adjusted for Sex, Age, Marital, Education levels and Healthy Lifestyle Score). Additionally, we excluded those with hypertension, dyslipidemia, and diabetes, and conducted sensitivity analyses using multivariate logistic regression models to assess the stability of the results, separately (adjusted covariates were consistent with the main analysis).
3 Results
3.1 Baseline characteristics
Table 1-1 reports the sociodemographic characteristics of NHANES, a study with a total of 14,259 NHANES participants (Males, 52.67%; Females, 47.33%) We found that the mean age of the participants involved in the study was 45.92 years and the mean age of the participants with HUA was 48.44 years (Male, 63.10%; Female, 36.90%). In patients with HUA, TyG, TyG-BMI, TyG-WHtR and TyG-WC were higher than in Non-HUA participants (P-value < 0.001). Sex, Education, Marital, Diabetes, Hypertension, Hyperlipidemia, Healthy Lifestyle Score, WC, HbA1c, UA, WHtR and BMI were lower in participants with HUA compared to Non-HUA participants, which were significantly different (P-value < 0.05). Significantly, participants with HUA had lower Healthy Lifestyle Scores (P-value < 0.001). The sociodemographic characteristics of CHARLS are reported in Table 1-2. The total number of CHARLS participants in this study was 4,613 (males, 30.09%; females, 69.91%) We found that the mean age of the participants who participated in the study was 68.52 years, and the mean age of the participants with HUA was 71.65 years (Male, 73.27%; Female, 26.73%). In patients with HUA, TyG, TyG-BMI, TyG-WHtR, TyG-WC, UA and BMI were higher than in Non-HUA participants (P-value < 0.05). Education, Marital, Diabetes, Hyperlipidemia were healthy levels lower in participants with HUA compared to Non-HUA participants, with statistically significant differences (P-value < 0.05).
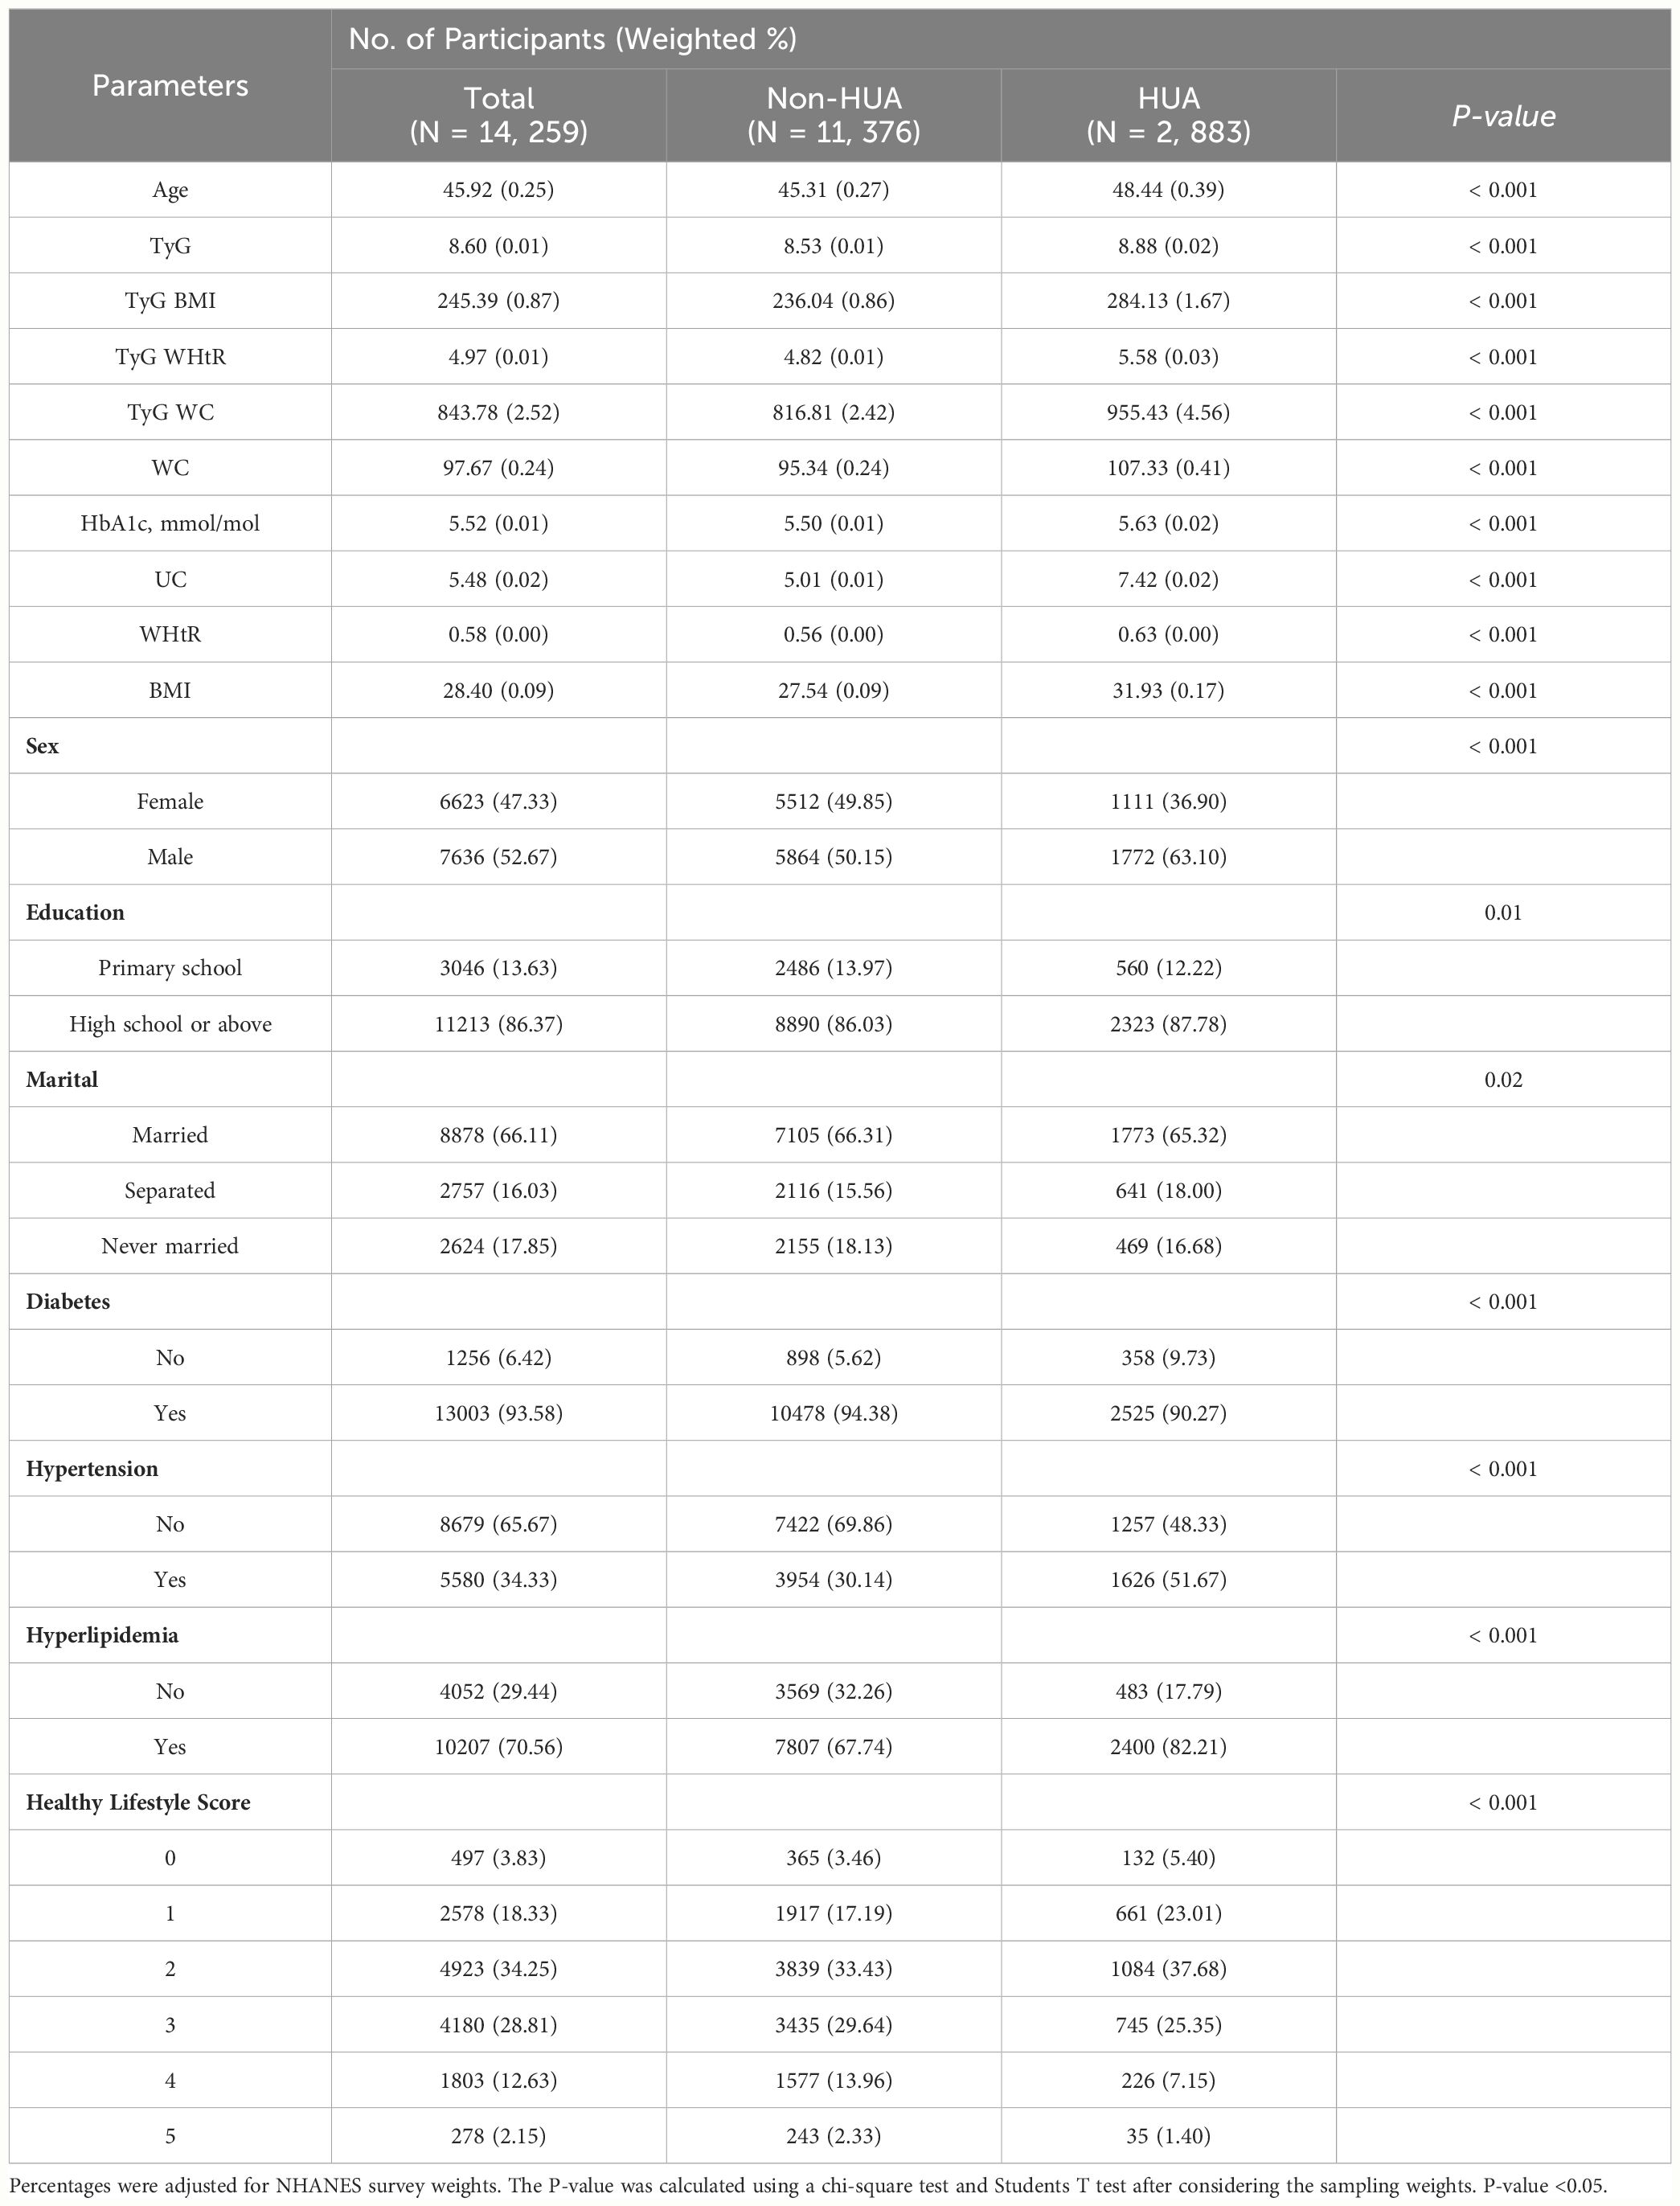
Table 1-1 Socio-demographic characteristics of US adults with HUA by NHANES survey cycle, 1999-2018.
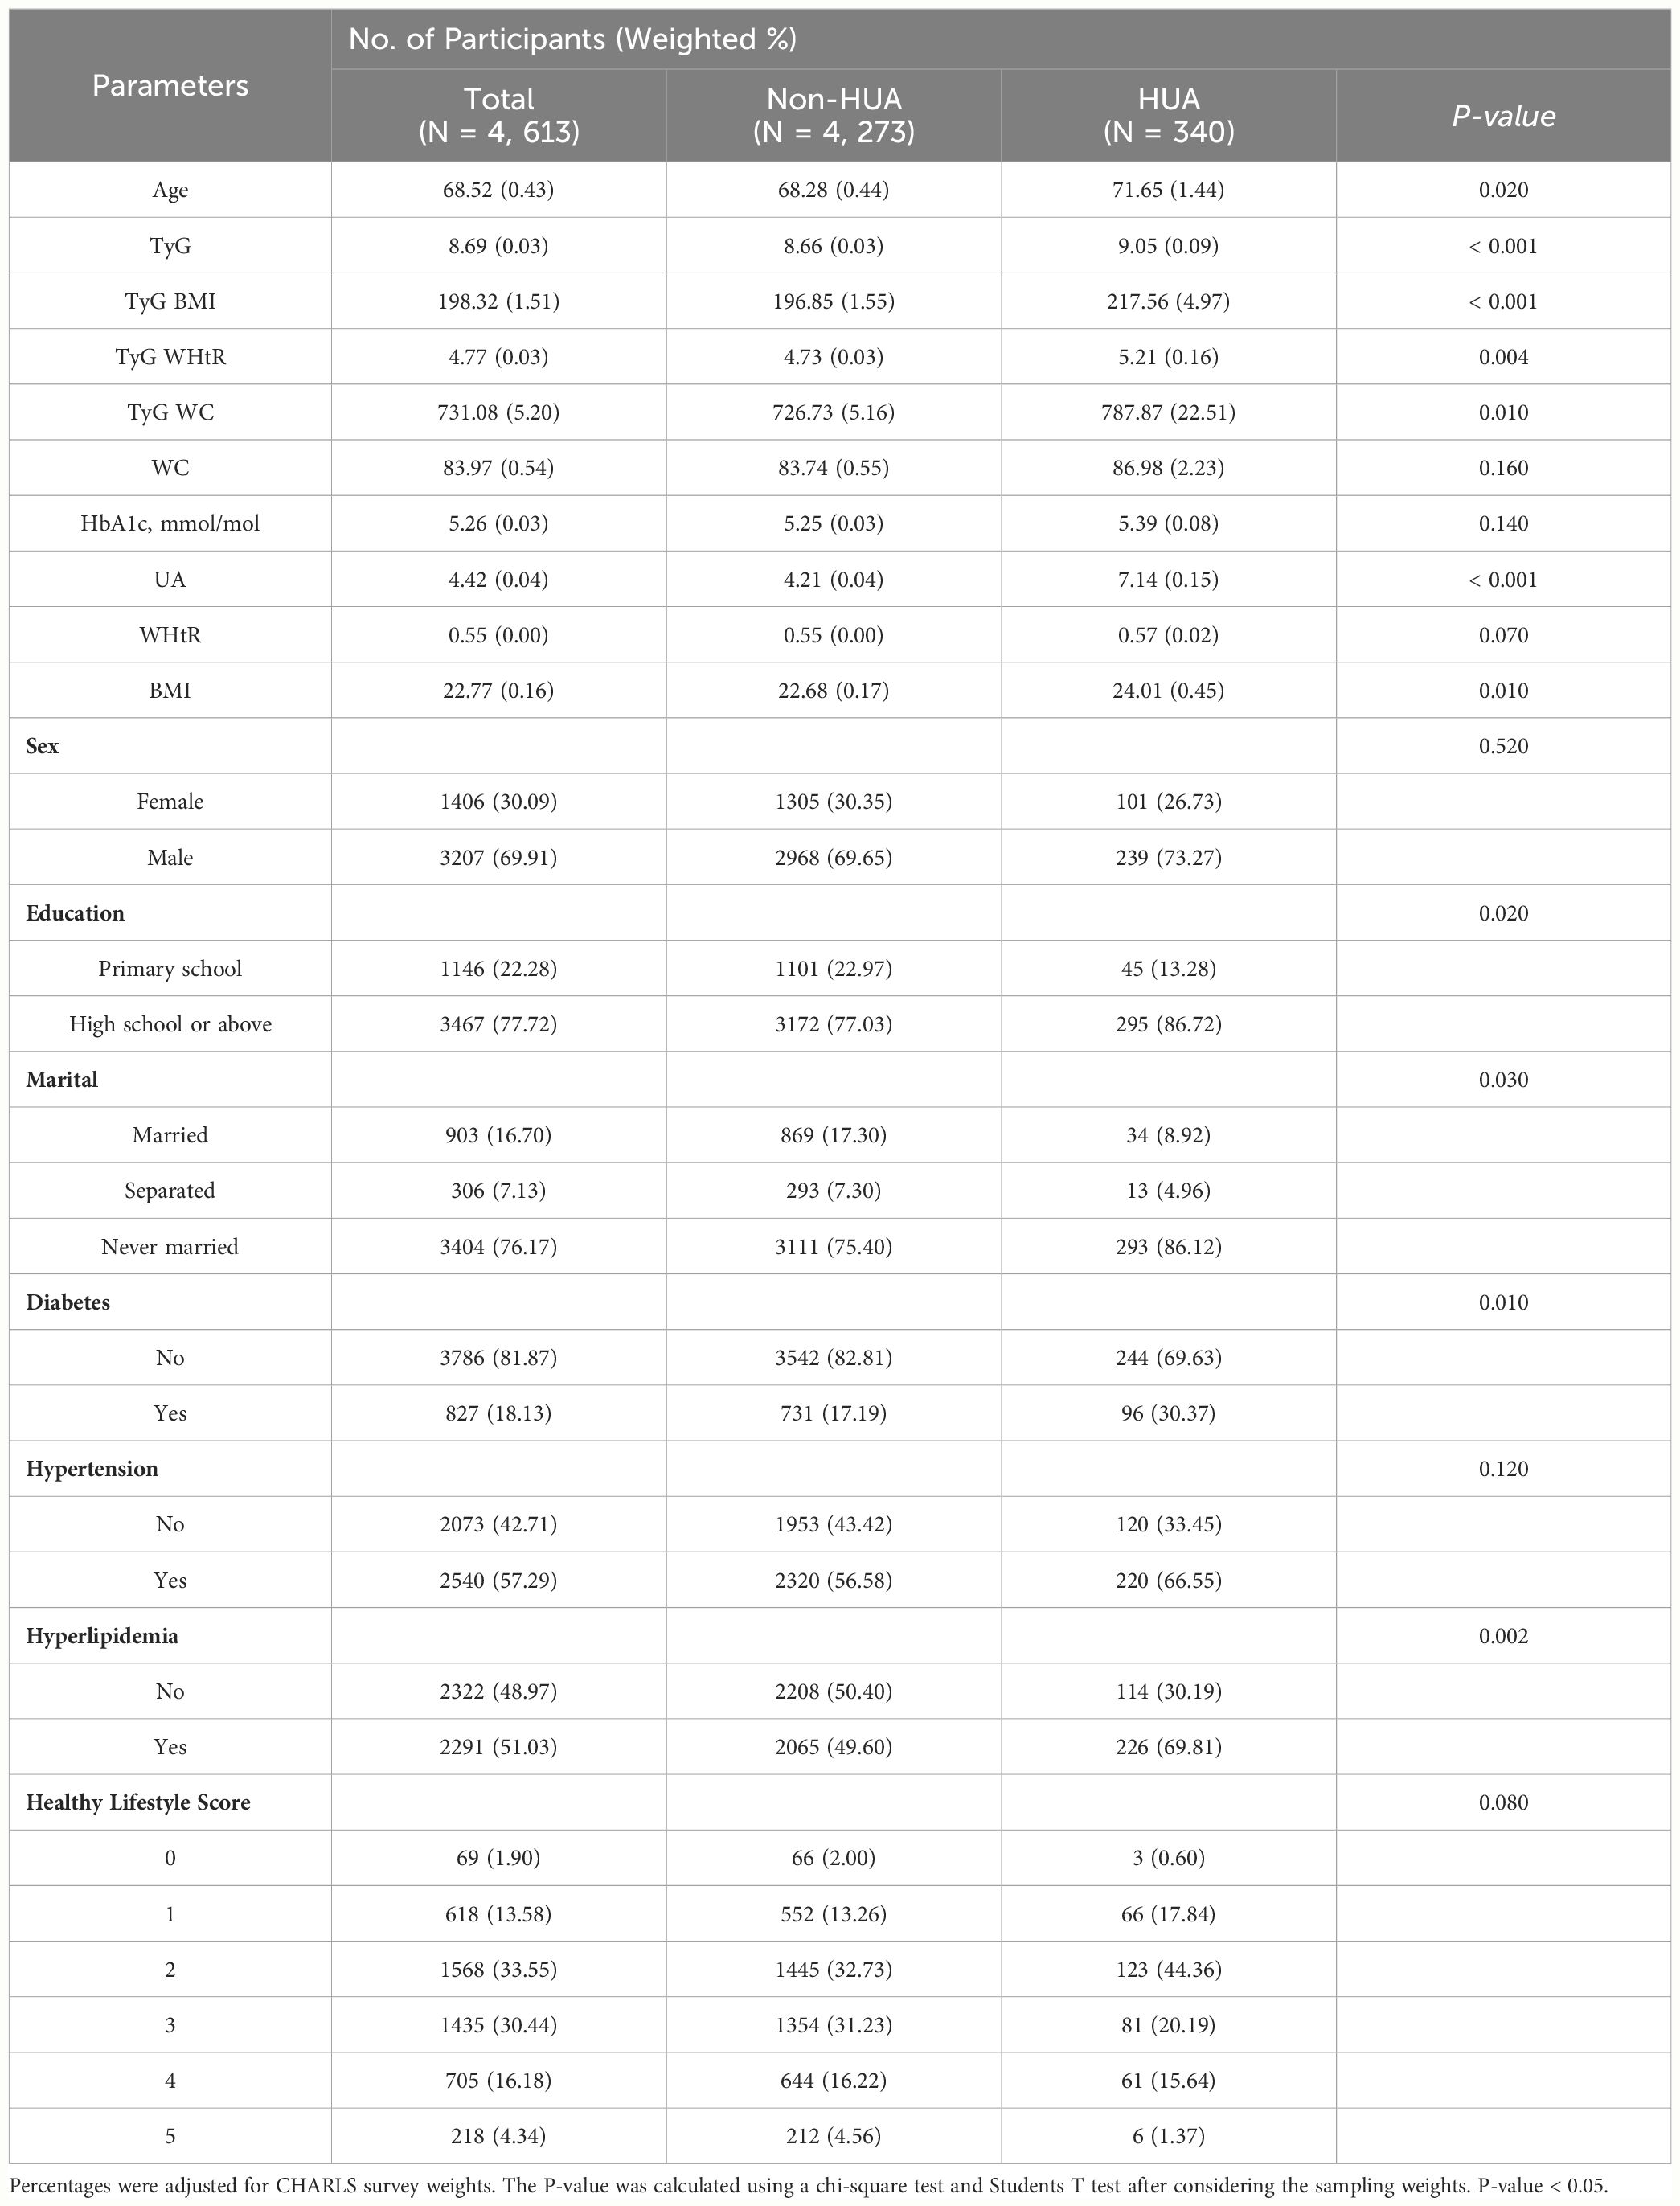
Table 1-2 Socio-demographic characteristics of China adults with HUA by CHARLS survey cycle, 2011-2012.
3.2 Multivariate logistic regression analysis of TyG, TyG-BMI, TyG-WHtR, TyG-WC with HUA
Among NHANES participants, we found statistically significant associations between different levels of TyG, TyG-BMI, TyG-WHtR and TyG-WC and HUA (P-value < 0.001). In Model 1, TyG [Q2, 1.88 (1.50, 2.34); Q3, 3.17 (2.63, 3.82); Q4, 4.92 (4.07, 5.95)], TyG-BMI [Q2, 2.66 (2.17, 3.24); Q3, 4.49 (3.69, 5.47). Q4, 9.06 (7.63, 10.75)], TyG-WHtR [Q2, 2.23 (1.82, 2.73); Q3, 3.96 (3.28, 4.78); Q4, 7.96 (6.65, 9.53)], TyG-WC [Q2, 2.66 (2.14, 3.29); Q3. 4.45 (3.67, 5.41); Q4, 9.98 (8.29, 12.03)] may be risk factors for HUA and may increase the risk of developing HUA. In Model 2, TyG [Q2, 1.77 (1.42, 2.22); Q3, 2.88 (2.38, 3.48); Q4, 4.31 (3.54, 5.25)], TyG-BMI [Q2, 2.34 (1.91, 2.86); Q3, 3.91 (3.21, 4.76)); Q4, 8.35 (7.04, 9.91)], TyG-WHtR (Q2, 2.12 (1.74, 2.57); Q3, 3.69 (3.07, 4.44); Q4, 7.96 (6.63, 9.54)), TyG-WC [Q2, 2.50 (2.03, 3.08); Q3, 4.06 (3.35, 4.92); Q4, 9.07 (7.53, 10.93)] may be risk factors for HUA and may increase the risk of developing HUA. In Model 3, TyG [Q2, 1.58 (1.26, 1.98); Q3, 2.36 (1.94, 2.88); Q4, 3.21 (2.61, 3.94)], TyG-BMI [Q2, 2.14 (1.74, 2.65) 3.38 (2.74, 4.17)); Q4, 6.67 (5.55, 8.02)], TyG-WHtR [Q2, 1.92 (1.56, 2.36); Q3, 3.14 (2.56, 3.85); Q4, 6.28 (5.12, 7.69)], TyG-WC [Q2, 2.32 (1.85, 2.90); Q3, 3.51 (2.84, 4.34); Q4, 7.32 (5.95, 9.02)] may be risk factors for HUA and may increase the risk of developing HUA. As shown in Table 2-1.
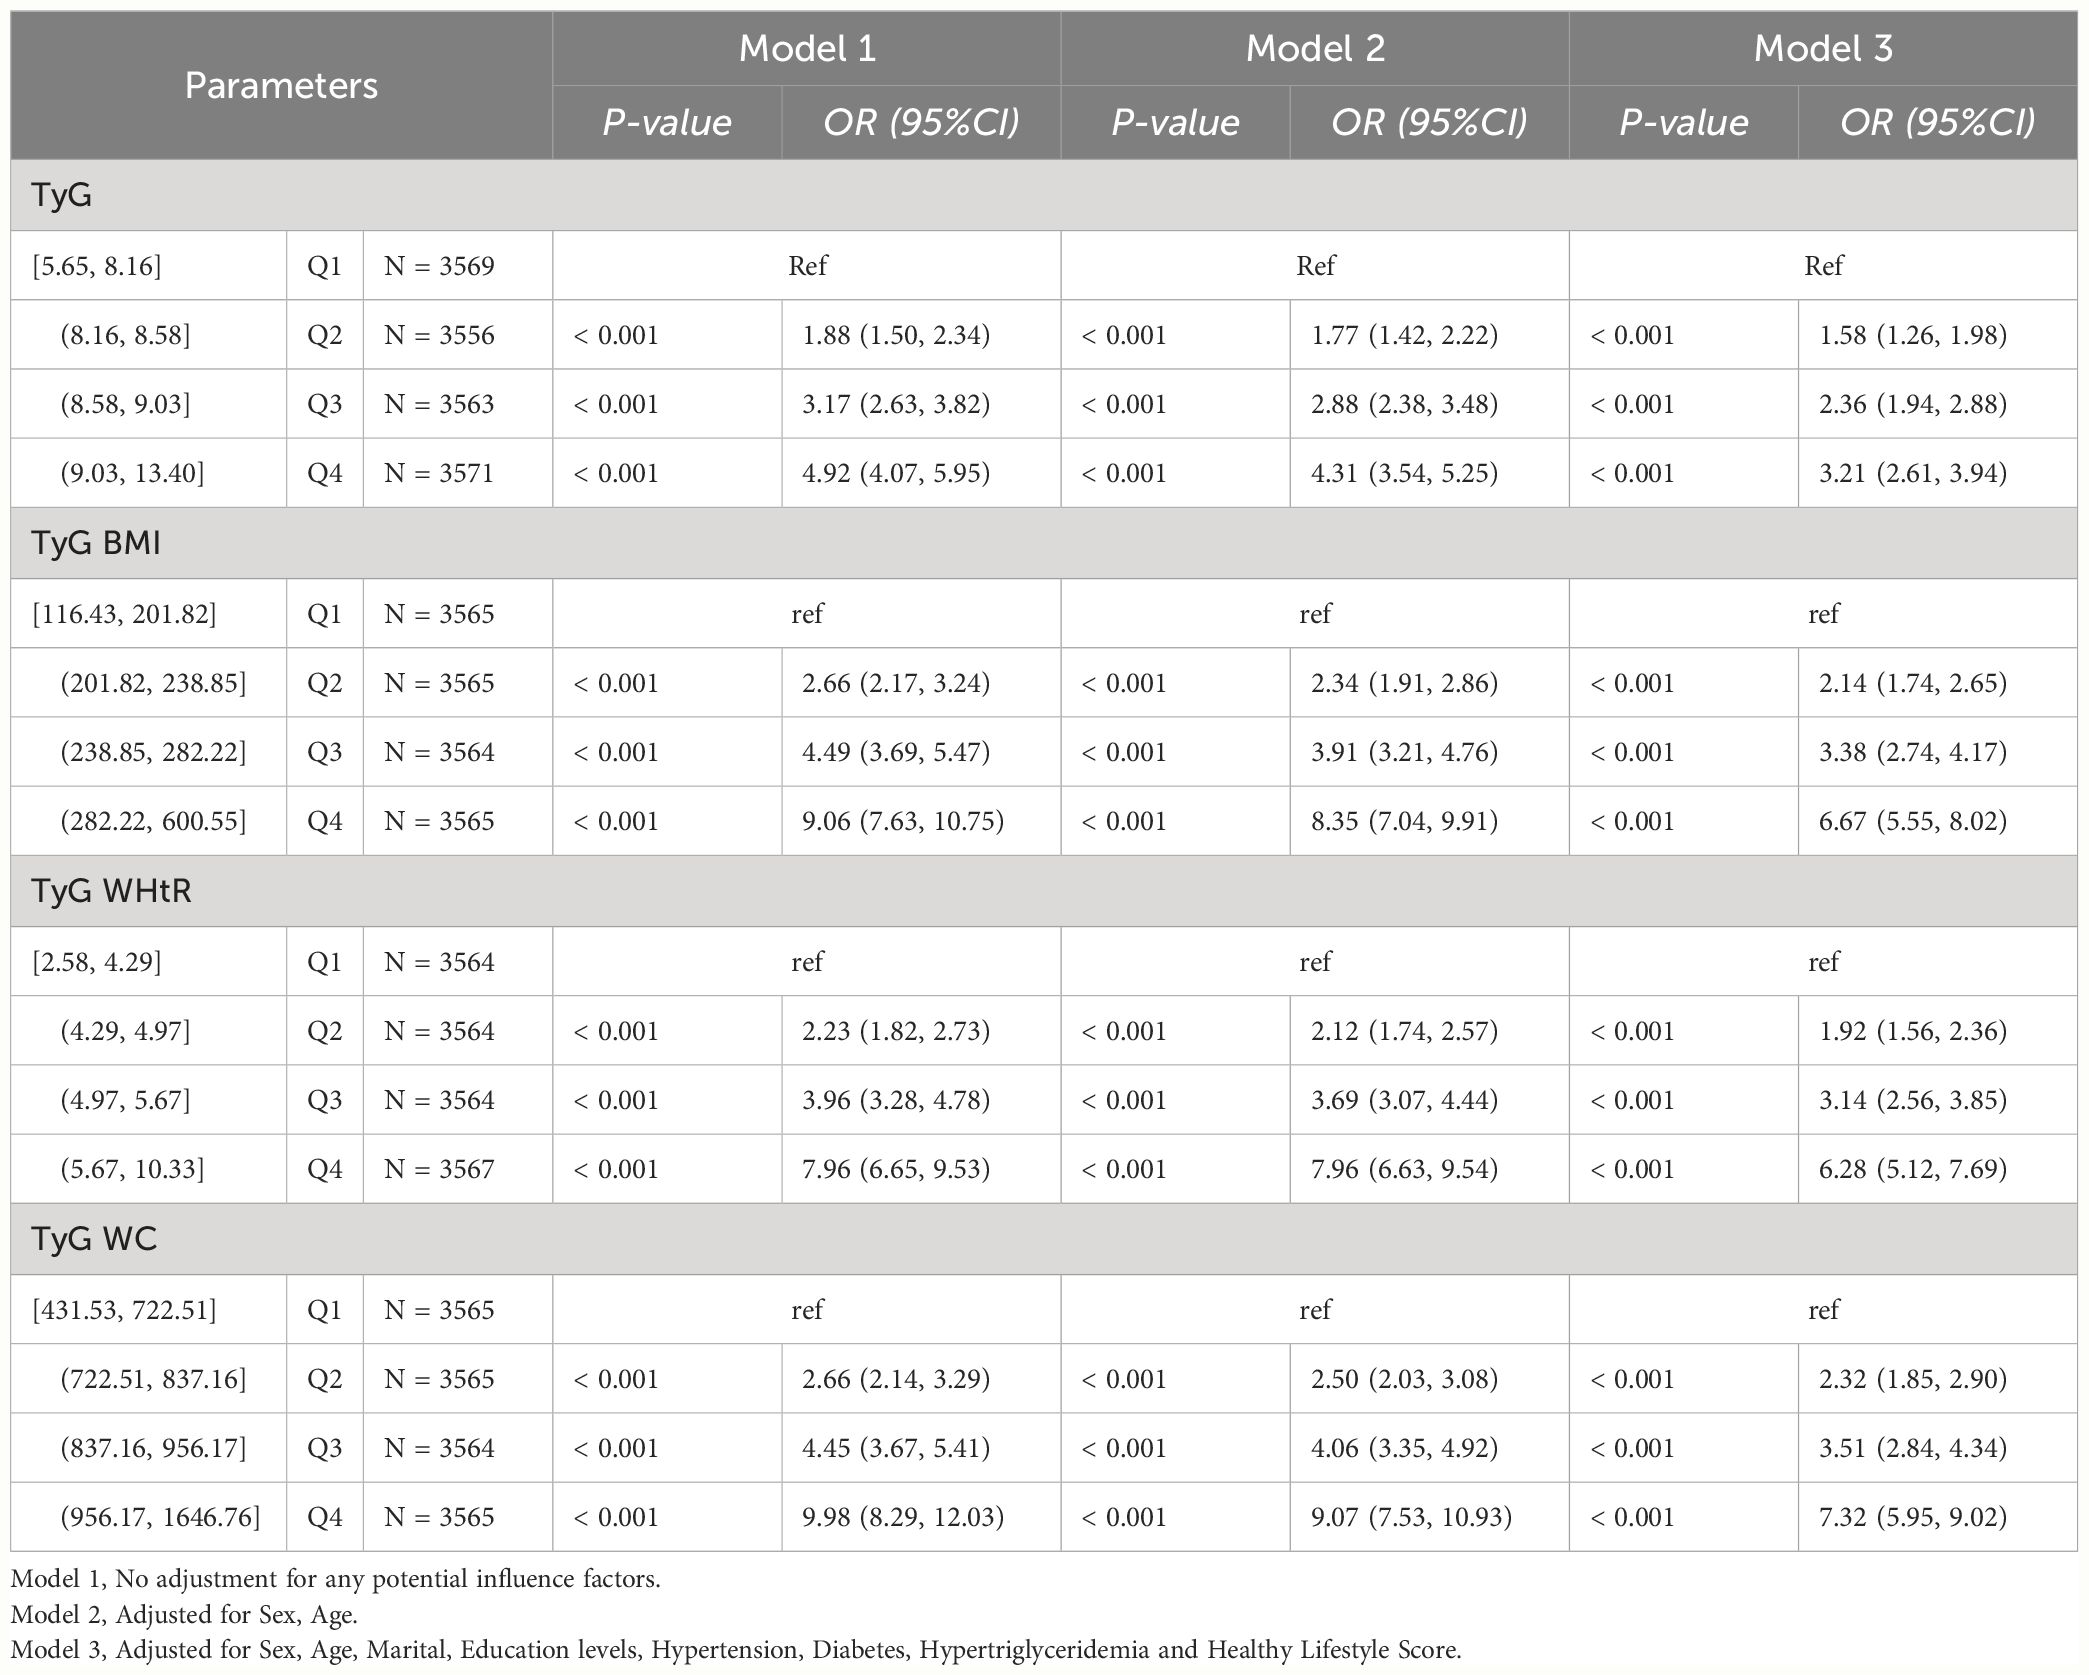
Table 2-1 Multivariate logistic regression results of the relationship between TyG, TyG BMI, TyG WHtR and TyG WC with HUA in NHANES, separately.
Among CHARLS participants, we found higher levels of TyG, TyG-BMI, TyG-WHtR and TyG-WC to be statistically significantly associated with HUA (P-value < 0.05). In Model1, TyG [Q4, 3.74 (1.84, 7.60)], TyG-BMI [Q3, 2.62 (1.12, 6.15); Q4, 4.05 (1.93, 8.49)], TyG-WHtR [Q3, 2.30 (1.04, 5.07); Q4, 3.83 (1.75, 8.37)], TyG-WC [Q3, 2.54 (1.11, 5.83); Q4, 4.19 (1.92, 9.15)] may be risk factors for HUA and may increase the risk of developing HUA. In Model2, TyG [Q4, 3.69 (1.84, 7.39)], TyG-BMI [Q3, 2.80 (1.20, 6.57); Q4, 4.68 (2.26, 9.69)], TyG-WHtR [Q3, 2.44 (1.13, 5.28); Q4, 4.05 (1.93, 8.52)], TyG-WC [Q3, 2.51 (1.11, 5.71); Q4, 3.92 (1.85, 8.27)] may be risk factors for HUA and may increase the risk of developing HUA. In Model3, TyG [Q4, 2.36 (1.08, 5.15)], TyG-BMI [Q3, 2.60 (1.05, 6.41); Q4, 3.70 (1.64, 8.32)], TyG-WHtR [Q4, 2.84 (1.23, 6.55)], TyG-WC [Q4, 2.85 (1.23, 6.59)] may be risk factors for HUA and may increase the risk of developing HUA. As shown in Table 2-2.
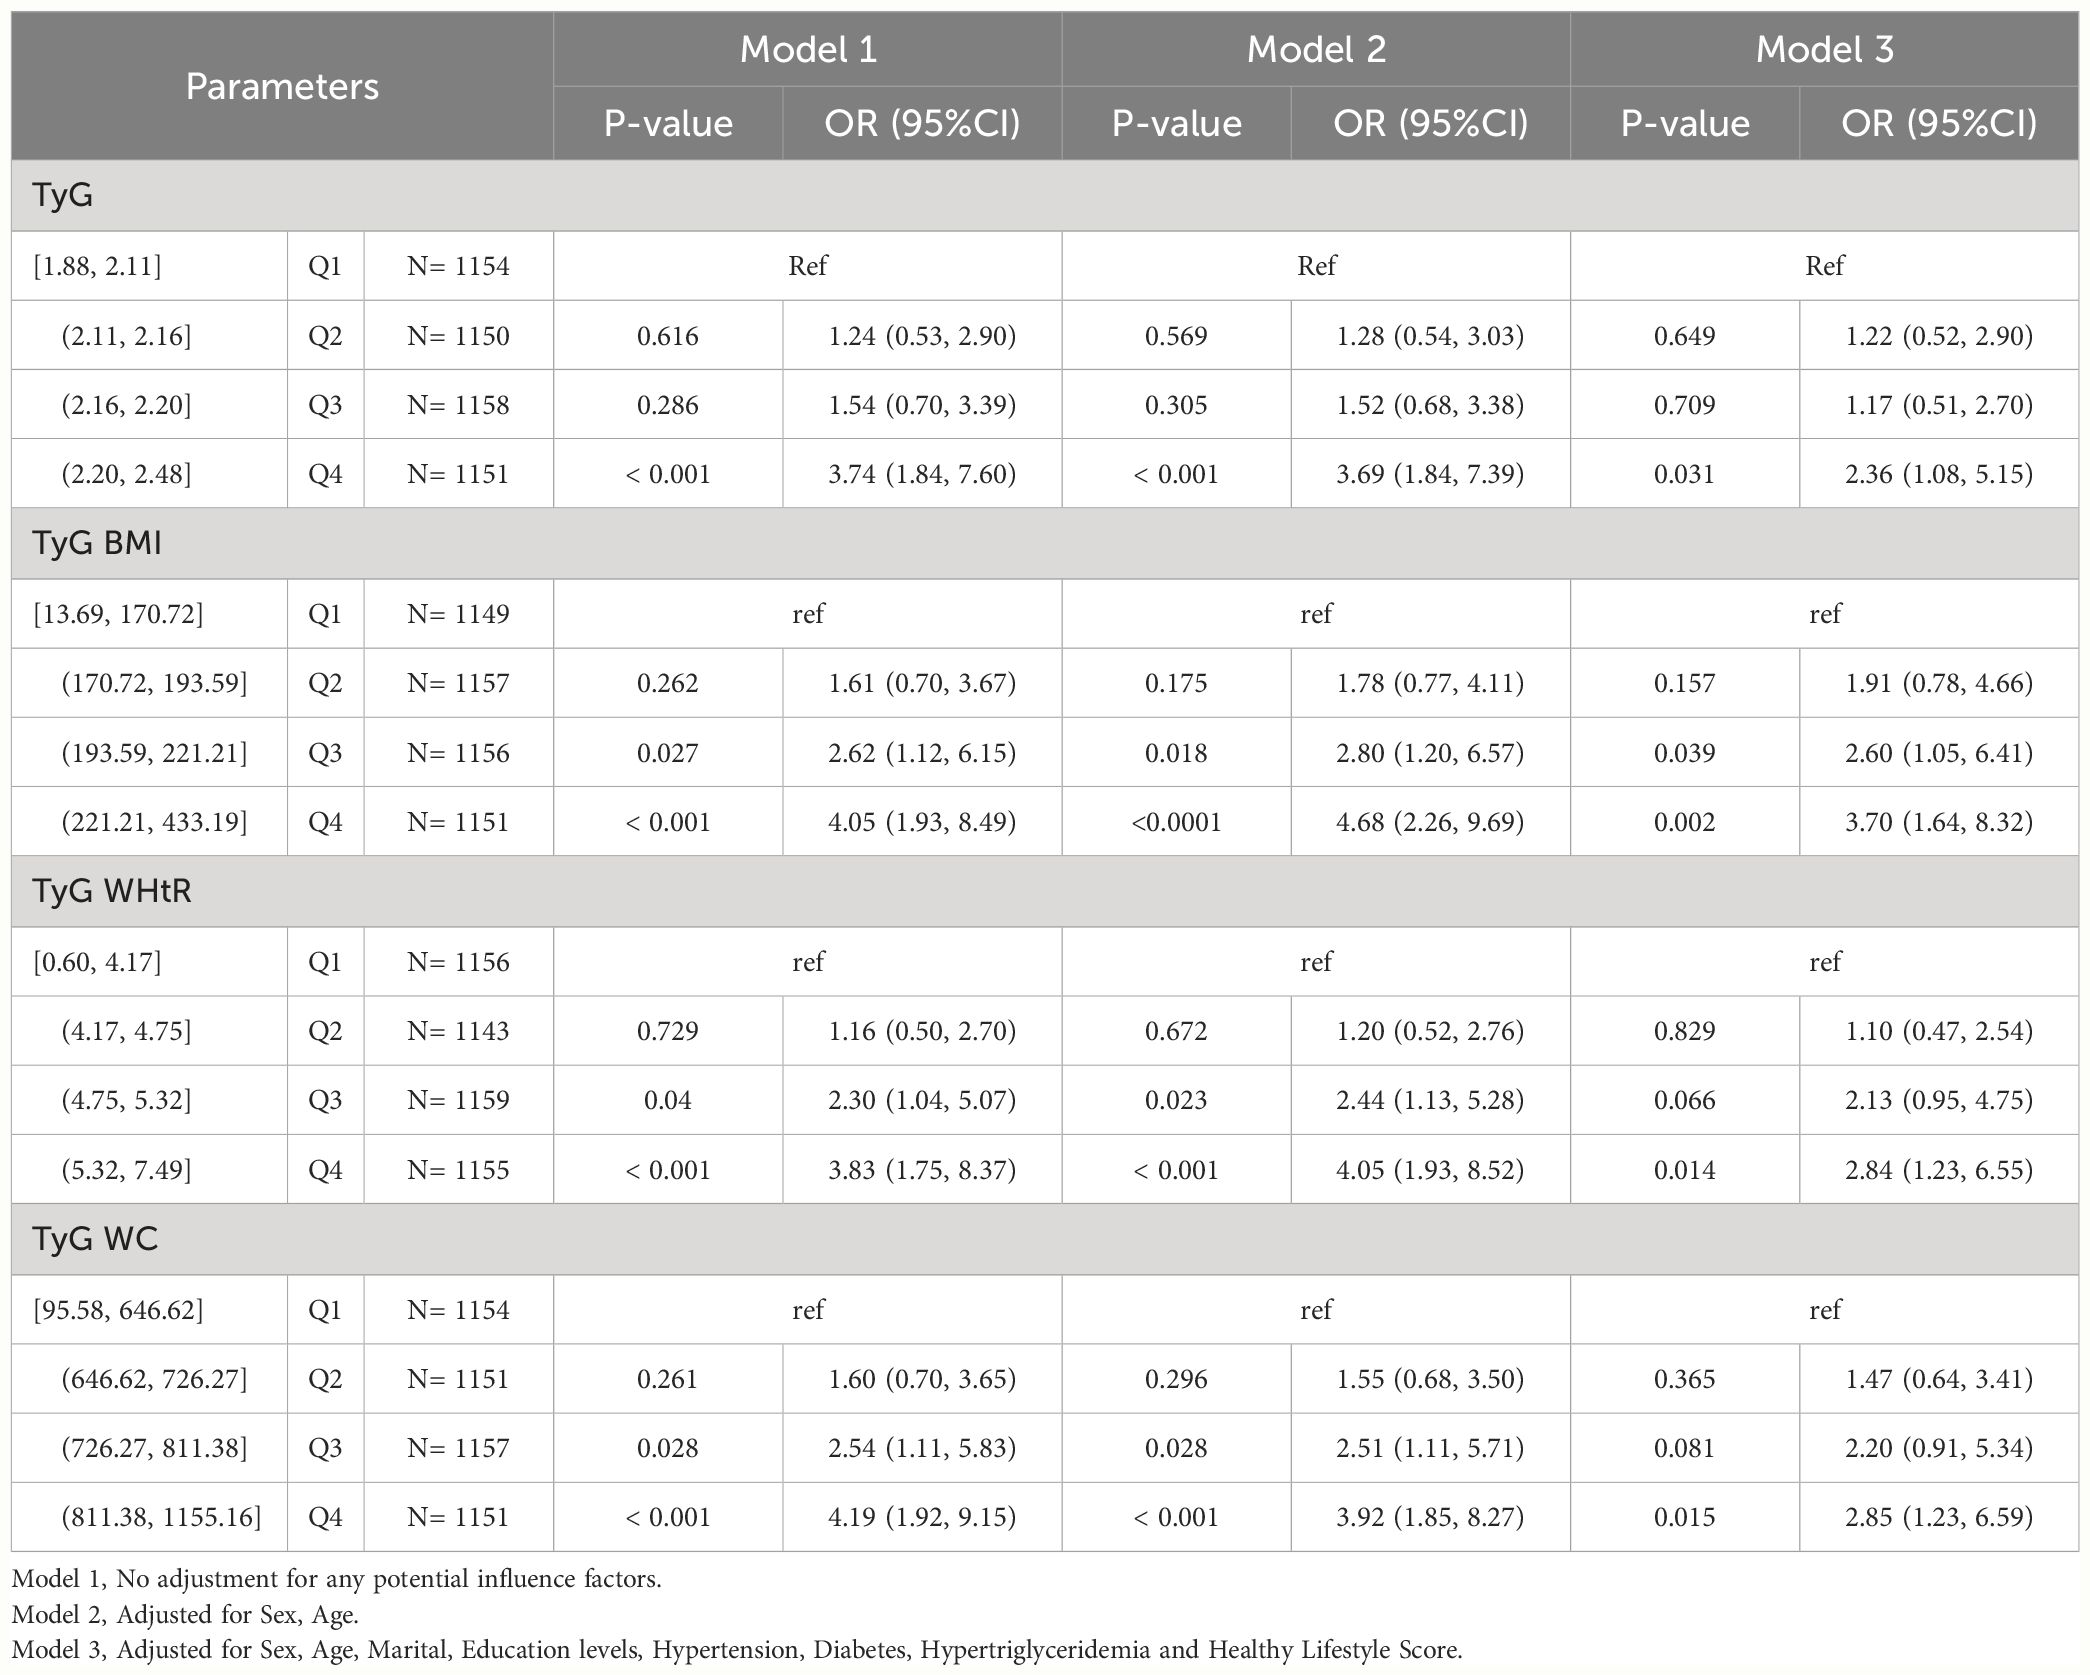
Table 2-2 Multivariate logistic regression results of the relationship between TyG, TyG BMI, TyG WHtR and TyG WC with HUA in CHARLS, separately.
3.3 Sex stratified analysis
Among NHANES participants of different sex, we found statistically significant associations between higher levels of TyG, TyG-BMI, TyG-WHtR, and TyG-WC and HUA (p value < 0.05). TyG [Male (Q2, 1.58 (1.20, 2.08); Q3, 2.26 (1.74, 2.92); Q4, 2.72 (2.06, 3.57)), Female (Q2, 1.44 (1.06, 1.94);Q3, 2.17 (1.65, 2.85);Q4, 3.65 (2.74, 4.85))], TyG BMI [Male (Q2, 2.02 (1.52, 2.69); Q3, 3.26 (2.45, 4.35); Q4, 5.83 (4.52, 7.53)), Female (Q2, 2.25 (1.60, 3.18); Q3, 3.21 (2.30, 4.49); Q4, 8.09 (6.01, 10.88))], TyG WHtR [Male (Q2, 1.72 (1.35, 2.20); Q3, 2.90 (2.23, 3.78); Q4, 4.94 (3.84, 6.36)), Female (Q2, 2.46 (1.63, 3.70); Q3, 3.78 (2.51, 5.68); Q4, 9.82 (6.75, 14.27))], TyG WC [Male (Q2, 2.28 (1.67, 3.12); Q3, 3.08 (2.29, 4.13); Q4, 6.50 (4.90, 8.63)), Female (Q2, 2.07 (1.52, 2.82); Q3, 3.73 (2.70, 5.13); Q4, 8.31 (6.17, 11.19))]. As shown in Table 3-1.
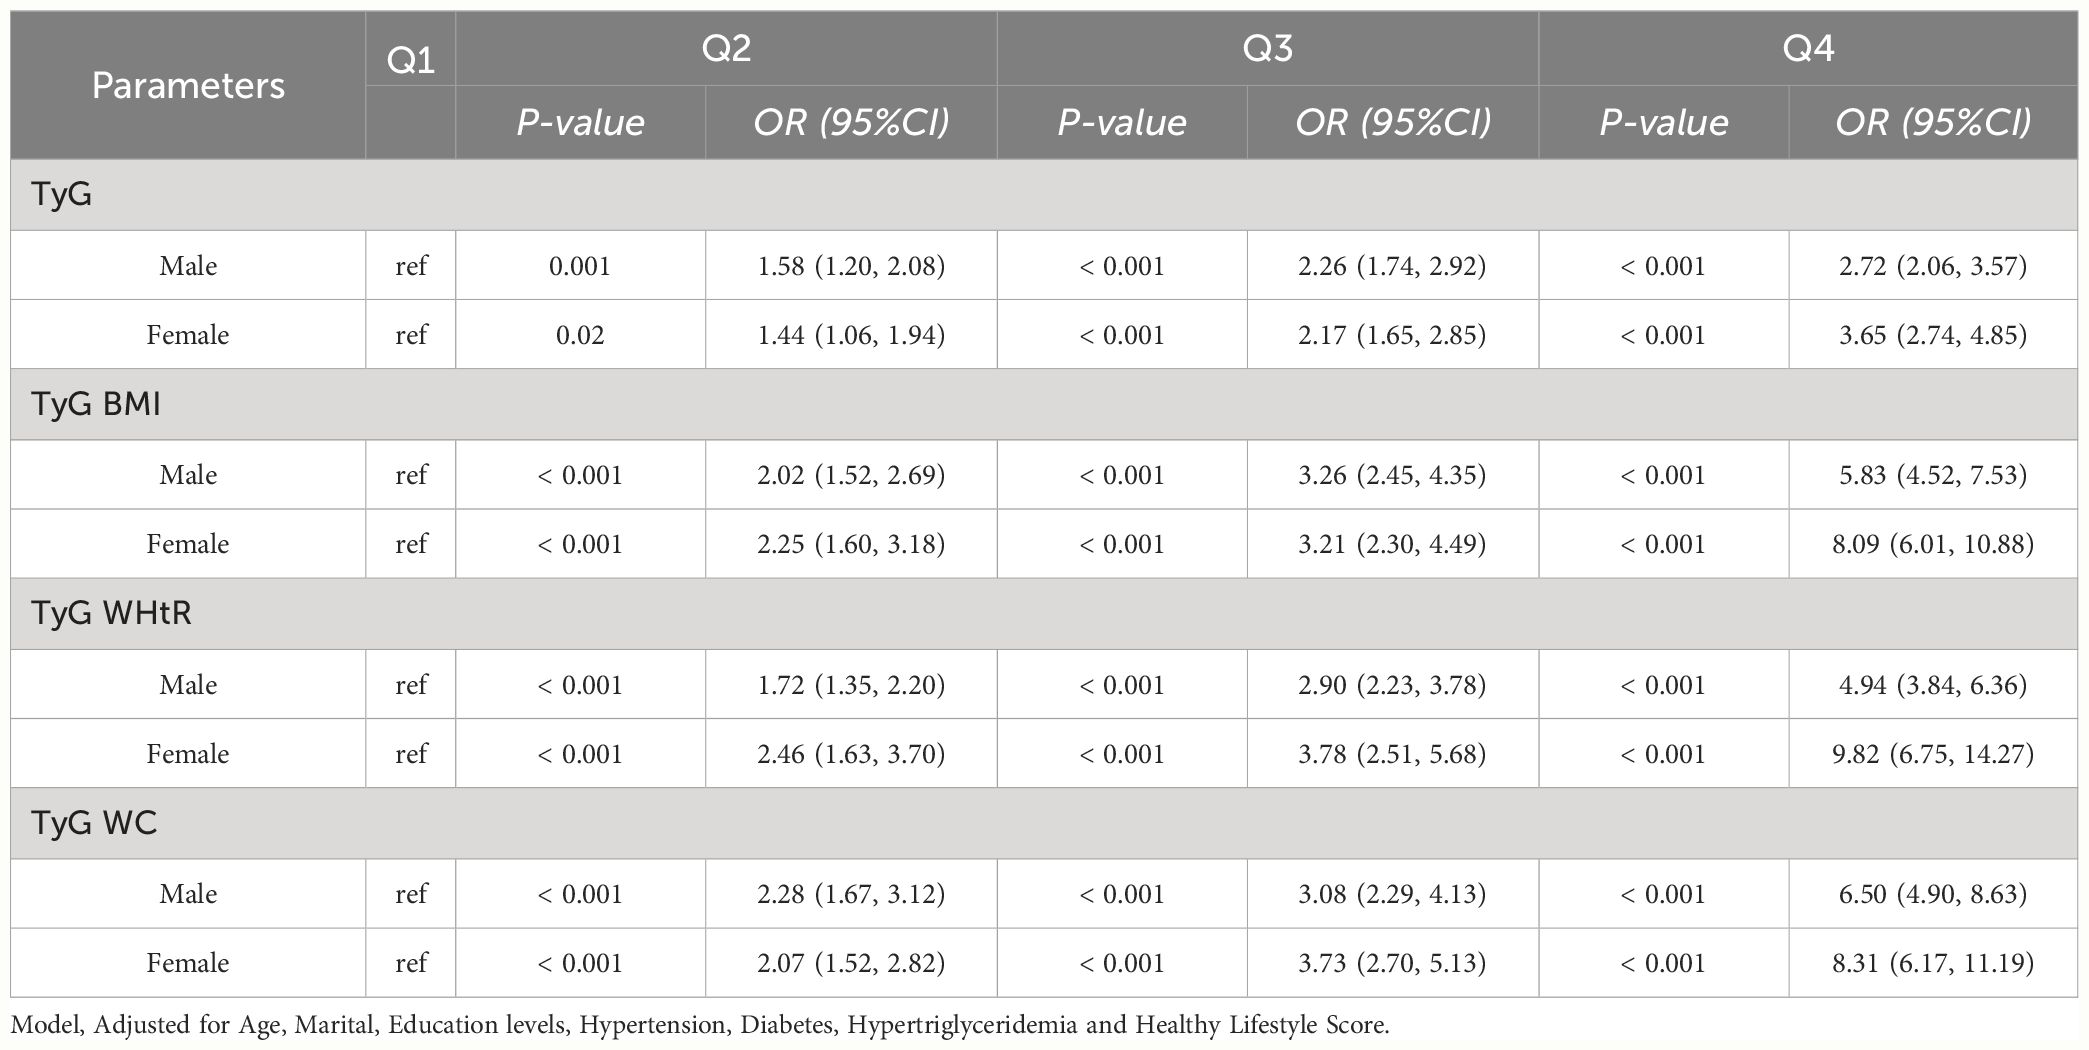
Table 3-1 Multivariate logistic regression results of the relationship between TyG, TyG BMI, TyG WHtR and TyG WC with HUA in different sex in NHANES, separately.
Among CHARLS participants of different sex, we found statistically significant associations between higher levels of TyG, TyG-BMI, TyG-WHtR, and TyG-WC and HUA (p value < 0.05). TyG [Female (Q4, 4.84 (1.77, 13.23))], TyG BMI [Female (Q2, 4.40 (1.38, 14.04); Q3, 4.88 (1.42, 16.78); Q4, 8.16 (2.79, 23.89))], TyG WHtR [Female (Q3, 3.49 (1.15, 10.64); Q4, 5.55 (1.99, 15.47))], TyG WC [Female (Q4, 5.27 (2.10, 13.22))]. As shown in Table 3-2.
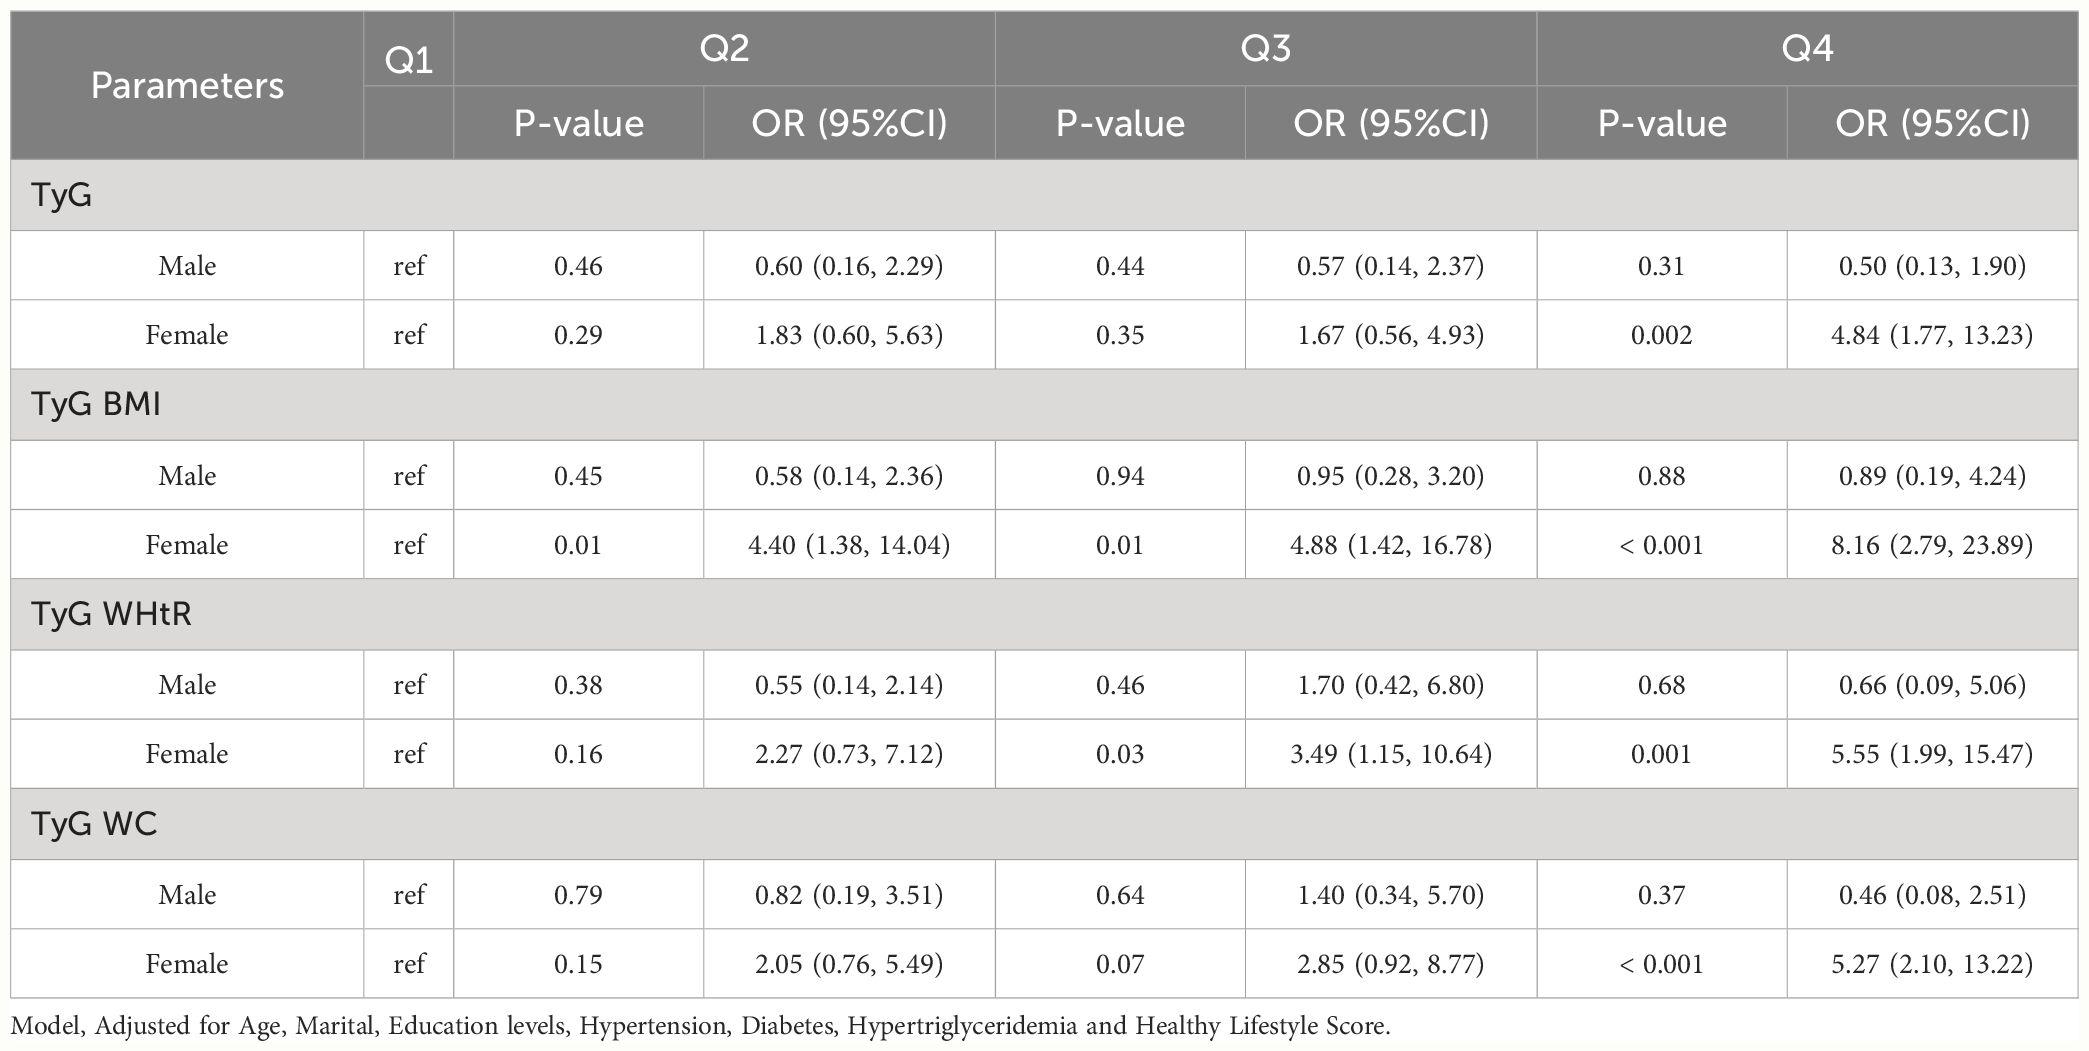
Table 3-2 Multivariate logistic regression results of the relationship between TyG, TyG BMI, TyG WHtR and TyG WC with HUA in different sex in Charls, separately.
3.4 RCS analysis
The RCS was used to determine if there was a nonlinear association between TyG, TyG-BMI, TyG-WHtR, TyG-WC, and HUA. Among NHANES participants, results showed a nonlinear association between TyG, TyG-BMI, TyG-WHtR, TyG-WC, and HUA (P-value < 0.05). As shown in Figure 2-1. Among CHARLS participants, the results showed a nonlinear association between TyG, TyG-BMI, TyG-WHtR, TyG-WC, and HUA (P-value < 0.05). As shown in Figure 2-2.
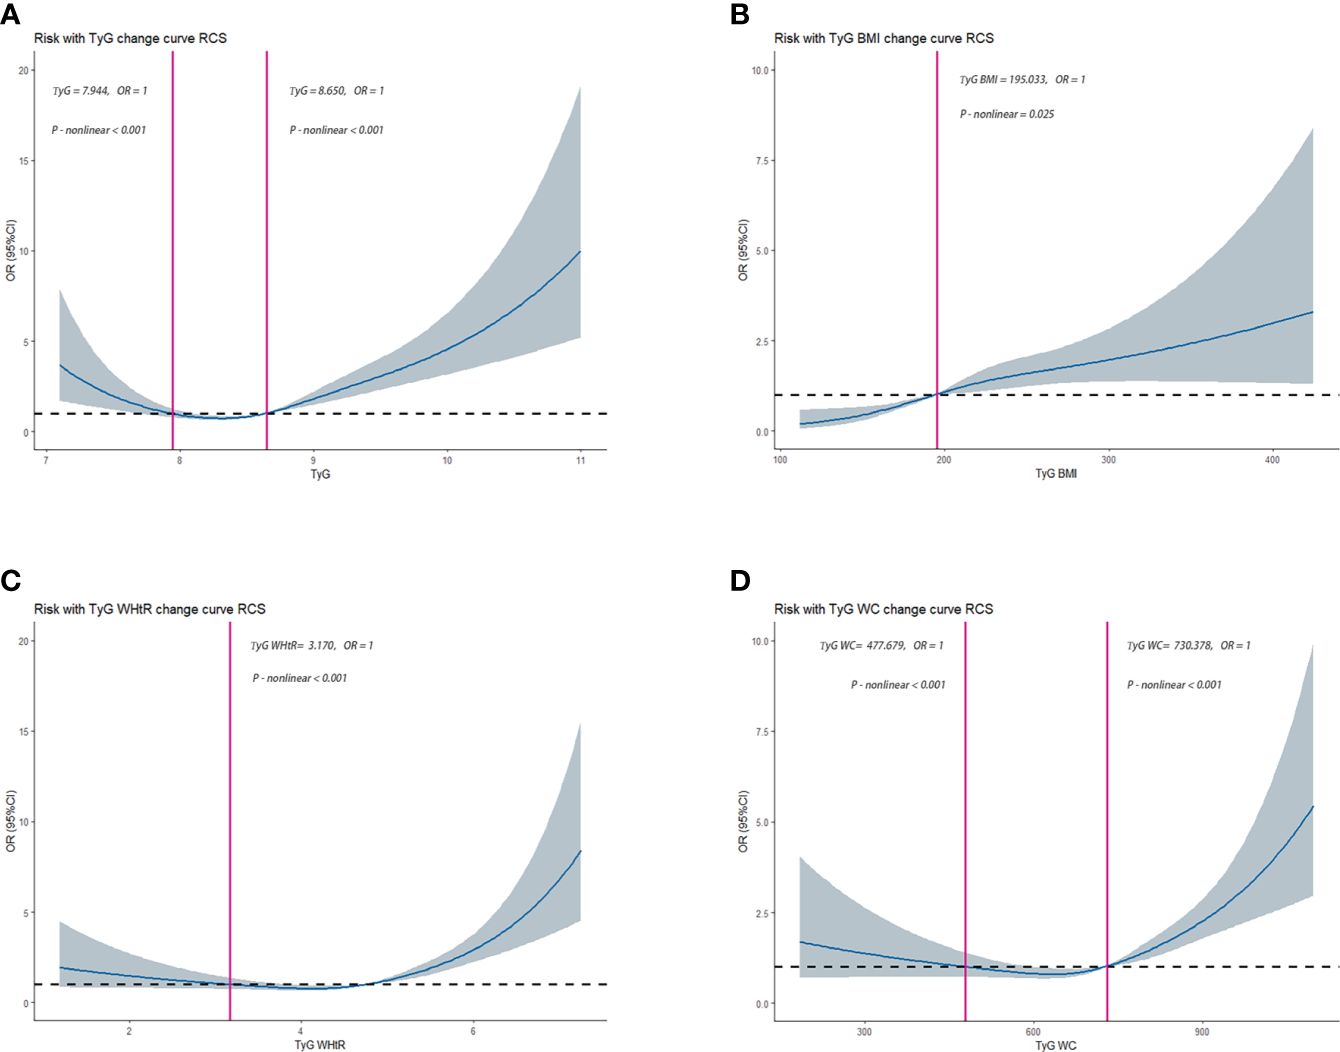
Figure 2-1 Dose–response relationships between TyG, TyG-BMI, TyG-WHtR, TyG-WC, and HUA in NHANES, separately (A), TyG (B), TyG-BMI (C), TyG-WHtR (D), TyG-WC. OR (95% CI) (shaded areas) were adjusted for Sex, Age, Marital, Education levels, Hypertension, Diabetes, Hypertriglyceridemia and Healthy Lifestyle Score. Vertical red solid lines indicate the minimal threshold for the beneficial association with estimated OR = 1. OR, odds ratio.
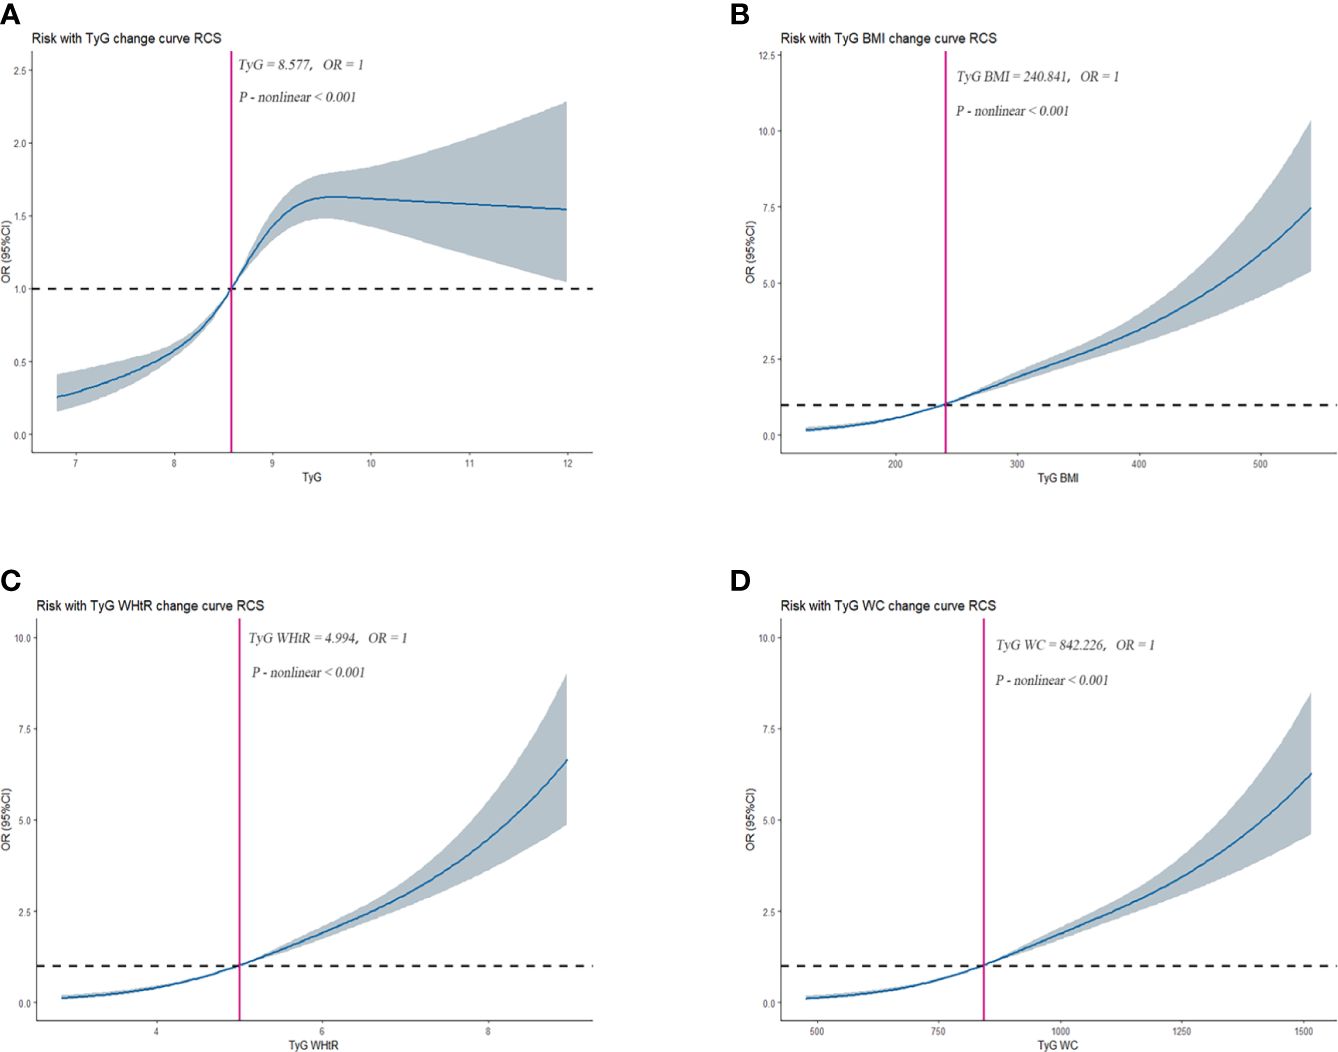
Figure 2-2 Dose–response relationships between TyG, TyG-BMI, TyG-WHtR, TyG-WC, and HUA in CHARLS, separately (A), TyG (B), TyG-BMI (C), TyG-WHtR (D), TyG-WC. OR (95% CI) (shaded areas) were adjusted for Sex, Age, Marital, Education levels, Hypertension, Diabetes, Hypertriglyceridemia and Healthy Lifestyle Score. Vertical red solid lines indicate the minimal threshold for the beneficial association with estimated OR = 1. OR, odds ratio.
3.5 Sensitivity analysis
We found that different levels of TyG, TyG-BMI, TyG-WHtR and TyG-WC were still statistically significantly associated with HUA (P-value < 0.05) in NHANES participants who did not have hypertension, hyperlipidemia, and diabetes. In Model 1, TyG [Q4, 3.00 (1.70, 5.29)], TyG-BMI [Q3, 3.53 (1.96, 6.38); Q4, 6.61 (3.71, 11.78)], TyG-WHtR [Q3, 2.82 (1.47, 5.41); Q4, 5.86 (3.14, 10.93)], TyG-WC [Q3, 3.26 (1.72, 6.17); Q4, 6.40 (3.38, 12.13)] may be risk factors for HUA and may increase the risk of developing HUA. In Model 2, TyG [Q4, 2.40 (1.36, 4.23)], TyG-BMI [Q3, 2.97 (1.63, 5.40); Q4, 5.78 (3.24, 10.32)], TyG-WHtR [Q3, 2.99 (1.52, 5.91); Q4, 6.35 (3.29, 12.23)], TyG-WC [Q3, 2.83 (1.48, 5.39); Q4, 5.36 (2.84, 10.12)] may be risk factors for HUA and may increase the risk of developing HUA.
In Model3, TyG [Q4, 2.16 (1.20, 3.88)], TyG-BMI [Q3, 3.04 (1.64, 5.63); Q4, 5.95 (3.22, 11.02)], TyG-WHtR [Q3, 3.07 (1.55, 6.08); Q4, 6.54 (3.38, 12.66)], and TyG-WC (Q3, 2.85 (1.52, 5.36); Q4, 5.35 (2.85, 10.01)) may be risk factors for HUA and may increase the risk of developing HUA. As shown in Table 4-1.
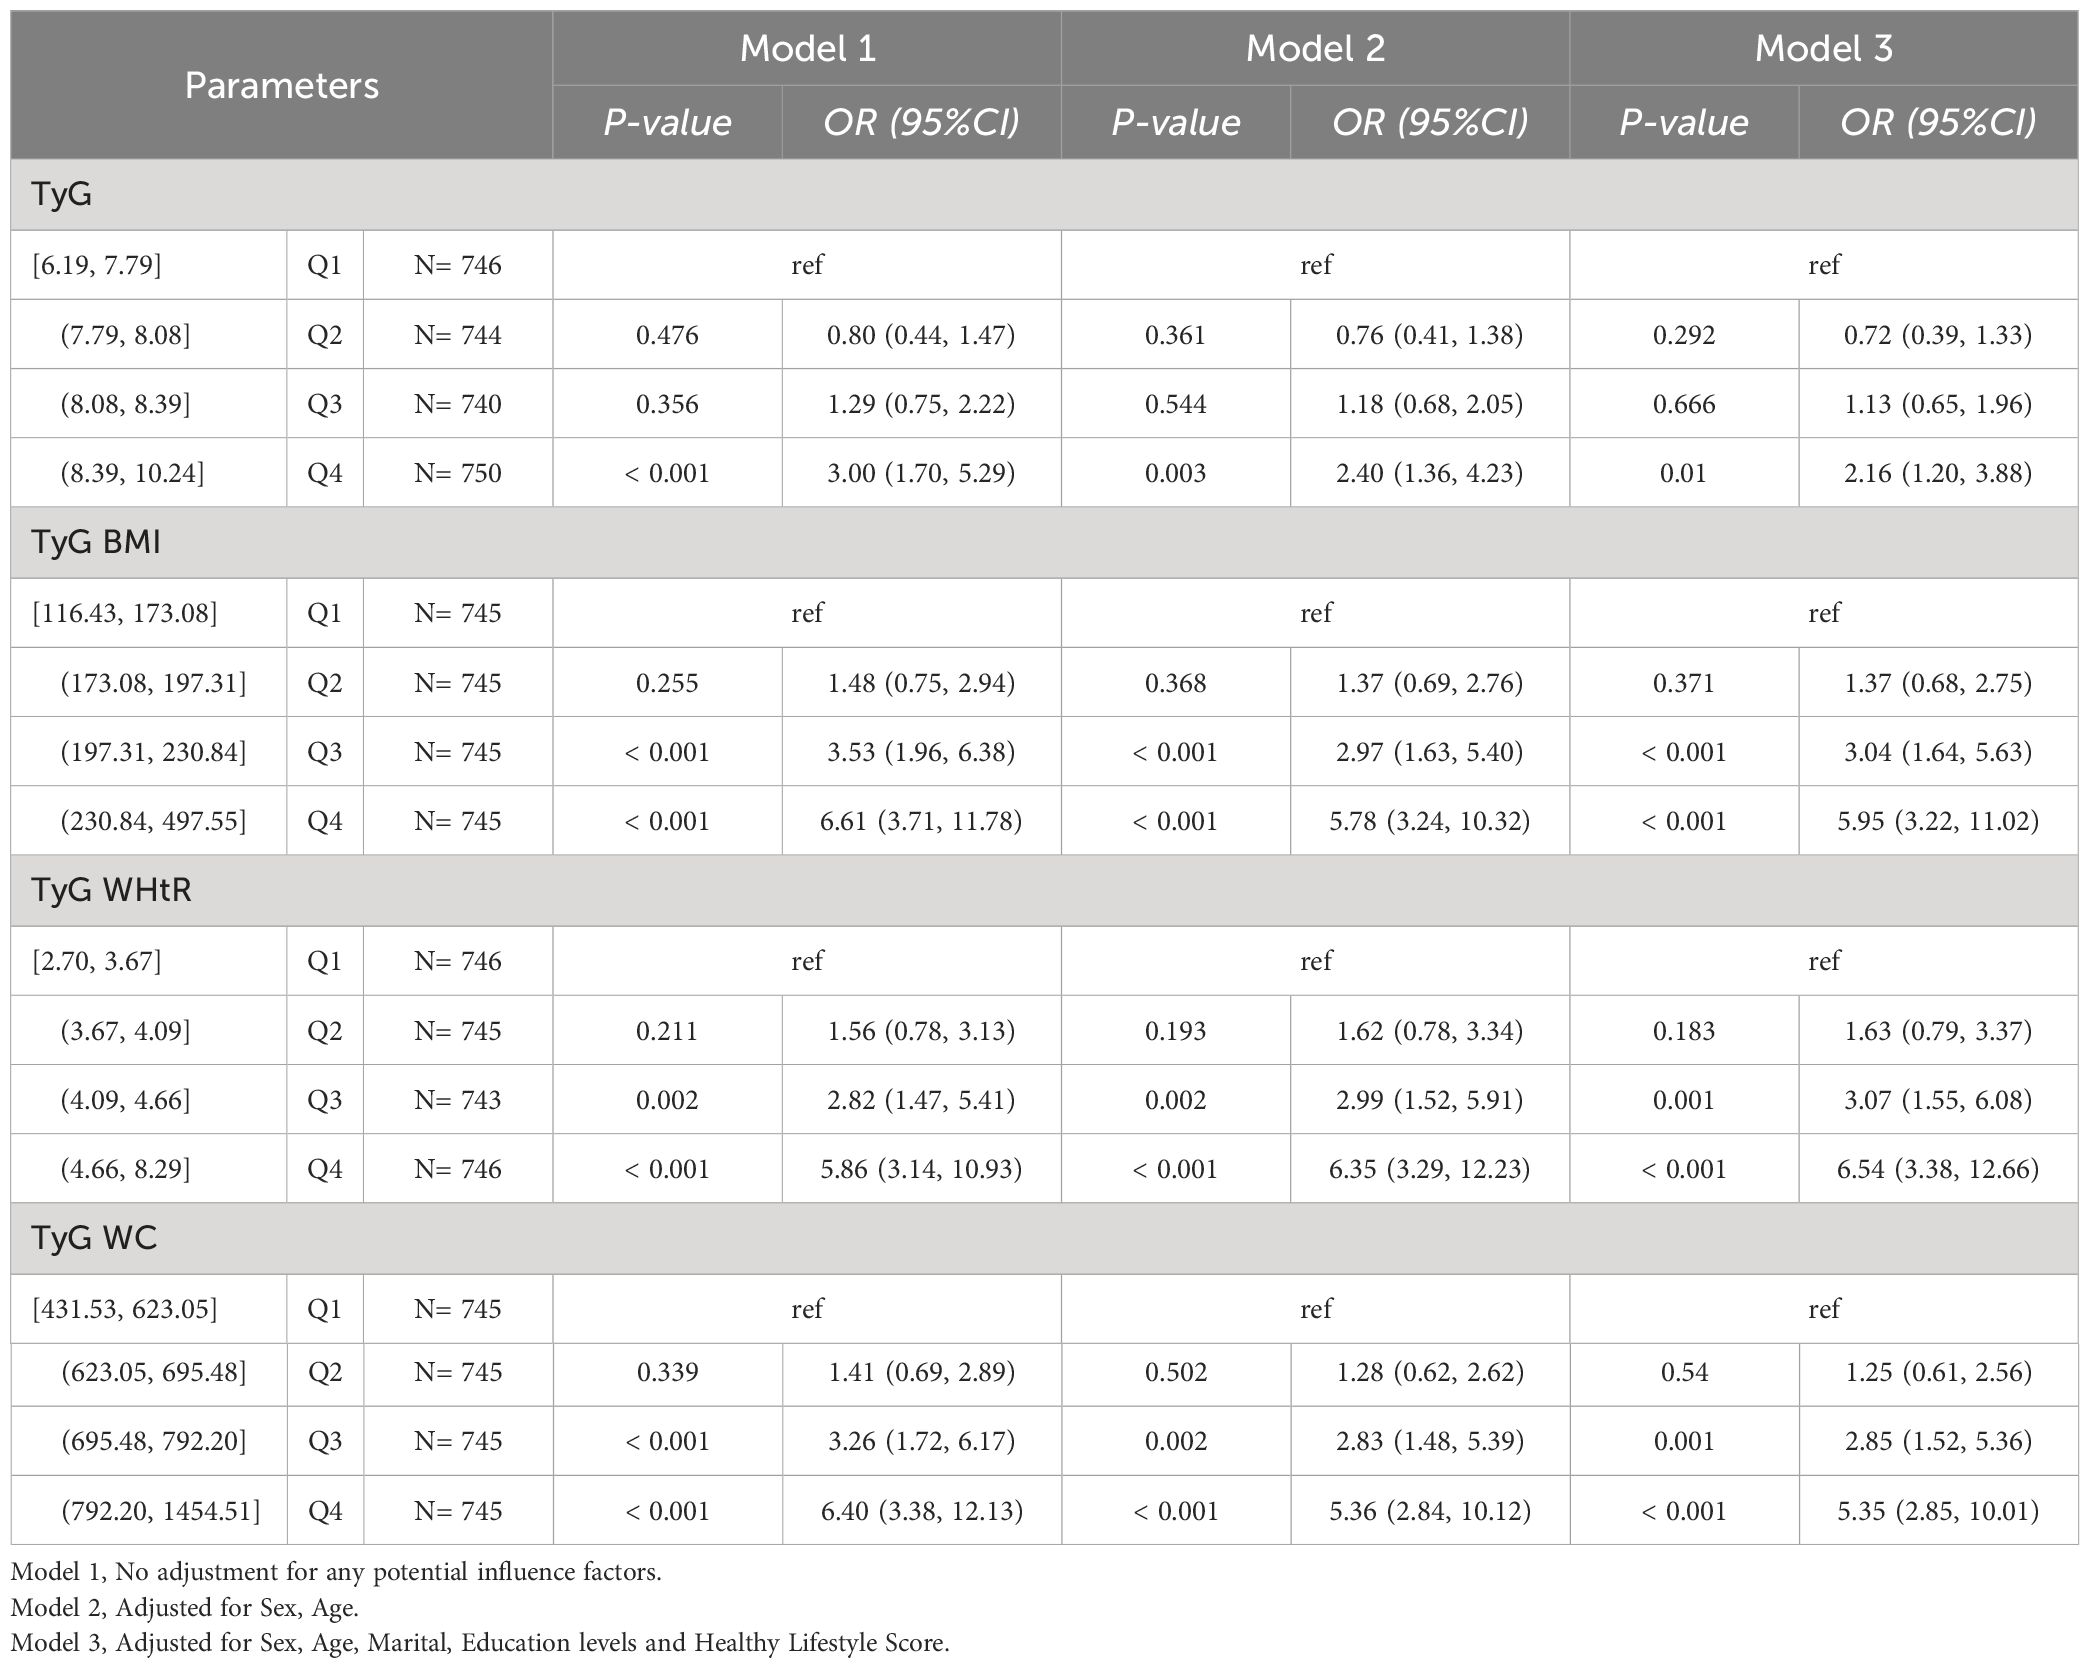
Table 4-1 Multivariate logistic regression results of the relationship between TyG, TyG BMI, TyG WHtR and TyG WC with HUA in NHANES, separately. Sensitivity analyses excluding hypertension, hyperlipidemia, and diabetes.
We found that TyG remained statistically significantly associated with HUA in CHARLS participants without hypertension, hyperlipidemia, and diabetes (P-value < 0.05), and did not find statistically significant associations of TyG-BMI, TyG-WHtR and TyG-WC with HUA. In Model1, 2, and 3, TyG [Q3, 0.001(0.001,0.001)]. As shown in Table 4-2.
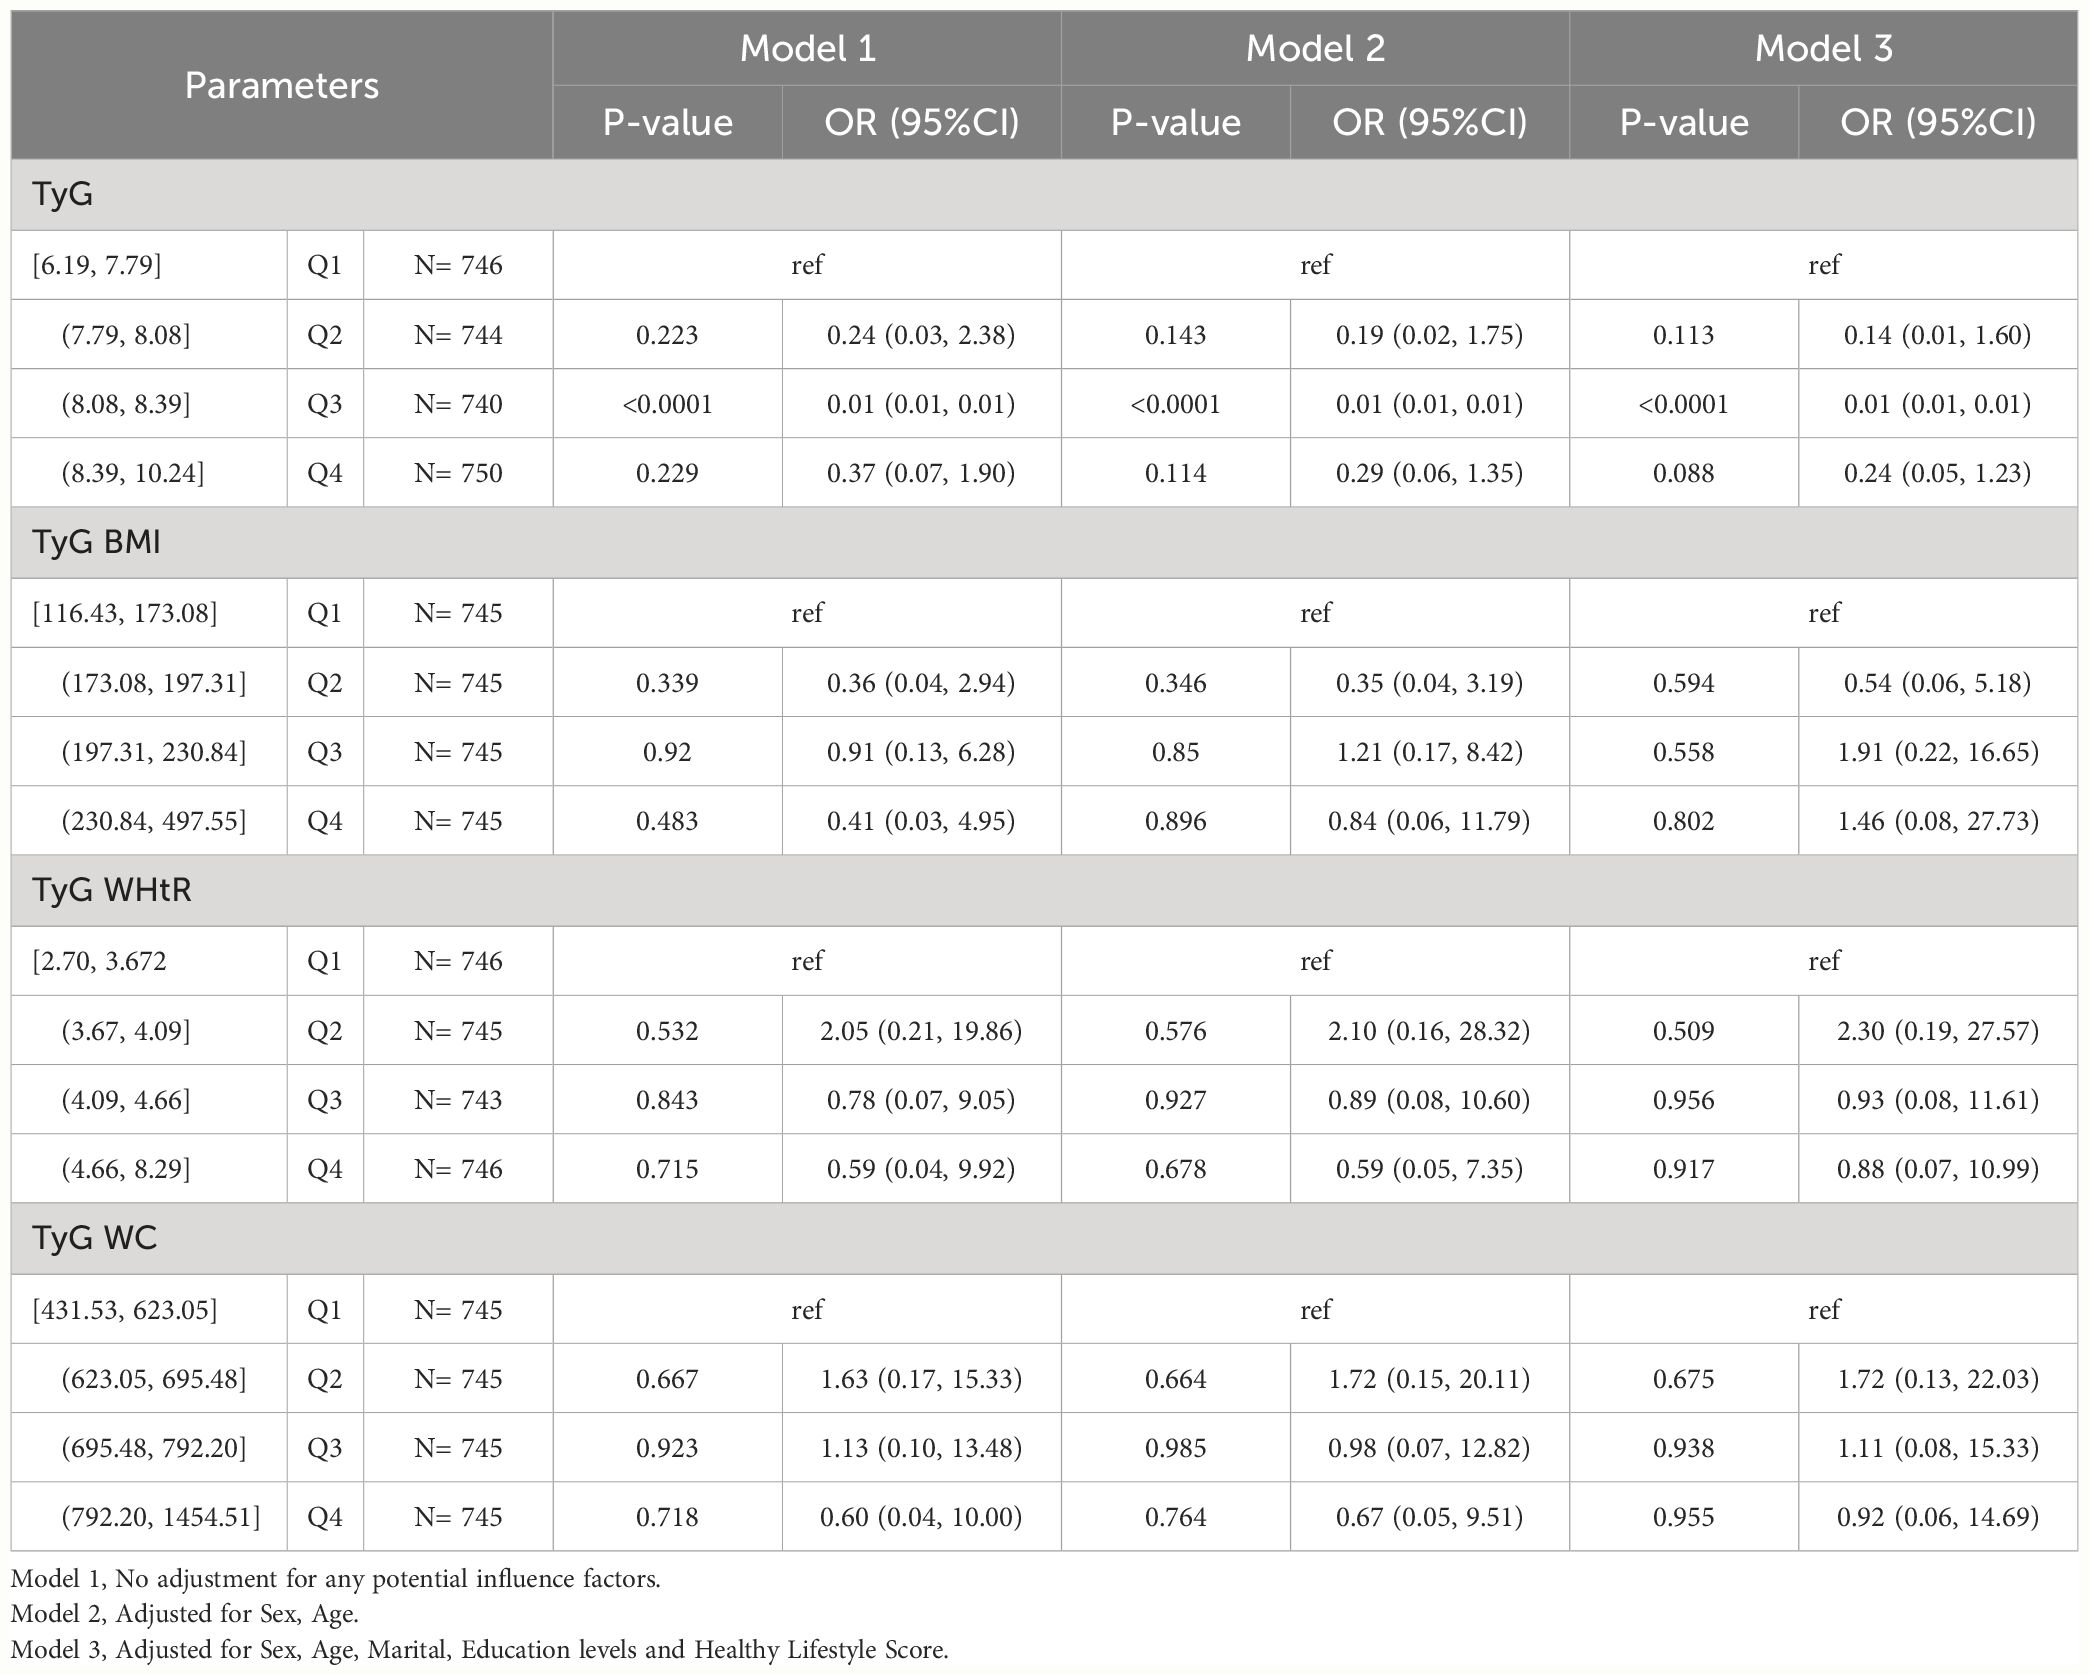
Table 4-2 Multivariate logistic regression results of the relationship between TyG, TyG BMI, TyG WHtR and TyG WC with HUA in CHARLS, separately. Sensitivity analyses excluding hypertension, hyperlipidemia, and diabetes.
4 Discussion
The study presents a novel discovery based on consistent findings from the Chinese CHARLS and the US NHANES databases. The research identifies TyG, TyG-BMI, TyG-WHtR, and TyG-WC as potential risk factors for HUA in the general populations of China and the United States, indicating a heightened risk of developing HUA. These indicators promote that the risk of developing HUA is equally increased in men and women. Furthermore, TyG and its derived metrics only have an effect on HUA at higher levels. Notably, this study is the first to incorporate healthy lifestyle factors, sampling weights, and combined data from Chinese and U.S. general populations in the analysis of TyG and its derivatives concerning the risk of HUA.
Previous studies have demonstrated a close relationship between HUA and IR, and the gold standard for IR assessment is the Hyperinsulinemic-euglycemic clamp (36). However, the Hyperinsulinemic-euglycemic clamp (HEC) is challenging to implement in clinical settings because of its invasive, complex, and time-intensive procedures. Alternatively, the Homeostatic Model Assessment of Insulin Resistance (HOMA-IR) indices offer a simpler approach for assessing IR (36). TyG was proposed by Simal-Mendia et al. (37) as a simple, practical and usable alternative marker to identify IR. It has been shown that TyG maintains good agreement with HEC and HOMA-IR (13). In clinical practice, TyG provides additional options for evaluating IR and reducing the risk of IR-related diseases. This new biomarker is recognized as a valuable tool for diagnosing various chronic conditions. Previous research has demonstrated that TyG markers are linked to conditions such as diabetes, hypertension, metabolic syndrome, atherosclerosis, and the long-term risk of cardiovascular disease (38, 39). Due to its ease of use and cost-effectiveness, the TyG index has been utilized as a proxy for IR in extensive epidemiological studies. It has demonstrated significant associations with TyG-BMI, TyG-WC, and TyG-WTHR (14, 40). Previous studies have demonstrated that obesity markers (BMI, WC and WHTR) are associated with HUA (41), while the release of pro-inflammatory cytokines from adipose tissue can exacerbate IR (42, 43). The superiority of combining TyG with obesity indicators has been demonstrated in a student-oriented study, stating that TyG and its derivatives may increase the prevalence risk of HUA in specific groups (41). TyG and TyG-BMI indices were used as IR biomarkers in a cross-sectional study among Chinese older adults, and these markers showed significant associations with increased risk of HUA or hypertension, alone or in combination (44), which is similar to and supports our findings.
Physiological concentrations of SUA, a metabolic byproduct of purine nucleotides, have beneficial antioxidant effects and act as free radical scavengers (45). SUA also provides protective effects such as anti-DNA damage, anti-aging effects, and delayed cognitive decline. However, high concentrations of uric acid can lead to HUA and the aggregation of reactive oxygen species (ROS) under stressful conditions like hypoxia and ischemia, contributing to oxidative stress (45). Increased ROS formation resulting from HUA can decrease the transcription factors necessary for insulin gene expression, leading to reduced insulin synthesis and release (46). Elevated levels of SUA are associated with oxidative stress, which can impair glucose metabolism, decrease insulin sensitivity, and contribute to IR by upregulating insulin receptor substrate 1 phosphorylation and increasing ROS production (47–49). IR promotes SUA synthesis through the hexose monophosphate pathway and reduces SUA renal excretion (48, 49). Additionally, insulin enhances renal reabsorption of uric acid by activating glucose transporter protein (Glut 9) and other urate transporter proteins, ultimately leading to elevated uric acid levels (50). These results suggest that TyG and its derivatives reflect metabolic abnormalities and suggest the possibility that participants are at increased risk of developing HUA. Additionally, NHANES results were that TyG, TyG-BMI, TyG-WHtR, and TyG-WC were able to increase the risk of the disease in both men and women, and Charls results were that TyG and its derived indices were better predictors of the risk of HUA in women. TyG and its derived indices were positively associated with HUA (22). And it can be considered a good indicator for screening for HUA regardless of the participant’s obesity status (51). Previous studies have noted that the predictive ability of both TyG and its derived indices for HU risk is better in women than in men (52).This is similar to our findings. This study, conducted in the United States and China, utilized a larger population sample to represent the general population. It considered population weighting and healthy lifestyles, revealing an association between TyG and its derivatives with HUA. These findings could help shape future programs aimed at preventing HUA. However, the cross-sectional design of the study limits the ability to establish a causal relationship between IR and HUA. A cohort study suggested that a high TyG index was associated with an increased risk of CKD (18), and that renal function (including GFR) was a risk factor for HUA (21).
Although our findings suggest a relationship between TyG and HUA, the specific mechanism remains unclear. The most common mechanism is associated with IR, with compensatory hyperinsulinemia following IR, resulting in reduced uric acid excretion through renal tubule sodium reabsorption, leading to HUA (53). However, epidemiological evidence needs to be validated with longer follow-up and larger samples. It is important to note the low representation of adults aged 20-44 years in the Chinese CHARLS study, which was dominated by participants aged 45 years and older. Despite this, participants aged 20-44 years were included in the Chinese CHARLS study to maintain consistency with the NHANES study. Despite controlling for various covariates in the analyses, the original design of the CHARLS study may still have uncollected confounders, such as dietary factors like meat, vegetables, and dairy intake. Healthy lifestyles were calculated in NHANES, considering the HEI. The result of the study was a significant association between TyG and its derived indices and hyperuricemia (HUA). We cannot exclude unmeasured influences, such as lack of information on dietary habits, genetic predisposition, etc., that may have influenced the results. Sensitivity analysis showed that the NHANES study results were consistent with the main analysis, indicating that TyG and its derived indicators may be risk factors for HUA. However, results from CHARLS studies are inconsistent, possibly due to residual effects, unmeasured confounders, and measurement error that influence the analysis. Nonetheless, the main results of the NHANES and CHARLS studies are consistent. Future studies should focus on the critical values of TyG, TyG-BMI, TyG-WHtR and TyG-WC that affect HUA. This will facilitate the development of reliable, sensitive and convenient assessment tools for clinical research, epidemiological surveys and primary disease screening. Because we did not include clinical treatment measures in our study, it is not possible to speculate further on potential screening strategies or treatments for HUA. Our study implies that maintaining a low level of TyG index may be beneficial in preventing or mitigating the risk of developing HUA. This study has several limitations. First, this is a cross-sectional study, so only correlations, not causation and temporal associations, can be inferred. The cross-sectional design of this study limits the ability to determine a causal relationship between IR levels and HUA. To establish causality, longer follow-up investigations are needed. Additionally, we did not report the status of eGFR and failed to correct for it in the model. In this study we were unable to obtain complete measures of renal function, medical information on diuretics (and more in general CV drug therapies), information on renal progression or need for renal replacement therapy, longitudinal information on lipid profiles, race factors and genetic susceptibility, which may have an impact on the assessment of serum uric acid. In addition, although various covariates were controlled for in the analysis, there may still be confounding factors that were not captured by the original design of the CHARLS study, such as dietary habits, physical activity, and genetic predispositions. Finally, NHANES takes HEI into account when calculating healthy lifestyles. Information on diet, exercise, smoking, drinking, etc. is obtained through self-report, which may not be accurate enough.
5 Conclusion
The results showed that TyG, TyG-BMI, TyG-WHtR and TyG-WC were associated with a higher risk of HUA in Chinese and American populations. The predictive ability of each indicator for the risk of developing HUA was stronger in women than in men. Despite the limitations of this study, TyG has the potential to replace IR in assessing the prevalence of HUA. This study provides a reliable, sensitive and convenient assessment tool for the prevention of HUA.
Data availability statement
Publicly available datasets were analyzed in this study. This data can be found here: CHARLS (http://charls.pku.edu.cn/pages/data/2011-charls-wave1/en.html) and NHANES (http://www.cdc.go/nchs/nhanes.htm).
Ethics statement
The surveys were approved by the NCHS Research Ethics Review Board (Protocol #2011-17) in NHANES. All methods were performed in accordance with the relevant guidelines and regulations (Declaration of Helsinki). Informed consent was obtained from all subjects and/or their legal guardian(s). The studies involving human participants were reviewed and approved by the Ethics Review Committee of Peking University in CHARLS. The patients/participants provided their written informed consent to participate in this study.
Author contributions
RG: Conceptualization, Formal analysis, Methodology, Supervision, Writing – original draft, Writing – review & editing. DD: Methodology, Supervision, Writing – original draft, Writing – review & editing. MT: Supervision, Writing – review & editing. XC: Supervision, Writing – review & editing. YZ: Supervision, Writing – review & editing. XM: Supervision, Writing – review & editing. GL: Funding acquisition, Supervision, Writing – original draft, Writing – review & editing.
Funding
The author(s) declare financial support was received for the research, authorship, and/or publication of this article. This work was supported by the Key project of Ningxia Natural Science Foundation (grant no. 2021AAC02015) and the National Natural Science Foundation of China Projects (grant no. 82060050).
Conflict of interest
The authors declare that the research was conducted in the absence of any commercial or financial relationships that could be construed as a potential conflict of interest.
Publisher’s note
All claims expressed in this article are solely those of the authors and do not necessarily represent those of their affiliated organizations, or those of the publisher, the editors and the reviewers. Any product that may be evaluated in this article, or claim that may be made by its manufacturer, is not guaranteed or endorsed by the publisher.
References
1. Li C, Hsieh MC, Chang SJ. Metabolic syndrome, diabetes, and hyperuricemia. Curr Opin Rheumatol. (2013) 25:210–6. doi: 10.1097/BOR.0b013 e32835d951e
2. Amiya E. Link between hyperuricemia, renal dysfunction, and hypertension. J Clin Hypertension (Greenwich Conn.). (2021) 23:2078–9. doi: 10.1111/jch.14389
3. Dalbeth N, Gosling AL, Gaffo A, Abhishek A. Gout. Lancet. (2021) 397:1843–55. doi: 10.1016/S0140-6736(21)00569-9
4. Butler F, Alghubayshi A, Roman Y. The epidemiology and genetics of hyperuricemia and gout across major racial groups: a literature review and population genetics secondary database analysis. J Pers Med. (2021) 11:231. doi: 10.3390/jpm11030231
5. Zhang M, Zhu X, Wu J, Huang Z, Zhao Z, Zhang X, et al. Prevalence of hyperuricemia among Chinese adults: findings from two nationally representative cross-sectional surveys in 2015-16 and 2018-19. Front Immunol. (2021) 12:791983. doi: 10.3389/fimmu.2021.791983
6. Zhu Y, Pandya BJ, Choi HK. Prevalence of gout and hyperuricemia in the US general population: the National Health and Nutrition Examination Survey 2007-2008. Arthritis Rheum. (2011) 63:3136–41. doi: 10.1002/art.30520
7. Perez-Ruiz F, Dalbeth N, Bardin T. A review of uric acid, crystal deposition disease, and gout. Adv Ther. (2015) 32:31–41. doi: 10.1007/s12325-014-0175-z
8. Muniyappa R, Lee S, Chen H, Quon MJ. Current approaches for assessing insulin sensitivity and resistance in vivo: advantages, limitations, and appropriate usage. Am J Physiol Endocrinol Metab. (2008) 294:E15–26. doi: 10.1152/ajpendo.00645.2007
9. Khamseh ME, Malek M, Abbasi R, Taheri H, Lahouti M, Alaei-Shahmiri F. Triglyceride glucose index and related parameters (Triglyceride glucose-body mass index and triglyceride glucose-waist circumference) identify nonalcoholic fatty liver and liver fibrosis in individuals with overweight/obesity. Metab Syndr Relat Disord. (2021) 19:167–73. doi: 10.1089/met.2020.0109
10. Bala C, Gheorghe-Fronea O, Pop D, Pop C, Caloian B, Comsa H, et al. The association between six surrogate insulin resistance indexes and hypertension: a population-based study. Metab Syndr Relat Disord. (2019) 17:328–33. doi: 10.1089/met.2018.0122
11. Kim JA, Hwang SY, Yu JH, Roh E, Hong SH, Lee YB, et al. Association of the triglyceride and glucose index with low muscle mass: KNHANES 2008-2011. Sci Rep. (2021) 11:450. doi: 10.1038/s41598-020-80305-1
12. Malek M, Khamseh ME, Chehrehgosha H, Nobarani S, Alaei-Shahmiri F. Triglyceride glucose-waist to height ratio: a novel and effective marker for identifying hepatic steatosis in individuals with type 2 diabetes mellitus. Endocrine. (2021) 74:538–45. doi: 10.1007/s12020-021-02815-w
13. Guerrero-Romero F, Simental-Mendia LE, Gonzalez-Ortiz M, Martinez-Abundis E, Ramos-Zavala MG, Hernandez-Gonzalez SO, et al. The product of triglycerides and glucose, a simple measure of insulin sensitivity. Comparison with the euglycemic-hyperinsulinemic clamp. J Clin Endocrinol Metab. (2010) 95:3347–51. doi: 10.1210/jc.2010-0288
14. Sanchez-Garcia A, Rodriguez-Gutierrez R, Mancillas-Adame L, Gonzalez-Nava V, Diaz GA, Solis RC, et al. Diagnostic accuracy of the triglyceride and glucose index for insulin resistance: a systematic review. Int J Endocrinol. (2020) 2020:4678526. doi: 10.1155/2020/4678526
15. Zhou S, Yu Y, Zhang Z, Ma L, Wang C, Yang M, et al. Association of obesity, triglyceride-glucose and its derivatives index with risk of hyperuricemia among college students in Qingdao, China. Front Endocrinol (Lausanne). (2022) 13:1001844. doi: 10.3389/fendo.2022.1001844
16. Kim HS, Cho YK, Kim EH, Lee MJ, Jung CH, Park JY, et al. Triglyceride glucose-waist circumference is superior to the homeostasis model assessment of insulin resistance in identifying nonalcoholic fatty liver disease in healthy subjects. J Clin Med. (2021) 11(1):41. doi: 10.3390/jcm11010041
17. Hu J, Cai X, Li N, Zhu Q, Wen W, Hong J, et al. Association between triglyceride glucose index-waist circumference and risk of first myocardial infarction in Chinese hypertensive patients with obstructive sleep apnoea: an observational cohort study. Nat Sci Sleep. (2022) 14:969–80. doi: 10.2147/NSS.S362101
18. Zhu Q, Chen Y, Cai X, Cai L, Hong J, Luo Q, et al. The non-linear relationship between triglyceride-glucose index and risk of chronic kidney disease in hypertensive patients with abnormal glucose metabolism: a cohort study. Front Med (Lausanne). (2022) 9:1018083. doi: 10.3389/fmed.2022.1018083
19. D’Elia L, Masulli M, Virdis A, Casiglia E, Tikhonoff V, Angeli F, et al. Triglyceride-glucose index and mortality in a large regional-based Italian database (Urrah project). J Clin Endocrinol Metab. (2024). doi: 10.1210/clinem/dgae170
20. Russo E, Viazzi F, Pontremoli R, Barbagallo CM, Bombelli M, Casiglia E, et al. Association of uric acid with kidney function and albuminuria: the Uric Acid Right for heArt Health (URRAH) Project. J Nephrol. (2022) 35:211–21. doi: 10.1007/s40620-021-00985-4
21. Russo E, Viazzi F, Pontremoli R, Barbagallo CM, Bombelli M, Casiglia E, et al. Serum uric acid and kidney disease measures independently predict cardiovascular and total mortality: the uric acid right for heart health (URRAH) project. Front Cardiovasc Med. (2021) 8:713652. doi: 10.3389/fcvm.2021.713652
22. Liu S, Zhou Z, Wu M, Zhang H, Xiao Y. Association between the triglyceride glucose index and hyperuricemia in patients with primary hypertension: a cross-sectional study. Int J Endocrinol. (2023) 2023:5582306. doi: 10.1155/2023/5582306
23. McCormick N, O’Connor MJ, Yokose C, Merriman TR, Mount DB, Leong A, et al. Assessing the causal relationships between insulin resistance and hyperuricemia and gout using bidirectional mendelian randomization. Arthritis Rheumatol. (2021) 73:2096–104. doi: 10.1002/art.41779
24. Banik SD, Avila-Nava A, Lugo R, Chim AR, Gutierrez SA. Association between low-grade inflammation and hyperuricemia in adults with metabolic syndrome in Yucatan, Mexico. Can J Diabetes. (2022) 46:369–74. doi: 10.1016/j.jcjd.2021.11.010
25. Zhu J, Sun L, Yang J, Fan J, Tse LA, Li Y. Genetic predisposition to type 2 diabetes and insulin levels is positively associated with serum urate levels. J Clin Endocrinol Metab. (2021) 106:e2547–56. doi: 10.1210/clinem/dgab200
26. Hu X, Rong S, Wang Q, Sun T, Bao W, Chen L, et al. Association between plasma uric acid and insulin resistance in type 2 diabetes: a Mendelian randomization analysis. Diabetes Res Clin Pract. (2021) 171:108542. doi: 10.1016/j.diabres.2020.108542
27. Xiong F, Yu C, Zhu LJ, Wang T, Zhou W, Bao HH, et al. [Associations between insulin resistance indexes and hyperuricemia in hypertensive population]. Zhongguo Yi Xue Ke Xue Yuan Xue Bao. (2023) 45:390–8. doi: 10.3881/j.issn.1000-503X.15414
28. Maloberti A, Vanoli J, Finotto A, Bombelli M, Facchetti R, Redon P, et al. Uric acid relationships with lipid profile and adiposity indices: Impact of different hyperuricemic thresholds. J Clin Hypertens (Greenwich). (2023) 25:78–85. doi: 10.1111/jch.14613
29. Huo RR, Zhai L, Liao Q, You XM. Changes in the triglyceride glucose-body mass index estimate the risk of stroke in middle-aged and older Chinese adults: a nationwide prospective cohort study. Cardiovasc Diabetol. (2023) 22:254. doi: 10.1186/s12933-023-01983-5
30. Tian N, Chen S, Han H, Jin J, Li Z. Association between triglyceride glucose index and total bone mineral density: a cross-sectional study from NHANES 2011-2018. Sci Rep. (2024) 14:4208. doi: 10.1038/s41598-024-54192-9
31. Nevill AM, Stewart AD, Olds T, Duncan MJ. A new waist-to-height ratio predicts abdominal adiposity in adults. Res Sports Med. (2020) 28:15–26. doi: 10.1080/15438627.2018.1502183
32. Liu Y, Cui J, Cao L, Stubbendorff A, Zhang S. Association of depression with incident sarcopenia and modified effect from healthy lifestyle: the first longitudinal evidence from the CHARLS. J Affect Disord. (2024) 344:373–9. doi: 10.1016/j.jad.2023.10.012
33. Zhang YB, Chen C, Pan XF, Guo J, Li Y, Franco OH, et al. Associations of healthy lifestyle and socioeconomic status with mortality and incident cardiovascular disease: two prospective cohort studies. Bmj. (2021) 373:n604. doi: 10.1136/bmj.n604
34. Huang X, Jiang X, Wang L, Chen L, Wu Y, Gao P, et al. Visceral adipose accumulation increased the risk of hyperuricemia among middle-aged and elderly adults: a population-based study. J Transl Med. (2019) 17:341. doi: 10.1186/s12967-019-2074-1
35. Zhang Y, Zhang M, Yu X, Wei F, Chen C, Zhang K, et al. Association of hypertension and hypertriglyceridemia on incident hyperuricemia: an 8-year prospective cohort study. J Transl Med. (2020) 18:409. doi: 10.1186/s12967-020-02590-8
36. Kuroda A, Taniguchi S, Akehi Y, Mori H, Tamaki M, Suzuki R, et al. Accuracy and time delay of glucose measurements of continuous glucose monitoring and bedside artificial pancreas during hyperglycemic and euglycemic hyperinsulinemic glucose clamp study. J Diabetes Sci Technol. (2017) 11:1096–100. doi: 10.1177/1932296817735122
37. Simental-Mendia LE, Rodriguez-Moran M, Guerrero-Romero F. The product of fasting glucose and triglycerides as surrogate for identifying insulin resistance in apparently healthy subjects. Metab Syndr Relat Disord. (2008) 6:299–304. doi: 10.1089/met.2008.0034
38. Martinez-Sanchez FD, Vargas-Abonce VP, Guerrero-Castillo AP, Santos-Villavicencio ML, Eseiza-Acevedo J, Meza-Arana CE, et al. Serum Uric Acid concentration is associated with insulin resistance and impaired insulin secretion in adults at risk for Type 2 Diabetes. Prim Care Diabetes. (2021) 15:293–9. doi: 10.1016/j.pcd.2020.10.006
39. Araujo SP, Juvanhol LL, Bressan J, Hermsdorff H. Triglyceride glucose index: a new biomarker in predicting cardiovascular risk. Prev Med Rep. (2022) 29:101941. doi: 10.1016/j.pmedr.2022.101941
40. Selvi N, Nandhini S, Sakthivadivel V, Lokesh S, Srinivasan AR, Sumathi S. Association of triglyceride-glucose index (TyG index) with hbA1c and insulin resistance in type 2 diabetes mellitus. Maedica (Bucur). (2021) 16:375–81. doi: 10.26574/maedica.2021.16.3.375
41. Wang YY, Li L, Cui J, Yin F, Yang F, Yuan DM, et al. Associations between anthropometric parameters (body mass index, waist circumference and waist to hip ratio) and newly diagnosed hyperuricemia in adults in Qingdao, China: a cross-sectional study. Asia Pac J Clin Nutr. (2020) 29:763–70. doi: 10.6133/apjcn.202012_29(4).0011
42. Choi HK, Atkinson K, Karlson EW, Curhan G. Obesity, weight change, hypertension, diuretic use, and risk of gout in men: the health professionals follow-up study. Arch Intern Med. (2005) 165:742–8. doi: 10.1001/archinte.165.7.742
43. Donohoe CL, Doyle SL, Reynolds JV. Visceral adiposity, insulin resistance and cancer risk. Diabetol Metab Syndr. (2011) 3:12. doi: 10.1186/1758-5996-3-12
44. Li Y, You A, Tomlinson B, Yue L, Zhao K, Fan H, et al. Insulin resistance surrogates predict hypertension plus hyperuricemia. J Diabetes Investig. (2021) 12:2046–53. doi: 10.1111/jdi.13573
45. Han R, Zhang Y, Jiang X. Relationship between four non-insulin-based indexes of insulin resistance and serum uric acid in patients with type 2 diabetes: a cross-sectional study. Diabetes Metab Syndr Obes. (2022) 15:1461–71. doi: 10.2147/DMSO.S362248
46. Matsuoka T, Kajimoto Y, Watada H, Kaneto H, Kishimoto M, Umayahara Y, et al. Glycation-dependent, reactive oxygen species-mediated suppression of the insulin gene promoter activity in HIT cells. J Clin Invest. (1997) 99:144–50. doi: 10.1172/JCI119126
47. Zhu Y, Hu Y, Huang T, Zhang Y, Li Z, Luo C, et al. High uric acid directly inhibits insulin signalling and induces insulin resistance. Biochem Biophys Res Commun. (2014) 447:707–14. doi: 10.1016/j.bbrc.2014.04.080
48. Han T, Lan L, Qu R, Xu Q, Jiang R, Na L, et al. Temporal relationship between hyperuricemia and insulin resistance and its impact on future risk of hypertension. Hypertension. (2017) 70:703–11. doi: 10.1161/HYPERTENSIONAHA.117.09508
49. King C, Lanaspa MA, Jensen T, Tolan DR, Sanchez-Lozada LG, Johnson RJ. Uric acid as a cause of the metabolic syndrome. Contrib Nephrol. (2018) 192:88–102. doi: 10.1159/000484283
50. Spatola L, Ferraro PM, Gambaro G, Badalamenti S, Dauriz M. Metabolic syndrome and uric acid nephrolithiasis: insulin resistance in focus. Metabolism. (2018) 83:225–33. doi: 10.1016/j.metabol.2018.02.008
51. Lertsakulbunlue S, Sangkool T, Bhuriveth V, Mungthin M, Rangsin R, Kantiwong A, et al. Associations of triglyceride-glucose index with hyperuricemia among Royal Thai Army personnel. BMC Endocr Disord. (2024) 24:17. doi: 10.1186/s12902-024-01542-3
52. Wang H, Zhang J, Pu Y, Qin S, Liu H, Tian Y, et al. Comparison of different insulin resistance surrogates to predict hyperuricemia among U.S. Non-diabetic adults. Front Endocrinol (Lausanne). (2022) 13:1028167. doi: 10.3389/fendo.2022.1028167
Keywords: TyG, hyperuricemia, NHANES, CHARLS, HUA
Citation: Gou R, Dou D, Tian M, Chang X, Zhao Y, Meng X and Li G (2024) Association between triglyceride glucose index and hyperuricemia: a new evidence from China and the United States. Front. Endocrinol. 15:1403858. doi: 10.3389/fendo.2024.1403858
Received: 20 March 2024; Accepted: 14 June 2024;
Published: 01 July 2024.
Edited by:
Le Zhang, University of California, Riverside, United StatesReviewed by:
Xintian Cai, People’s Hospital of Xinjiang Uygur Autonomous Region, ChinaAlessandro Maloberti, University of Milano Bicocca, Italy
Katarina Sebekova, Comenius University, Slovakia
Copyright © 2024 Gou, Dou, Tian, Chang, Zhao, Meng and Li. This is an open-access article distributed under the terms of the Creative Commons Attribution License (CC BY). The use, distribution or reproduction in other forums is permitted, provided the original author(s) and the copyright owner(s) are credited and that the original publication in this journal is cited, in accordance with accepted academic practice. No use, distribution or reproduction is permitted which does not comply with these terms.
*Correspondence: Guanghua Li, Z2hsZWUwNDA0QDE2My5jb20=
†These authors have contributed equally to this work and share first authorship