 Kun Zhang1*
 Zhihui Li
 Ya-Wen Chen
95% of researchers rate our articles as excellent or good
Learn more about the work of our research integrity team to safeguard the quality of each article we publish.
Find out more
ORIGINAL RESEARCH article
Front. Endocrinol. , 14 June 2024
Sec. Thyroid Endocrinology
Volume 15 - 2024 | https://doi.org/10.3389/fendo.2024.1393904
Background: Medullary thyroid cancer (MTC) is a challenging malignancy. The survival outcome of MTC based on AJCC staging system does not render a discriminant classifier among early stages.
Methods: 3601 MTC patients from 2000 to 2018 were identified from the Surveillance, Epidemiology, and End Results (SEER) database. Smooth curve fitting, Cox proportional hazard regression and competing risk analysis were applied.
Results: A linear correlation between age and log RR (relative risk of overall death) was detected. Overlaps were observed between K-M curves representing patients aged 45–50, 50–55, and 55–60. The study cohort was divided into 3 subgroups with 2 age cutoffs set at 45 and 60. Each further advanced age cutoff population resulted in a roughly “5%” increase in MTC-specific death risks and an approximately “3 times” increase in non-MTC-specific death risks.
Conclusions: The survival outcome disparity across age cutoffs at 45 and 60 for MTC has been well defined.
Medullary thyroid cancer (MTC), whether inherited or sporadic, is an uncommon and challenging malignancy (1, 2). Since calcitonin (Ct) secreting parafollicular C cells of the thyroid gland were first publicly described by a pathologist (3) to be the origin of MTC, many efforts (4–7) in oncological study and clinical epidemiology were made to demonstrate that up to 25% of all cases are autosomal dominant inherited disorders correlating to RET gene alterations, with about 75% presenting as sporadic tumors. Within less than a decade of these findings, it was discovered that almost all patients with multiple endocrine neoplasia types 2A and 2B (MEN2A and MEN2B) as well as familial medullary thyroid cancer (FMTC) had RET germline mutations, while approximately 50 percent of sporadic MTCs had somatic RET mutations (8–13). Thus, MTC has been well recognized as a proto-oncogene driven disease.
According to current Surveillance, Epidemiology, and End Results (SEER) data, in the United States, MTC has accounted for 2% to 3% of new diagnoses of all thyroid cancers each year for the last three decades (14). Unlike the rising incidence rates of papillary thyroid cancer (PTC) and other differentiated thyroid cancers (DTC), incidence rates for MTC have remained relatively stable over the same period of time (15). A subsequent analysis of MTC patients using the SEER database demonstrated that the 7th and 8th editions of the AJCC (The American Joint Committee on Cancer) staging system were associated with five-year overall survival (OS) rates of 95% in stage I, 91% in stage II, 89% in stage III, and 68% in stage IV. Furthermore, cancer-specific survival (CSS) rates were 100% in stage I, 99% in stage II, 97% in stage III, and 82% in stage IV (16). The survival outcome, whether OS or CSS, of MTC based on the current AJCC staging system did not render a discriminant classifier with good disparity validity among early stages (stage I, II and III). One explanation might be that there are key survival factors, other than staging itself, that can predict survival outcomes in a more discriminant manner. Age may be one of the key survival predictors for MTC. On one hand, studies (17–19) have shown that patient age at diagnosis is an independent prognostic factor. On the other hand, borrowing from the 2015 ATA (American thyroid association) guideline on DTC management (20), an age cutoff of 55 as a staging threshold has been well established. With this in mind, the impact of age on survival prognosis of MTC may be profound, and has not been thoroughly investigated.
MTC’s low incidence and unbalanced staging-prognosis method has impeded the study of prognostic outcomes, as well as the refinement of the cancer risk stratification and staging system. To fill this knowledge gap, we sought to extract data from the SEER database to acquire a large MTC cohort to evaluate the impact of age on survival outcomes and other associated factors of MTC patients with high reliability and rigorousness.
Our study utilized a cohort of pathologically confirmed MTC patients from the SEER program, a registry that recodes cancer incidence and mortality data from 18 population-based cancer registries across the United States, which comprises approximately 27.8% of the U.S. population (21). As SEER is an open-access public database, no institutional review board approval was required. SEER registries collect data concerning patient demographics, tumor morphology, stage at diagnosis, primary tumor site, the first course of treatment, and follow-up for vital status and causes of deaths. Our selected database is cited as: “Incidence - SEER Research Plus Data, 18 Registries, Nov 2020 Sub (2000–2018) - Linked To County Attributes - Total U.S., 1969–2019 Counties, National Cancer Institute, DCCPS, Surveillance Research Program, released April 2021, based on the November 2020 submission.”
Using the selected database, we identified a consecutive cohort of 3601 patients diagnosed with MTC between 2000 and 2018. The clinical data were extracted regarding demographics, tumor staging, and therapeutic approaches: age, gender, race, primary site of tumor, pathology, AJCC (American Joint Committee on Cancer) stage, SEER stage [defined by the SEER database referred to as the SEER stage in our article that represents the staging schema based on information about primary site, histology, or other factors (22)], primary surgery, lymph node dissection, external beam radiation therapy (EBRT), chemotherapy, systemic therapy, survival months, cause-specific death classification, and survival status.
Cause of death was defined to record whether each patient died as a result of MTC or any causes other than MTC, or whether they were alive at the end of the follow-up period. In our study, the primary outcome was OS, which was defined as the time between initial diagnosis and death from all causes. As the secondary outcome, OS was split as CSS and deaths from causes (OC) other than MTC, and analyzed with competing risks regression (23). The focus on OC or non-MTC-specific mortality is justified because OC represents a mutually exclusive survival event, serving as the counterpart of CSS. This distinction allows for the use of competing risk regression, which aims to analyze the specific contributions of different types of mortality to OS.
To examine the association pattern between age and OS of MTC patients, we applied a generalized additive model (GAM) to conduct smooth curve fitting and to examine whether the impact of age on overall death risk is linear or partitioned into intervals. This allowed us to determine whether the relationship with OS started to drastically change when patients reached a certain age. According to the AJCC 7th Edition/TNM Classification system, it is recommended that the population diagnosed with DTC at the age of 45 and older (including age 45) should be applied to a distinct staging algorithm. To maintain consistency with this globally accepted staging methodology, we include patients diagnosed at the ages of 50 and 55 in the age cutoff groups of 50–55 and 55–60, respectively.
To determine the optimal age interval for defining the most discriminant survival disparity, Kaplan-Meier (K-M) curves were estimated and compared between two different age cutoffs. Associated prognostic factors were then selected by univariate Cox proportional hazards regression and K-M curves. Subsequently, significant factors screened by the univariate Cox regression (P < 0.05) were further included in multivariate Cox proportional hazards models. The best Cox model was selected by backward selection process (entry criterion: P < 0.05, elimination criterion: P > 0.10). Multivariate Cox proportional hazards regression analysis was performed to identify variables that independently affected the OS for MTC patients.
In the competing risk model, deaths from OC were regarded as a competing event for MTC-specific death. We computed the cumulative incidence function (CIF) for MTC and OC. CIF curves of MTC-specific death and OC across age cutoff groups were plotted and tested. Subgroup analysis was subsequently carried out according to age, sex, AJCC TNM, tumor size, tumor extension, primary surgery, lymph node dissection, EBRT, chemotherapy, and systemic therapy. The significance in CIF values among subgroups were evaluated by Fine & Gray’s test (23). In the end, we calculated the sub-distribution hazard ratio (SHR) of the included variables for MTC patients based on the multivariate competing risk model with the R package “riskRegression”.
We presented descriptive statistics in Table 1 for the entire study cohort and compared the results across age cutoffs at 45 and 60. Continuous and categorical variables were assessed with the Kruskal-Wallis test and Pearson chi-square test, respectively. Continuous variables were expressed as the mean ± standard deviation (SD)/median. Categorical variables were shown as numbers (percentages). All statistical analyses were carried out employing the R studio version 4.0.4. A two-tailed P < 0.05 was considered statistically significant.
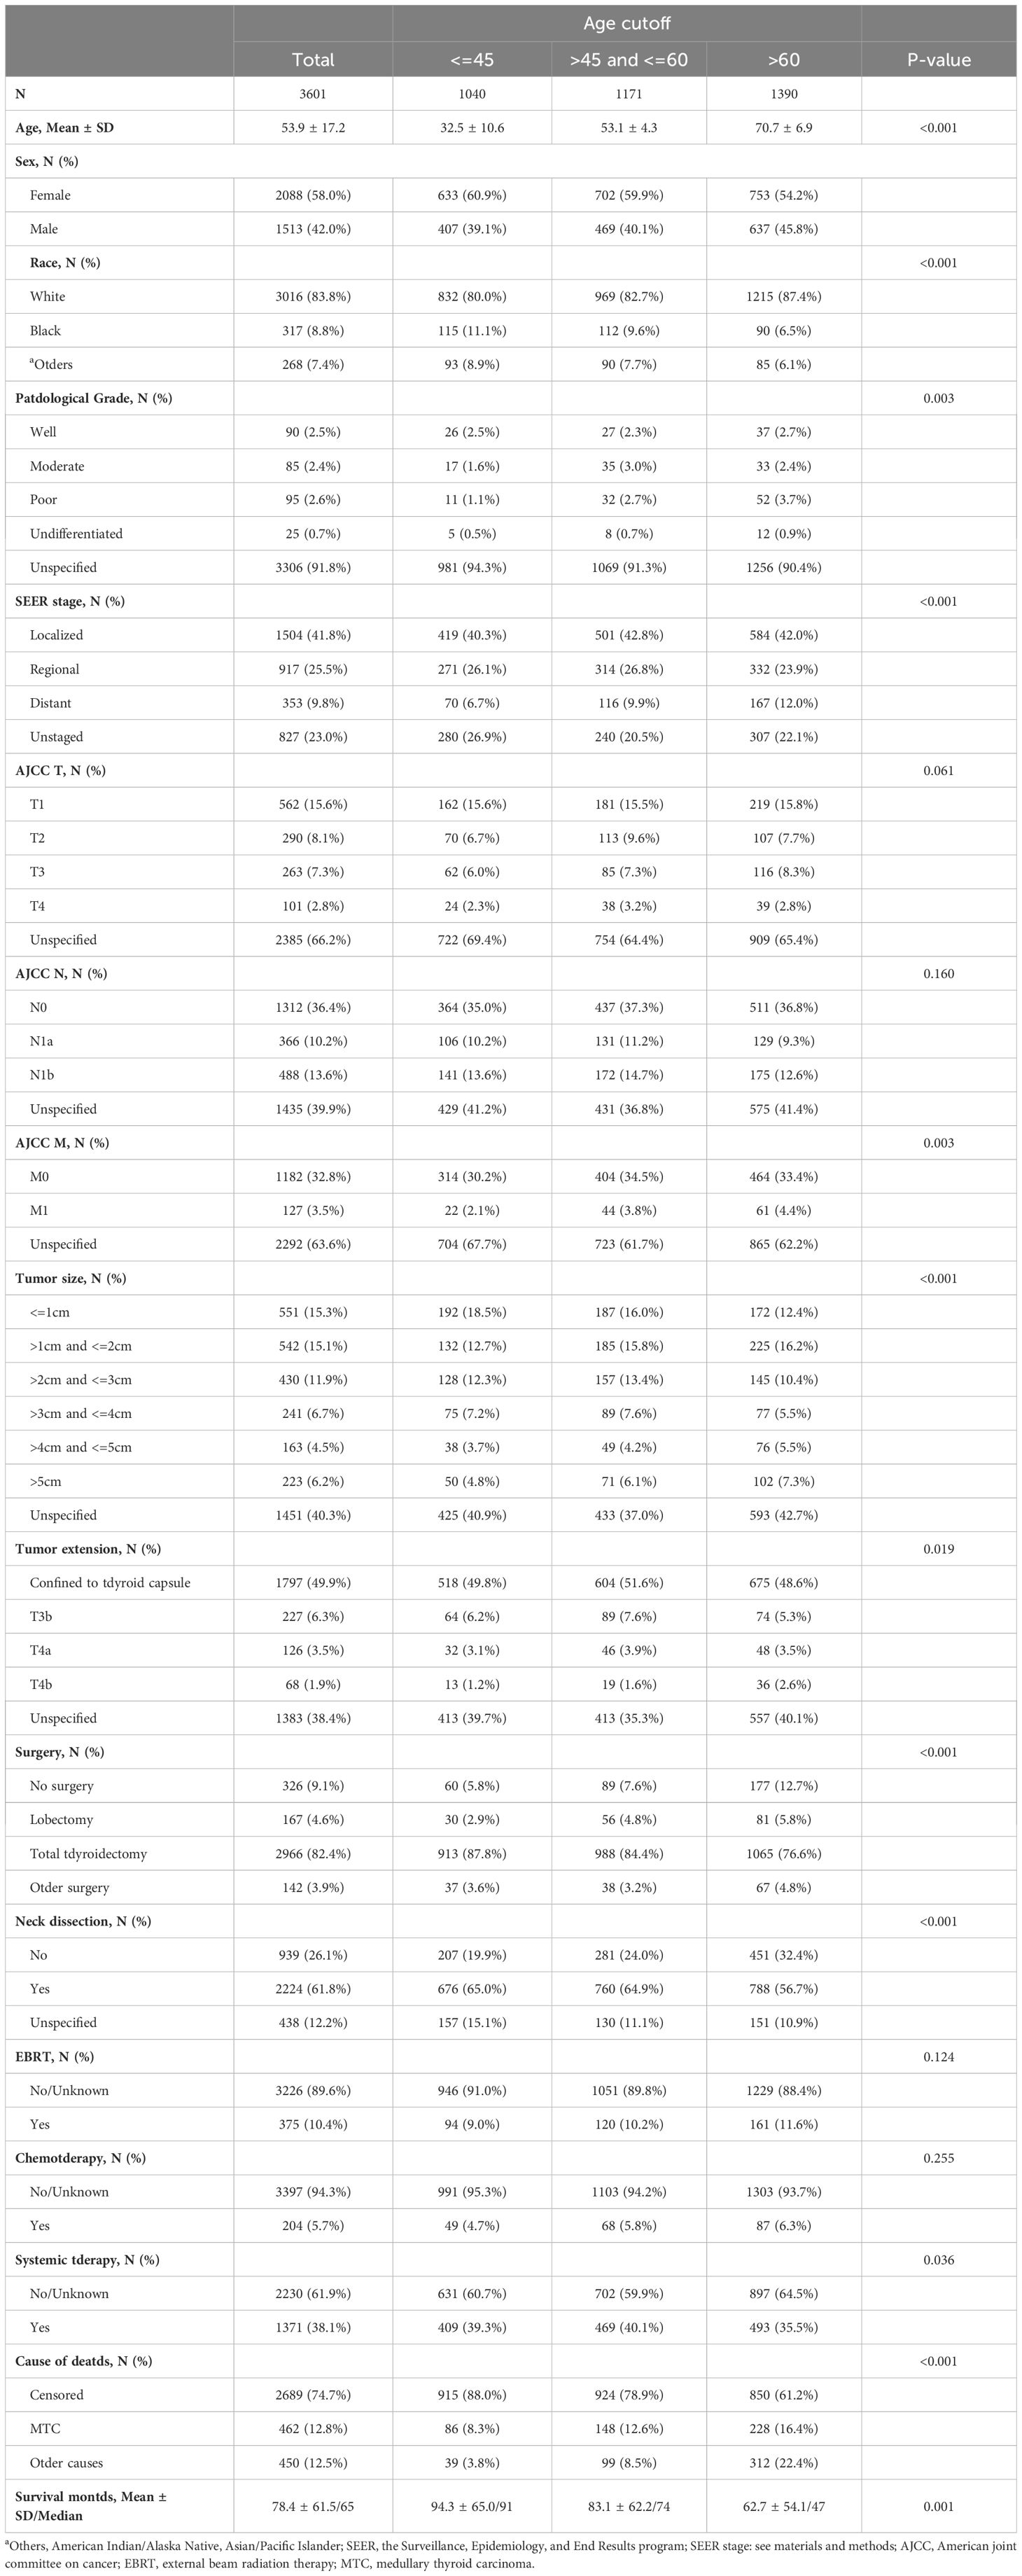
Table 1 Demographic and clinical characteristics by age cutoff groups in medullary thyroid cancer patients.
Using the SEER database from 2000–2018, 3612 consecutive MTC patients were identified, of which 11 were excluded from the study cohort due to no record of survival time. In total, 3601 MTC patients were analyzed. Epidemiologically, MTC patients can be characterized as a group of people with the following features: middle-aged, (median age 53.9 years old, range from 36.7 to 71.1) mostly white (3016, 83.8%), and slightly female predominant (male to female sex ratio is approximately 4 to 6). The median follow-up of the study cohort was 65 months (range from 1 month to 227 months). The total number of deaths during the follow-up period was 912 (25.3%), of which 462 (12.8%) were attributed to MTC and 450 (12.5%) to non-MTC causes rendering a balanced cause-of-death attribution. Overall, the 5- and 10-year CSS was 89.0% (CI: 87.9%–90.2%) and 82.8% (CI: 81.2%–84.4%), respectively, while the 5- and 10-year OS was 80.9% (CI: 79.5%–82.4%) and 68.5% (CI: 66.6%–70.5%).
According to the SEER combined staging system, about 40% of MTC patients (1504, 41.8%) were classified as local stage, about 25% (917, 25.5%) as regional stage, and about 10% (353, 9.8%) as distant stage. AJCC TNM staging method (24) was adopted by the SEER database. However, because unspecified data (T stage, 2385, 66.2%; M stage, 2292, 63.6%) made up around 65% of the total, AJCC staging was not included the following statistical analysis. Almost half of MTC foci were located within the thyroid capsule, and no less than 10% (T3b, T4a, and T4b combined: 421, 11.7%) of them extended beyond the thyroid capsule. Likelihood of lymph node metastasis for the MTC cohort was 23.8% (10.2% central neck compartment involved, 13.6% lateral neck compartment involved, and 39.9% lymph node involvement unspecified). With regard to the treatment regimen, the vast majority of MTC patients were treated with total thyroidectomy (82.4%), while a small fraction underwent lobectomy (4.6%), while neck dissection was performed in more than 60% of all cases (2224, 61.8%). Among the MTC cohort, 3 age cutoff groups were created based on our analysis, which will be described in detail in the next paragraph. All demographic data and baseline clinical characteristics across the age cutoffs at 45 and 60 are shown and compared in Table 1.
To determine the impact of age on overall survival probability, we first applied a generalized additive model (GAM) to conduct smooth curve fitting to examine whether the correlation between age and relative risk of overall death is linear or whether there is a threshold effect. The smooth curve fitting plotted in Figure 1 illustrates that the association between age at diagnosis and overall relative risk of death (Log RR) was linear (Likelihood ratio test, P<0.001; Wald test, P<0.001; log rank test, P<0.001). Based on this discovery, we speculated that the cumulative risk of death should be smoothly partitioned into intervals corresponding with age cutoff groups. In order to demonstrate this, we further plotted five K-M survival curves (Figure 2A) that represent age groups with cutoffs set at 45, 50, 55, and 60, respectively. Overlaps were observed among K-M curves representing patients’ ages of 45–50, 50–55, and 55–60, indicating that survival differences at these age intervals are not statistically significant. In other words, a merger of all age groups from 45 to 60 is statistically justifiable. This was further supported by an additional set of K-M curves with evident survival disparities shown in Figure 2B (p<0.001). We, therefore, stratified the study cohort into 3 age groups (<45, >=45 and <60, and >60) for subsequent analyses.
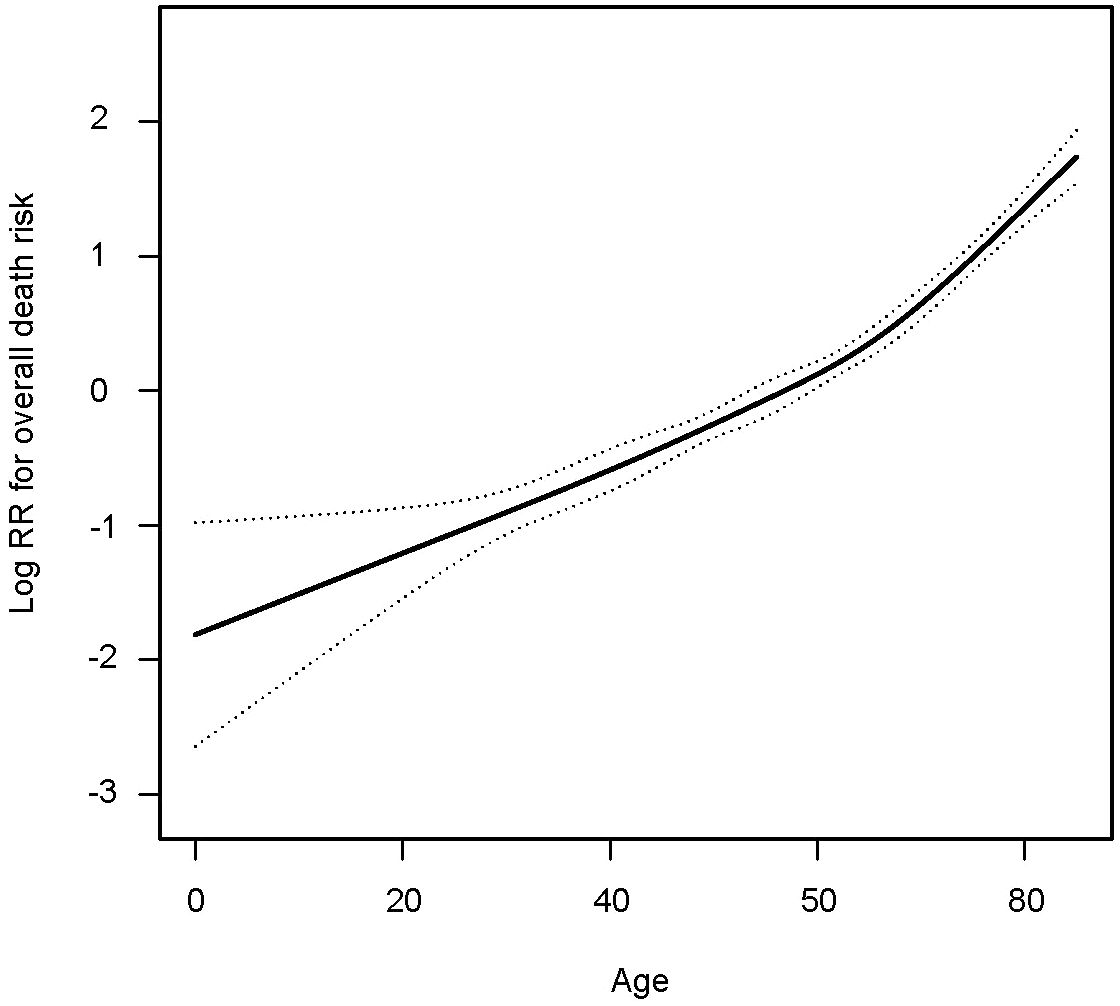
Figure 1 Smooth curve fitting showing the association between age in years and relative risk of overall death in patients with medullary thyroid cancer.
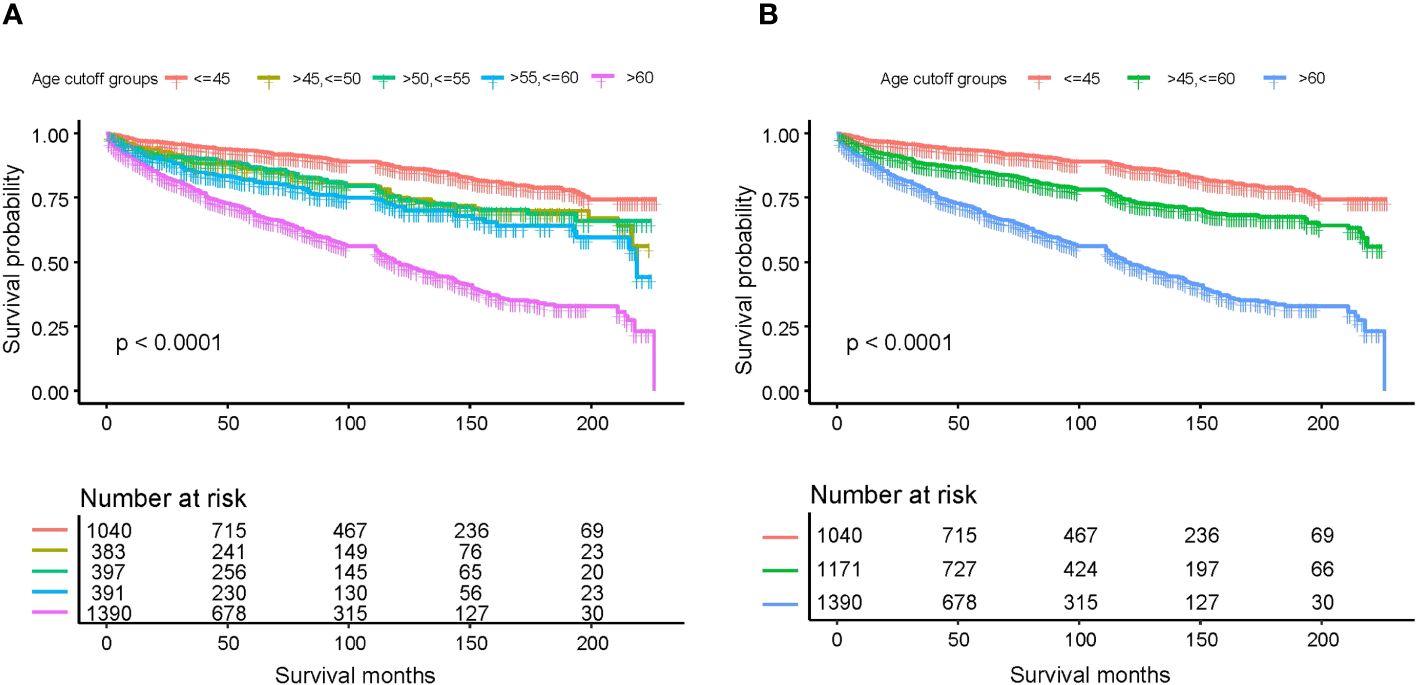
Figure 2 Kaplan-Meier survival curves estimating various age subgroups for overall survival based on different age cutoffs: (A) age cutoffs set at 45, 50, 55, and 60; (B) age cutoffs set at 45 and 60.
In the multivariate Cox analysis for OS, advanced categorical age cutoff group (e.g., age>45 and <=60 vs. age<=45, HR=1.98, 95% CI 1.59–2.45, P<0.001) was estimated as the leading independent prognostic factors associated with worse overall survival outcomes, followed by higher AJCC M stage (M1 vs. M0, HR=1.98, 95% CI 1.48–2.65, P<0.001), more invasive tumor extension (T3a vs. confined to thyroid capsule, HR=2.23, 95% CI 1.67–2.98, P<0.001), larger tumor size (e.g., >3cm and <=4cm vs. <= 1cm, HR=1.77, 95% CI 1.23–2.53, P=0.002), advanced AJCC N stage (N1b vs N0, HR=1.36, 95% CI 1.07–1.73, P=0.013), black ethnicity (black people vs. white people, HR=1.37, 95% CI 1.09–1.73, P=0.008), and male gender (male vs. female, HR=1.27, 95% CI 1.11–1.46, P=0.001) after adjustment and model selection from the univariate Cox regression. Surgery (e.g., total thyroidectomy vs. no surgery, HR=0.25, 95% CI 0.20–0.30, P<0.001) and systemic therapy (yes vs. no, HR=0.75, 95% CI 0.62–0.90, P=0.002) were estimated to be the only independent predictors for better OS. Neck dissection and AJCC T stage were not relevant to OS. Although EBRT (yes vs. no/unknown, HR=1.51, 95% CI 1.26–1.80, P<0.001) and chemotherapy (yes vs. no/unknown, HR=1.79, 95% CI 1.40–2.29, P<0.001) were statistically correlated with decreased OS, interpretations should be done with caution, as addressed in the discussion. In the univariate Cox analysis, the same statistical prognostic factors were estimated as in the multivariate analysis. Detailed Cox statistical analysis related to OS are shown in Table 2.
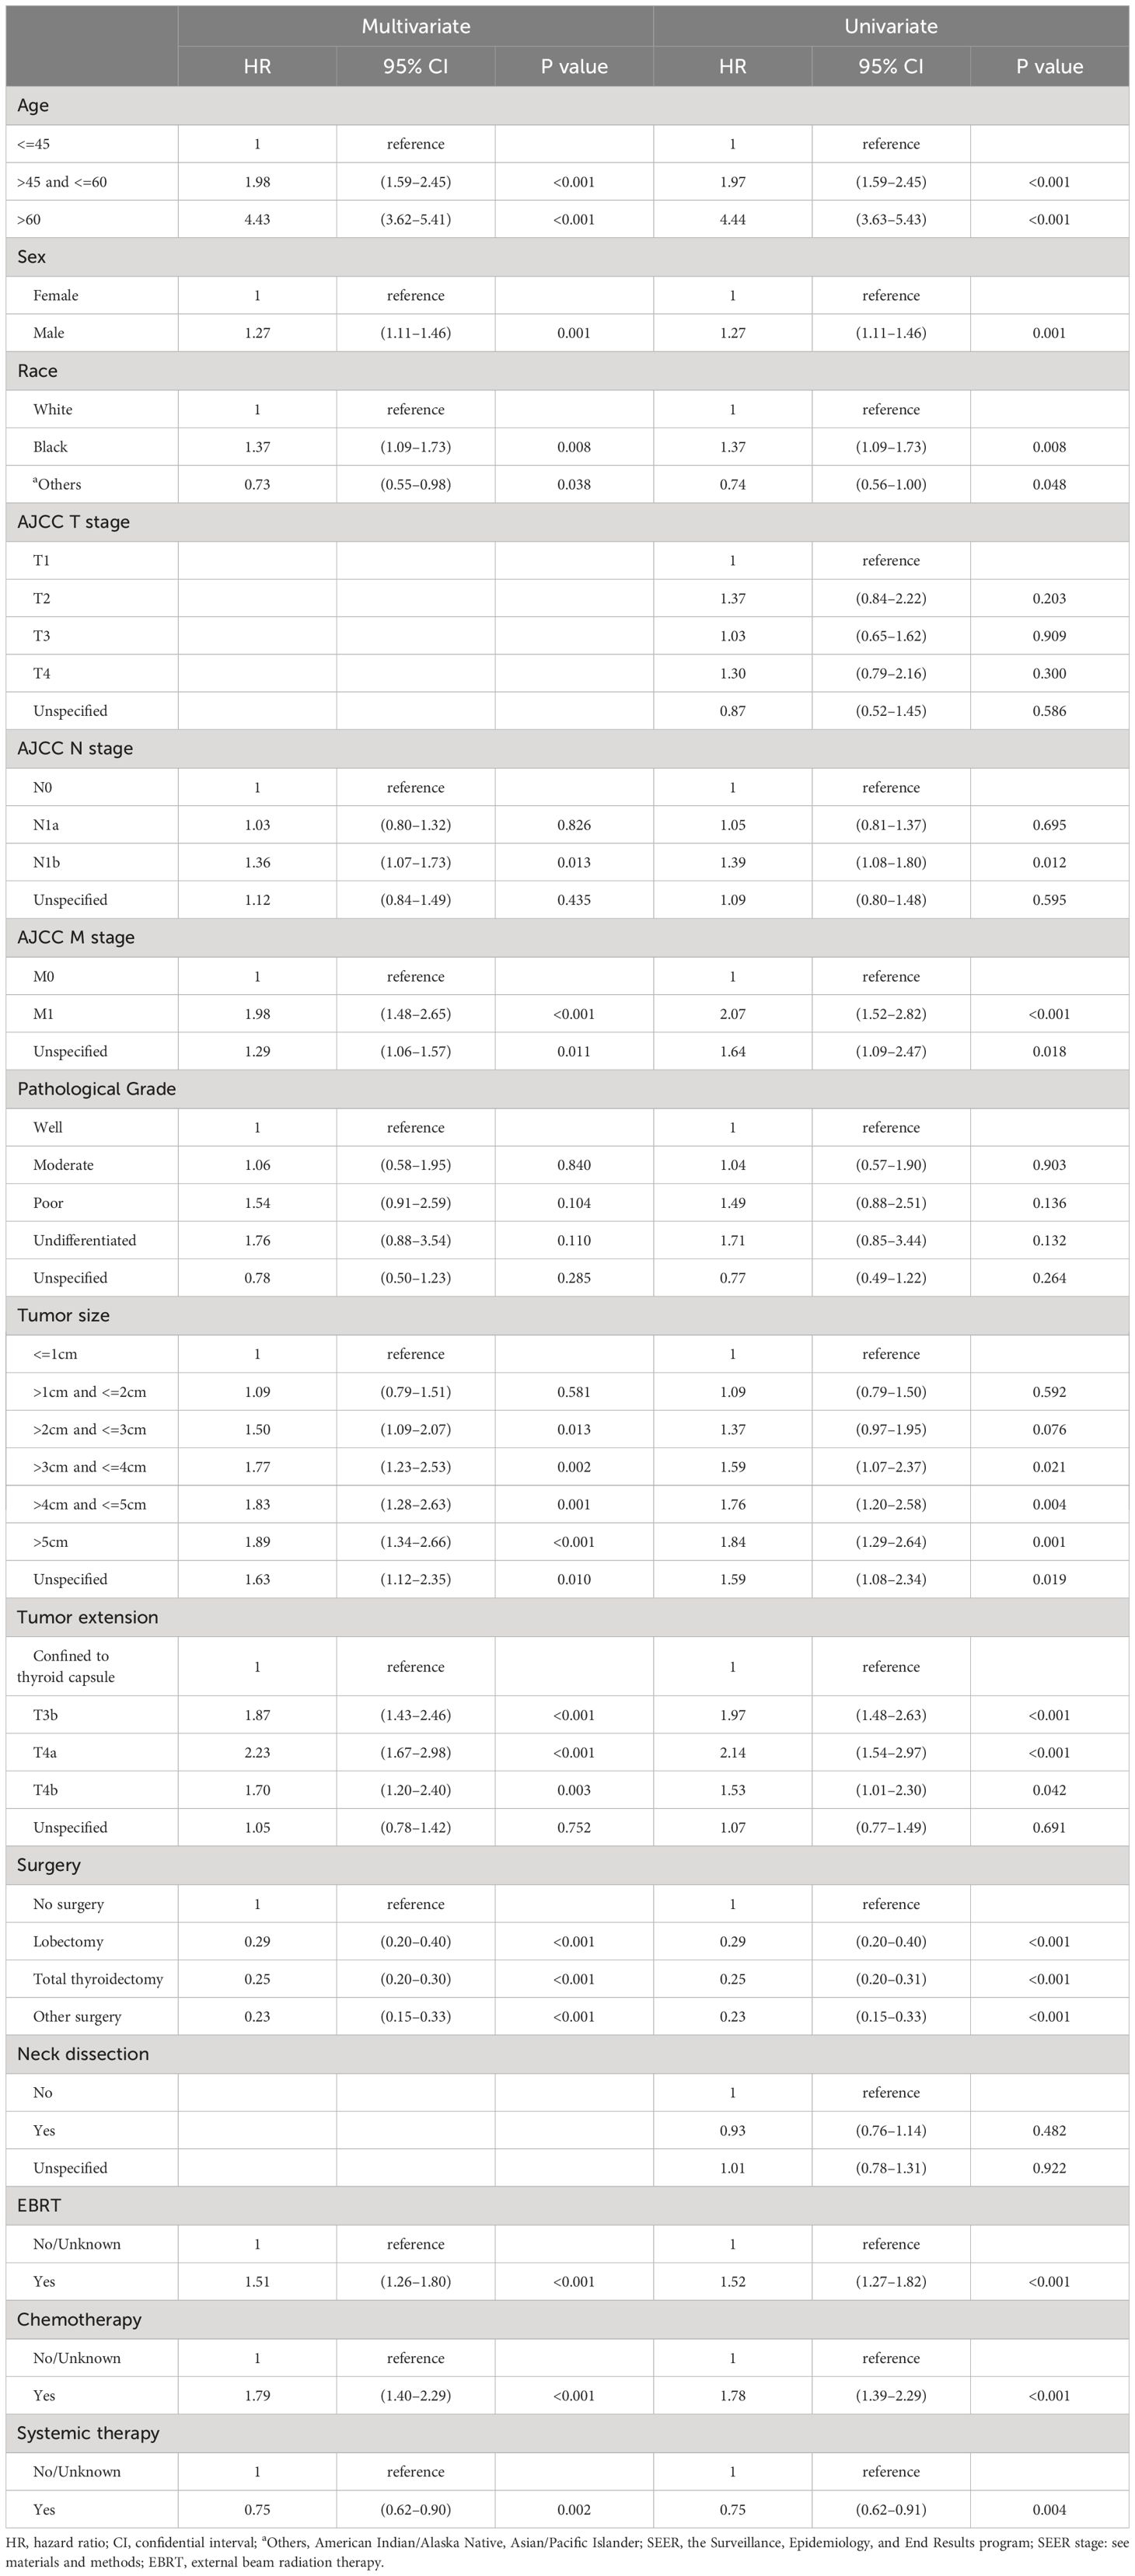
Table 2 Univariate and multivariate Cox proportional hazard regression for analyses of medullary thyroid carcinoma patients for overall survival.
We also analyzed the OS by calculating the cumulative incidence of MTC/non-MTC deaths separately in order to further detect the impact of age cutoffs on MTC survival (Figure 3). Overall, the cumulative incidences of death from MTC over a 5- and 10-year period were 10.6% (95% CI: 9.5%-11.7%) and 16.0% (95% CI: 14.6%-17.5%), respectively, while the 5- and 10-year cumulative odds of dying from non-MTC causes were 8.5% (95% CI: 7.5%-9.5%) and 15.5% (95% CI: 14.0%-17.0%). Separate 5- and 10-year cumulative incidence of death from MTC causes and non-MTC causes in different age cutoff populations are described in Table 3.
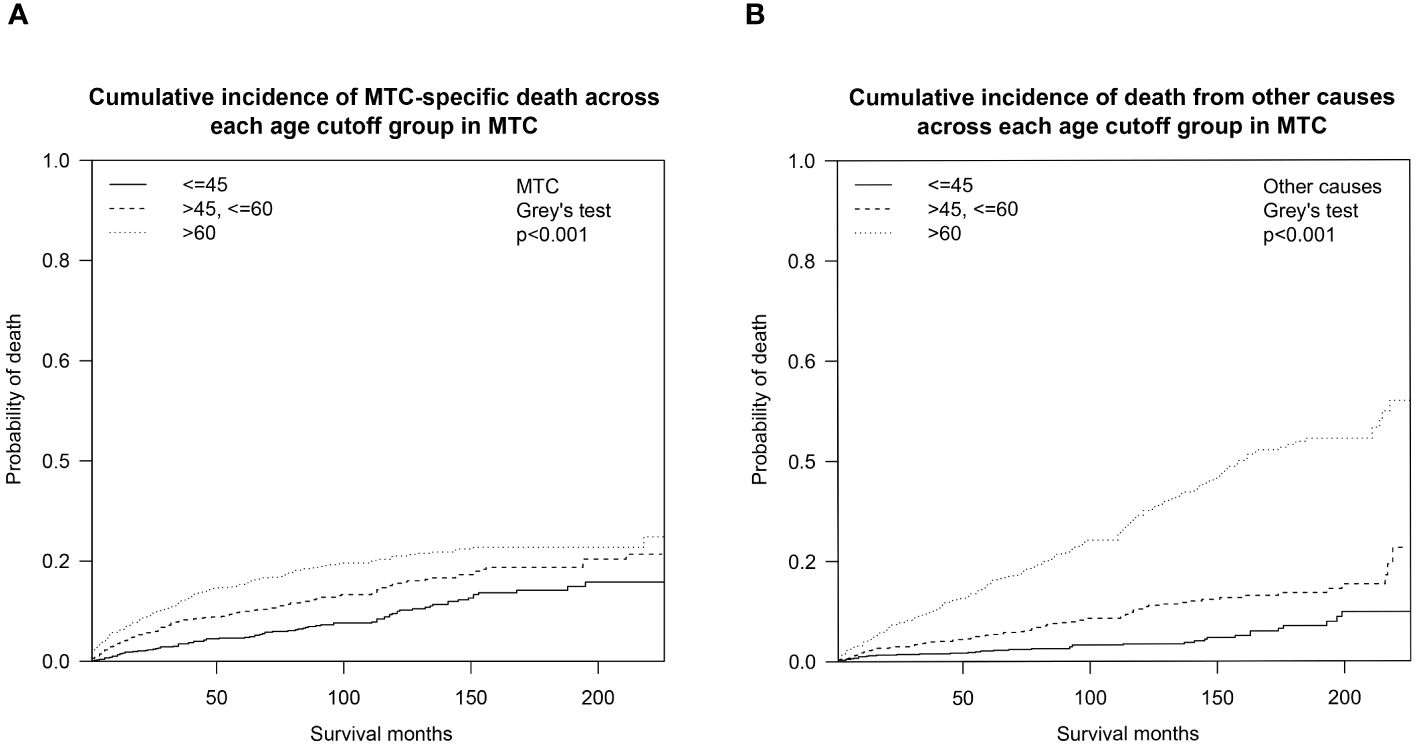
Figure 3 Cumulative incidence curves demonstrating competing risks of death for MTC across age cutoffs set at 45 and 60: (A) Cumulative incidence of MTC-specific deaths; (B) Cumulative incidence of non-MTC-specific deaths. MTC, medullary thyroid cancer.
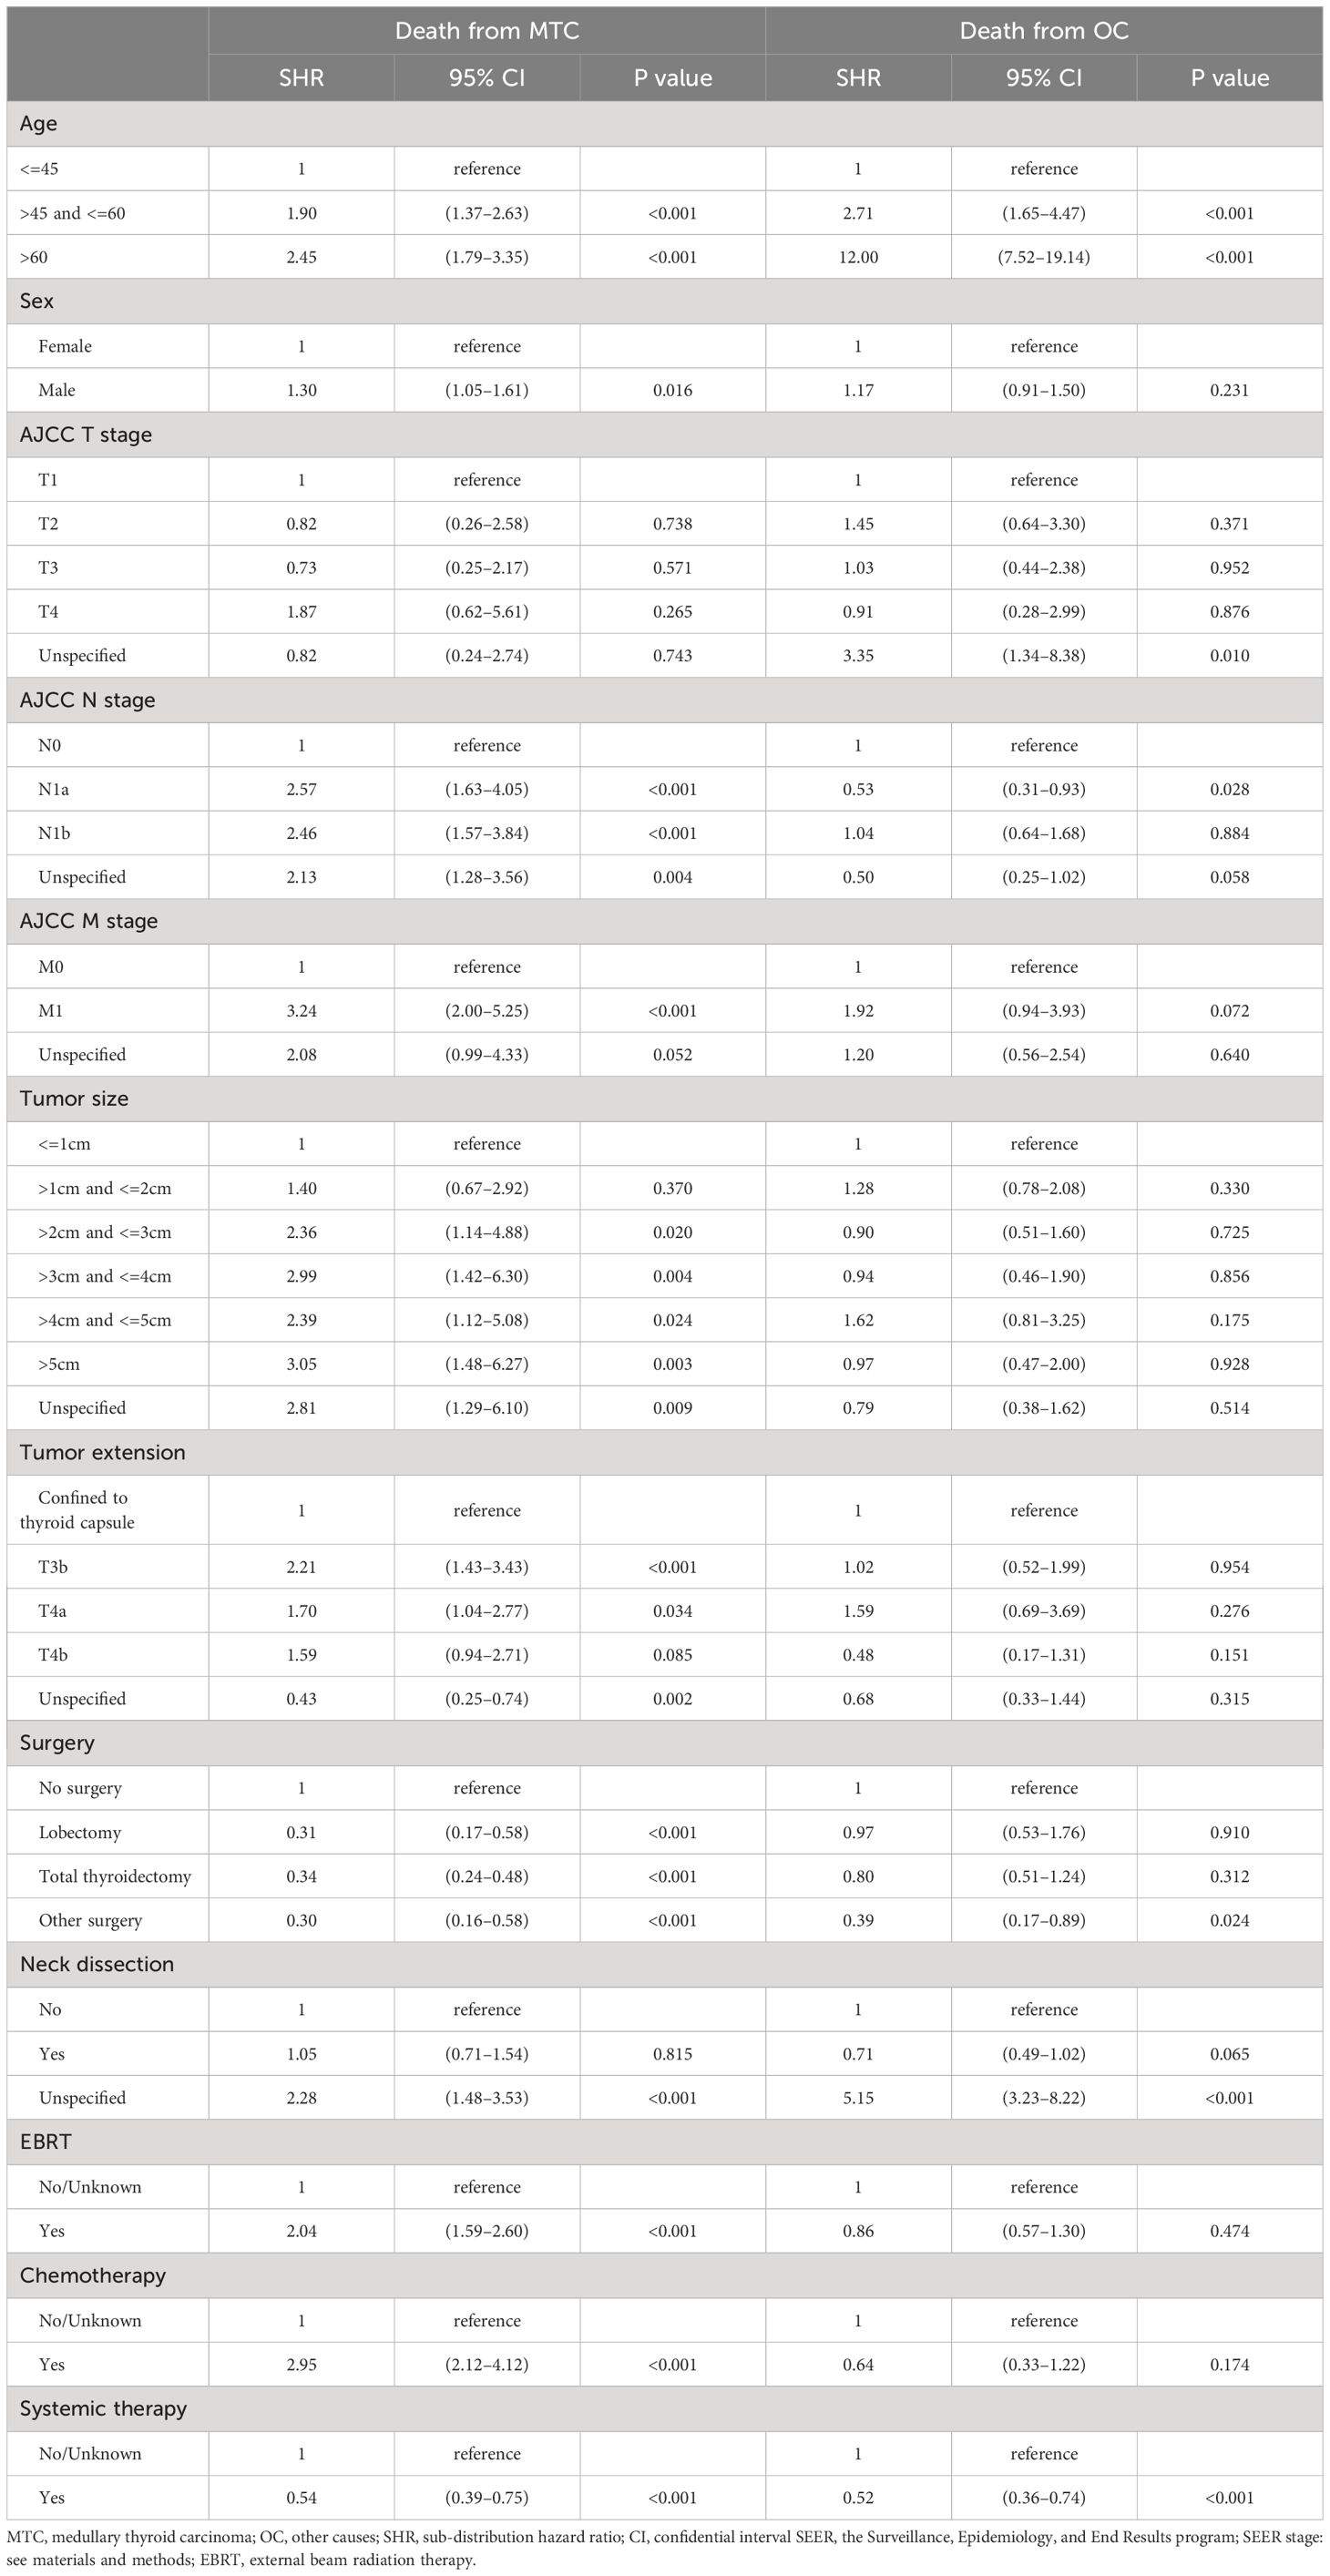
Table 3 Competing risk hazard regression analysis of survival for medullary thyroid carcinoma patients.
Results of the competing risk hazards regression analysis were estimated and shown in Table 4. Advanced age category (e.g. >45 and <=60 vs. <=45: MTC-specific SHR=1.90, 95% CI 1.37–2.63, P<0.001; non-MTC SHR=2.71, 95% CI 1.65–4.47, P<0.001), unknown surgery performed (vs. no surgery: MTC-specific SHR=0.30, 95% CI 0.16–0.58, P<0.001; non-MTC SHR=0.39, 95% CI 0.17–0.89, P=0.024), and lymph node dissection unspecified (vs. lymph node dissection not performed: MTC-specific SHR=2.28, 95% CI 1.48–3.53, P<0.001; non-MTC SHR=5.15, 95% CI 3.23–8.22, P<0.001) were the only factors that are associated with both a greater probability of death from other causes and death from MTC. The only variable that can reduce both MTC-specific and non-MTC death probability was systemic therapy (vs. systemic therapy not given or unknown: MTC-specific SHR=0.54, 95% CI 0.39–0.75, P<0.001; non-MTC SHR=0.52, 95% CI 0.36–0.74, P<0.001), which can be considered to be a combination of surgery and targeted therapy in the context of MTC treatment. A total thyroidectomy was the only way to reduce death risks from both MTC (vs. no surgery, SHR=0.42, 95% CI 0.25–0.71, P=0.001) and non-MTC causes (vs. no surgery, SHR=0.60, 95% CI 0.25–0.71, P=0.001). Male gender (vs. female: MTC-specific SHR=1.30, 95% CI 1.05–1.61, P=0.016), larger tumor size (e.g., >2cm and <=3cm vs. <=1cm: MTC-specific SHR=2.36, 95% CI 1.14–4.88, P=0.020), more advanced tumor extension (e.g., T3b vs. confined to thyroid capsule: MTC-specific SHR=2.21, 95% CI 1.43–3.43, P<0.001), higher N stage (e.g., N1b vs. N0: MTC-specific SHR=2.46, 95% CI 1.57–3.84, P<0.001), and higher M stage (e.g., M1 vs. M0: MTC-specific SHR=3.24, 95% CI 2.00–5.25, P<0.001) were solely correlated with worse MTC-specific mortality. In addition, surgery (e.g., total thyroidectomy vs. no surgery: MTC-specific SHR=0.34, 95% CI 0.24–0.48, P<0.001) was associated with decreased risk of MTC-specific death. External beam radiation therapy (EBRT vs. no EBRT: MTC-specific SHR=2.04, 95% CI 1.59–2.60, P<0.001) and chemotherapy (vs. no chemotherapy: MTC-specific SHR=2.95, 95% CI 2.12–4.12, P<0.001) seemed to correlate with an increased CSS death rate, but this is open to interpretation.
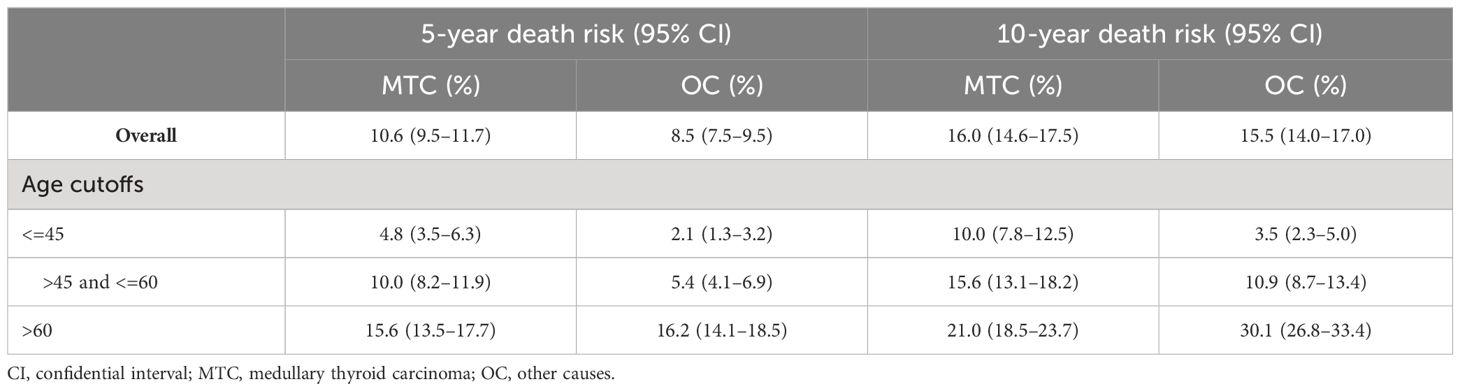
Table 4 Cumulative incidences of death of MTC patients across age cutoffs.
The prognosis of sporadic MTC patients depends on many known factors. Within the limited sample size of MTC patients, it has been reported that older age, higher-grade lesions, more advanced stage, longer calcitonin doubling time, and incomplete surgical resection convey worse survival outcomes (2, 19, 25–27). With exception, our investigations suggested that age at diagnosis and TNM stage were independent predictors of survival. The staging system of a malignancy was supposed to be the most dominant independent survival predictor by definition. However, the AJCC staging system of MTC failed to present a discriminant survival disparity [5-year OS: 95% in stage I, 91% in stage II, and 89% in stage III; 5-year CSS: 100% in stage I, 99% in stage II, and 97% in stage III (16)]. In light of these rational facts, an optimal age cutoff may be incorporated into developing a more reasonable MTC staging method. Our data offers evidence to guide attempts to improve the staging of MTC.
As the first step to assessing how age impacts OS probability, we fitted a smooth curve using a generalized additive model (GAM) in order to examine whether the relationship between age and overall death risk is linear or there is a threshold effect. Figure 1 clearly illustrated that the association between age at diagnosis and overall relative risk of death (Log RR) was linear (Likelihood ratio test, P<0.001; Wald test, P<0.001; log rank test, P<0.001). As a result of this discovery, we speculate that cumulative death risks should be smoothly partitioned into equal intervals based on certain age cutoffs. To illustrate this, we plotted five K-M survival curves (Figure 2A), representing age groups with cutoffs set at 45, 50, 55, and 60 years. Overlaps were observed between K-M curves representing patients aged 45–50, 50–55, and 55–60, which indicates that survival differences for these age subgroups are not statistically significant. Thus, it is statistically justified to merge all groups from age 45 through 60 years. This is shown in contrast to another set of K-M curves in Figure 2B. Accordingly, the study cohort was divided into 3 subgroups with 2 age cutoffs set at 45 and 60 years. In the competing risk analysis, we further calculated 5-year and 10-year cumulative death risks across the 3 age cutoff groups by 2 mutually exclusive causes of death (MTC-specific death and non-MTC-specific death). According to Table 3, each older age cutoff population has resulted in a roughly “5%” constant increase in MTC-specific death risks (5-year CSS comparison among <=45, >45 and <=60, >60 subgroups: 4.8% vs. 10.0% vs. 15.6%; 10-year CSS comparison among <=45, >45 and <=60, >60 subgroups: 10.0% vs. 15.6% vs. 21.0%) and an approximately “3 times” exponential increase in non-MTC-specific death risks (5-year non-CSS comparison among <=45, >45 and <=60, >60 subgroups: 2.1% vs. 5.4% vs. 16.2%; 10-year non-CSS comparison among <=45, >45 and <=60, >60 subgroups: 3.5% vs. 10.9% vs. 30.1%). Consequently, for MTC patients, age cutoffs set at 45 and 60 years yield a discriminant survival disparity.
Our results are generally in agreement with previously published articles showing an association indicating that advanced age has a detrimental effect on OS/CSS among MTC patients (28–31). Zeyad et al. have also reported that increased age is an independent predictor of CSS in patients with MTC (19). The study cohort was stratified by a different age (18–64, 65–79, and 80 years) subgroup aiming to make comparisons across varied ages in adults. Their main conclusion was statistically in agreement with ours, but the K-M curves for age subgroups did not provide an ideal way of discriminating survival rates. Another retrospective study led by Shekhar et al. focusing on MTC patients older than 45 years concluded that increasing age and advanced stage of presentation were associated with worse survival with HR 1.05 (p < 0.001) and HR 3.68 (p < 0.001), respectively (18). Patients were subdivided into 3 age groups (45–64, 65–84, and >=84) and demonstrated significant differences in survival times. However, survival curves were not provided in the main text. The most recent SEER database analysis focusing on stage I MTC patients reported (32) that the death risk of MTC patients rose sharply with increases in age beyond 60 years, which is consistent with our smooth curve fitting shown in Figure 1. However, the study included the stage I MTC population only and merely compared survival disparities between patients older and younger than 60 years.
We have also determined some other independent adverse outcome predictors listed by impact: older age; higher AJCC M stage; more invasive tumor extension; larger tumor size; more advanced AJCC N stage; black ethnicity; and male gender. All of these predictors were in agreement with previously reported findings (28, 29, 31). This order of predictor’s impact on survival prognosis was another piece of evidence supporting the conclusion that age should be included in forming a more comprehensive staging method for MTC.
As one can expect, surgery and systemic therapy were found to be the only factors that improved survival outcomes of MTC patients. On the contrary, EBRT and chemotherapy, which are well-known as effective therapeutic approaches for many malignancies (33), may have played a deleterious role in MTC treatment (see Tables 2, 4). This was in agreement with an analysis of the SEER data from 1998 to 2004 (34), indicating that adjuvant EBRT showed no overall survival benefit in patients with MTC and positive lymph nodes. The 2015 revised ATA management for MTC (2) recommended that the potential benefits must be weighed against the acute and chronic toxicity associated with the therapy (grade C recommendation). Traditional chemotherapy for MTC management has not been mentioned in commonly used guidelines (2, 35, 36). Alternatively, the analogy for the association between EBRT/chemotherapy and MTC treatment could be interpreted as “fighting a losing battle.” That is, MTC patients who were treated with adjuvant EBRT or chemotherapy were people with late-stage disease with complicated recurrences or distant metastases, and were destined for short survival with or without treatment of any kind.
Our study has several highlights. Firstly, to our knowledge, this study represents the largest and most updated cohort of patients with pathologically confirmed MTC. Secondly, our study demonstrates in detail the precise relationship between age and survival outcome, and the process of defining the age cutoffs. Moreover, public databases such as SEER provide more generalizable and representative data than single centers. Lastly, the competing risk model considers other competing events, providing a deeper level of understanding of the impact of age on differential survival.
Nevertheless, there are also several limitations to the current study. We acknowledge that the MTC patient population is genetically diverse, with approximately 75% of cases being sporadic and the remaining 25% associated with RET mutations. These familial cases, which are linked to multiple endocrine neoplasia type 2 (MEN2), potentially exhibit unique survival outcomes due to access to RET-targeted therapies and the specific pathophysiology of MEN2. However, RET mutation status, CEA, calcitonin levels, and doubling time were not recorded in the SEER database. Besides, the “systemic therapy” described in the database did not provide sufficient details about the targeting regimen and the sequence of surgery and targeted therapy.
Despite these limitations, we have conducted a large-scale SEER-based study using a competing risk model to evaluate the impact of age on survival outcomes of MTC patients. A future prospective, multi-center study is recommended to validate these findings, which could contribute to the development of a more comprehensive staging system for Medullary Thyroid Carcinoma (MTC).
The datasets presented in this study can be found in online repositories. The names of the repository/repositories and accession number(s) can be found below: https://seer.cancer.gov/.
Ethical approval was not required for the study involving humans in accordance with the local legislation and institutional requirements. Written informed consent to participate in this study was not required from the participants or the participants’ legal guardians/next of kin in accordance with the national legislation and the institutional requirements.
KZ: Conceptualization, Formal analysis, Investigation, Methodology, Software, Validation, Visualization, Writing – original draft, Writing – review & editing. XW: Formal analysis, Writing – original draft. TW: Supervision, Writing – review & editing. ZL: Conceptualization, Supervision, Writing – review & editing. JZ: Writing – review & editing. Y-WC: Conceptualization, Data curation, Supervision, Validation, Writing – review & editing.
The author(s) declare that no financial support was received for the research, authorship, and/or publication of this article.
We are very grateful to the staff in Surveillance, Epidemiology, and End Results (SEER) Program for their kind work in data collection and delivery.
The authors declare that the research was conducted in the absence of any commercial or financial relationships that could be construed as a potential conflict of interest.
All claims expressed in this article are solely those of the authors and do not necessarily represent those of their affiliated organizations, or those of the publisher, the editors and the reviewers. Any product that may be evaluated in this article, or claim that may be made by its manufacturer, is not guaranteed or endorsed by the publisher.
1. American Thyroid Association Guidelines Task F, Kloos RT, Eng C, Evans DB, Francis GL, Gagel RF, et al. Medullary thyroid cancer: management guidelines of the American Thyroid Association. Thyroid. (2009) 19:565–612. doi: 10.1089/thy.2008.0403
2. Wells SA Jr., Asa SL, Dralle H, Elisei R, Evans DB, Gagel RF, et al. Revised American Thyroid Association guidelines for the management of medullary thyroid carcinoma. Thyroid. (2015) 25:567–610. doi: 10.1089/thy.2014.0335
3. Williams ED. Histogenesis of medullary carcinoma of the thyroid. J Clin Pathol. (1966) 19:114–8. doi: 10.1136/jcp.19.2.114
4. Pelizzo MR, Boschin IM, Bernante P, Toniato A, Piotto A, Pagetta C, et al. Natural history, diagnosis, treatment and outcome of medullary thyroid cancer: 37 years experience on 157 patients. Eur J Surg Oncol. (2007) 33:493–7. doi: 10.1016/j.ejso.2006.10.021
5. Baloch ZW, LiVolsi VA. Prognostic factors in well-differentiated follicular-derived carcinoma and medullary thyroid carcinoma. Thyroid. (2001) 11:637–45. doi: 10.1089/105072501750362709
6. Paszko Z, Sromek M, Czetwertynska M, Skasko E, Czapczak D, Wisniewska A, et al. The occurrence and the type of germline mutations in the RET gene in patients with medullary thyroid carcinoma and their unaffected kindred's from Central Poland. Cancer Invest. (2007) 25:742–9. doi: 10.1080/07357900701518735
7. Bergant D, Hocevar M, Besic N, Glavac D, Korosec B, Caserman S. Hereditary medullary thyroid cancer in Slovenia–genotype-phenotype correlations. Wien Klin Wochenschr. (2006) 118:411–6. doi: 10.1007/s00508-006-0636-8
8. Donis-Keller H, Dou S, Chi D, Carlson KM, Toshima K, Lairmore TC, et al. Mutations in the RET proto-oncogene are associated with MEN 2A and FMTC. Hum Mol Genet. (1993) 2:851–6. doi: 10.1093/hmg/2.7.851
9. Mulligan LM, Kwok JB, Healey CS, Elsdon MJ, Eng C, Gardner E, et al. Germ-line mutations of the RET proto-oncogene in multiple endocrine neoplasia type 2A. Nature. (1993) 363:458–60. doi: 10.1038/363458a0
10. Carlson KM, Dou S, Chi D, Scavarda N, Toshima K, Jackson CE, et al. Single missense mutation in the tyrosine kinase catalytic domain of the RET protooncogene is associated with multiple endocrine neoplasia type 2B. Proc Natl Acad Sci U S A. (1994) 91:1579–83. doi: 10.1073/pnas.91.4.1579
11. Hofstra RM, Landsvater RM, Ceccherini I, Stulp RP, Stelwagen T, Luo Y, et al. A mutation in the RET proto-oncogene associated with multiple endocrine neoplasia type 2B and sporadic medullary thyroid carcinoma. Nature. (1994) 367:375–6. doi: 10.1038/367375a0
12. Eng C, Smith DP, Mulligan LM, Nagai MA, Healey CS, Ponder MA, et al. Point mutation within the tyrosine kinase domain of the RET proto-oncogene in multiple endocrine neoplasia type 2B and related sporadic tumours. Hum Mol Genet. (1994) 3:237–41. doi: 10.1093/hmg/3.2.237
13. Marsh DJ, Learoyd DL, Andrew SD, Krishnan L, Pojer R, Richardson AL, et al. Somatic mutations in the RET proto-oncogene in sporadic medullary thyroid carcinoma. Clin Endocrinol (Oxf). (1996) 44:249–57. doi: 10.1046/j.1365-2265.1996.681503.x
14. SEER Cancer Statistics Facts. Thyroid cancer. National Cancer Institute: Surveillance, Epidemiology, and End Results Program. Available online at: https://seer.cancer.gov/archive/csr/1975_2017/ (Accessed June 13 2022).
15. Pacini F, Castagna MG, Brilli L, Pentheroudakis G, Group EGW. Thyroid cancer: ESMO Clinical Practice Guidelines for diagnosis, treatment and follow-up. Ann Oncol. (2010) 21 Suppl 5:v214–9. doi: 10.1093/annonc/mdq190
16. Adam MA, Thomas S, Roman SA, Hyslop T, Sosa JA. Rethinking the current American joint committee on cancer TNM staging system for medullary thyroid cancer. JAMA Surg. (2017) 152:869–76. doi: 10.1001/jamasurg.2017.1665
17. Kebebew E, Greenspan FS, Clark OH, Woeber KA, Grunwell J. Extent of disease and practice patterns for medullary thyroid cancer. J Am Coll Surg. (2005) 200:890–6. doi: 10.1016/j.jamcollsurg.2004.12.011
18. Gogna S, Goldberg M, Samson D, Gachabayov M, Felsenreich DM, Azim A, et al. Medullary thyroid cancer in patients older than 45-epidemiologic trends and predictors of survival. Cancers (Basel). (2020) 12. doi: 10.3390/cancers12113124
19. Sahli ZT, Canner JK, Zeiger MA, Mathur A. Association between age and disease specific mortality in medullary thyroid cancer. Am J Surg. (2021) 221:478–84. doi: 10.1016/j.amjsurg.2020.09.025
20. Haugen BR, Alexander EK, Bible KC, Doherty GM, Mandel SJ, Nikiforov YE, et al. 2015 American thyroid association management guidelines for adult patients with thyroid nodules and differentiated thyroid cancer: the American thyroid association guidelines task force on thyroid nodules and differentiated thyroid cancer. Thyroid. (2016) 26:1–133. doi: 10.1089/thy.2015.0020
21. Overview of the SEER program-incidence-SEER research plus data (2021). Available online at: https://seer.cancer.gov/data-software/documentation/seerstat/nov2020/.
22. SEER combined stage: a collective cancer staging schema using Collaborative Stage (CS) and TNM classfication and applicable Site-Specific Factors for each site of tumor. Available online at: https://seer.cancer.gov/seerstat/variables/seer/ajcc-stage/seer-combined.html.
23. Fine JP, Gray RJ. A proportional hazards model for the subdistribution of a competing risk. J Am Stat Assoc. (1999) 94:496–509. doi: 10.1080/01621459.1999.10474144
24. Amin MB, Greene FL, Edge SB, Compton CC, Gershenwald JE, Brookland RK, et al. The Eighth Edition AJCC Cancer Staging Manual: Continuing to build a bridge from a population-based to a more "personalized" approach to cancer staging. CA Cancer J Clin. (2017) 67:93–9. doi: 10.3322/caac.21388
25. Barbet J, Campion L, Kraeber-Bodere F, Chatal JF, Group GTES. Prognostic impact of serum calcitonin and carcinoembryonic antigen doubling-times in patients with medullary thyroid carcinoma. J Clin Endocrinol Metab. (2005) 90:6077–84. doi: 10.1210/jc.2005-0044
26. Kebebew E, Ituarte PH, Siperstein AE, Duh QY, Clark OH. Medullary thyroid carcinoma: clinical characteristics, treatment, prognostic factors, and a comparison of staging systems. Cancer. (2000) 88:1139–48. doi: 10.1002/(ISSN)1097-0142
27. Modigliani E, Cohen R, Campos JM, Conte-Devolx B, Maes B, Boneu A, et al. Prognostic factors for survival and for biochemical cure in medullary thyroid carcinoma: results in 899 patients. The GETC Study Group. Groupe d'etude des tumeurs a calcitonine. Clin Endocrinol (Oxf). (1998) 48:265–73. doi: 10.1046/j.1365-2265.1998.00392.x
28. Ho AS, Wang L, Palmer FL, Yu C, Toset A, Patel S, et al. Postoperative nomogram for predicting cancer-specific mortality in medullary thyroid cancer. Ann Surg Oncol. (2015) 22:2700–6. doi: 10.1245/s10434-014-4208-2
29. Qu N, Shi RL, Luo TX, Wang YL, Li DS, Wang Y, et al. Prognostic significance and optimal cutoff of age in medullary thyroid cancer. Oncotarget. (2016) 7:15937–47. doi: 10.18632/oncotarget.v7i13
30. Esfandiari NH, Hughes DT, Yin H, Banerjee M, Haymart MR. The effect of extent of surgery and number of lymph node metastases on overall survival in patients with medullary thyroid cancer. J Clin Endocrinol Metab. (2014) 99:448–54. doi: 10.1210/jc.2013-2942
31. Hyer SL, Vini L, A'Hern R, Harmer C. Medullary thyroid cancer: multivariate analysis of prognostic factors influencing survival. Eur J Surg Oncol. (2000) 26:686–90. doi: 10.1053/ejso.2000.0981
32. Yang B, Niu G, Li X, Ma F, Ma Y, Hu S. Lobectomy may be more appropriate for patients with early-stage medullary thyroid cancer older than 60 years old. Front Endocrinol (Lausanne). (2022) 13:1015319. doi: 10.3389/fendo.2022.1015319
33. Johnstone RW, Ruefli AA, Lowe SW. Apoptosis: a link between cancer genetics and chemotherapy. Cell. (2002) 108:153–64. doi: 10.1016/S0092-8674(02)00625-6
34. Martinez SR, Beal SH, Chen A, Chen SL, Schneider PD. Adjuvant external beam radiation for medullary thyroid carcinoma. J Surg Oncol. (2010) 102:175–8. doi: 10.1002/jso.21557
35. Haddad RI, Nasr C, Bischoff L, Busaidy NL, Byrd D, Callender G, et al. NCCN guidelines insights: thyroid carcinoma, version 2.2018. J Natl Compr Canc Netw. (2018) 16:1429–40. doi: 10.6004/jnccn.2018.0089
Keywords: medullary thyroid cancer, survival analysis, age cutoffs, well-defined survival disparity, outcome predictor
Citation: Zhang K, Wang X, Wei T, Li Z, Zhu J and Chen Y-W (2024) Well-defined survival outcome disparity across age cutoffs at 45 and 60 for medullary thyroid carcinoma: a long-term retrospective cohort study of 3601 patients. Front. Endocrinol. 15:1393904. doi: 10.3389/fendo.2024.1393904
Received: 29 February 2024; Accepted: 03 June 2024;
Published: 14 June 2024.
Edited by:
Yoshiyuki Ban, Teikyo University Chiba Medical Center, JapanReviewed by:
George Simeakis, 401 General Military Hospital of Athens, GreeceCopyright © 2024 Zhang, Wang, Wei, Li, Zhu and Chen. This is an open-access article distributed under the terms of the Creative Commons Attribution License (CC BY). The use, distribution or reproduction in other forums is permitted, provided the original author(s) and the copyright owner(s) are credited and that the original publication in this journal is cited, in accordance with accepted academic practice. No use, distribution or reproduction is permitted which does not comply with these terms.
*Correspondence: Ya-Wen Chen, eWF3ZW4uY2hlbkBtc3NtLmVkdQ==; Kun Zhang, emhhbmdrdW41NjE2QHdjaHNjdS5lZHUuY24=
Disclaimer: All claims expressed in this article are solely those of the authors and do not necessarily represent those of their affiliated organizations, or those of the publisher, the editors and the reviewers. Any product that may be evaluated in this article or claim that may be made by its manufacturer is not guaranteed or endorsed by the publisher.
Research integrity at Frontiers
Learn more about the work of our research integrity team to safeguard the quality of each article we publish.