 Caibiao Wei1†Huaying Ai2†Dan Mo3†Peidong Wang1†Liling Wei4Zhimin Liu1Peizhang Li1Taijun Huang1*
 Miaofeng Liu1*
- 1Department of Clinical Laboratory, Guangxi Medical University Cancer Hospital, Nanning, China
- 2Department of Injection Room, The People’s Hospital of Yingtan, Yingtan, Jiangxi, China
- 3Department of Breast, Guangxi Zhuang Autonomous Region Maternal and Child Health Care Hospital, Nanning, China
- 4Department of Anesthesiology, First Affiliated Hospital of Guangxi Medical University, Nanning, China
Background: We aim to develop a new prognostic model that incorporates inflammation, nutritional parameters and clinical-pathological features to predict overall survival (OS) and disease free survival (DFS) of breast cancer (BC) patients.
Methods: The study included clinicopathological and follow-up data from a total of 2857 BC patients between 2013 and 2021. Data were randomly divided into two cohorts: training (n=2001) and validation (n=856) cohorts. A nomogram was established based on the results of a multivariate Cox regression analysis from the training cohorts. The predictive accuracy and discriminative ability of the nomogram were evaluated by the concordance index (C-index) and calibration curve. Furthermore, decision curve analysis (DCA) was performed to assess the clinical value of the nomogram.
Results: A nomogram was developed for BC, incorporating lymphocyte, platelet count, hemoglobin levels, albumin-to-globulin ratio, prealbumin level and other key variables: subtype and TNM staging. In the prediction of OS and DFS, the concordance index (C-index) of the nomogram is statistically greater than the C-index values obtained using TNM staging alone. Moreover, the time-dependent AUC, exceeding the threshold of 0.7, demonstrated the nomogram’s satisfactory discriminative performance over different periods. DCA revealed that the nomogram offered a greater overall net benefit than the TNM staging system.
Conclusion: The nomogram incorporating inflammation, nutritional and clinicopathological variables exhibited excellent discrimination. This nomogram is a promising instrument for predicting outcomes and defining personalized treatment strategies for patients with BC.
1 Introduction
Breast cancer (BC) is the most frequently diagnosed cancer and is associated with one of the highest mortality rates among female malignant tumors (1). It is estimated that 287,000 new cases of BC will be diagnosed in 2023 (2). The current treatment modalities for BC encompass surgery, chemotherapy, hormonal therapy, and radiation therapy (3, 4). Despite remarkable advancements in early detection and therapeutic approaches, BC patients have poor prognoses (5, 6).
Although the traditional TNM staging system of the American Joint Committee on Cancer (AJCC) is extensively used for predicting prognosis and guiding clinical management, its ability to accurately identify patients at high risk of cancer-related mortality may be limited (7, 8). This limitation arises from the inherent heterogeneity observed in BC, where patients sharing the same stage can exhibit diverse clinical outcomes (9, 10). Patients with BC at the same stage may have different outcomes due to the heterogeneity of the disease (11). Consequently, there exists a critical need to identify reliable and easily applicable predictive models that can complement the TNM staging system and offer more precise predictions of individual patient outcomes.
Extensive Research consistently demonstrates the link between systemic inflammation and poor prognosis in cancer patients (12, 13). Chronic inflammation drives tumor progression, angiogenesis, and metastasis while suppressing the immune response (14, 15). In parallel, the significance of nutritional status in cancer patients’ survival has been widely recognized (16, 17). Cancer-associated malnutrition weakens immune function and triggers inflammation, worsening treatment outcomes (18). These findings underscore the importance of considering both systemic inflammation and nutritional status in the management and prognosis of cancer patients.
Recent studies have shed light on the prevalence of cancer-associated systemic inflammation and malnutrition in the majority of patients with malignancy, including those with BC (14, 19, 20). These factors have been closely linked to tumor progression and have been shown to have a detrimental impact on patient’s clinical outcomes (12, 21, 22). Various inflammation-based and nutritional markers, such as neutrophil (NEU), lymphocyte (LYM), platelet count (PLT), serum ferritin (SF) and lymphocyte-to-monocyte ratio (LMR), as well as prognostic nutritional index hemoglobin (HGB), albumin (ALB), transferrin (TRF), albumin to globulin (AGR), and prealbumin (PA), have been identified as promising clinical prognostic predictors for various cancers due to their simplicity and cost-effectiveness (23–29). However, it is worth noting that many nomogram studies in the literature often fail to consider the assessment of hematological markers encompassing both inflammation and nutritional biomarkers in conjunction with tumor characteristics (30–32). There are two studies of prognostic scoring systems for patients with BC, published by Hua X, et al. (33) and Jiang C, et al. (34). The scoring system developed from those studies provides useful tools for clinicians and researchers to predict the prognostic value of BC patients. However, two of the studies simply classified patients as early-stage or underwent neoadjuvant chemotherapy BC patients, their clinical application is restricted to a subset of patients, not all females with BC treated at their center. Meanwhile, both were developed using limited sample sizes. Furthermore, these models have not received any independent validation, most likely because of the small sample size. In addition, most current studies have primarily focused on the combination of one or a few inflammatory and nutritional parameters with clinicopathological factors, without incorporating more accurate variables such as TNM staging, subtype, and tumor size (35–37). These factors are of great importance in the treatment of BC. Therefore, the assessment of hematological markers including inflammation and nutritional biomarkers, could be of great importance in revealing the survival of patients with BC, which most nomogram studies did not mention.
In this study, our objective was to develop an inexpensive, trustworthy, and more accurate prognostic model by simultaneously combining inflammation and nutritional biomarkers collected from a substantial cohort of nearly 3000 patients diagnosed with BC. By incorporating these diverse factors, we aimed to enhance the accuracy and reliability of prognosis analysis in BC patients.
2 Materials and methods
2.1 Study population
This study included a total of 2857 patients who were diagnosed with BC at Guangxi Medical University Cancer Hospital between 2013 and 2021. Inclusion criteria for the study required: (1) confirmation of the pathological diagnosis of BC; (2) no preoperative chemotherapy or other radiation therapy; (3) absence of acute infections or other inflammatory conditions in the two weeks preceding surgery; (4) availability of complete follow-up information and clinical data; (5) availability of peripheral blood hematological markers before treatment. Patients were removed from the study if any of the following conditions were met: (1) receipt of relevant antitumor therapy (e.g., chemotherapy, radiotherapy) (n=889); (2) lack of clear and definite pathological diagnosis and medical history information (n=96); (3) presence of other malignant tumors except for BC or distant metastasis(n=63); (4) diagnosis of autoimmune diseases or chronic inflammatory conditions (n=79); (5) relapse or de novo BC(n=35). All included patients were divided into two groups, with a ratio of 7:3, resulting in a training cohort of 2001 patients and a validation cohort of 856 patients. Figure 1 depicts the comprehensive workflow for patient selection.
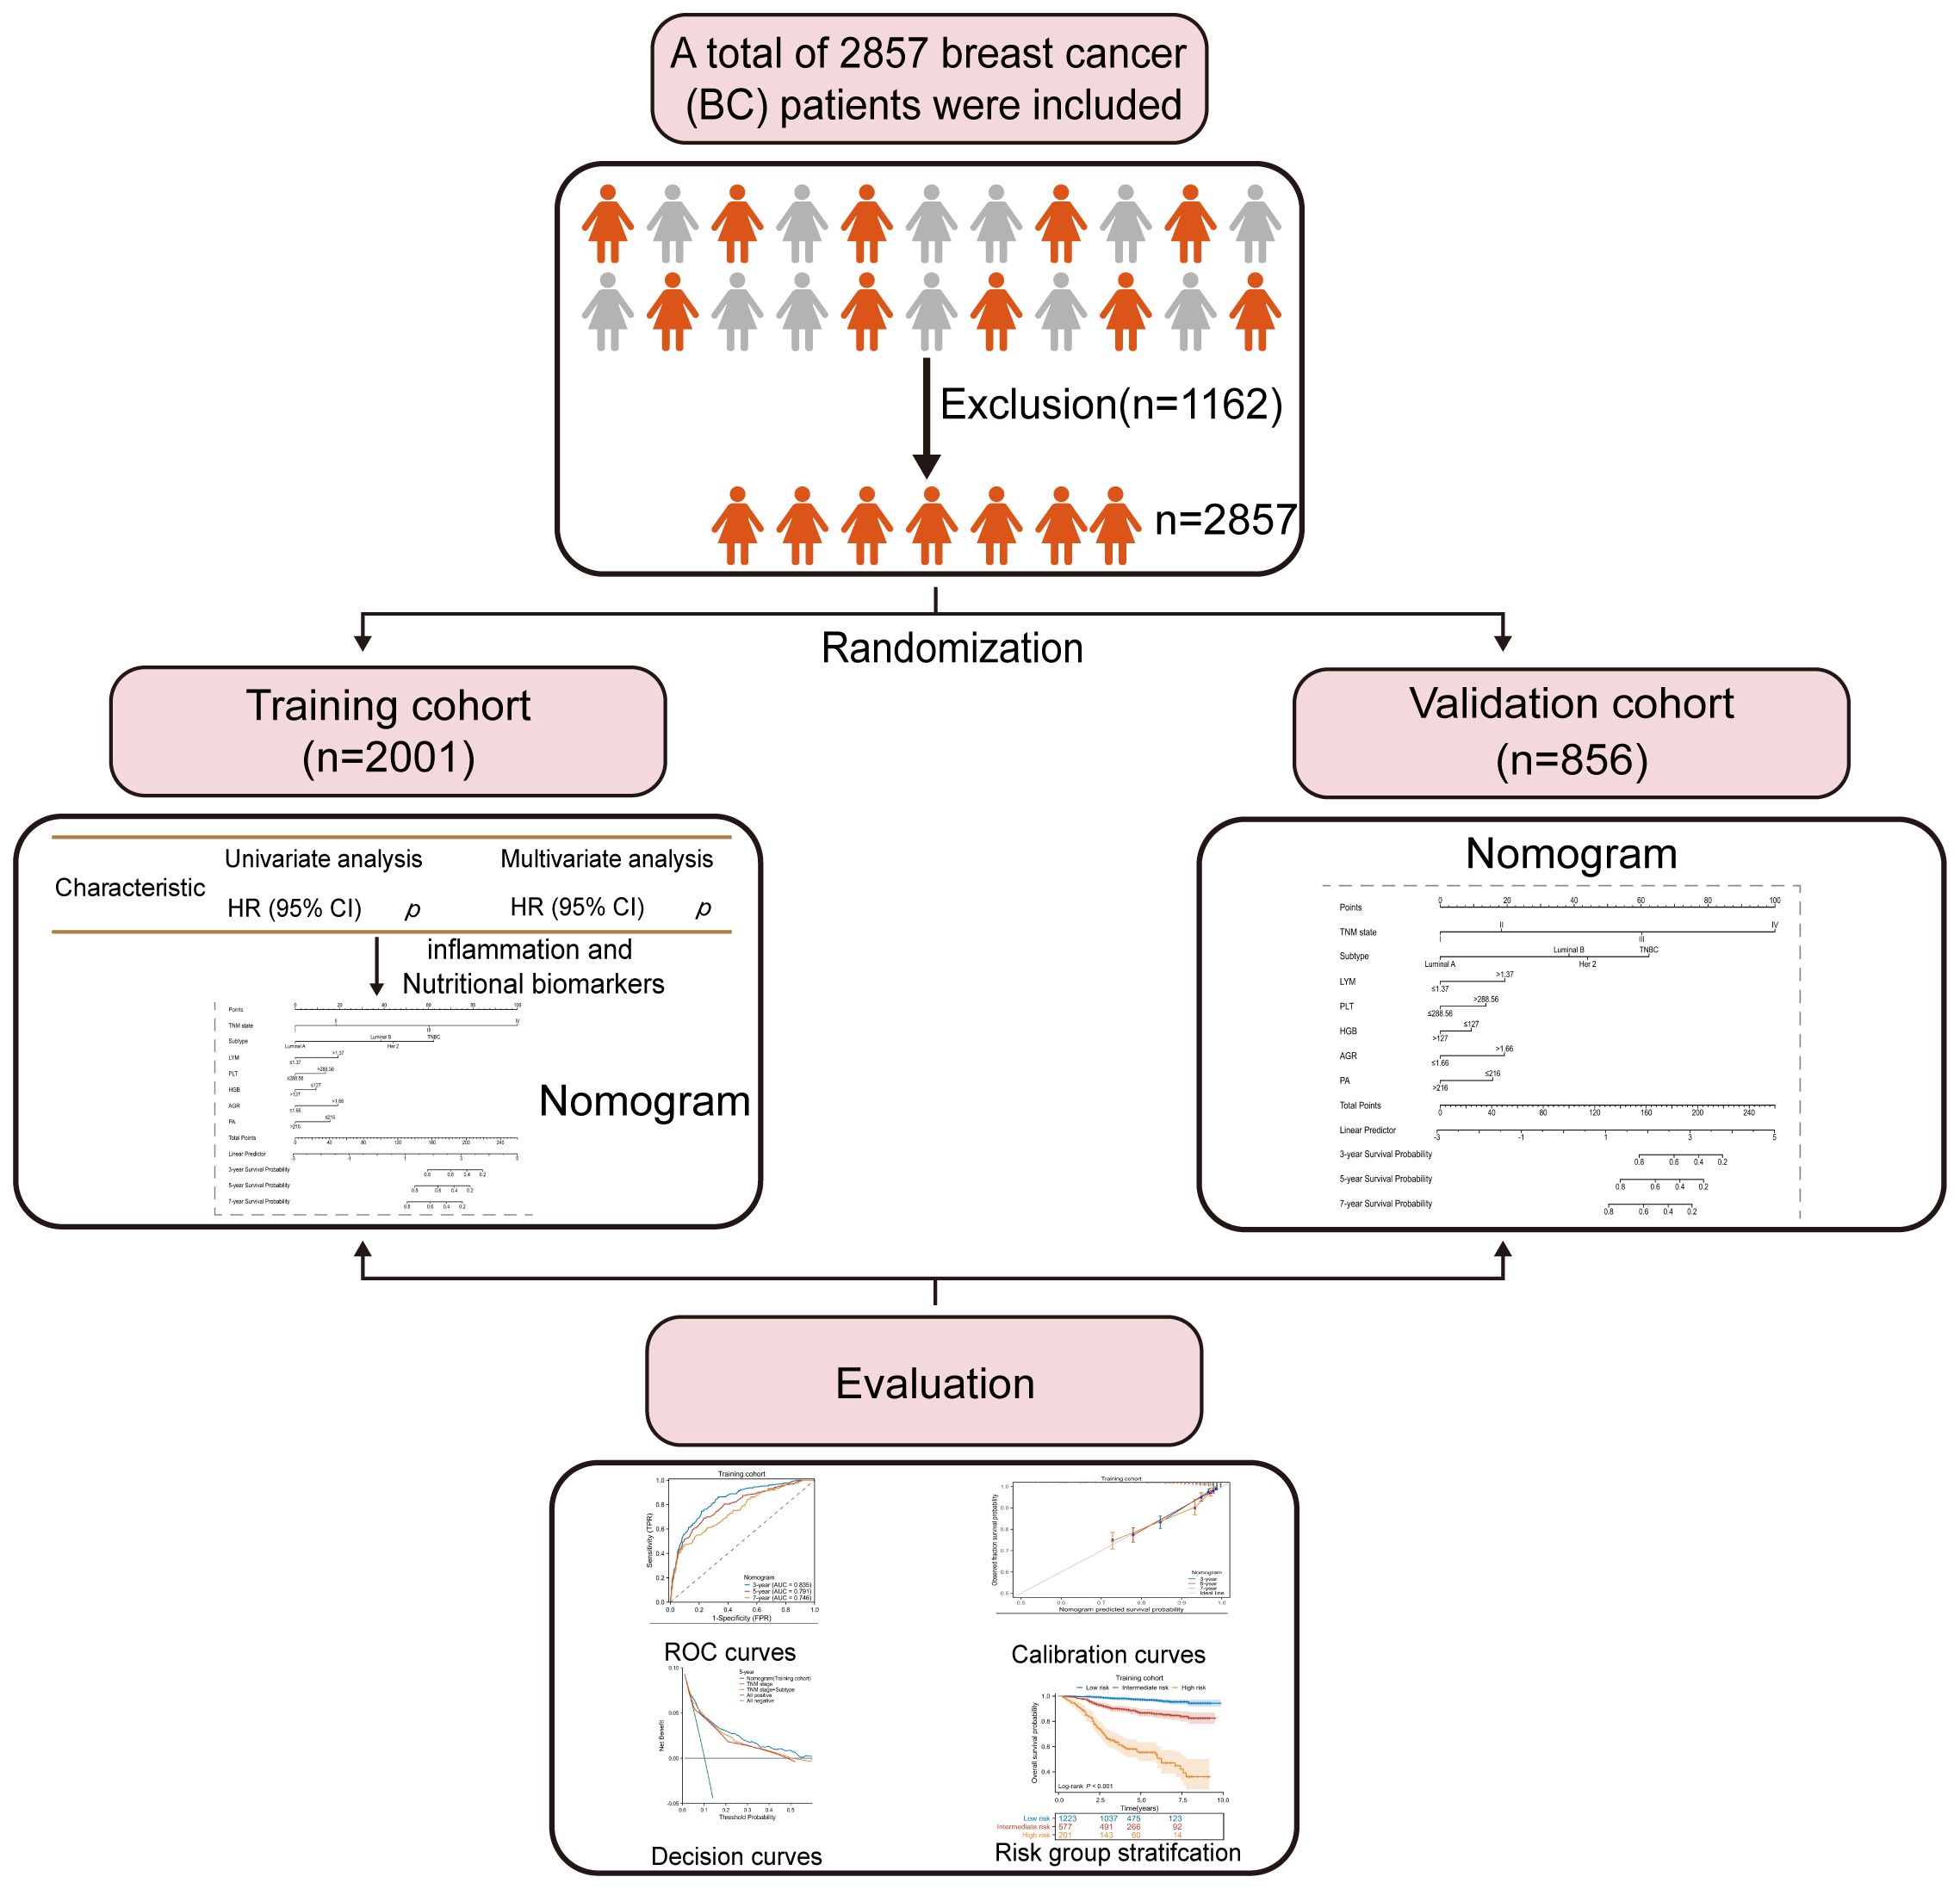
Figure 1 Flow diagram of enrolled participants and evaluation process.
2.2 Ethics approval and consent to participate
Our study was approved by the Guangxi Medical University Cancer Hospital Ethical Review Committee (Approve No.LW2023087), Guangxi Zhuang Autonomous Region Maternal and Child Health Care Hospital Ethical Review Committee (Approve No. 6–1, 2024) and conducted following the ethical principles outlined in the Helsinki Declaration of 1964 and its subsequent amendments or other ethical standards with equivalent requirements. To ensure patient confidentiality, the identities of the individuals included in this study were anonymized using computer-generated ID numbers. On admission, all patients provided written consent for their anonymized medical data to be analyzed and published for research purposes.
2.3 Data acquisition
In this study, we collected a comprehensive set of clinicopathological, demographic, and laboratory data from 2857 BC patients. Clinicopathological data included the patient’s age, tumor size, histologic type, grade, subtype, and clinical TNM stage based on the most recent AJCC staging system (8th edition) (38), as well as outcomes such as mortality. Pre-treatment inflammation and nutritional biomarkers included the levels of NEU, LYM, MON, PLT, SF, HGB, ALB, TRF, TP, AGR and PA. To facilitate analysis, we also transformed certain clinicopathological characteristics into categorical variables. Furthermore, we calculated several inflammation-related ratios, such as NLR, PLR, and LMR, based on their known associations with the outcomes of interest.
2.4 Patient follow-up
We conducted follow-up assessments using a combination of phone interviews and an outpatient surveillance system. The median follow-up time was 54 months (range: 52–55 months). Our primary endpoint of interest was overall survival (OS), which was defined as the duration between the date of surgery and the occurrence of death from any cause or the date of the last follow-up, whichever came first. The period of disease-free survival (DFS) was measured from the date of diagnosis until the occurrence of any recurrence or death. The follow-up period for our study extended until December 2022, or until the date of a patient’s death if it transpired earlier.
2.5 Nomogram development and validation
Receiver operating characteristic (ROC) curves were employed to determine the optimal cutoff points for plasma/serum biomarkers using MedCalc software. Statistical analysis was performed using R software version 4.2.1 and SPSS 23.0. The relevance of clinicopathologic characteristics between the training and validation cohorts was analyzed using the chi-square test or Fisher’s exact test. Survival curves were plotted using the Kaplan-Meier method, and differences between groups were assessed using the log-rank test. Univariate and multivariate Cox regression analyses were conducted to identify factors influencing OS. Hazard ratios (HRs) and 95% confidence intervals (CIs) were used to assess the association between patients’ indices and prognosis. In the multivariate Cox regression analysis, only variables with a significance level of p < 0.05 in the univariate analysis were included.
A nomogram was constructed using the training cohort of 2001 BC patients based on significant predictors identified through multivariable Cox regression analysis, utilizing R software with the survival and rms packages. The performance of the nomograms was evaluated using the concordance index (C-index), time-dependent receiver operating characteristic (ROC) curve, and the area under the curve (AUC). The accuracy of the model was assessed using calibration plots to compare the predicted and actual OS and DFS. Additionally, decision curve analysis (DCA) was conducted to determine the clinical usefulness of the nomograms by quantifying the net benefits at different threshold probabilities. Results with p < 0.05 were considered statistically significant.
2.6 External validation of the nomogram
We further validated the feasibility of our model by using BC patients from the Guangxi Zhuang Autonomous Region Maternal and Child Health Care Hospital as an external validation cohort. For external validation of the model, we utilized TNM stage, subtype, LYM, PLT, HGB, AGR, and PA indicators, along with their respective cutoff values, to construct the model in independent cohorts, aiming to assess the robustness and applicability of the model in this study.
3 Results
3.1 Clinicopathologic characteristics
A total of 2001 patients from the training cohort and 856 patients from the validation cohort were included in our analyses. The demographic and clinical characteristics of the patients are summarized in Table 1. No significant differences were observed between the primary and validation cohorts, except for age, LYM, LMR, ALB level, and TRF level. The median follow-up times for the primary and validation cohorts were 55.0 months (range: 53.0 to 57.0 months) and 54.0 months (range:52.0 to 56.0 months), respectively.
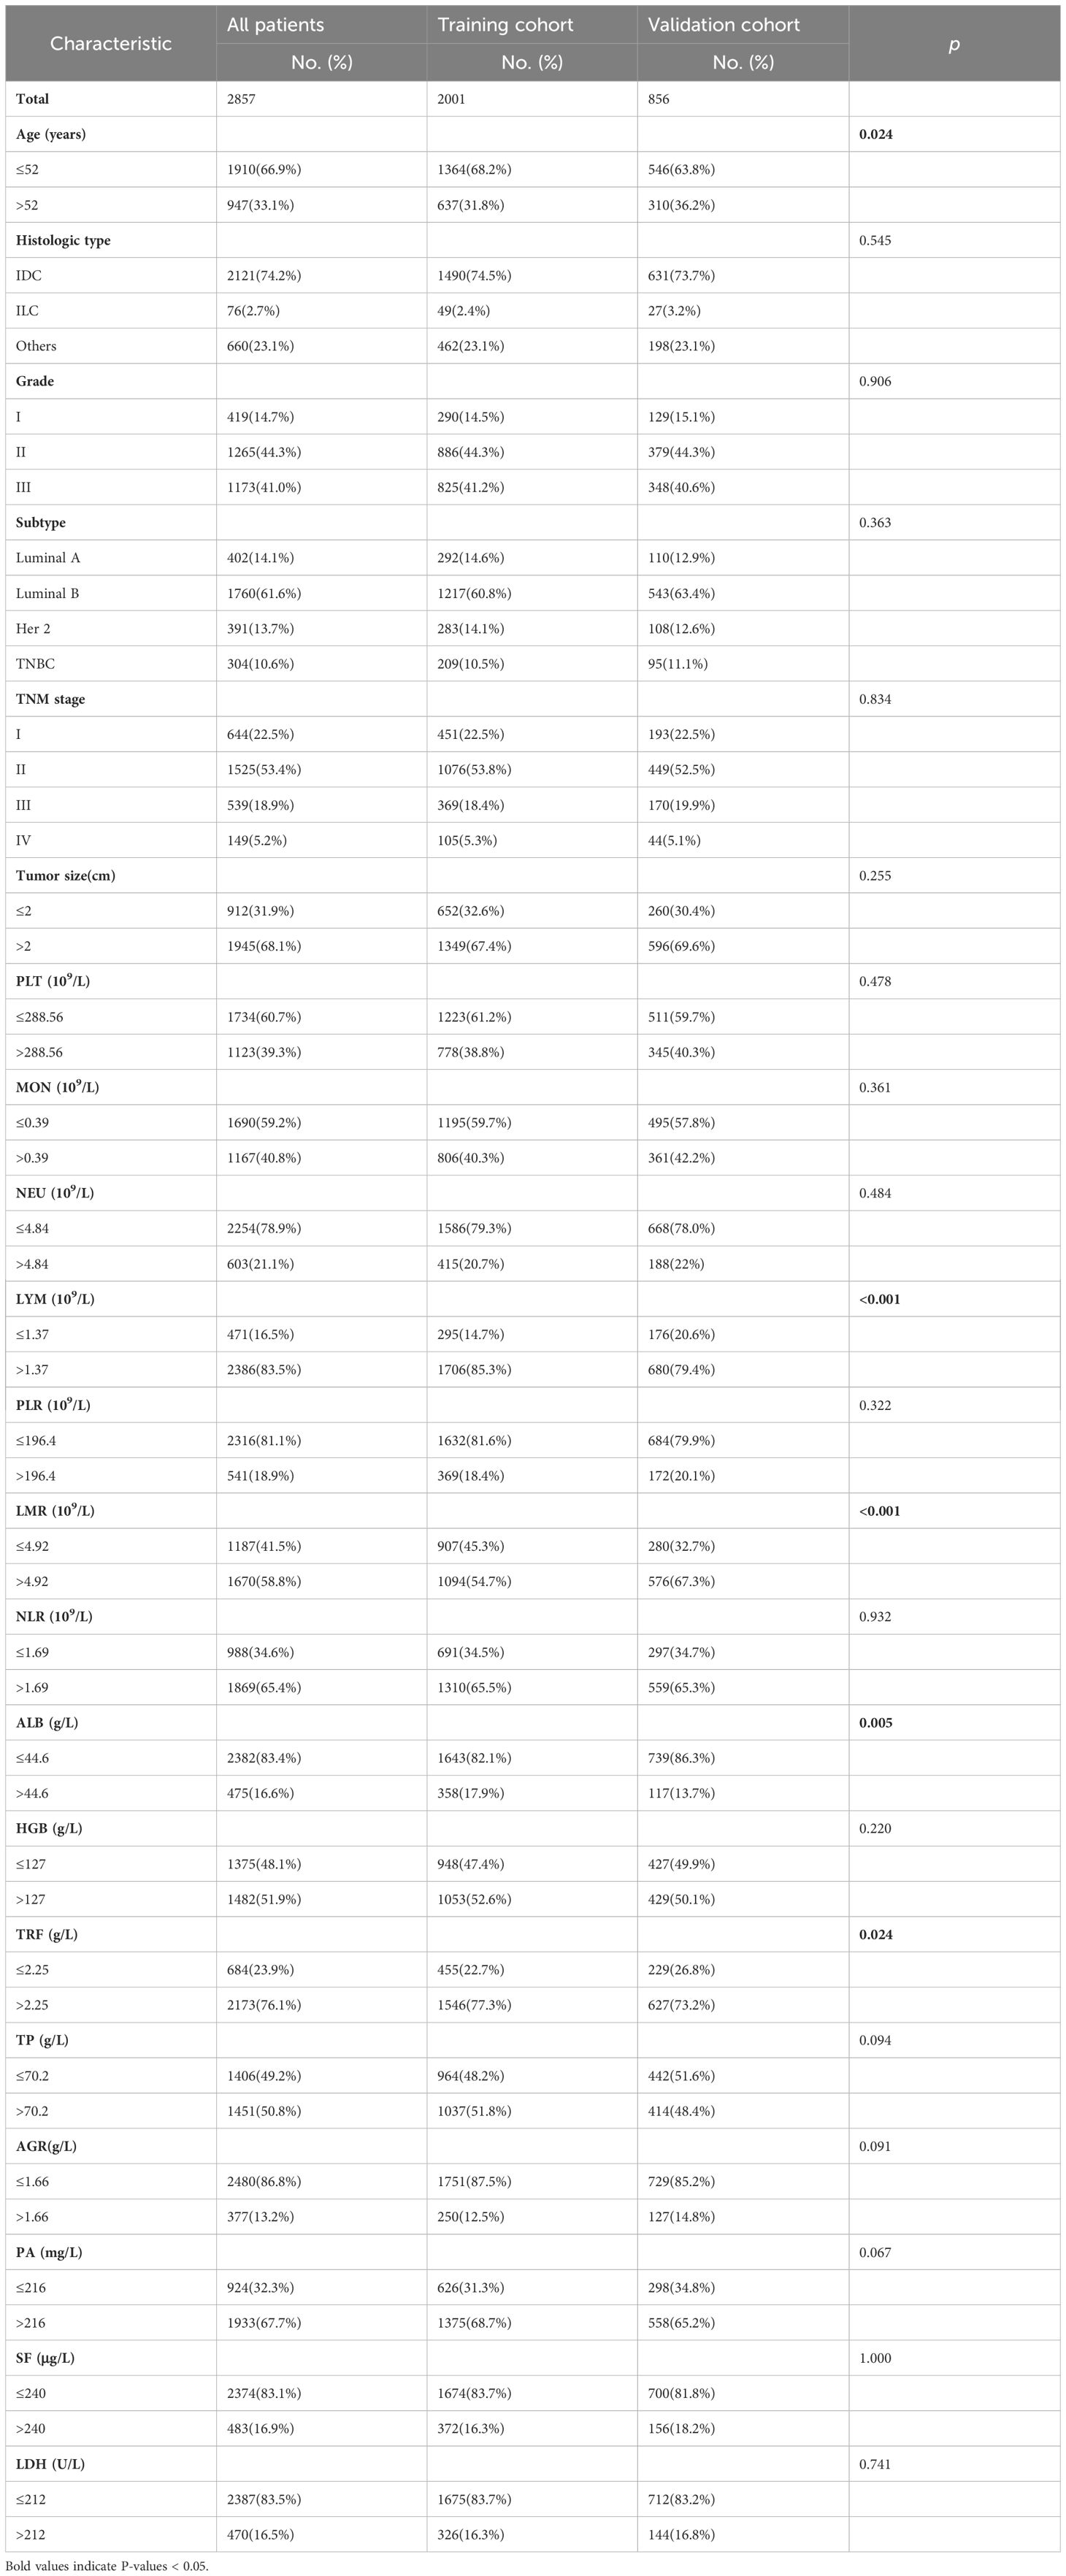
Table 1 Characteristics of training cohort and validation cohort.
3.2 Factors correlated with plasma levels of LYM, PLT, AGR, PA and HGB in BC patients with their interrelationship
The interrelationships between plasma levels of LYM, PLT, AGR, PA, HGB and clinical factors in BC patients are presented in Figure 2. AGR levels showed a correlation with age and subtype, indicating that AGR levels were influenced by these factors. LYM levels, on the other hand, only showed a correlation with age. Interestingly, HGB and PA levels did not show significant correlations with age or subtype. Furthermore, PLT levels were found to be negatively correlated with age, suggesting that PLT levels decrease as age increases. PA levels, on the other hand, were negatively correlated with TNM stage, and tumor size, indicating that higher PA levels were associated with less advanced disease.
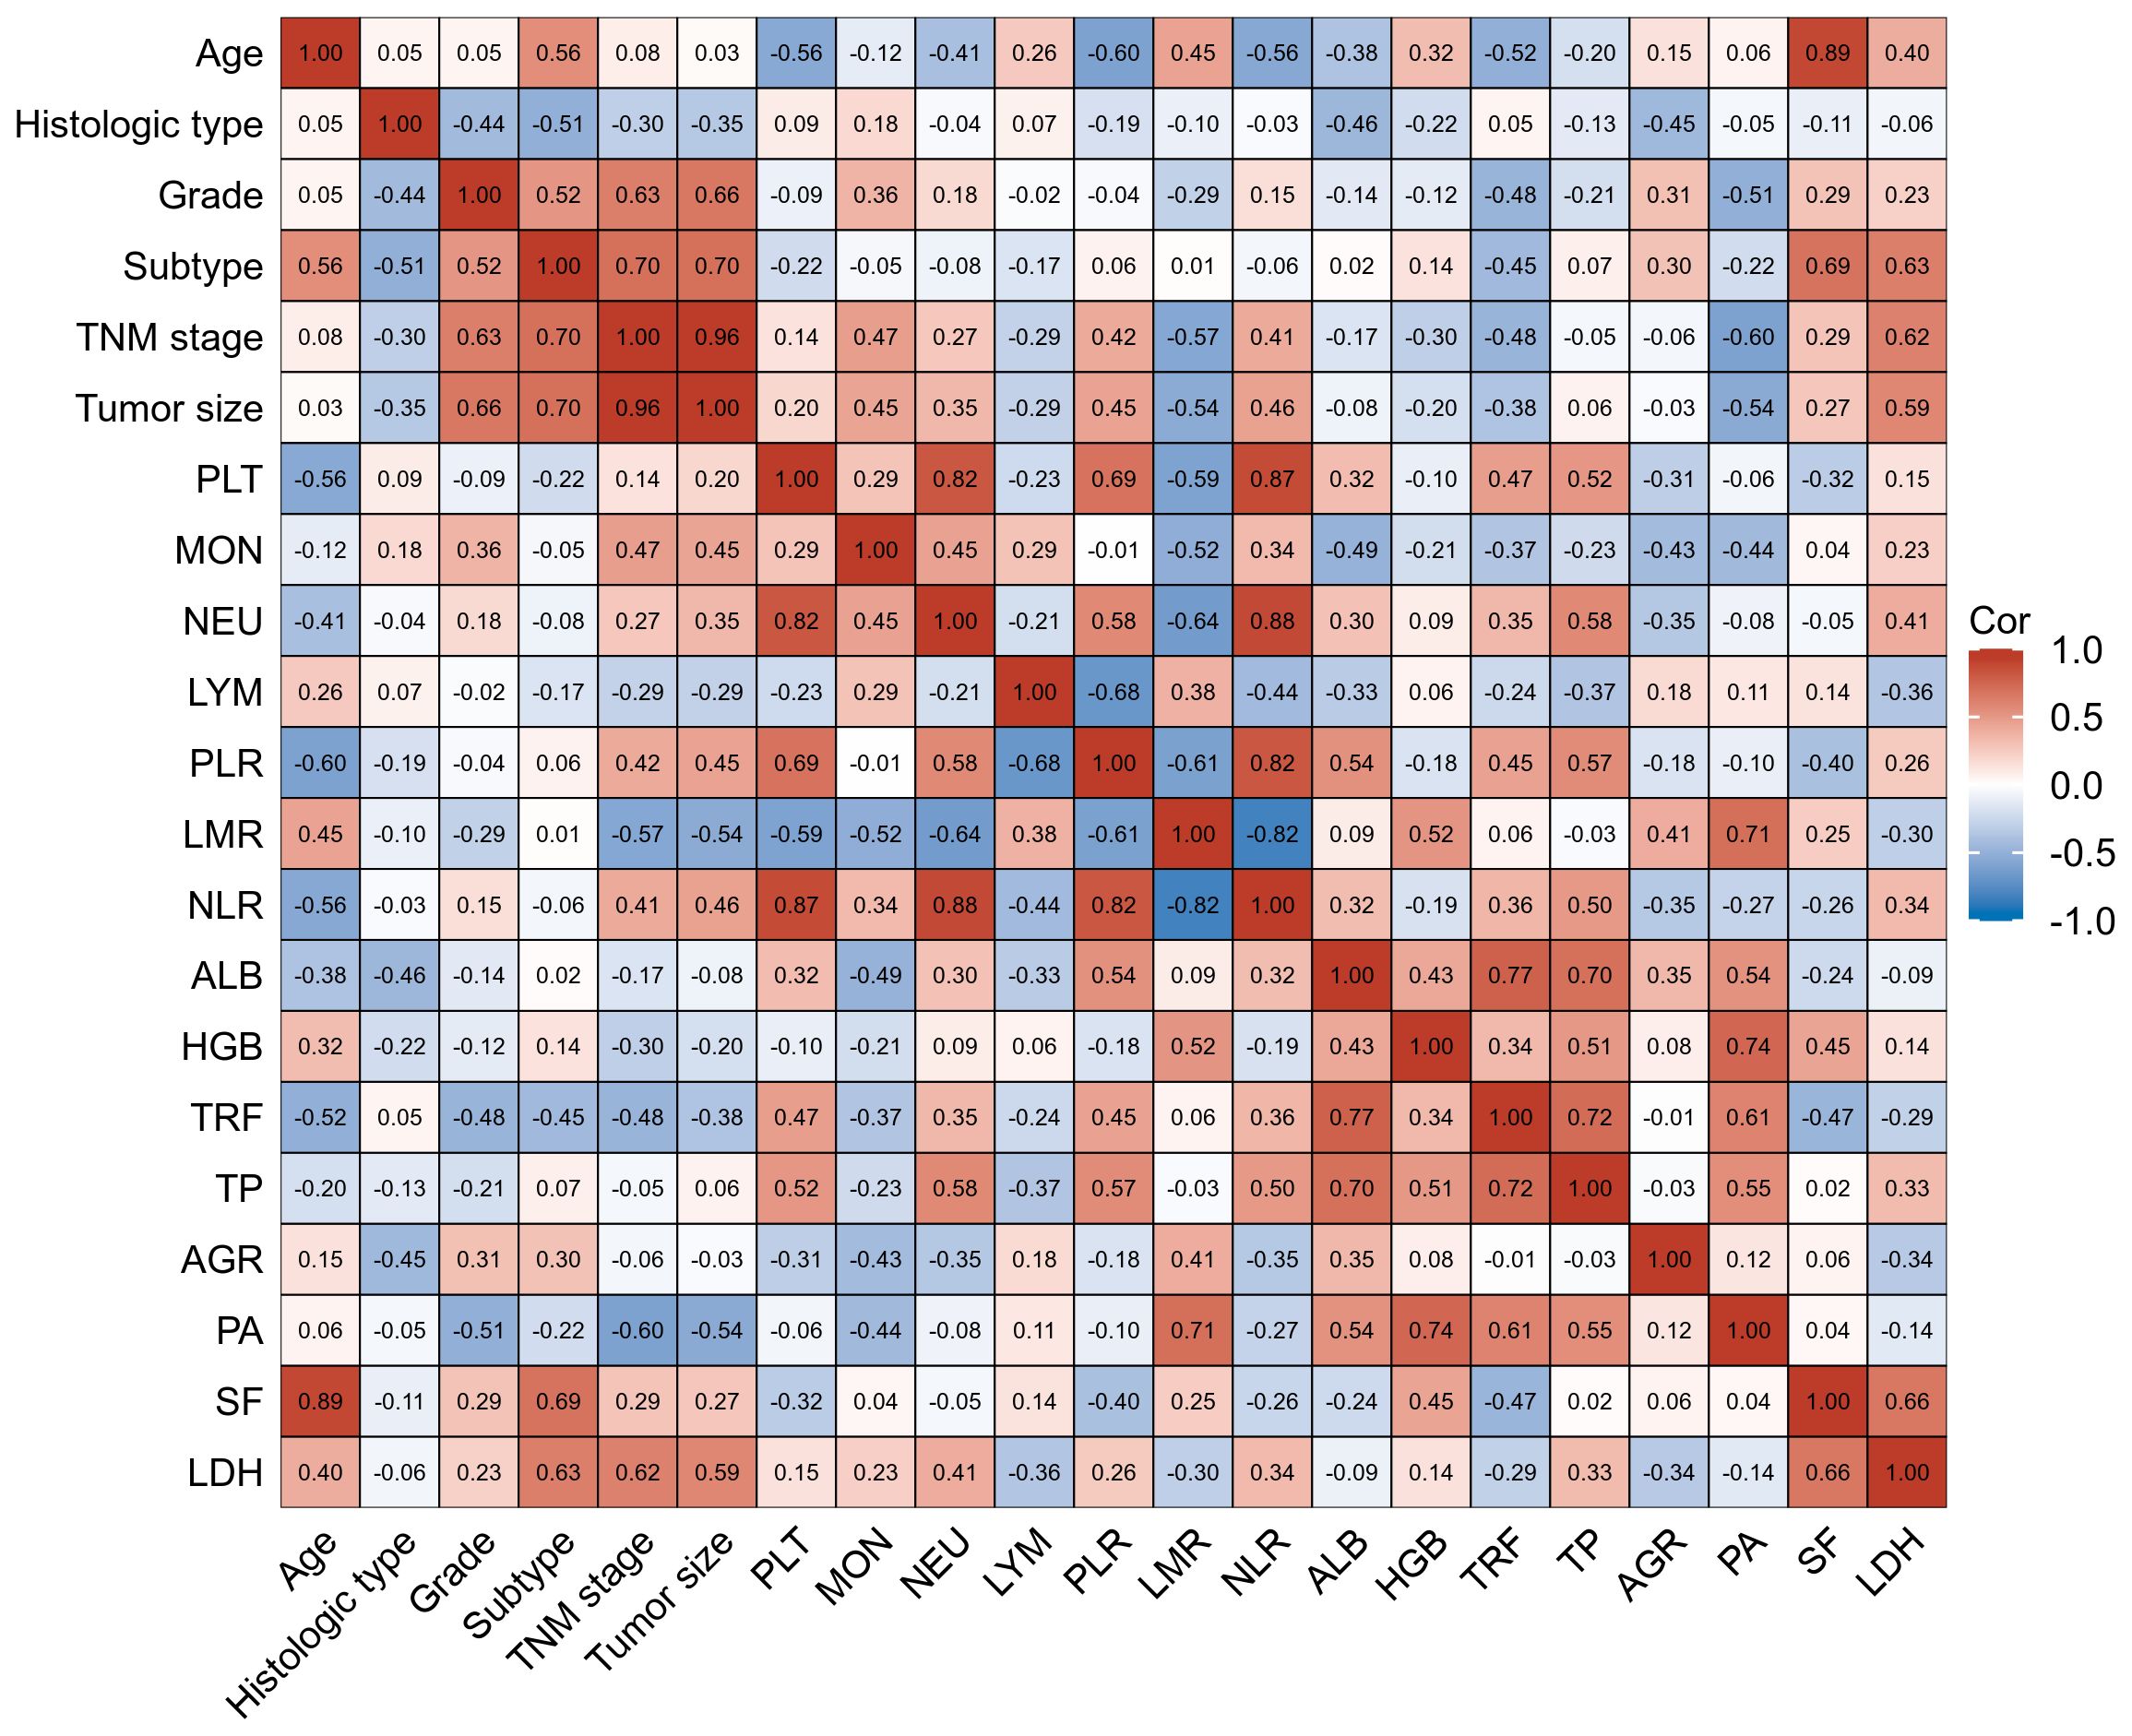
Figure 2 Factors correlated with plasma levels of LYM, PLT, AGR, PA, and HGB in training cohort BC patients with their interrelationship. The heat map showing a red background indicates a positive correlation, and the blue background indicates a negative correlation.
In terms of interrelationships among the biomarkers, PLT levels were not correlated with HGB levels. However, they were negatively correlated with LYM, PA, and AGR levels, indicating that higher PLT levels were associated with lower LYM, PA, and AGR levels. Additionally, AGR, PA, and HGB levels showed correlations with LMR, suggesting a potential relationship between these biomarkers and LMR.
These findings provide insights into the interrelationships between plasma biomarker levels and various clinical factors in BC patients, highlighting their potential as prognostic indicators and contributing to our understanding of the disease.
3.3 Univariate analyses and multivariate analyses
The univariate analysis of potential factors associated with BC revealed significant associations with the following factors: age (p=0.005), subtype (p <0.001), TNM stage (p<0.001), tumor size (p<0.001), PLT (p<0.001), MON (p<0.001), NEU (p<0.001), LYM (p=0.048), LMR (p=0.001), NLR (p=0.002), HGB (p=0.007), TRF (p=0.001), AGR (p=0.002), PA (p<0.001), SF (p<0.001), and LDH (p<0.001). Based on these significant factors, a multivariate analysis was conducted. The results showed that the following factors were significantly associated with BC: subtype (HR=6.461; 95% CI=2.860~14.595; p<0.001), TNM stage (HR=9.603; 95% CI=4.080~22.602; p<0.001), PLT (HR=1.374; 95% CI=1.016~1.860; p =0.039), LYM (HR=1.748; 95% CI=1.043~2.930; p =0.034), HGB (HR= 0.690; 95% CI=0.510~0.935 p =0.017), AGR (HR=1.951; 95% CI=1.389~2.740; p <0.001), and PA (HR= 0.694;95% CI=0.507~0.949; p =0.022). The detailed univariate and multivariate analysis results are presented in Table 2.
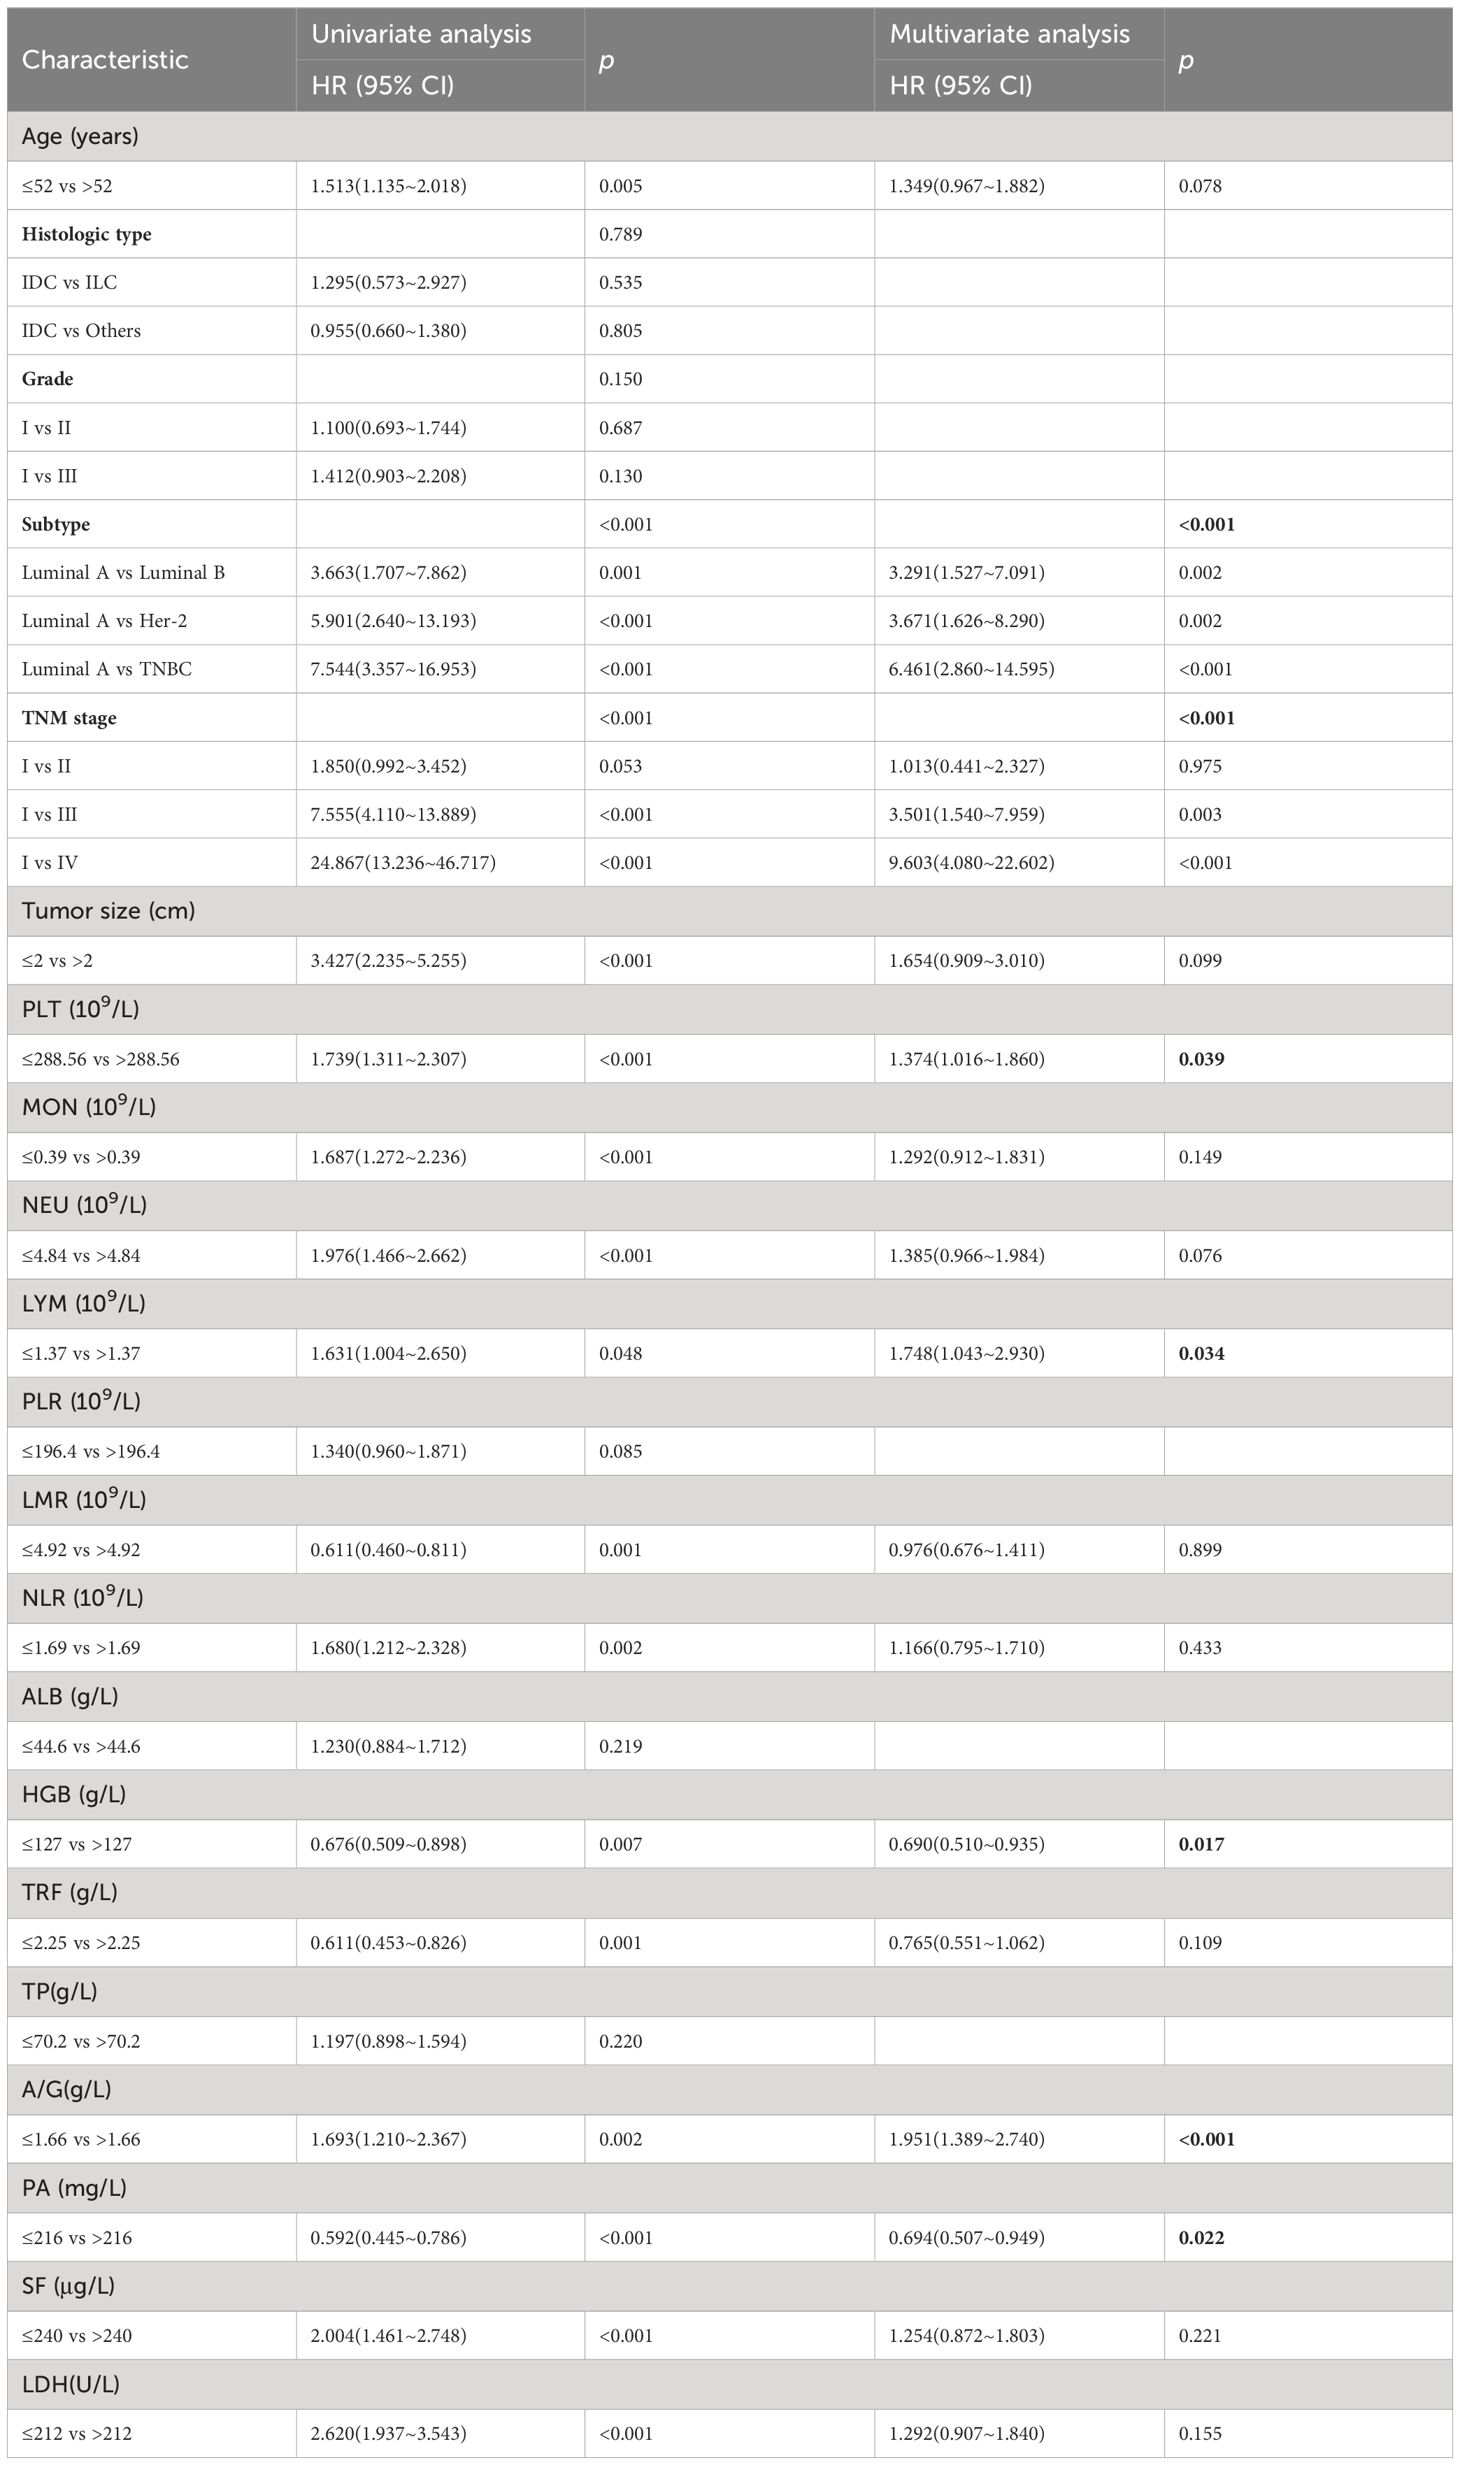
Table 2 Univariate and multivariate analysis of OS in the training cohort.
3.4 Construction and validation of the nomogram
In our study, TNM stage, subtype, LYM, PLT, HGB, AGR, and PA indicators, along with their respective cutoff values, performed well in the OS model, we have chosen to apply these indicators and cutoff values to the DFS model. The purpose of this is to ensure that our DFS model maintains reliable predictive performance and consistency with the OS model. The nomogram, based on the multivariate analysis results from the training cohort, was constructed to predict OS as well as DFS in BC patients. The nomogram incorporated all the independent prognostic factors identified in the multivariate analysis, including TNM stage, subtype, PLT, LYM, HGB, AGR, and PA. Figure 3 represents the nomogram for the training cohort. It is straightforward to estimate the 3-year, 5-year and 7-year OS and DFS probabilities by summing the scores associated with each variable and projecting the sums to the bottom scales. The model predicted the OS and DFS rates of BC with high accuracy in the training cohort, as indicated by a C-index of 0.820 (95% CI, 0.805–0.835) for OS and 0.760 (95% CI, 0.744–0.776) for DFS. In the training cohort, the calibration plot in Figures 4A, C shows a strong correlation between the predicted probabilities of 3-year, 5-year, and 7-year OS and DFS from the nomogram and the actual observed survival rates after surgery, indicating a high degree of concordance. Similarly, consistent results were observed in the validation cohort. The C-index of the nomogram for predicting OS and DFS in the validation cohort was 0.838 (95% CI, 0.818–0.858) and 0.755 (95% CI, 0.730–0.780), respectively. In the validation cohort, the calibration plot in Figures 4B, D also demonstrates good consistency between the predicted and actual OS and DFS. These findings imply that a nomogram is an accurate method for estimating survival in BC patients and offers useful data for clinical decision-making and patient counseling.
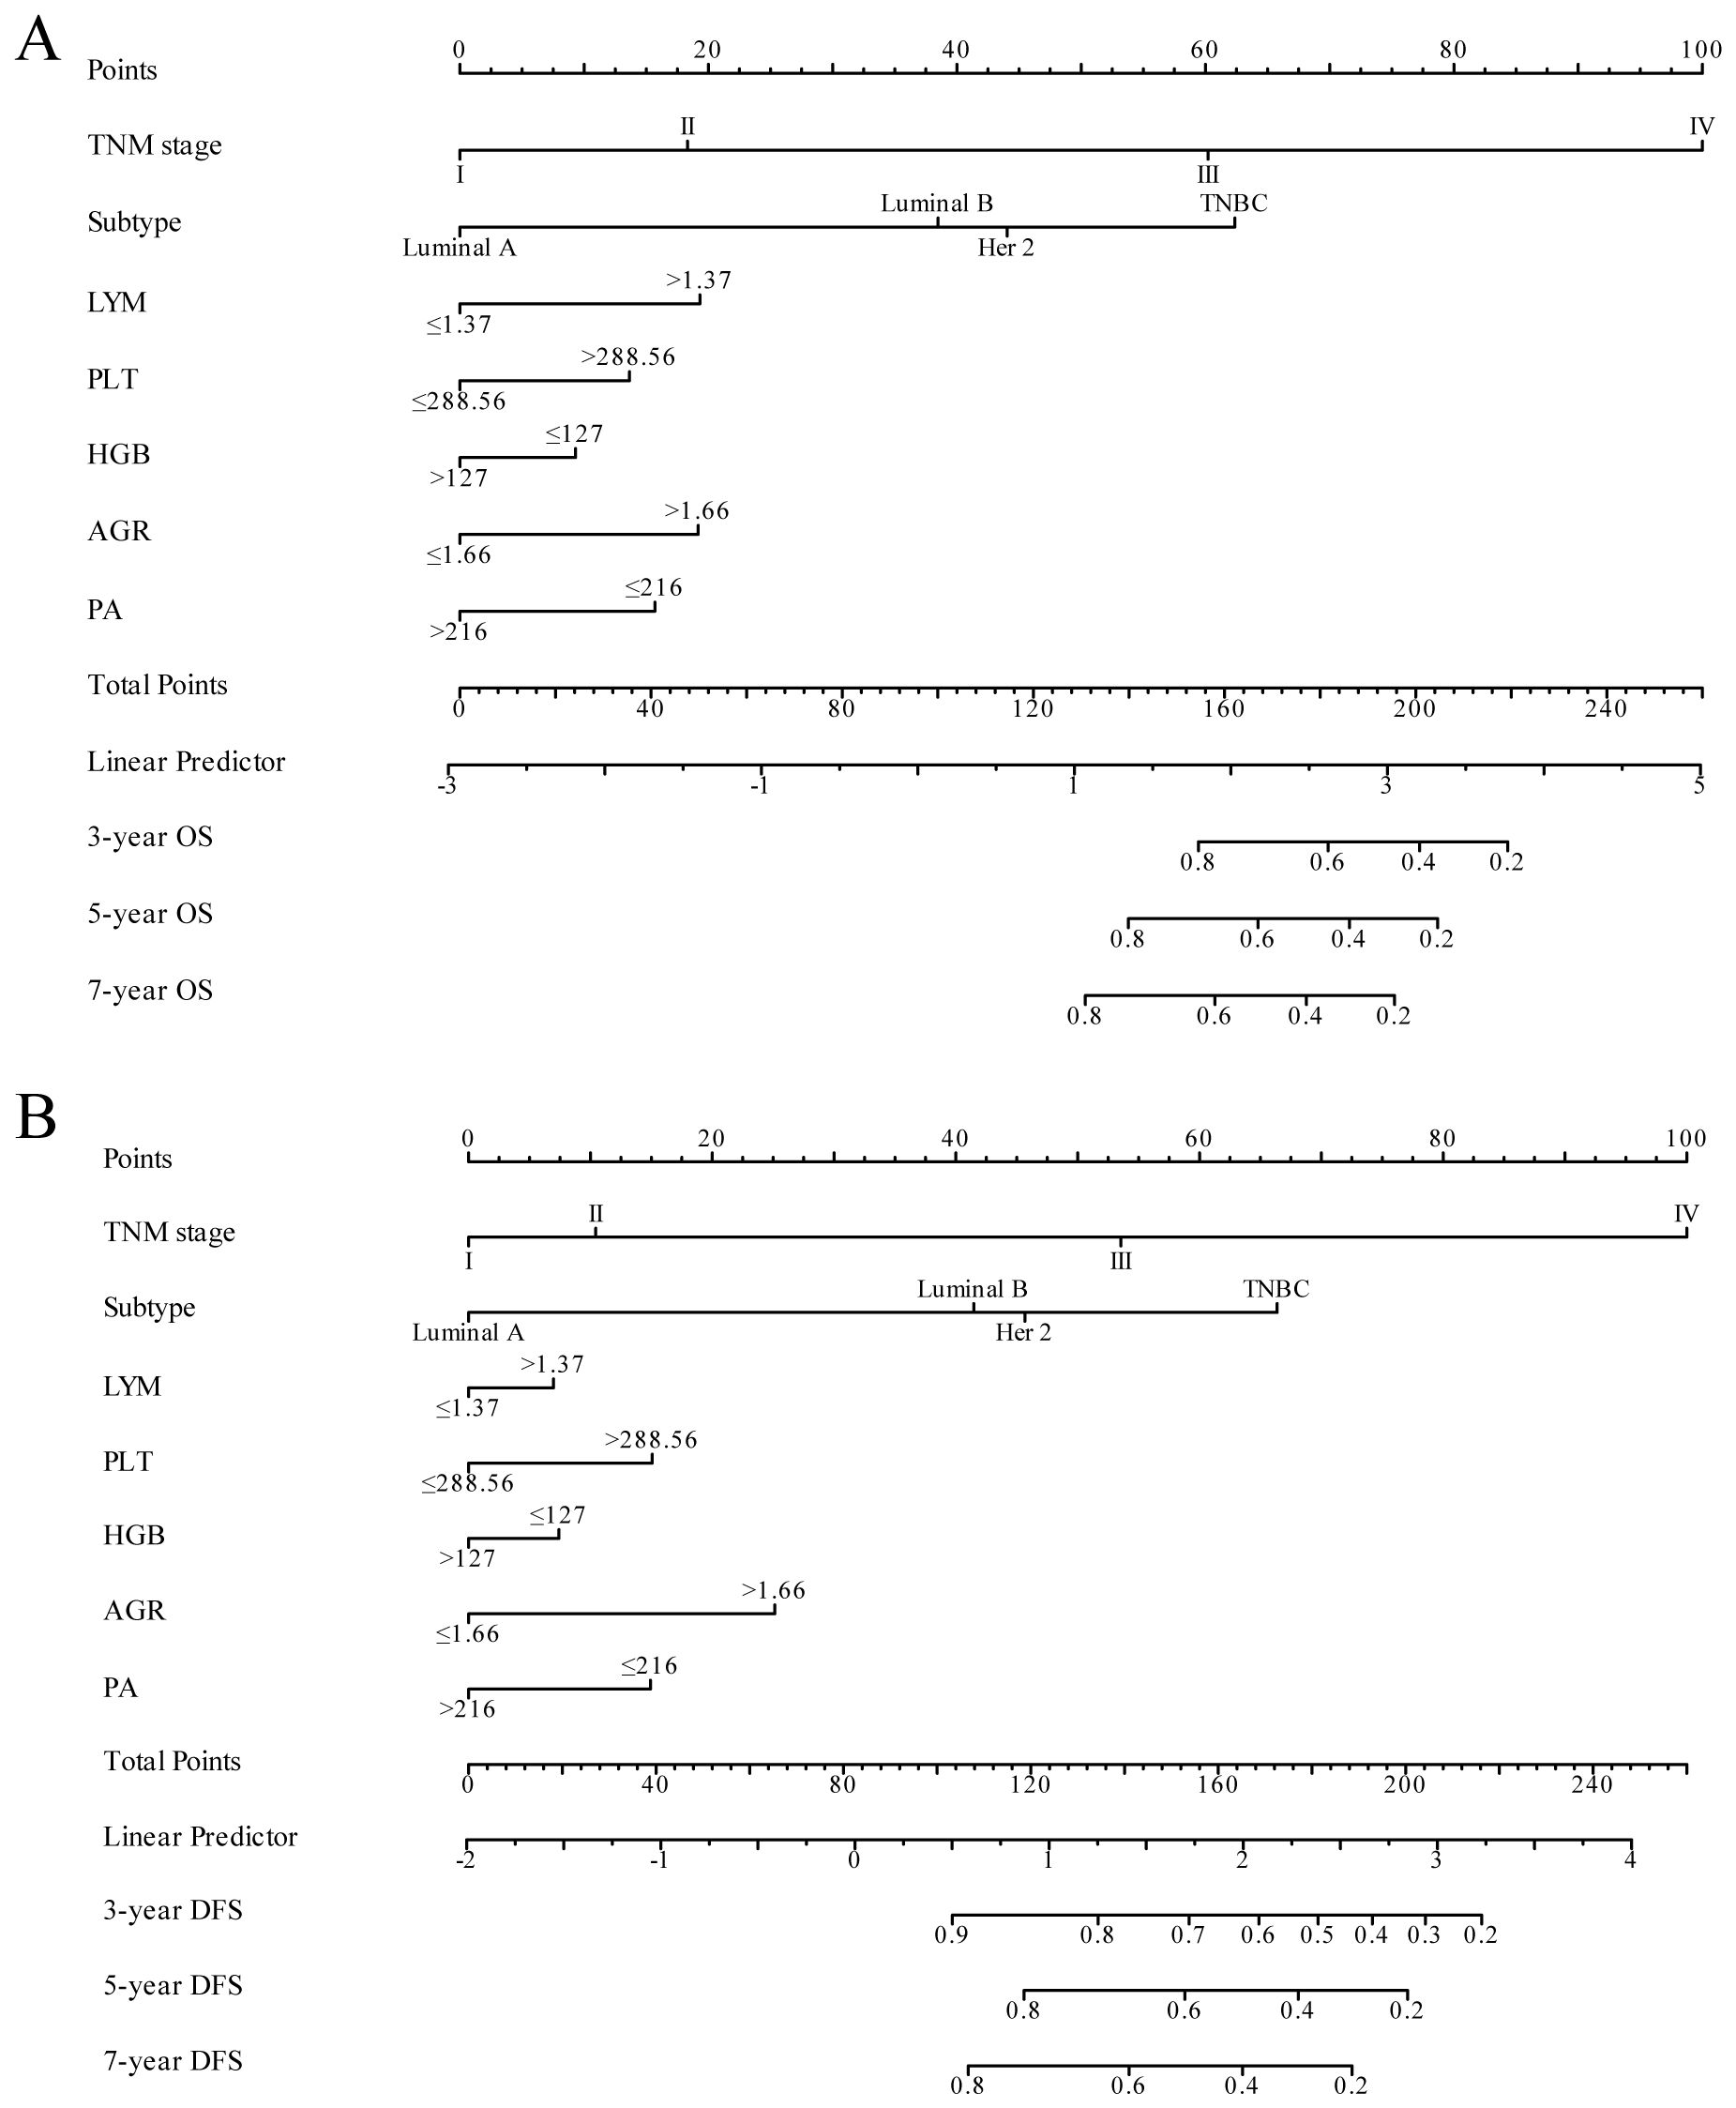
Figure 3 Nomogram model for predicting 3-year, 5-year and 7-year OS (A) and DFS (B) in BC patients within the training cohort. The nomogram was used to sum the points identified on the points scale for each variable. The total points projected on the bottom scales indicate the probability of 3-, 5- and 7-year survival.
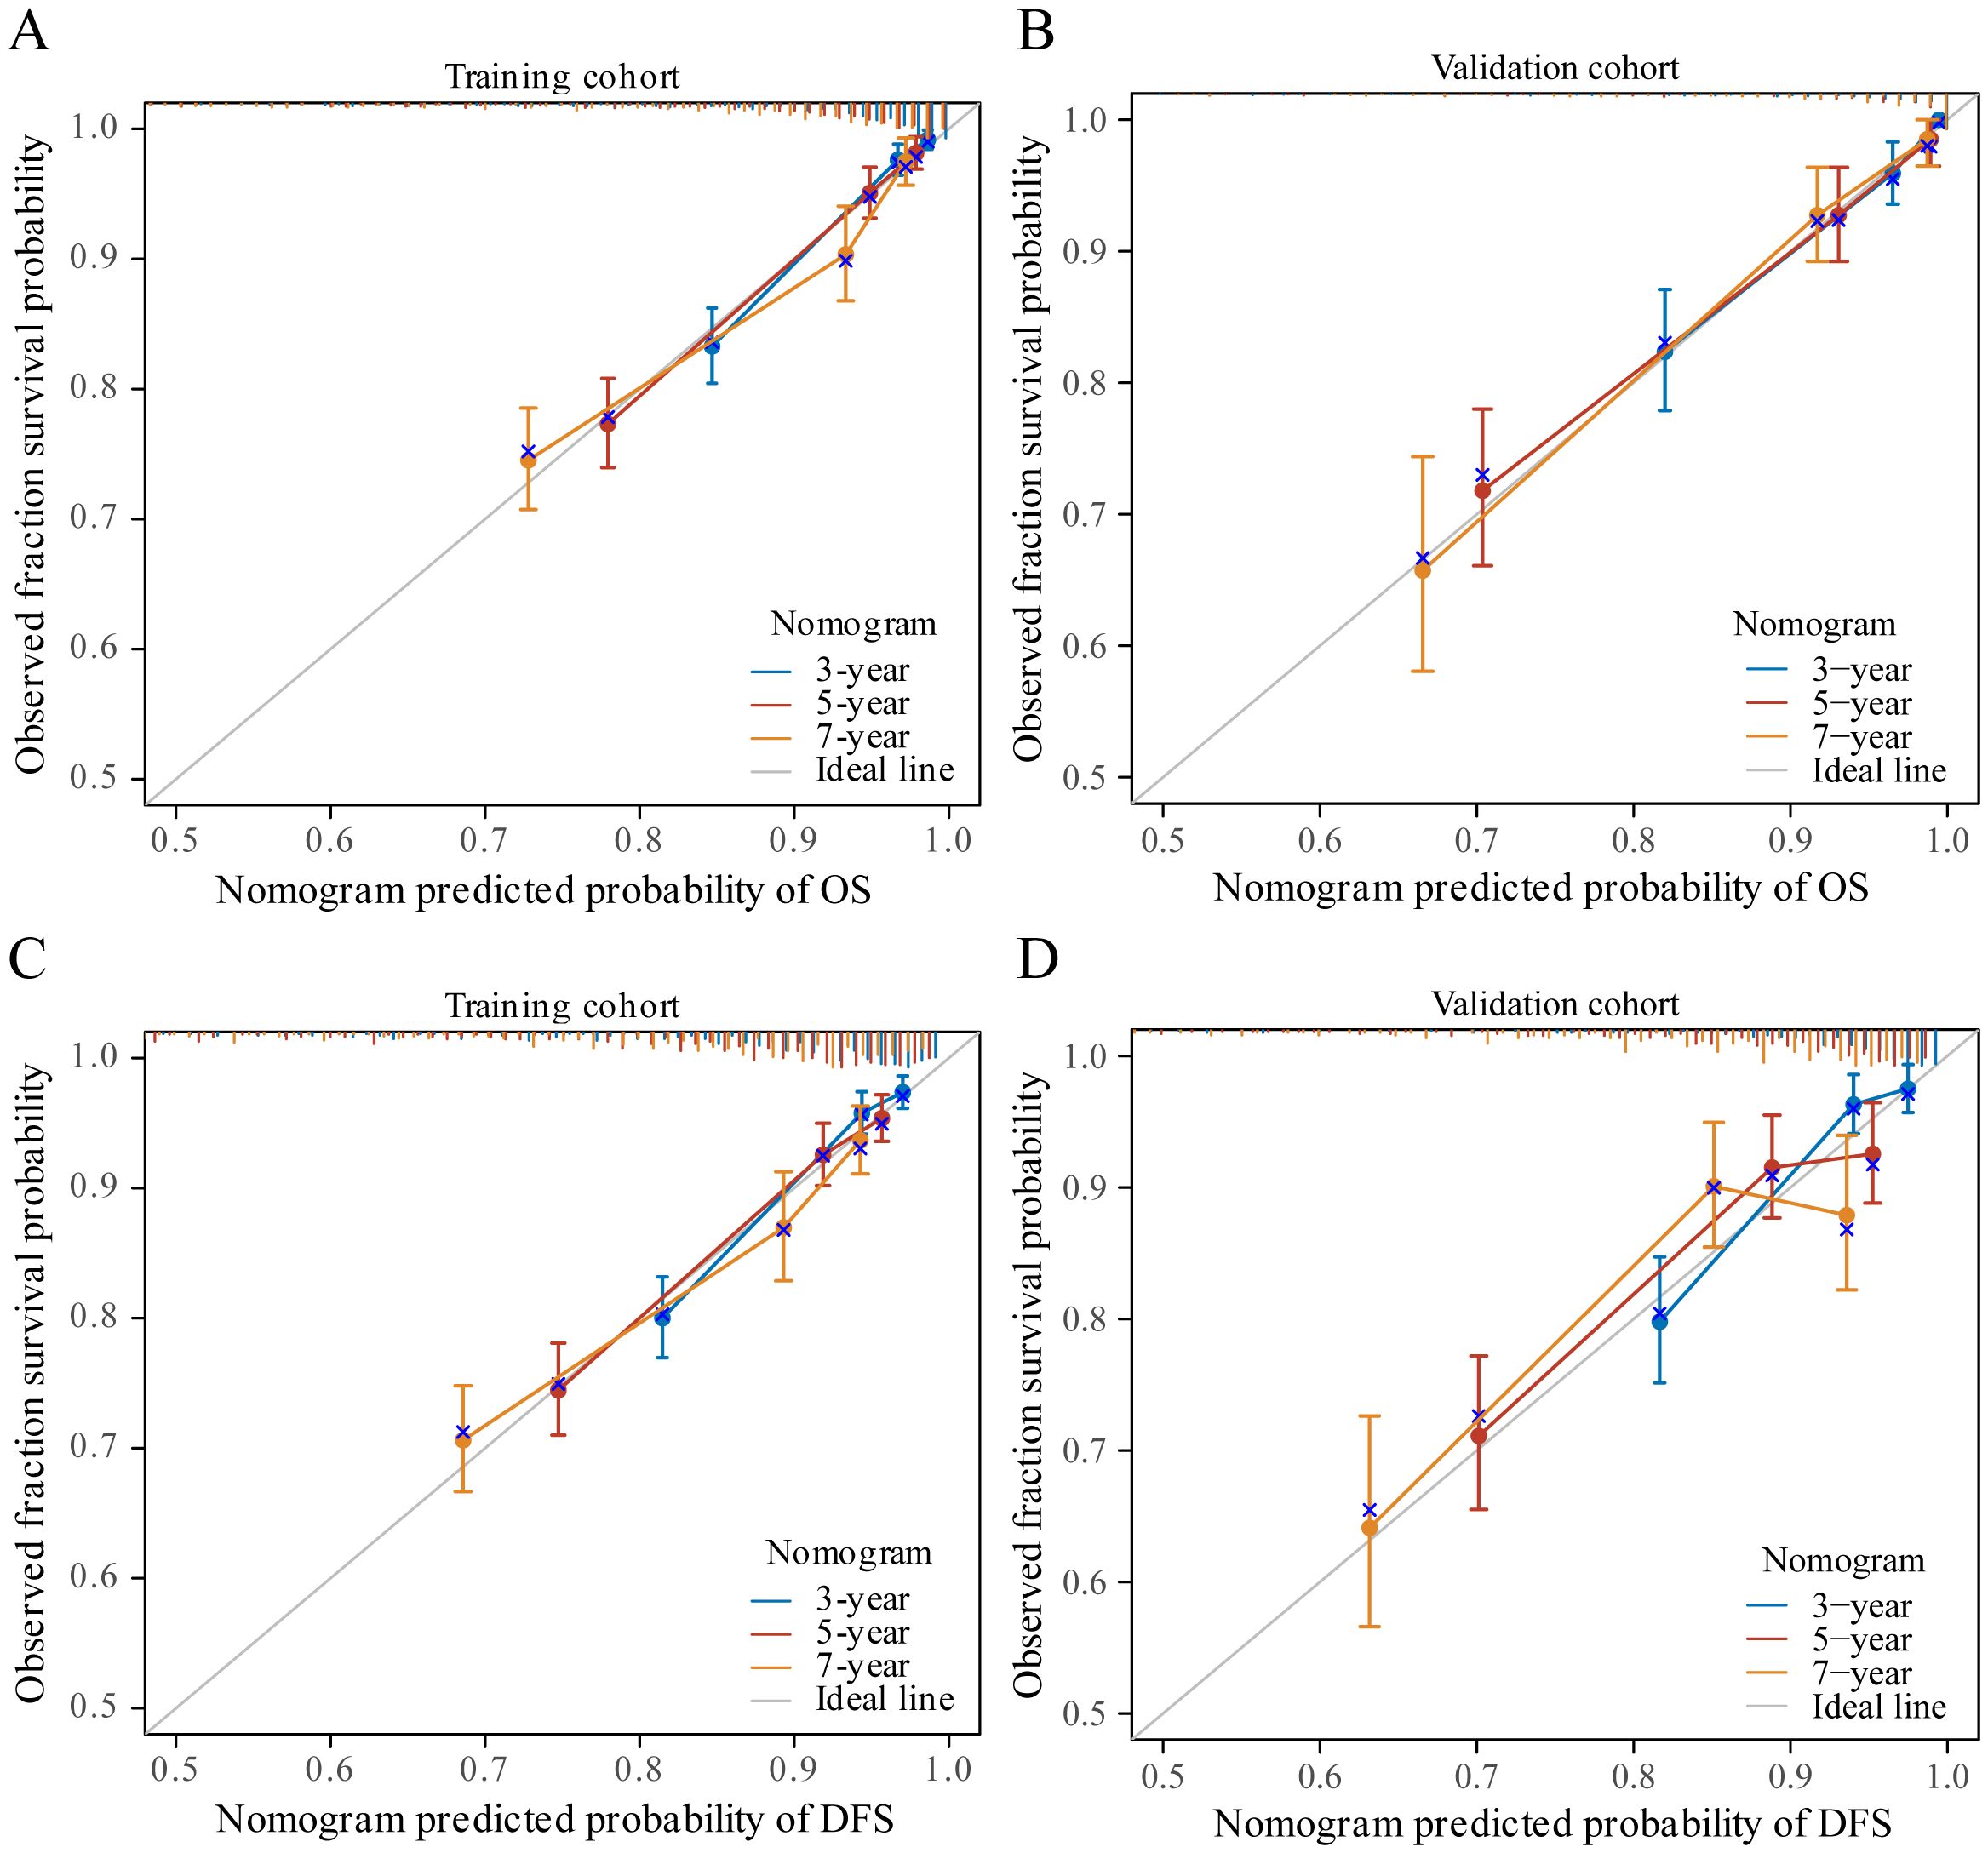
Figure 4 The calibration curves for predicting patient OS and DFS at three years, five years and seven years in the training cohort (A, C) and at three years, five years and seven years in the validation cohort (B, D).
3.5 Risk stratification of OS and DFS
The X-tile program was used to determine total point thresholds, based on which patients in both the training and validation cohorts were divided into low-, intermediate-, and high-risk groups for both OS and DFS. In the training cohort, the OS rates for the low-risk, intermediate-risk, and high-risk groups were 97.5%, 87.5%, and 54.7%, respectively (p<0.001, Figure 5A), while the DFS rates for the training cohort were 94.3%, 85.2%, and 51.6%, respectively (p<0.001, Figure 5C). Similarly, in the validation cohort, the OS rates for these risk categories were 97.3%, 86.8%, and 53.8%, respectively (p<0.001, Figure 5B), and the DFS rates were 92.6%, 84.8%, and 55.4%, respectively (p<0.001, Figure 5D). This risk stratification accurately determined survival outcomes for the three different categories within the training and validation cohorts.

Figure 5 Graphs showing the results of Kaplan–Meier curves for all three groups based on the predictor from the nomogram model in the training cohort (A, C) and those in the validation cohort (B, D).
3.6 Comparison of predictive accuracy and clinical usability between nomogram and TMN staging systems
ROC analysis further confirmed the superiority of the nomogram over the TNM stage model, exhibiting higher AUC values across various time points for both OS and DFS. Specifically, in the training cohort, the nomogram achieved AUC values of 0.839, 0.807, and 0.772 for 3-year, 5-year, and 7-year OS, respectively (Figure 6A), compared to AUC values of 0.787, 0.750, and 0.725 for the TNM stage model (Figure 6B). Similarly, for DFS, the nomogram achieved AUC values of 0.780, 0.741, and 0.699 for 3-year, 5-year, and 7-year DFS, respectively (Figure 6E), compared to AUC values of 0.732, 0.700, and 0.683 for the TNM stage model in the training cohort (Figure 6F). These trends were consistent in the validation cohort, where the nomogram demonstrated higher AUC values for both OS and DFS at each time point compared to the TNM stage model (Figures 6C, D, G, H). The ROC curves depicted in Figure 6 further illustrate the enhanced predictive performance of the nomogram over the TNM stage model. In summary, these findings indicate that the nomogram provides superior predictive accuracy and clinical usability in forecasting survival outcomes across different time intervals.
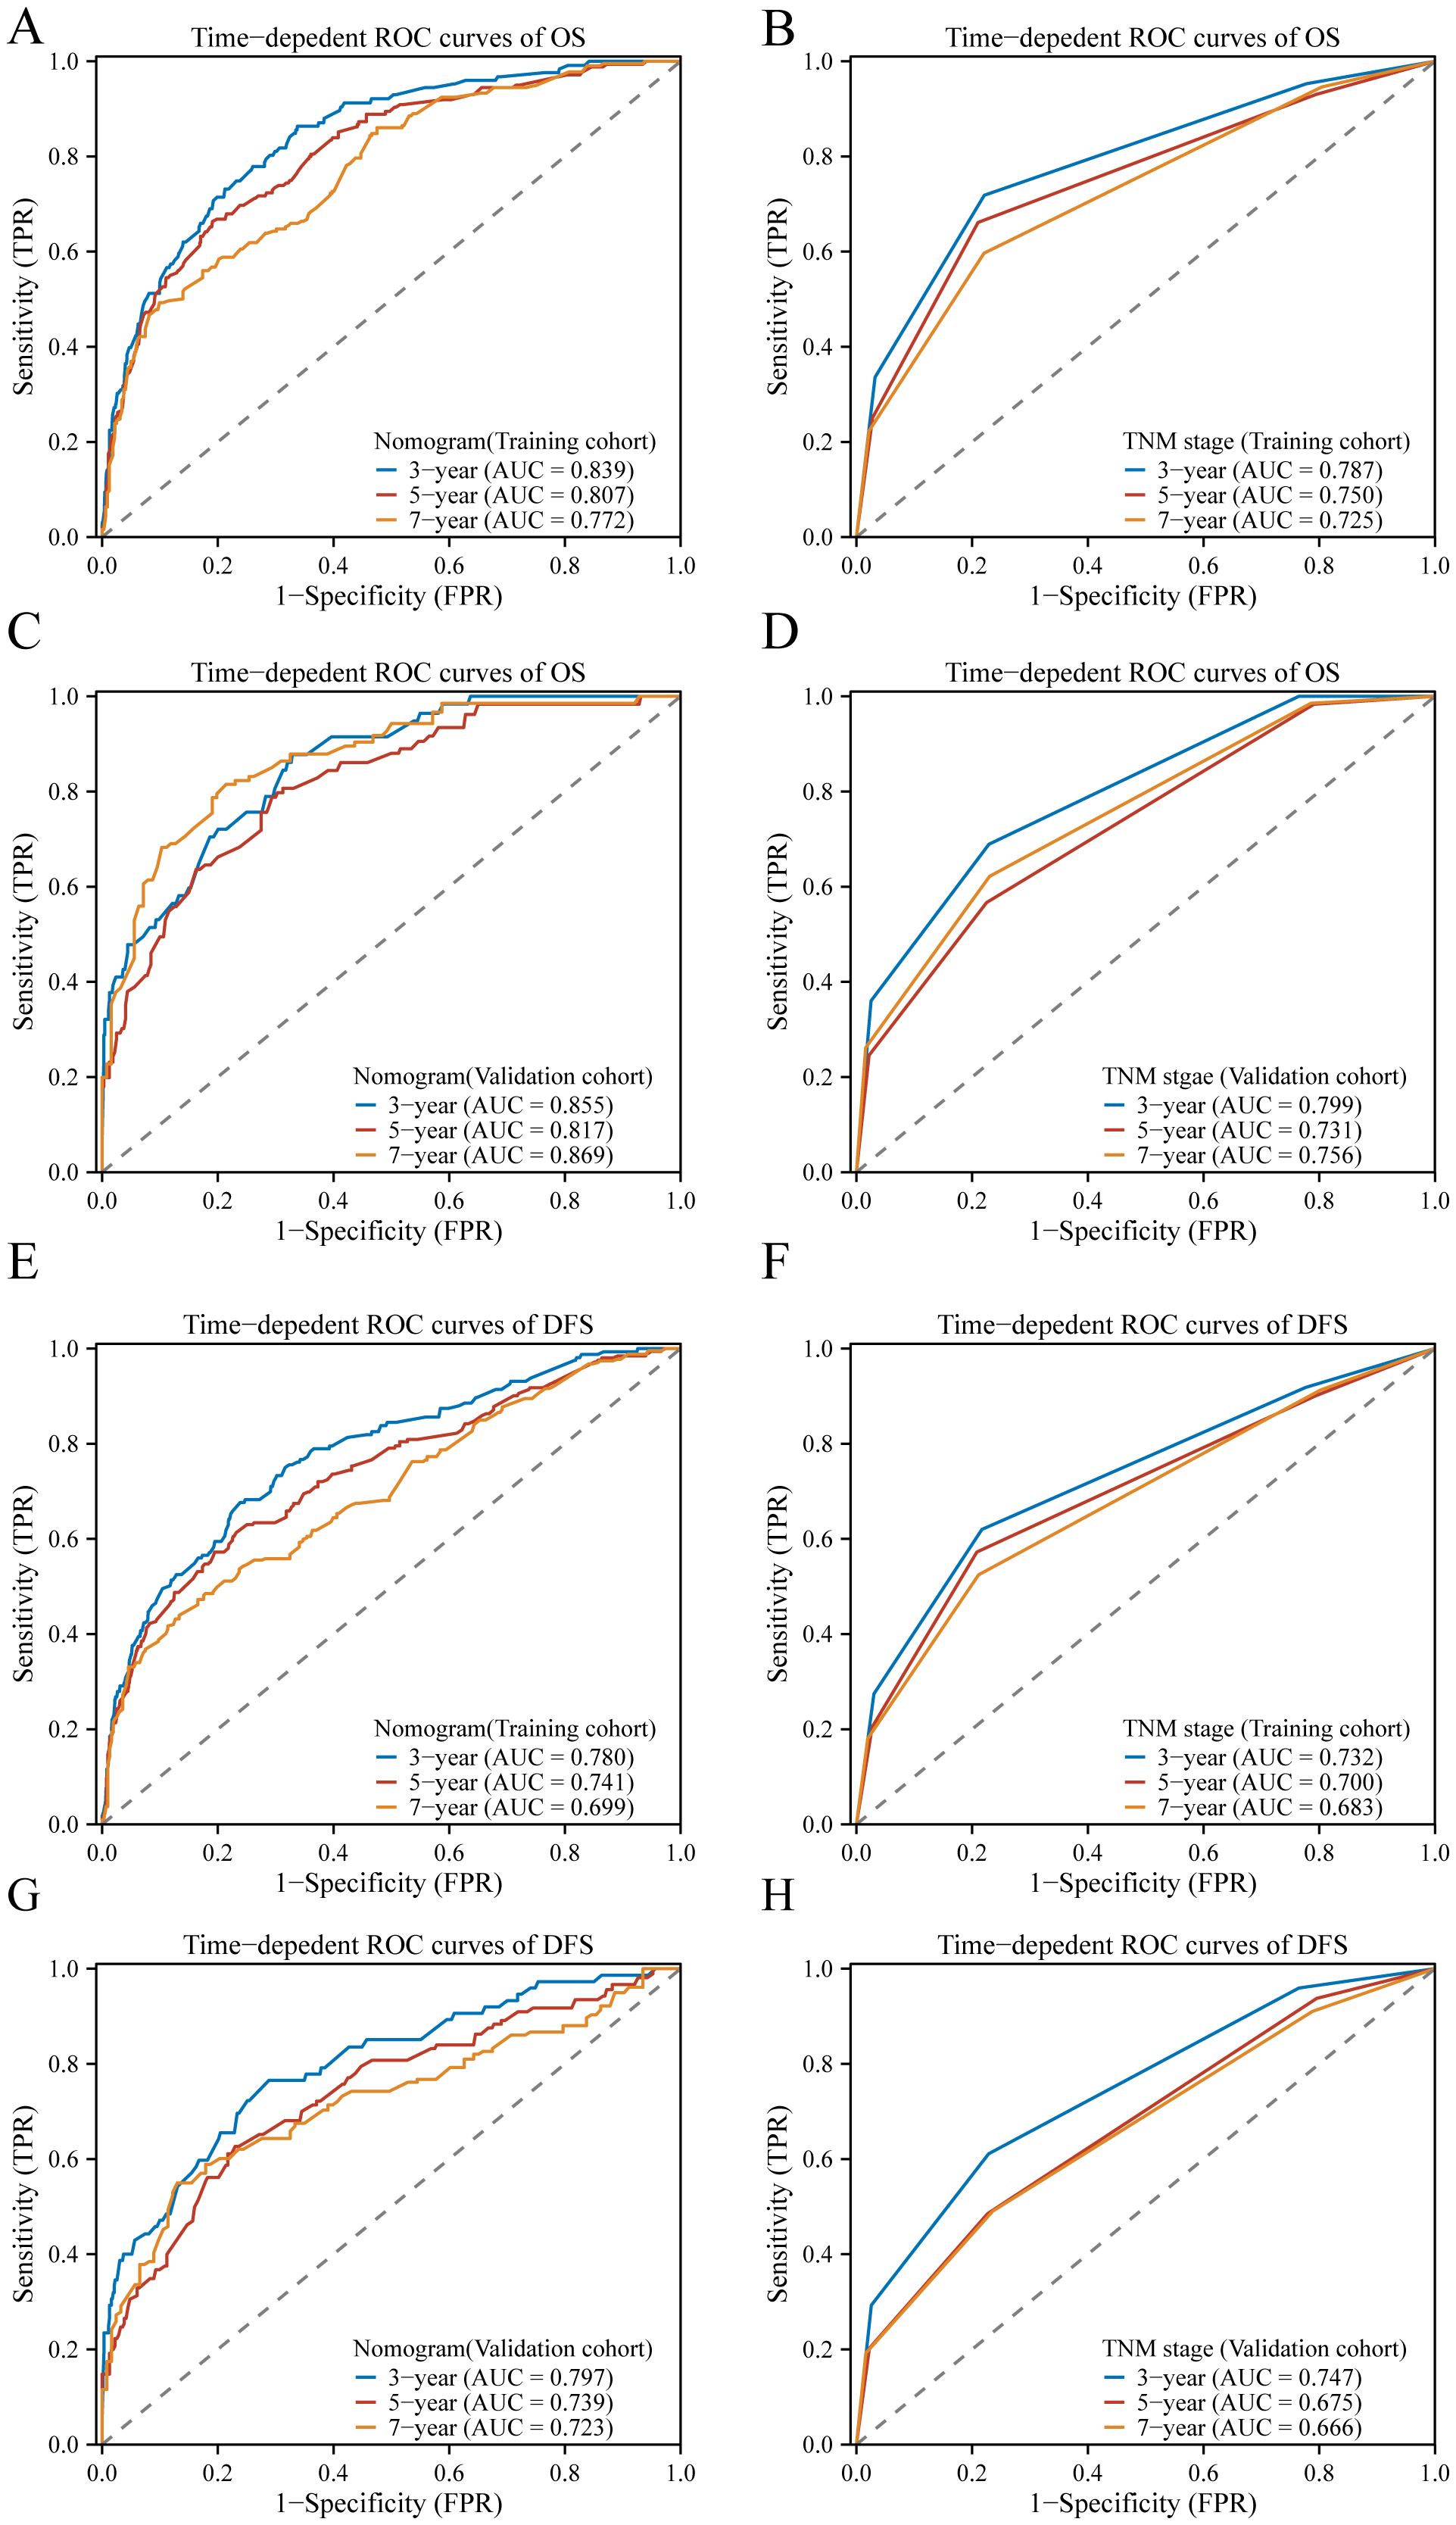
Figure 6 The ROC curves of the model to predict BC OS and DFS at 3, 5, and 7 years; In the training cohort, ROC curves comparing the nomogram (A) and TNM stage (B) for predicting OS, and in the validation cohort (C, D), respectively. Similarly, in the training cohort, ROC curves compare the nomogram (E) and TNM stage (F) for predicting DFS, and in the validation cohort (G, H), respectively.
In the training cohort, the C-index of the nomogram was higher than the C-index of the TMN stage, Subtype, and TMN stage + Subtype, respectively. Similarly, consistent results were observed in the validation cohort. The results are shown in Table 3. These findings provide insights into the interrelationships between plasma biomarker levels and various clinical factors in BC patients, highlighting inflammation and nutritional biomarker’s potential as prognostic indicators and contributing to predicting the survival of BC patients.
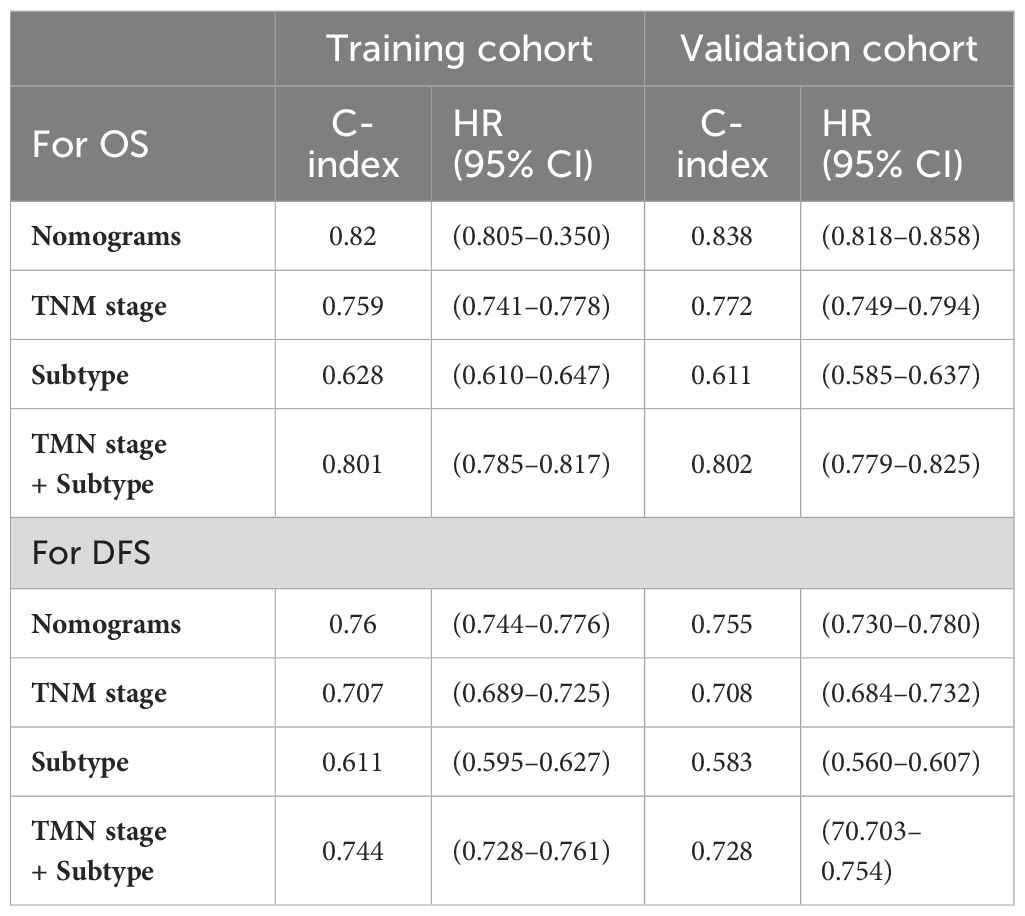
Table 3 The C-indexes of nomograms, TNM stage, Subtype, and TNM stage+ Subtype for prediction of OS and DFS in the training cohort and validation cohort.
To compare the clinical utility of this approach with traditional TNM staging, a decision curve analysis (DCA) was carried out. The DCA displayed graphically the net benefit of using the nomogram and TNM stage model to predict 5-year OS and DFS in the training and validation cohorts, taking into account a range of various recurrence threshold probabilities on the x-axis. The DCA plots (Figure 7) demonstrated that the nomogram provided a greater net benefit than other prognostic factors including the TNM stage nomogram model across the range of threshold probabilities evaluated. The nomogram showed higher net benefit curves, indicating that using the nomogram for risk stratification resulted in a higher overall net benefit in predicting 5-year OS and DFS. This suggests that the nomogram has a greater clinical utility than the conventional TNM stage model, as it provides superior risk stratification and enhances clinical decision-making. In summary, the DCA results further support the superiority of the nomogram over the TNM stage model in terms of clinical usefulness, as it offers greater net benefit in predicting 5-year OS and DFS across a range of threshold probabilities for recurrence.
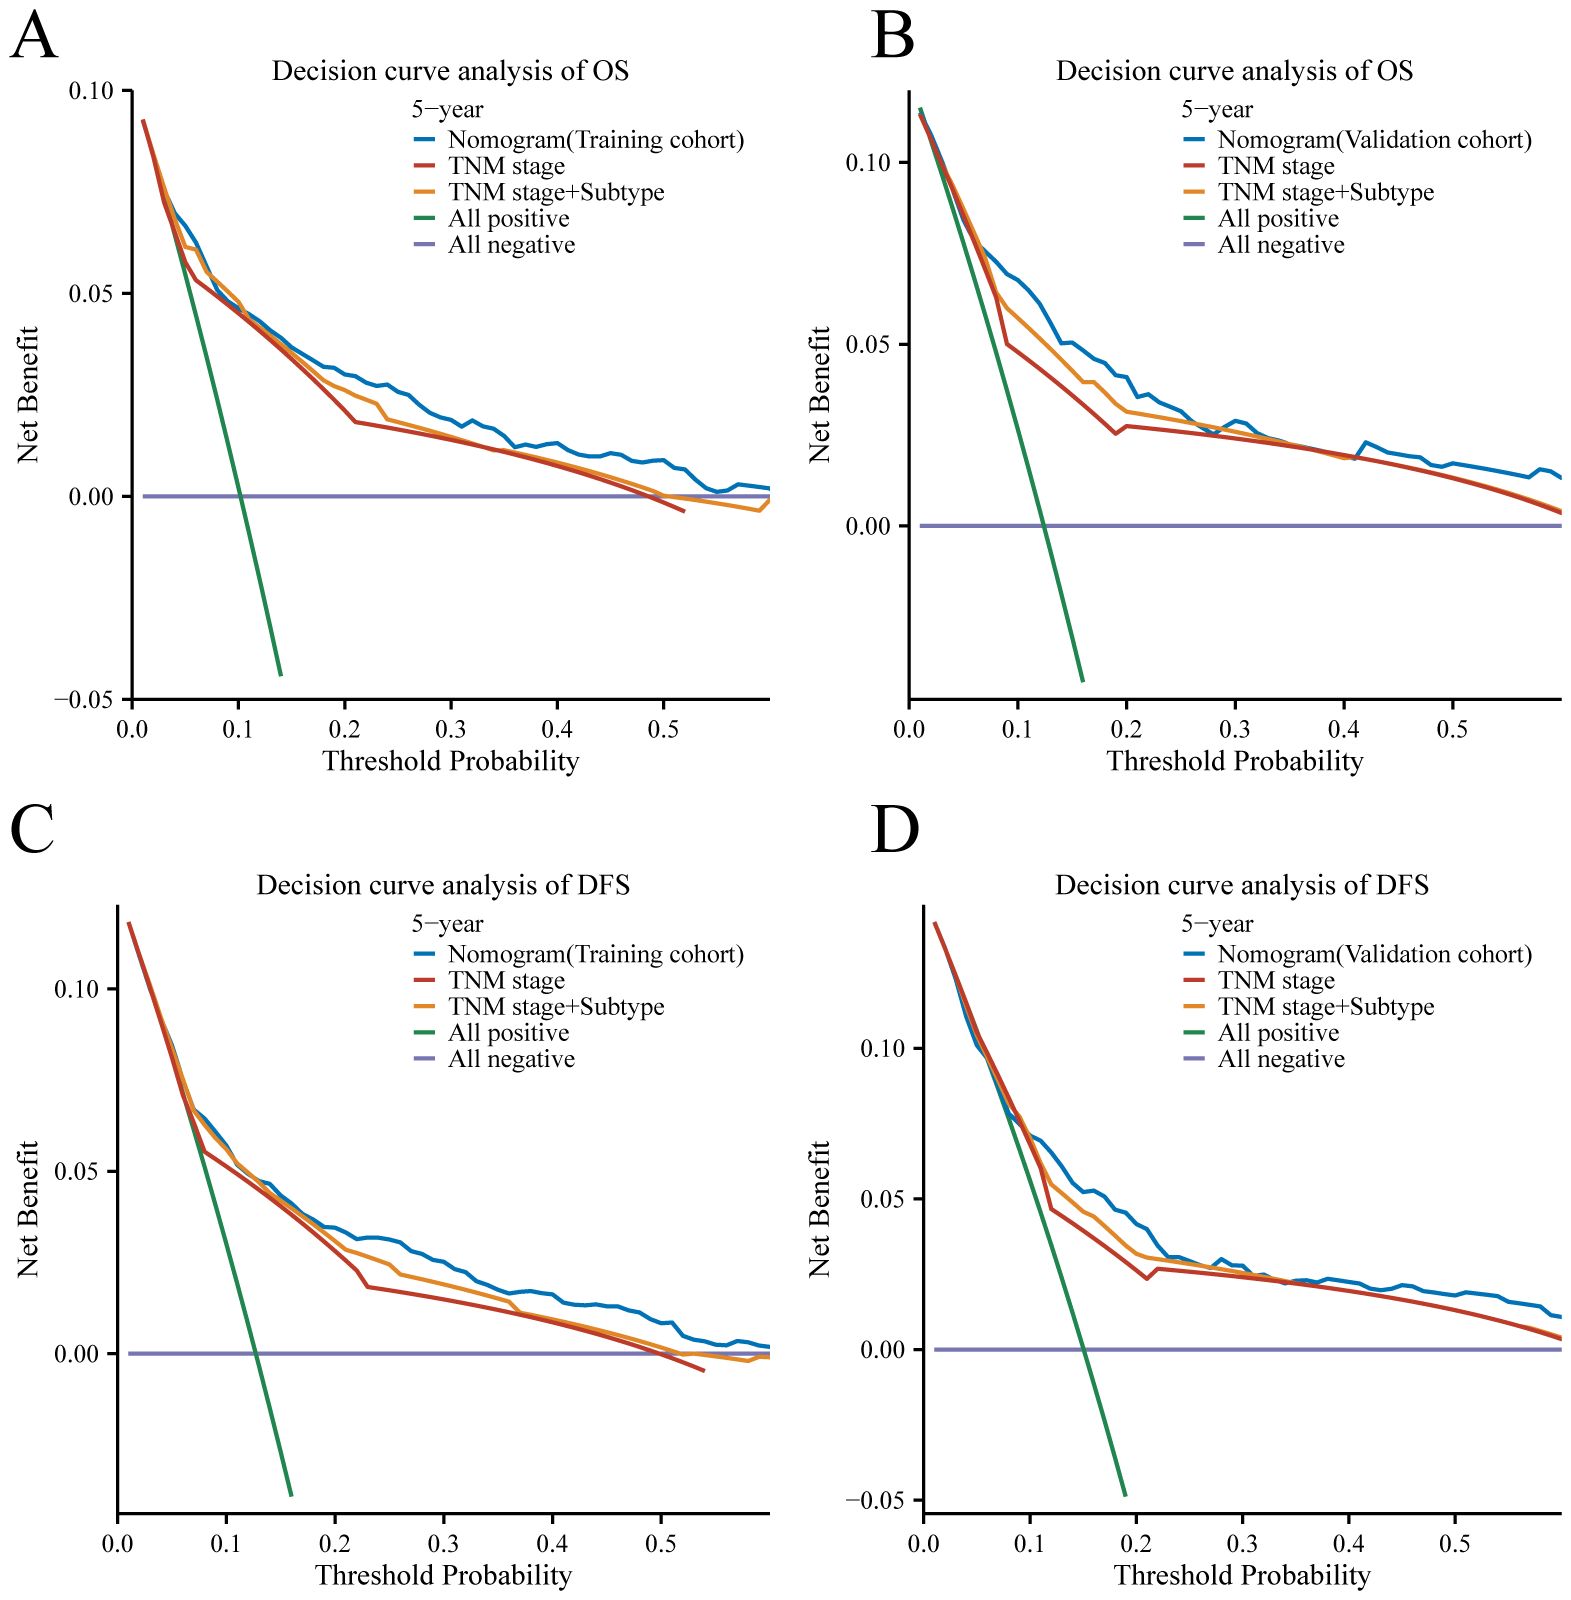
Figure 7 Decision curve analysis for 5-year survival predictions. (A, C) The decision curve of the training cohort; (B, D) The decision curve of the validation cohort.
3.7 External validation of the nomogram
The external validation cohort, consisting of 420 cases, was utilized as an independent validation set to assess the performance of our nomogram model. The C-index of the nomogram in this validation cohort was found to be 0.772 (95% CI: 0.726–0.817) (Figure 8). The validation of a model with a C-index exceeding 0.7 suggests that the model constructed in this study performs well in terms of robustness and reliability, thereby enhancing the credibility and persuasiveness of our research findings.
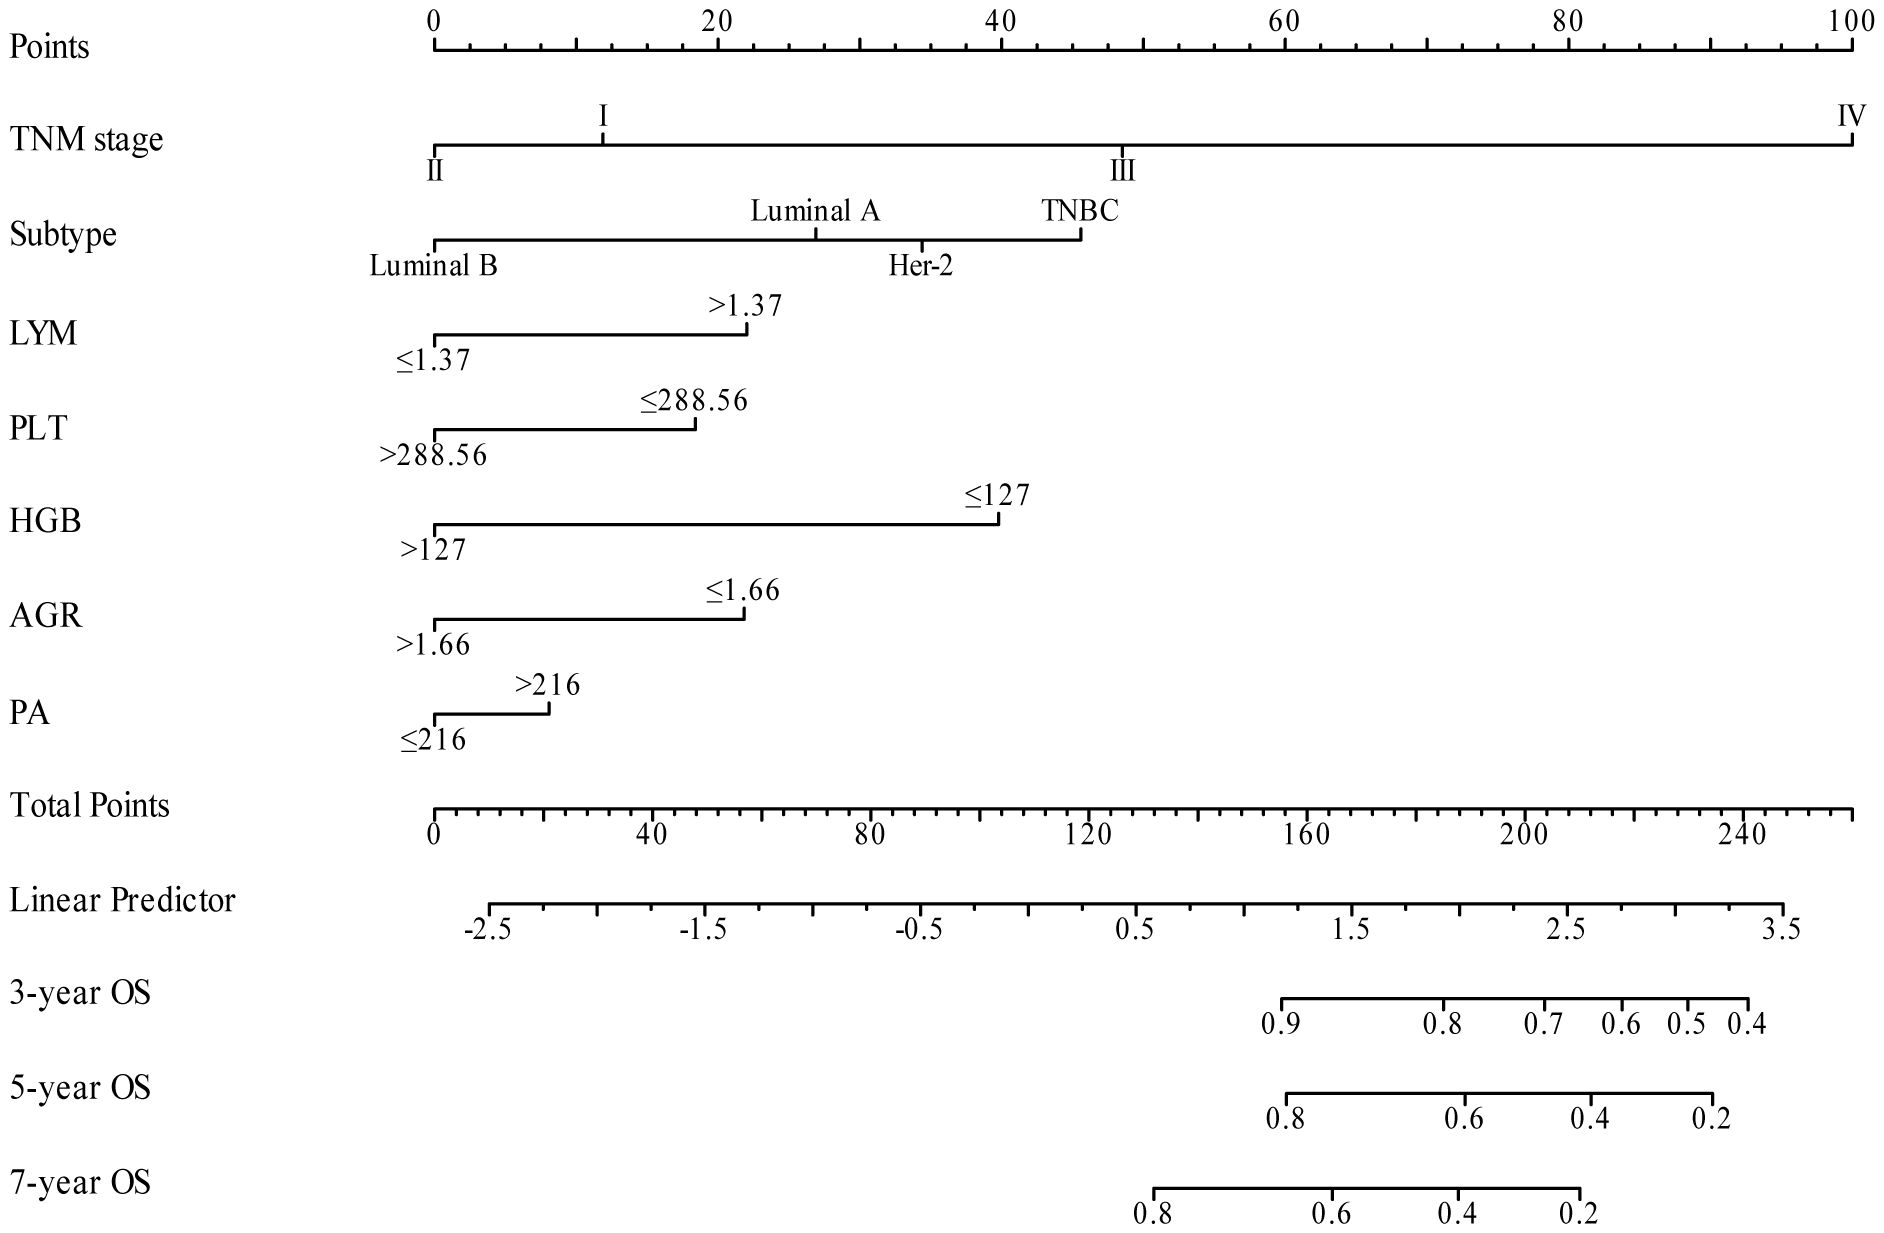
Figure 8 Nomogram model for predicting 3-year, 5-year, and 7-year OS in BC patients within the external validation cohort.
4 Discussion
In the present study, we constructed and confirmed a nomogram model that combines easily accessible inflammation and nutritional factors, and clinicopathological variables to predict OS and DFS in BC patients. The nomogram presented superior predictive accuracy, discriminative ability, and clinical usefulness compared to the traditional TNM stage system. Clinicians can utilize this nomogram to guide treatment decisions, monitor disease progression, and provide personalized patient care.
A growing body of research has demonstrated that inflammation and nutritional status play important roles in both tumor development and patient prognosis (39, 40). Inflammatory responses play a key role in the tumor microenvironment in regulating tumor growth, metastasis and treatment resistance (12). Nutritional status directly affects the immune function, metabolic status and physiological regulation of the patient, resulting in their resistance to tumor and therapeutic response (41). This study found that inflammatory (LYM, PLT) and nutritional (HGB, AGR, PA) indicators were strongly associated with BC prognosis. Watanabe J et al. and Kazuhiro Araki et al. discovered that elevated LYM levels are associated with an improved response to chemotherapies in metastatic BC patients (42, 43). Sung Min Ko et al. reported that LYM was a strong predictor of DFS in BC patients (44), which is consistent with our results. LYM plays a crucial role in anti-tumor immunity by inducing tumor cell apoptosis and is one of the key factors in immune surveillance and immune editing (45, 46).They combat tumors through multiple mechanisms, including the activation of cytotoxic T cells and natural killer (NK) cells, which directly target and eliminate tumor cells. Additionally, lymphocytes secrete cytokines such as interferon-gamma (IFN-γ and tumor necrosis factor-alpha (TNF-α which enhance the anti-tumor activity of other immune cells. These cytokines modulate the tumor microenvironment by promoting an immune-activating milieu and inhibiting tumor growth and metastasis (47, 48). Some studies have also shown that a low LYM may be the cause of inadequate immune response and the result of low survival rates in many types of cancer. This immune deficiency may lead to increased tumor proliferation and metastasis and reduced response to therapeutic interventions (49). Therefore, the immune response to breast tumors could vary depending on the composition of lymphocytes, which ultimately affects prognosis. Further research is needed on the mechanism of peripheral lymphocytes affecting BC. Discoveries have uncovered that PLTs function in inflammatory diseases and malignant tumors (50, 51). PLTs are closely associated with tumor cells and play a crucial role in the key stage of cancer metastasis. PLT regulates immune responses in the tumor microenvironment by secreting a variety of cytokines and growth factors (e.g., transforming growth factor-β, TGF-β). TGF-β not only inhibits the proliferation and function of lymphocytes, weakening the body’s immune surveillance and immune editing ability but also promotes the growth and invasion of tumor cells, thus inhibiting the anti-tumor activity of immune cells (52). Through the release of cytokines, tumor cells activate platelets, promoting the extravasation and spread of cancer cells and negatively correlates with survival prognosis (53, 54). Notably, in our study, platelets were an independent prognostic factor of BC, which was also confirmed by the study of Liefaard, M. C. et al. and Graziano, V. et al (55, 56). Changes in LYM and platelets PLT, as indicators of inflammation, not only directly affect the immune response, but also indirectly influence tumor progression by affecting the nutritional status. Our research indicates that HGB is a potential prognostic indicator for BC. A study by Michael Henke et al. showed that HGB concentration affects the prognosis of patients with early BC, which corresponds to our results (57). Several investigations indicated anemia and HGB play a pivotal role in malignant progression (58, 59). An important factor contributing to tumor hypoxia is the reduced oxygen transport capacity in the blood resulting from tumor-related and/or treatment-related anemia, which is a frequent complication seen in cancer patients (59, 60). HGB is an important prognostic indicator of nutritional status and hypoxia in cancer patients. Hence, it is essential to elucidate the underlying mechanisms of HGB that affect BC. In cancer patients, changes in the AGR are closely related to prognosis (61). Cancer-related chronic inflammation and malnutrition typically lead to a decrease in AGR, primarily by reducing albumin levels and increasing globulin levels. A low AGR usually indicates poor prognosis, higher recurrence rates, and shorter survival times (62). In the present study, few studies have systematically examined the connection between BC and AGR (63, 64). Basem N. Azab has shown that pretreatment AGR is an independent, significant predictor of long-term mortality in BC patients (65). Additionally, this research demonstrates that AGR is an independent predictive factor for BC. PA, also known as transthyretin, is a thyroid hormone transport protein synthesized by the liver and partially degraded by the kidneys; its primary function is thyroxine transport. Serum PA concentrations less than 10 mg/dL are associated with malnutrition (66). PA is more sensitive to acute changes in protein balance and reacts to nutrition (67, 68). Numerous studies indicate that PA is a helpful single parameter for assessing protein-energy malnutrition, including postoperative outcomes and recurrence of non-small cell lung cancer (69, 70). Our research also revealed the prognostic significance of PA in BC. We have determined a comprehensive and systematic assessment, combining inflammation and nutritional blood markers, to evaluate their impact on the prognosis of BC.
Our nomogram demonstrated a significant improvement in predicting OS and DFS of BC patients compared to the TNM stage system. The model was further validated in an independent external cohort, confirming its reliability and reproducibility. Currently, several prognostic models are accessible for the clinical assessment of BC patients (71). Jeongmin Lee et al. and Xuanyi Wang et al. both developed a prognostic model based on radiomics to predict the DFS in BC patients, achieving a C-index of 0.63 and 0.82, respectively (72, 73). There are also nomograms based on molecular testing, gene expression profiling, and RNA sequencing data that can provide accurate predictions for BC patients. For instance, Jie Sun et al. created a model to predict BC risk in BRCA gene carriers, but in an empirical investigation, their C index was only 0.711 (74). MammaPrint test on 70 genes proved useful for early-stage BC treatment decisions (75), the C-index of the model for predicting OS was 0.614 (76). Liu Z. et al. developed a nomogram composed of 7-lncRNA signatures associated with immune invasion and tumor mutation burden in BC (77). However, molecular testing, gene expression profiling, and RNA sequencing data were not included in our model due to their requirement for highly specialized testing facilities, which entail high costs and necessitate skilled personnel for operation, thereby limiting their applicability. Our nomogram achieved a C-index of 0.820 for OS and 0.76 for DFS in the training cohort, which is relatively high compared to the analyses described above. Notably, in our study, the acquisition of hematological indicators is generally non-invasive, simpler, and more cost-effective, making them suitable for dynamic monitoring. These indicators can reflect changes in the patient’s condition and provide comprehensive information on systemic status, including inflammatory responses, immune function, and nutritional status. In contrast, radiomics may involve the use of radiation or contrast agents, posing certain risks and discomfort. Moreover, radiomics can only provide structural information for specific sites and typically requires longer intervals between repeated assessments. Our prediction models can be cheaper, more accurate, and simpler to use in primary hospitals compared to these models. We developed a nomogram to predict 3-year, 5-year, and 7-year OS and DFS for BC patients in both training and validation cohorts. This tool aids clinicians in estimating individual survival probabilities with greater precision. Our nomogram demonstrates better prognostic accuracy and clinical utility. This prognostic model can be of great clinical value for patient management, risk stratification, therapeutic options, and postoperative monitoring strategies.
Despite the excellent discrimination ability of our nomogram, our research has its limitations. First, as with any retrospective study analysis, there is a potential risk of selection bias. Second, despite the use of an independent external validation cohort in this study, further research involving a multi-center prospective study with a larger dataset is warranted. Third, due to the limitations of our database, we are unable to incorporate genetic variables such as BRCA1/2 and P53 into our current model. We plan to explore and collect additional genetic and molecular marker data in future research to improve predictive accuracy and provide deeper insights into the biological complexity of BC.
5 Conclusion
Our study successfully developed a predictive nomogram for OS and DFS in BC patients by incorporating inflammation, nutritional factors, and pathologic, which showed greater precision than the conventional TNM staging system. The nomogram in this study was validated using independent cohorts from different institutions. Independent validation of the model with a C-index greater than 0.7 indicates that our model exhibits good performance in terms of robustness and reliability. The nomogram is a straightforward, low-cost, and useful tool that can assist clinicians with choosing therapies and patient counseling. Further analysis and validation studies are warranted to refine and improve the nomogram, taking into account the limitations mentioned above, and to establish its usefulness in clinical practice.
Data availability statement
The original contributions presented in the study are included in the article/supplementary material. Further inquiries can be directed to the corresponding authors.
Ethics statement
The studies involving humans were approved by Guangxi Medical University Cancer Hospital Ethical Review Committee; Guangxi Zhuang Autonomous Region Maternal and Child Health Care Hospital Ethical Review Committee. The studies were conducted in accordance with the local legislation and institutional requirements. The participants provided their written informed consent to participate in this study.
Author contributions
CW: Writing – original draft, Investigation, Methodology, Software. HA: Software, Writing – original draft, Data curation, Formal analysis, Validation. DM: Methodology, Supervision, Visualization, Writing – original draft. PW: Formal analysis, Resources, Writing – original draft, Data curation. LW: Formal analysis, Resources, Writing – original draft. ZL: Writing – original draft, Validation. PL: Validation, Writing – original draft. TH: Writing – original draft, Visualization, Writing – review & editing. ML: Writing – original draft, Writing – review & editing, Conceptualization.
Funding
The author(s) declare financial support was received for the research, authorship, and/or publication of this article. This work was supported by grants from National Science Foundation of Guangxi (2022GXNSFAA035510), National Science Foundation of China (81760530), and Postdoctoral Science Foundation of China (2021M693803).
Acknowledgments
The authors gratefully acknowledge each editor and reviewer for their efforts on this study.
Conflict of interest
The authors declare that the research was conducted in the absence of any commercial or financial relationships that could be construed as a potential conflict of interest.
Publisher’s note
All claims expressed in this article are solely those of the authors and do not necessarily represent those of their affiliated organizations, or those of the publisher, the editors and the reviewers. Any product that may be evaluated in this article, or claim that may be made by its manufacturer, is not guaranteed or endorsed by the publisher.
Abbreviations
BC, Breast cancer; TNM, tumor-node-metastasis staging; HR, Hazard ratio; CI, Confidence interval; OS, Overall survival; DFS, Disease free survival, IDC, Invasive ductal carcinoma; ILC, Invasive lobular carcinoma; NLR, Neutrophil–lymphocyte ratio; PLR, Platelet–lymphocyte ratio; LMR, Lymphocyte-to-monocyte ratio; PLT, Platelet count; MON, Monocyte; NEU, Neutrophil; LYM, Lymphocyte; ALB, Albumin; HGB, Hemoglobin; TRF, Transferrin, TP, Total albumin; AGR, Albumin to globulin; PA, Prealbumin; SF, Serum ferritin
References
1. Nolan E, Lindeman GJ, Visvader JE. Deciphering breast cancer: from biology to the clinic. Cell. (2023) 186:1708–28. doi: 10.1016/j.cell.2023.01.040
2. Siegel RL, Miller KD, Wagle NS, Jemal A. Cancer statistics, 2023. CA Cancer J Clin. (2023) 73:17–48. doi: 10.3322/caac.21763
3. Mutebi M, Anderson BO, Duggan C, Adebamowo C, Agarwal G, Ali Z, et al. Breast cancer treatment: A phased approach to implementation. Cancer. (2020) 126 Suppl 10:2365–78. doi: 10.1002/cncr.32910
4. Blondeaux E, Arecco L, Punie K, Graffeo R, Toss A, De Angelis C, et al. Germline Tp53 pathogenic variants and breast cancer: A narrative review. Cancer Treat Rev. (2023) 114:102522. doi: 10.1016/j.ctrv.2023.102522
5. Barzaman K, Karami J, Zarei Z, Hosseinzadeh A, Kazemi MH, Moradi-Kalbolandi S, et al. Breast cancer: biology, biomarkers, and treatments. Int Immunopharmacol. (2020) 84:106535. doi: 10.1016/j.intimp.2020.106535
6. Chen MT, Sun HF, Zhao Y, Fu WY, Yang LP, Gao SP, et al. Comparison of patterns and prognosis among distant metastatic breast cancer patients by age groups: A seer population-based analysis. Sci Rep. (2017) 7:9254. doi: 10.1038/s41598-017-10166-8
7. Amin MB, Greene FL, Edge SB, Compton CC, Gershenwald JE, Brookland RK, et al. The eighth edition ajcc cancer staging manual: continuing to build a bridge from a population-based to a more “Personalized” Approach to cancer staging. CA Cancer J Clin. (2017) 67:93–9. doi: 10.3322/caac.21388
8. Adam MA, Thomas S, Roman SA, Hyslop T, Sosa JA. Rethinking the current american joint committee on cancer Tnm staging system for medullary thyroid cancer. JAMA Surg. (2017) 152:869–76. doi: 10.1001/jamasurg.2017.1665
9. Januskeviciene I, Petrikaite V. Heterogeneity of breast cancer: the importance of interaction between different tumor cell populations. Life Sci. (2019) 239:117009. doi: 10.1016/j.lfs.2019.117009
10. Turashvili G, Brogi E. Tumor heterogeneity in breast cancer. Front Med (Lausanne). (2017) 4:227. doi: 10.3389/fmed.2017.00227
11. Yeo SK, Guan JL. Breast cancer: multiple subtypes within a tumor? Trends Cancer. (2017) 3:753–60. doi: 10.1016/j.trecan.2017.09.001
12. Zhao H, Wu L, Yan G, Chen Y, Zhou M, Wu Y, et al. Inflammation and tumor progression: signaling pathways and targeted intervention. Signal Transduct Target Ther. (2021) 6:263. doi: 10.1038/s41392-021-00658-5
13. Xie H, Ruan G, Ge Y, Zhang Q, Zhang H, Lin S, et al. Inflammatory burden as a prognostic biomarker for cancer. Clin Nutr. (2022) 41:1236–43. doi: 10.1016/j.clnu.2022.04.019
14. Greten FR, Grivennikov SI. Inflammation and cancer: triggers, mechanisms, and consequences. Immunity. (2019) 51:27–41. doi: 10.1016/j.immuni.2019.06.025
15. Manjili SH, Isbell M, Ghochaghi N, Perkinson T, Manjili MH. Multifaceted functions of chronic inflammation in regulating tumor dormancy and relapse. Semin Cancer Biol. (2022) 78:17–22. doi: 10.1016/j.semcancer.2021.03.023
16. Takahashi M, Sowa T, Tokumasu H, Gomyoda T, Okada H, Ota S, et al. Comparison of three nutritional scoring systems for outcomes after complete resection of non-small cell lung cancer. J Thorac Cardiovasc Surg. (2021) 162:1257–68 e3. doi: 10.1016/j.jtcvs.2020.06.030
17. Lin F, Xia W, Chen M, Jiang T, Guo J, Ouyang Y, et al. A prognostic model based on nutritional risk index in operative breast cancer. Nutrients. (2022) 14(18):3783. doi: 10.3390/nu14183783
18. Kubrak C, Martin L, Gramlich L, Scrimger R, Jha N, Debenham B, et al. Prevalence and prognostic significance of malnutrition in patients with cancers of the head and neck. Clin Nutr. (2020) 39:901–9. doi: 10.1016/j.clnu.2019.03.030
19. Arends J, Baracos V, Bertz H, Bozzetti F, Calder PC, Deutz NEP, et al. Espen expert group recommendations for action against cancer-related malnutrition. Clin Nutr. (2017) 36:1187–96. doi: 10.1016/j.clnu.2017.06.017
20. Dolan RD, McMillan DC. The prevalence of cancer associated systemic inflammation: implications of prognostic studies using the glasgow prognostic score. Crit Rev Oncol Hematol. (2020) 150:102962. doi: 10.1016/j.critrevonc.2020.102962
22. Baracos VE. Cancer-associated malnutrition. Eur J Clin Nutr. (2018) 72:1255–9. doi: 10.1038/s41430-018-0245-4
23. Cho U, Park HS, Im SY, Yoo CY, Jung JH, Suh YJ, et al. Prognostic value of systemic inflammatory markers and development of a nomogram in breast cancer. PloS One. (2018) 13:e0200936. doi: 10.1371/journal.pone.0200936
24. Deng Q, He B, Liu X, Yue J, Ying H, Pan Y, et al. Prognostic value of pre-operative inflammatory response biomarkers in gastric cancer patients and the construction of a predictive model. J Transl Med. (2015) 13:66. doi: 10.1186/s12967-015-0409-0
25. Li B, Deng H, Zhou Z, Tang B. The prognostic value of the fibrinogen to pre-albumin ratio in Malignant tumors of the digestive system: A systematic review and meta-analysis. Cancer Cell Int. (2022) 22:22. doi: 10.1186/s12935-022-02445-w
26. Quhal F, Pradere B, Laukhtina E, Sari Motlagh R, Mostafaei H, Mori K, et al. Prognostic value of albumin to globulin ratio in non-muscle-invasive bladder cancer. World J Urol. (2021) 39:3345–52. doi: 10.1007/s00345-020-03586-1
27. Tang S, Lin L, Cheng J, Zhao J, Xuan Q, Shao J, et al. The prognostic value of preoperative fibrinogen-to-prealbumin ratio and a novel Ffc score in patients with resectable gastric cancer. BMC Cancer. (2020) 20:382. doi: 10.1186/s12885-020-06866-6
28. Xu SS, Li S, Xu HX, Li H, Wu CT, Wang WQ, et al. Haemoglobin, albumin, lymphocyte and platelet predicts postoperative survival in pancreatic cancer. World J Gastroenterol. (2020) 26:828–38. doi: 10.3748/wjg.v26.i8.828
29. Chen Y, Chen K, Xiao X, Nie Y, Qu S, Gong C, et al. Pretreatment neutrophil-to-lymphocyte ratio is correlated with response to neoadjuvant chemotherapy as an independent prognostic indicator in breast cancer patients: A retrospective study. BMC Cancer. (2016) 16:320. doi: 10.1186/s12885-016-2352-8
30. Lin S, Mo H, Li Y, Guan X, Chen Y, Wang Z, et al. Development and validation of a nomogram for predicting survival of advanced breast cancer patients in China. Breast. (2020) 53:172–80. doi: 10.1016/j.breast.2020.08.004
31. Yu Y, Tan Y, Xie C, Hu Q, Ouyang J, Chen Y, et al. Development and validation of a preoperative magnetic resonance imaging radiomics-based signature to predict axillary lymph node metastasis and disease-free survival in patients with early-stage breast cancer. JAMA Netw Open. (2020) 3:e2028086. doi: 10.1001/jamanetworkopen.2020.28086
32. Xie X, Tan W, Chen B, Huang X, Peng C, Yan S, et al. Preoperative prediction nomogram based on primary tumor mirnas signature and clinical-related features for axillary lymph node metastasis in early-stage invasive breast cancer. Int J Cancer. (2018) 142:1901–10. doi: 10.1002/ijc.31208
33. Hua X, Duan F, Zhai W, Song C, Jiang C, Wang L, et al. A novel inflammatory-nutritional prognostic scoring system for patients with early-stage breast cancer. J Inflammation Res. (2022) 15:381–94. doi: 10.2147/JIR.S338421
34. Jiang C, Xiu Y, Yu X, Qiao K, Zhang S, Huang Y. Prognostic value of a modified systemic inflammation score in breast cancer patients who underwent neoadjuvant chemotherapy. BMC Cancer. (2022) 22:1249. doi: 10.1186/s12885-022-10291-2
35. Pan X, Yang W, Chen Y, Tong L, Li C, Li H. Nomogram for predicting the overall survival of patients with inflammatory breast cancer: A seer-based study. Breast. (2019) 47:56–61. doi: 10.1016/j.breast.2019.05.015
36. Tang Y, Zhang YJ, Zhang N, Shi M, Wen G, Cheng J, et al. Nomogram predicting survival as a selection criterion for postmastectomy radiotherapy in patients with T1 to T2 breast cancer with 1 to 3 positive lymph nodes. Cancer. (2020) 126 Suppl 16:3857–66. doi: 10.1002/cncr.32963
37. Huang Z, Shi M, Wang WH, Shen LF, Tang Y, Rong QL, et al. A novel nomogram for predicting locoregional recurrence risk in breast cancer patients treated with neoadjuvant chemotherapy and mastectomy. Radiother Oncol. (2021) 161:191–7. doi: 10.1016/j.radonc.2021.06.015
38. Giuliano AE, Edge SB, Hortobagyi GN. Eighth edition of the Ajcc cancer staging manual: breast cancer. Ann Surg Oncol. (2018) 25:1783–5. doi: 10.1245/s10434-018-6486-6
39. Borre M, Dam GA, Knudsen AW, Grønbaek H. Nutritional status and nutritional risk in patients with neuroendocrine tumors. Scand J Gastroenterol. (2018) 53:284–92. doi: 10.1080/00365521.2018.1430848
40. Fankhauser CD, Sander S, Roth L, Gross O, Eberli D, Sulser T, et al. Systemic inflammatory markers have independent prognostic value in patients with metastatic testicular germ cell tumours undergoing first-line chemotherapy. Br J Cancer. (2018) 118:825–30. doi: 10.1038/bjc.2017.467
41. Newsholme P. Cellular and metabolic mechanisms of nutrient actions in immune function. Nutr Diabetes. (2021) 11:22. doi: 10.1038/s41387-021-00162-3
42. Araki K, Ito Y, Fukada I, Kobayashi K, Miyagawa Y, Imamura M, et al. Predictive impact of absolute lymphocyte counts for progression-free survival in human epidermal growth factor receptor 2-positive advanced breast cancer treated with pertuzumab and trastuzumab plus eribulin or Nab-paclitaxel. BMC Cancer. (2018) 18:982. doi: 10.1186/s12885-018-4888-2
43. Watanabe J, Saito M, Horimoto Y, Nakamoto S. A maintained absolute lymphocyte count predicts the overall survival benefit from eribulin therapy, including eribulin re-administration, in Her2-negative advanced breast cancer patients: A single-institutional experience. Breast Cancer Res Treat. (2020) 181:211–20. doi: 10.1007/s10549-020-05626-1
44. Ko SM, Lee J, Bae SJ, Baik SJ, Ji J, Kim D, et al. Body mass index and absolute lymphocyte count predict disease-free survival in Korean breast cancer patients. Br J Cancer. (2021) 125:119–25. doi: 10.1038/s41416-021-01391-0
45. Dunn GP, Old LJ, Schreiber RD. The immunobiology of cancer immunosurveillance and immunoediting. Immunity. (2004) 21:137–48. doi: 10.1016/j.immuni.2004.07.017
46. Zhang Y, Zhang Z. The history and advances in cancer immunotherapy: understanding the characteristics of tumor-infiltrating immune cells and their therapeutic implications. Cell Mol Immunol. (2020) 17:807–21. doi: 10.1038/s41423-020-0488-6
47. Dupré A, Malik HZ. Inflammation and cancer: what a surgical oncologist should know. Eur J Surg Oncol. (2018) 44:566–70. doi: 10.1016/j.ejso.2018.02.209
48. Ménétrier-Caux C, Ray-Coquard I, Blay JY, Caux C. Lymphopenia in cancer patients and its effects on response to immunotherapy: an opportunity for combination with cytokines? J Immunother Cancer. (2019) 7:85. doi: 10.1186/s40425-019-0549-5
49. Hoffmann TK, Dworacki G, Tsukihiro T, Meidenbauer N, Gooding W, Johnson JT, et al. Spontaneous apoptosis of circulating T lymphocytes in patients with head and neck cancer and its clinical importance. Clin Cancer Res. (2002) 8:2553–62.
50. Stone RL, Nick AM, McNeish IA, Balkwill F, Han HD, Bottsford-Miller J, et al. Paraneoplastic thrombocytosis in ovarian cancer. N Engl J Med. (2012) 366:610–8. doi: 10.1056/NEJMoa1110352
51. van der Meijden PEJ, Heemskerk JWM. Platelet biology and functions: new concepts and clinical perspectives. Nat Rev Cardiol. (2019) 16:166–79. doi: 10.1038/s41569-018-0110-0
52. Li S, Lu Z, Wu S, Chu T, Li B, Qi F, et al. The dynamic role of platelets in cancer progression and their therapeutic implications. Nat Rev Cancer. (2024) 24:72–87. doi: 10.1038/s41568-023-00639-6
53. Marin C, Garcia-Dominguez X, Montoro-Dasi L, Lorenzo-Rebenaque L, Vicente JS, Marco-Jimenez F. Experimental evidence reveals both cross-infection and cross-contamination risk of embryo storage in liquid nitrogen biobanks. Anim (Basel). (2020) 10(4):598. doi: 10.3390/ani10040598
54. Bambace NM, Holmes CE. The platelet contribution to cancer progression. J Thromb Haemost. (2011) 9:237–49. doi: 10.1111/j.1538-7836.2010.04131.x
55. Liefaard MC, Moore KS, Mulder L, van den Broek D, Wesseling J, Sonke GS, et al. Tumour-educated platelets for breast cancer detection: biological and technical insights. Br J Cancer. (2023) 128:1572–81. doi: 10.1038/s41416-023-02174-5
56. Graziano V, Grassadonia A, Iezzi L, Vici P, Pizzuti L, Barba M, et al. Combination of peripheral neutrophil-to-lymphocyte ratio and platelet-to-lymphocyte ratio is predictive of pathological complete response after neoadjuvant chemotherapy in breast cancer patients. Breast. (2019) 44:33–8. doi: 10.1016/j.breast.2018.12.014
57. Henke M, Sindlinger F, Ikenberg H, Gerds T, Schumacher M. Blood hemoglobin level and treatment outcome of early breast cancer. Strahlenther Onkol. (2004) 180:45–51. doi: 10.1007/s00066-004-1123-7
58. Vaupel P, Mayer A. Hypoxia and anemia: effects on tumor biology and treatment resistance. Transfus Clin Biol. (2005) 12:5–10. doi: 10.1016/j.tracli.2004.11.005
59. Vaupel P, Mayer A, Hockel M. Impact of hemoglobin levels on tumor oxygenation: the higher, the better? Strahlenther Onkol. (2006) 182:63–71. doi: 10.1007/s00066-006-1543-7
60. Gilreath JA, Stenehjem DD, Rodgers GM. Diagnosis and treatment of cancer-related anemia. Am J Hematol. (2014) 89:203–12. doi: 10.1002/ajh.23628
61. Chen Z, Shao Y, Yao H, Zhuang Q, Wang K, Xing Z, et al. Preoperative albumin to globulin ratio predicts survival in clear cell renal cell carcinoma patients. Oncotarget. (2017) 8:48291–302. doi: 10.18632/oncotarget.v8i29
62. Li Q, Meng X, Liang L, Xu Y, Cai G, Cai S. High preoperative serum globulin in rectal cancer treated with neoadjunctive chemoradiation therapy is a risk factor for poor outcome. Am J Cancer Res. (2015) 5:2856–64.
63. Liu C, Wang W, Meng X, Sun B, Cong Y, Liu J, et al. Albumin/globulin ratio is negatively correlated with Pd-1 and Cd25 Mrna levels in breast cancer patients. Onco Targets Ther. (2018) 11:2131–9. doi: 10.2147/OTT.S159481
64. Xuan Q, Yang Y, Ji H, Tang S, Zhao J, Shao J, et al. Combination of the preoperative albumin to globulin ratio and neutrophil to lymphocyte ratio as a novel prognostic factor in patients with triple negative breast cancer. Cancer Manag Res. (2019) 11:5125–31. doi: 10.2147/CMAR.S195324
65. Azab BN, Bhatt VR, Vonfrolio S, Bachir R, Rubinshteyn V, Alkaied H, et al. Value of the pretreatment albumin to globulin ratio in predicting long-term mortality in breast cancer patients. Am J Surg. (2013) 206:764–70. doi: 10.1016/j.amjsurg.2013.03.007
66. Keller U. Nutritional laboratory markers in malnutrition. J Clin Med. (2019) 8(6):775. doi: 10.3390/jcm8060775
67. Zhou J, Hiki N, Mine S, Kumagai K, Ida S, Jiang X, et al. Role of prealbumin as a powerful and simple index for predicting postoperative complications after gastric cancer surgery. Ann Surg Oncol. (2017) 24:510–7. doi: 10.1245/s10434-016-5548-x
68. Davis CJ, Sowa D, Keim KS, Kinnare K, Peterson S. The use of prealbumin and C-reactive protein for monitoring nutrition support in adult patients receiving enteral nutrition in an urban medical center. JPEN J Parenter Enteral Nutr. (2012) 36:197–204. doi: 10.1177/0148607111413896
69. Yu PJ, Cassiere HA, Dellis SL, Manetta F, Kohn N, Hartman AR. Impact of preoperative prealbumin on outcomes after cardiac surgery. JPEN J Parenter Enteral Nutr. (2015) 39:870–4. doi: 10.1177/0148607114536735
70. Kawai H, Ota H. Low perioperative serum prealbumin predicts early recurrence after curative pulmonary resection for non-small-cell lung cancer. World J Surg. (2012) 36:2853–7. doi: 10.1007/s00268-012-1766-y
71. Ethier JL, Desautels D, Templeton A, Shah PS, Amir E. Prognostic role of neutrophil-to-lymphocyte ratio in breast cancer: A systematic review and meta-analysis. Breast Cancer Res. (2017) 19:2. doi: 10.1186/s13058-016-0794-1
72. Lee J, Kim SH, Kim Y, Park J, Park GE, Kang BJ. Radiomics nomogram: prediction of 2-year disease-free survival in young age breast cancer. Cancers. (2022) 14(18):4461. doi: 10.3390/cancers14184461
73. Wang X, Xie T, Luo J, Zhou Z, Yu X, Guo X. Radiomics predicts the prognosis of patients with locally advanced breast cancer by reflecting the heterogeneity of tumor cells and the tumor microenvironment. Breast Cancer Res: BCR. (2022) 24:20. doi: 10.1186/s13058-022-01516-0
74. Sun J, Chu F, Pan J, Zhang Y, Yao L, Chen J, et al. Brca-crisk: A contralateral breast cancer risk prediction model for brca carriers. J Clin Oncol. (2023) 41:991–9. doi: 10.1200/JCO.22.00833
75. Cardoso F, van’t Veer LJ, Bogaerts J, Slaets L, Viale G, Delaloge S, et al. 70-gene signature as an aid to treatment decisions in early-stage breast cancer. N Engl J Med. (2016) 375:717–29. doi: 10.1056/NEJMoa1602253
76. Ibraheem A, Olopade OI, Huo D. Propensity score analysis of the prognostic value of genomic assays for breast cancer in diverse populations using the national cancer data base. Cancer. (2020) 126:4013–22. doi: 10.1002/cncr.32956
Keywords: breast cancer, inflammation, nutrition, nomogram, prognosis
Citation: Wei C, Ai H, Mo D, Wang P, Wei L, Liu Z, Li P, Huang T and Liu M (2024) A nomogram based on inflammation and nutritional biomarkers for predicting the survival of breast cancer patients. Front. Endocrinol. 15:1388861. doi: 10.3389/fendo.2024.1388861
Received: 20 February 2024; Accepted: 24 July 2024;
Published: 07 August 2024.
Edited by:
Min Tu, Nanjing Medical University, ChinaReviewed by:
Xiaoqiang Wang, City of Hope, United StatesChun Zhang, Nanjing University of Chinese Medicine, China
Copyright © 2024 Wei, Ai, Mo, Wang, Wei, Liu, Li, Huang and Liu. This is an open-access article distributed under the terms of the Creative Commons Attribution License (CC BY). The use, distribution or reproduction in other forums is permitted, provided the original author(s) and the copyright owner(s) are credited and that the original publication in this journal is cited, in accordance with accepted academic practice. No use, distribution or reproduction is permitted which does not comply with these terms.
*Correspondence: Taijun Huang, MjAyMzIwMzM3QHNyLmd4bXUuZWR1LmNu; Miaofeng Liu, bGl1bWlhb2ZlbmcyMDI0QDEyNi5jb20=
†These authors have contributed equally to this work and share first authorship