
94% of researchers rate our articles as excellent or good
Learn more about the work of our research integrity team to safeguard the quality of each article we publish.
Find out more
ORIGINAL RESEARCH article
Front. Endocrinol., 04 July 2024
Sec. Cardiovascular Endocrinology
Volume 15 - 2024 | https://doi.org/10.3389/fendo.2024.1383489
 Biwei Cheng1,2
 Yumeng Yi1,2
 Mingtai Chen1
 Yi Wei1
 Xuekang Su1,2
 Peiying Chen1,2Xiaojuan Lin1Yanghui Gu1Tao Li1Chong Xu1Qiang Liu1*Biao Li1*
Objective: This study aimed to explore the association between the triglyceride to high-density lipoprotein cholesterol (TG/HDL-C) ratio and the risk and severity of CHD among NAFLD patients.
Methods: This retrospective study included 278 patients with NAFLD and chest pain. The TG/HDL-C ratio was calculated and coronary angiography performed. All individuals were divided into NAFLD + CHD and NAFLD groups. The severity of coronary artery stenosis is quantified using the Gensini score based on angiographic results. In NAFLD patients, the association between the TG/HDL-C ratio and the risk and severity of CHD was explored.
Results: CHD was detected in 139 of 278 patients. Compared to NAFLD group, multivariate logistic regression showed that TG/HDL-C ratio was a risk factor for CHD among NAFLD patients after adjustment for confounding factors with the odds ratio (OR 1.791, 95% CI 1.344–2.386, P<0.001). Further analysis using multivariate logistic regression based on tertiles revealed that, after adjusting for confounding factors, compared to the T1 group, the risk of CHD in the T2 group was 2.17-fold higher (OR, 2.17; 95% CI, 1.07–4.38; P = 0.031). Similarly, the risk of CHD in the T3 group increased by 2.84-fold (OR, 2.84; 95% CI, 1.36–5.94; P = 0.005). The multifactor linear regression analysis showed each 1-unit increase in TG/HDL-C ratio in the NAFLD + CHD group was associated with a 7.75-point increase in Gensini score (β=7.75, 95% CI 5.35–10.15, P<0.001).
Conclusion: The TG/HDL-C ratio was positively correlated with CHD risk and reflected coronary atherosclerosis severity in NAFLD patients.
Coronary heart disease (CHD) is one of the leading causes of death worldwide (1, 2). Hypertension (HTN), diabetes, hyperlipidemia, obesity, and smoking are well-recognized risk factors for CHD. However, studies have found that CHD can still progress in some patients, even when the known risk factors are controlled well. This underscores the critical importance of identifying and managing the residual risks of CHD (3).
Non-alcoholic fatty liver disease (NAFLD), a metabolic disorder affecting the liver, is associated to an elevated risk of cardiovascular disease, although its precise mechanism remains unclear (4).
Insulin resistance (IR) contributes to atherosclerotic plaque formation and elevates the risk of CHD (5). Furthermore, reports indicate a robust association between IR and the progression of NAFLD. However, the correlation between IR and the risk as well as severity of CHD among NAFLD patients is still unclear.
While the high insulin-glucose clamp test is currently the gold standard for diagnosing insulin resistance, its clinical application is often restricted. Alternatively, the triglyceride to high-density lipoprotein cholesterol (TG/HDL-C) ratio has been deemed as a dependable indicator of IR (6). Studies have reported an association between the TG/HDL-C ratio and both increased risk and severity of coronary heart disease (7, 8).
This study aims to compare TG/HDL-C ratios among patients with NAFLD. Furthermore, it investigates the association between insulin resistance and the risk and severity of CHD.
A total of 278 patients with NAFLD were included in this retrospective study. All patients underwent coronary angiography for chest pain between April 2021 and August 2023 at Shenzhen Traditional Chinese Medicine Hospital. All participants were categorized into two groups: NAFLD + CHD and NAFLD, based on the results of coronary angiography.
The diagnostic criteria for NAFLD are outlined in the 2018 Liver Disease Clinic Guidelines (9). Specifically, patients must have no history of alcohol consumption or consume less than 140 g/week of equivalent ethanol (less than 70 g/week for females). Abdominal ultrasound is utilized for assessment, wherein the presence of two out of the following three manifestations indicates diffuse fatty liver disease: (a) Diffuse enhancement of near-field echogenicity in the liver, with echogenicity stronger than that of the renal cortex; (b) Poor visualization of intrahepatic ductal structures; (c) Gradual attenuation of far-field echogenicity in the liver.
The Judkin method (10) was used to record the coronary angiography results, and coronary heart disease was diagnosed when the lumen diameter of the main coronary artery or other vital branches showed stenosis of ≥50%. Gensini Score (GS) is a widely used angiographic scoring system for quantifying the severity of CAD. The GS has been developed to characterize the complexity of CAD taking into consideration 3 main parameters for each coronary lesion: severity score, region multiplying factor and collateral adjustment factor (11, 12). Therefore, in this study, the severity of coronary arteries was quantified using the Gensini Score. Two independent cardiologists, blinded to the study protocol and patient details, determined the Gensini Score via preoperative angiography.
1. Patients with cerebrovascular disease, aortic disease, or who have had a cerebral infarction within the last six months;
2. Patients with severe liver dysfunction, those who have undergone unilateral nephrectomy, or with a malignant tumor or autoimmune disease;
3. Patients who have undergone surgery or a bypass procedure within the previous 3 months;
4. Patients with a urinary tract infection or lung infection within the past month;
5. Pregnant and lactating women, female patients who intend to become pregnant;
6. Patients with mental illness or limited mobility who are unable to cooperate with the examination;
7. Patients with previous stent implantation;
8. Specific diseases known to cause fatty liver, such as viral, drug-induced, genetic, and autoimmune liver diseases.
9. Incomplete clinical data collection.
General clinical information, including age, sex, hypertension (HTN) history, diabetes mellitus (DM) history, smoking history, systolic blood pressure (SBP), diastolic blood pressure (DBP), heart rate (HR), and body mass index (BMI), was collected via the electronic medical record system.
Biochemical parameters such as alanine aminotransferase (ALT), aspartate aminotransferase (AST), serum creatinine (Scr), total cholesterol (TC), triglycerides (TG), high-density lipoprotein cholesterol (HDL-C), low-density lipoprotein cholesterol (LDL-C), and fasting blood glucose (FBG) were obtained from the patients. The TG/HDL-C ratio was calculated. Based on the imaging results, acute myocardial infarction (AMI), acute coronary syndrome (ACS), and the number of stents were recorded, and the Gensini score was calculated.
All data were analyzed using SPSS Statistics version 27.0. And R 4.3 was also used for plotting the ROC. The Shapiro-Wilk test was used to assess the normality of continuous variable distributions. Normally distributed data were presented as mean ± standard deviation, whereas non-normally distributed data were expressed as median (P25, P75). Categorical variables were described in terms of frequency and percentage (%). The Student’s t test and one-way analysis of variance were used for continuous variables, and the chi-square test or Fisher’s exact probability method was used for categorical variables.
Initially, univariate logistic regression analysis was employed to explore the potential predictors of CHD. Subsequently, multivariate analysis was conducted to determine the independent predictors and their effect sizes. Baseline characteristics of tertiles of the TG/HDL-C ratio were compared using t-tests or one-way analysis of variance for continuous variables. For categorical variables, the chi-square test or Fisher’s exact test was applied. The predictive capacity of different TG/HDL-C ratio thresholds for CHD was assessed using receiver operating characteristic (ROC) curve analysis and the corresponding area under the curve (AUC) values.
Data were generated from 278 patients with NAFLD (155 men and 123 women), including 139 participants with CHD and 139 participants without CHD. The mean ages of the NAFLD+CHD and NAFLD groups were 59.89 ± 11.47 years and 57.15 ± 11.76 years, respectively. Table 1 presents the baseline characteristics of both groups. There were no statistically significant differences between the two groups in terms of BMI, HTN, SBP, DBP, ALT, AST, TC, LDL-C, and HR (all P > 0.05). The proportion of males, smokers, and patients with DM was higher in the NAFLD+CHD group. Additionally, the NAFLD+CHD group had a higher mean age, Scr, TG, FBG, and TG/HDL-C ratio, as well as lower HDL-C levels, compared to the NAFLD group (all P < 0.05).
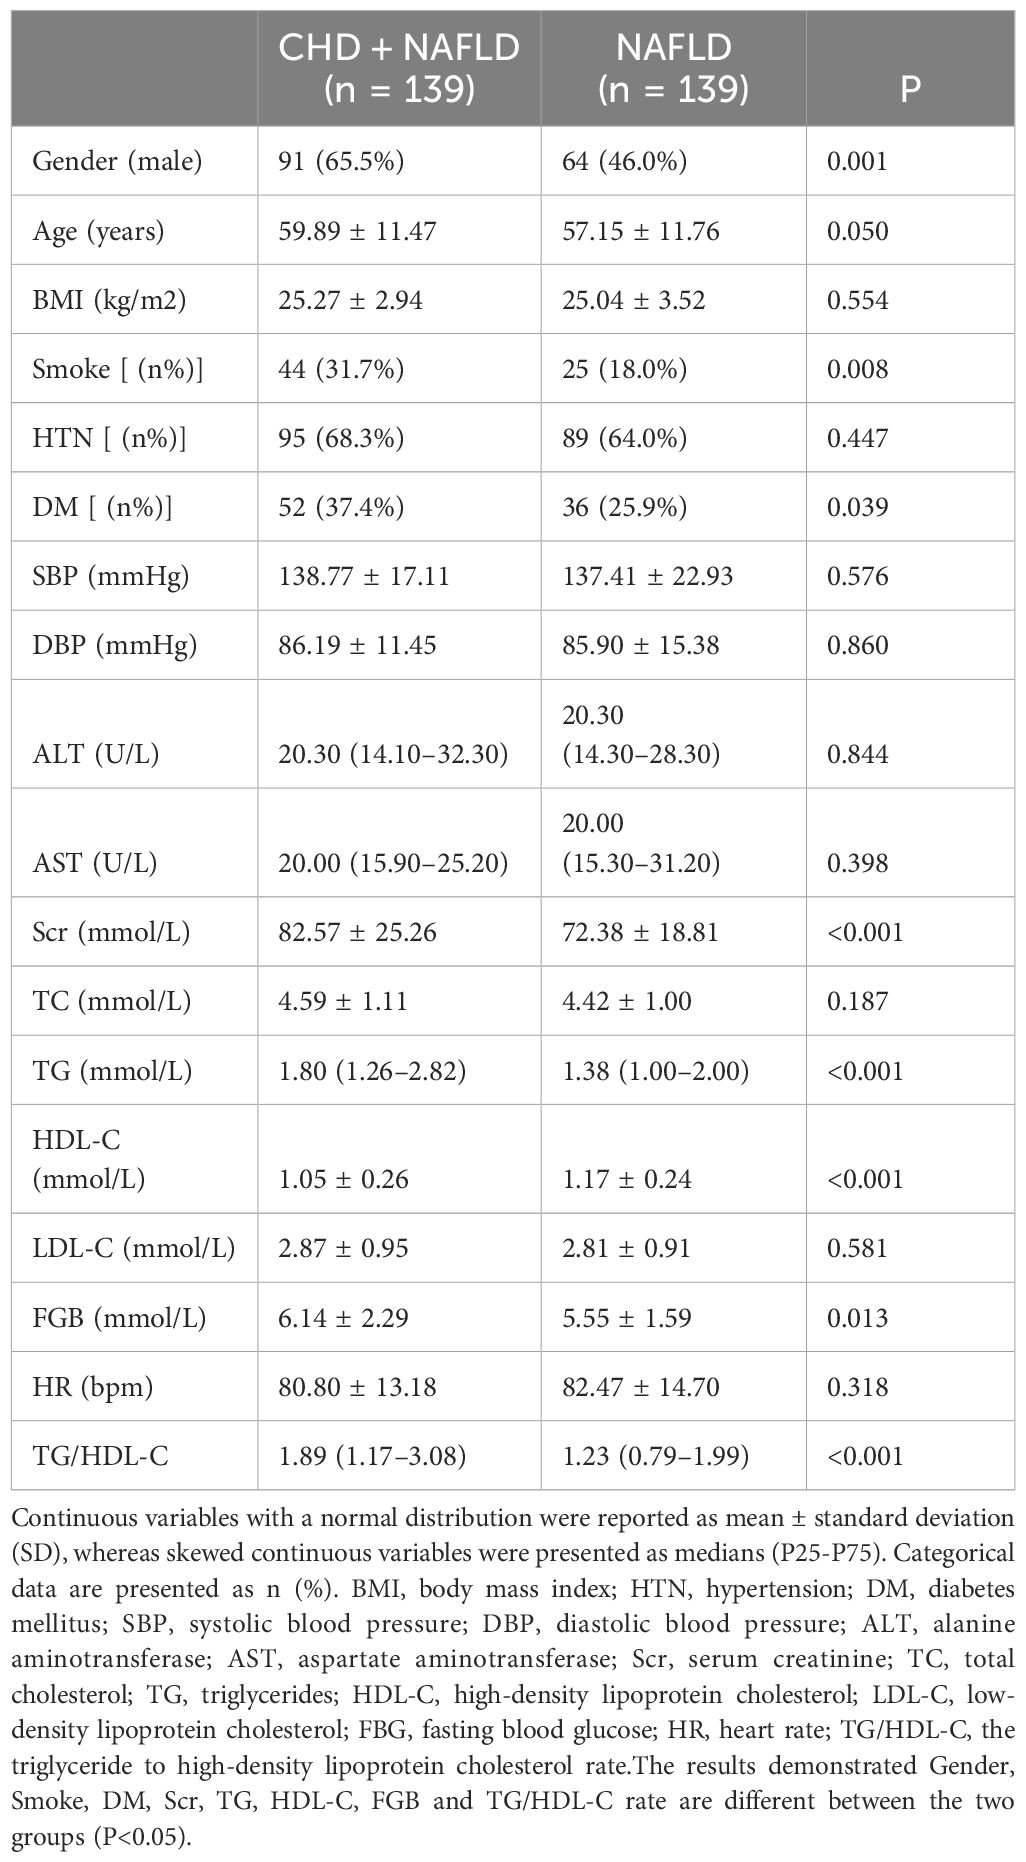
Table 1 Baseline characteristics of NAFLD+CHD group vs. NAFLD group.
The univariate logistic regression analysis revealed that sex, smoking, DM, AST, Scr, TG, HDL-C, FBG, and the TG/HDL-C ratio were significantly associated with the occurrence of coronary heart disease in patients with NAFLD (all P < 0.05). In the subsequent multivariate logistic regression analysis, sex, age, DM, AST, Scr, FBG, and the TG/HDL-C ratio were included as predictors, while TG and HDL-C, which constitute the TG/HDL-C ratio, were excluded to prevent potential interactions. Multivariate logistic regression analysis demonstrated that age (OR = 1.042, 95% CI = 1.015–1.069, P = 0.002) and the TG/HDL-C ratio (OR = 1.791, 95% CI = 1.344–2.386, P < 0.001) were still risk factors for CHD in NAFLD patients (Table 2).
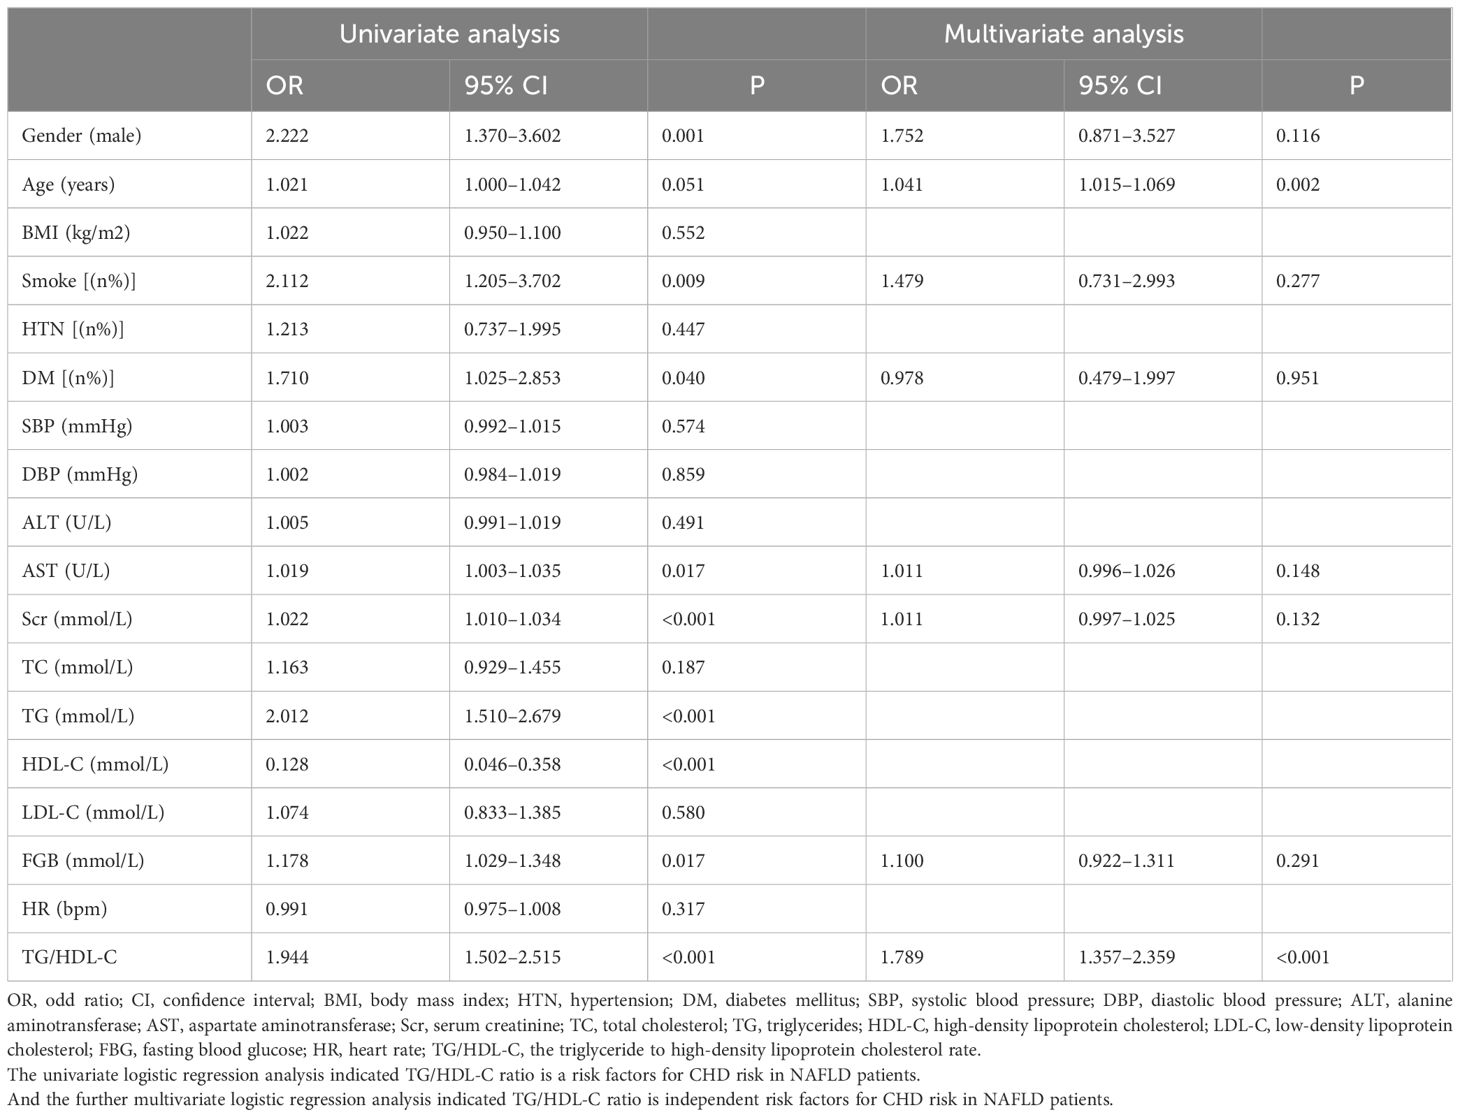
Table 2 Univariate and multivariate logistic regression analysis of coronary heart disease risk in patients with NAFLD.
ROC curves were plotted using whether CHD occurred in NAFLD as the state variable. The results showed that the area under the curve (AUC) for TG was 0.659 (95% CI: 0.596-0.722, P<0.001), with a sensitivity of 0.309 and a specificity of 0.928. The AUC for HDL-C was 0.669 (95% CI: 0.605-0.733, P<0.001), with a sensitivity of 0.583 and specificity was 0.727. The AUC for the TG/HDL-C ratio was 0.677 (95% CI: 0.615-0.740, P<0.001), with a sensitivity of 0.381 and a specificity of 0.878 (Table 3; Figure 1).
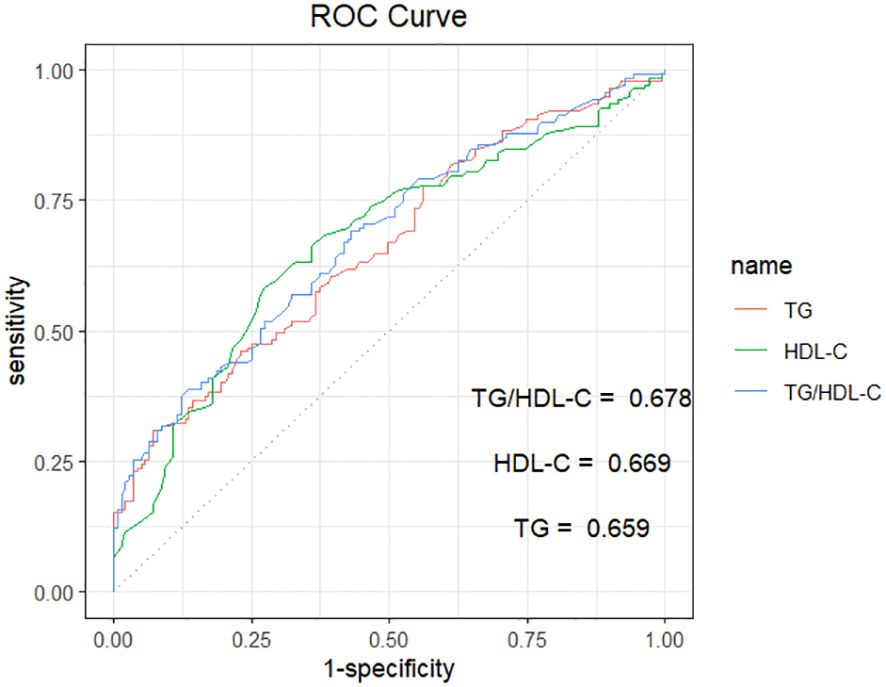
Figure 1 ROC curve analysis of TG、HDL-C、TG/HDL-C in predicting NAFLD with CHD. TG, triglycerides; HDL-C, high-density lipoprotein cholesterol; TG/HDL-C, the triglyceride to high-density lipoprotein cholesterol rate. The AUC for TG, HDL-C, and TG/HDL-C were 0.659, 0.669, and 0.678, respectively.
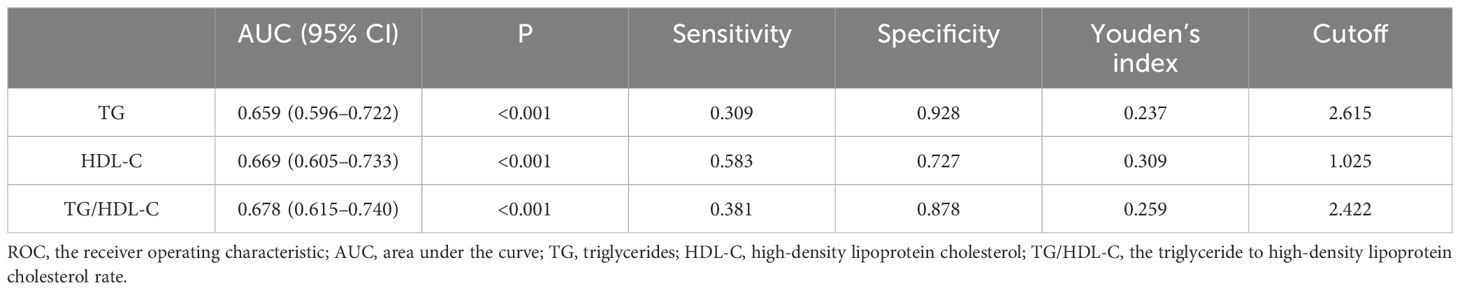
Table 3 ROC curve analysis of TG, HDL-C, TG/HDL-C.
Baseline information based on the tertiles of the TG/HDL-C ratio is shown in Table 4. Compared to the T1 group, a higher proportion of patients with elevated TG/HDL-C ratios were male. These patients exhibited increased prevalence rates of DM, CHD, ACS, and AMI. Furthermore, they underwent more stent implantations. They also had higher BMI, SBP, ALT, AST, Scr, TC, TG, FGB, cTnI levels, and Gensini scores. Additionally, they had lower HDL-C levels (all P < 0.05).
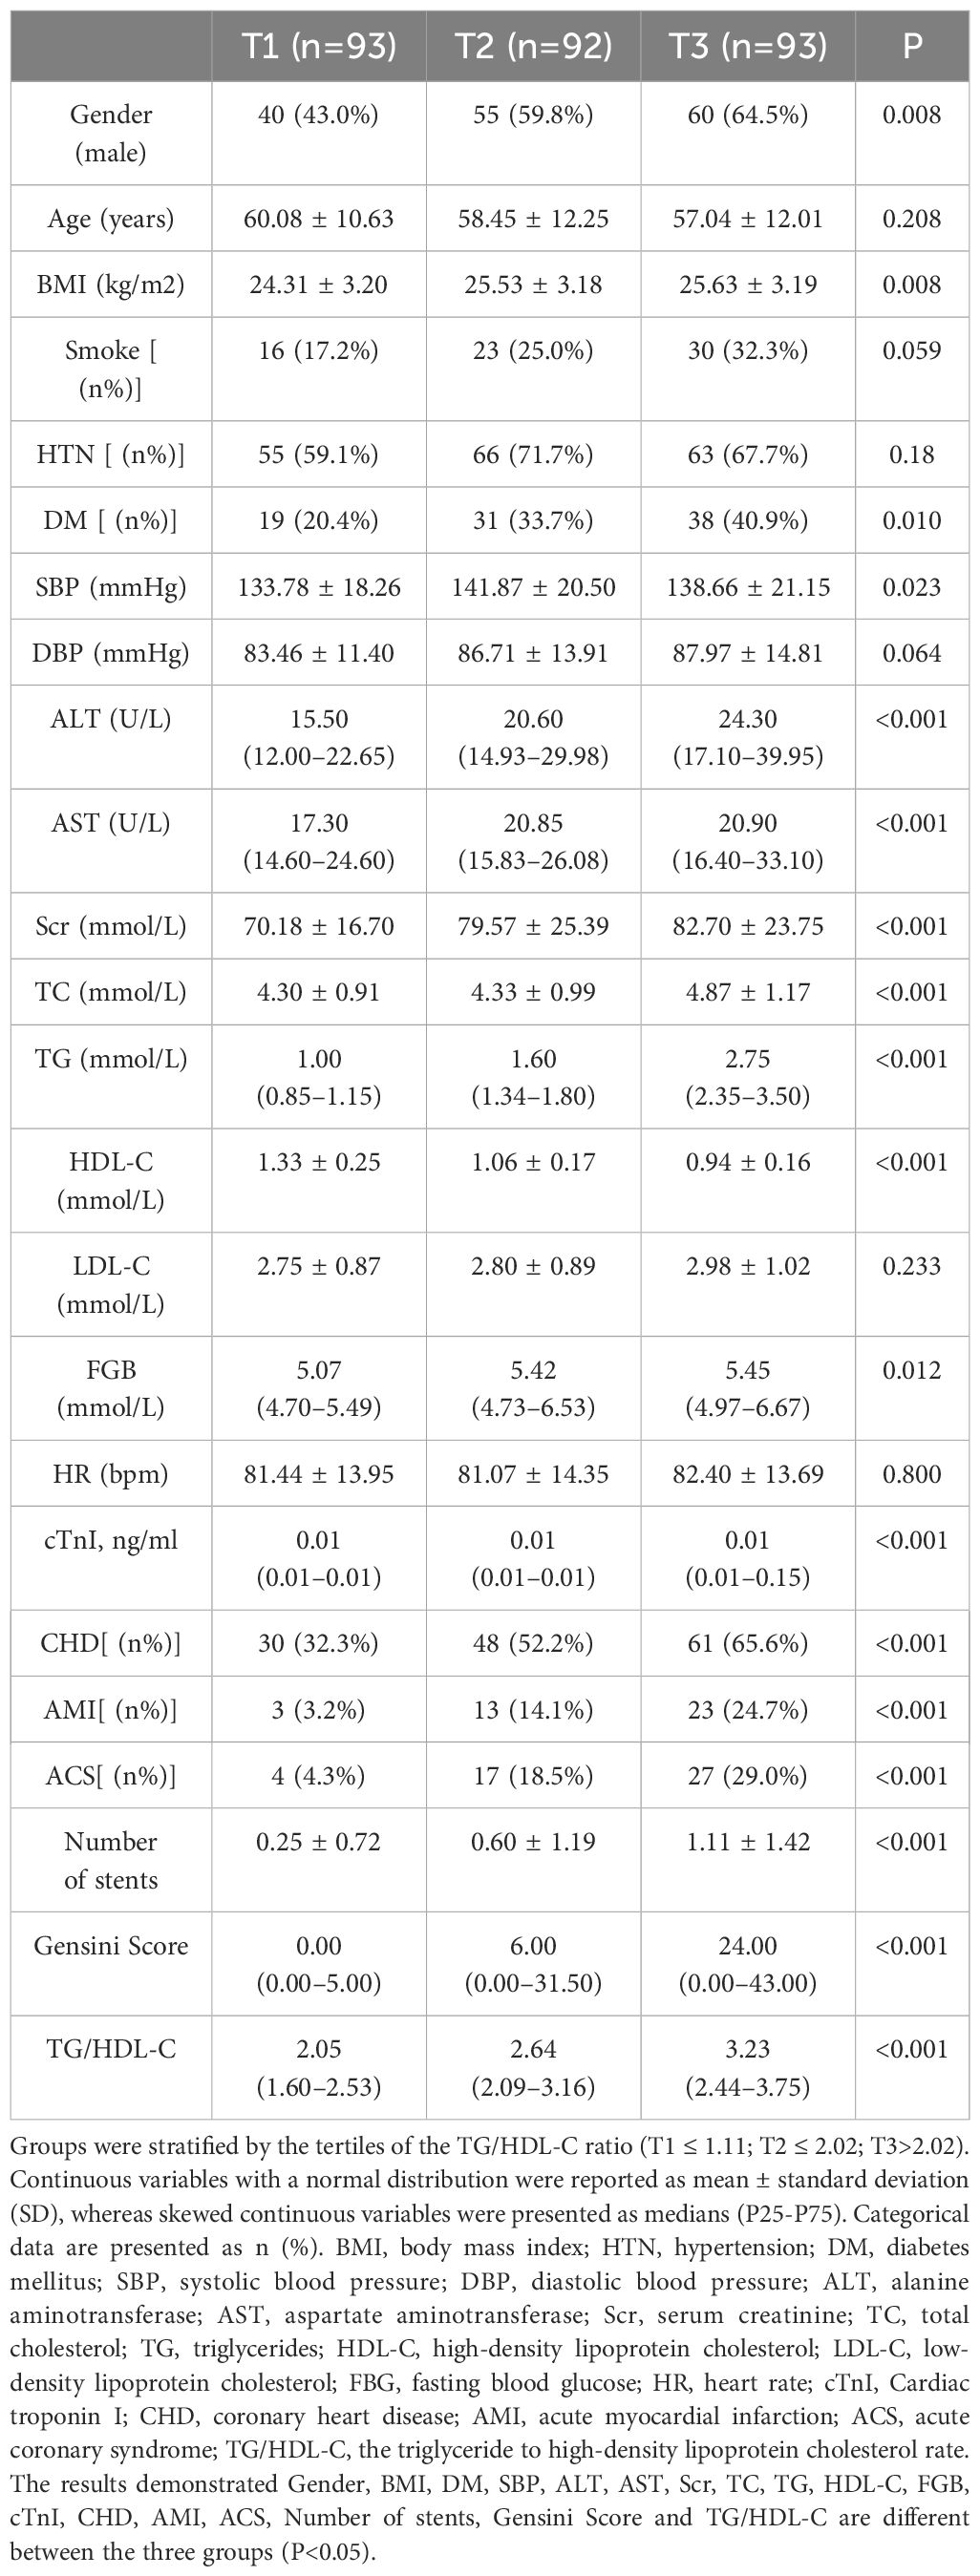
Table 4 Baseline Characteristics Stratified by Tertiles of the TG/HDL-C Ratio.
The results of the logistic regression analyses, comparing T2 and T3 to the control group (T1), are presented in Table 5. In the unadjusted model, the risk of CHD was 1.29-fold higher in the T2 group (OR, 2.29; 95% CI, 1.26–4.16; P=0.006) and 3.0-fold higher in the T3 group (OR, 4.00; 95% CI, 2.18–7.37; P<0.001) compared to the control group.
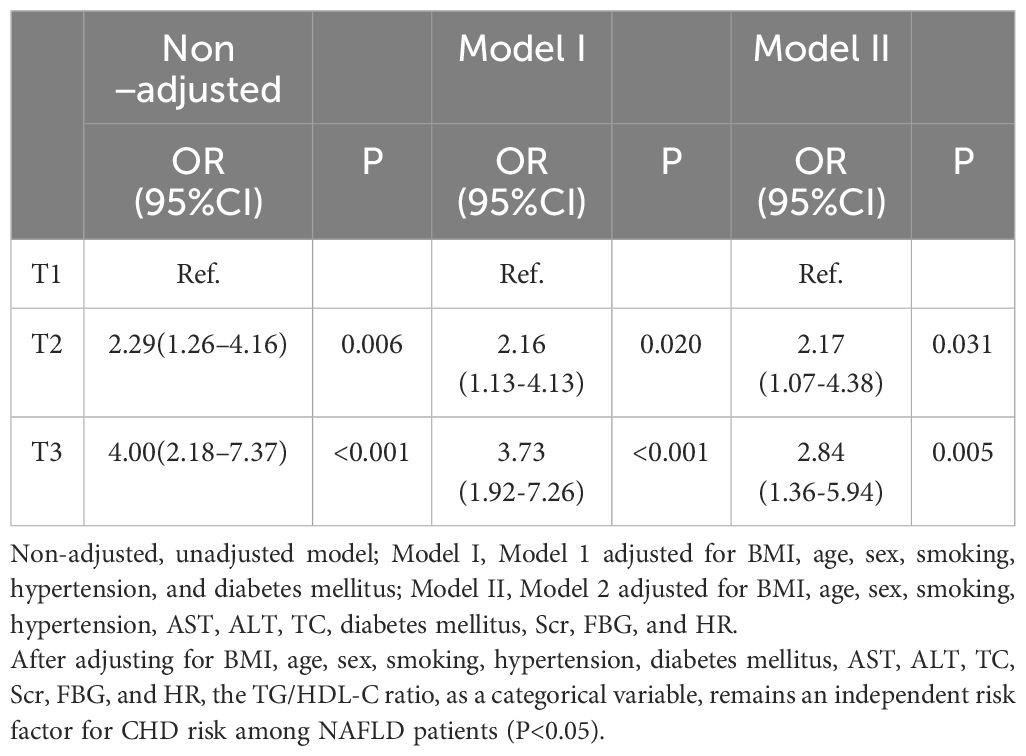
Table 5 Univariate and multivariate logistic regression analyses of tertiles CHD risk for the TG/HDL-C ratio.
After adjusting for BMI, age, sex, smoking, HTN, and DM in Model 1, the risk of CHD increased by 2.16-fold in the T2 group (OR, 2.16; 95% CI, 1.13-4.13; P=0.020) and 3.73-fold in the T3 group (OR, 3.73; 95% CI, 1.92-7.26; P<0.001) compared to the control group.
In Model 2, after further adjusting for AST, ALT, TC, Scr, FBG, and HR, the risk of CHD increased by 2.17-fold in the T2 group (OR, 2.17; 95% CI, 1.07-4.38; P=0.031) and 2.84-fold in the T3 group (OR, 2.84; 95% CI, 1.36-5.94; P=0.005) compared to the control group.
These findings suggest that the risk of CHD in patients with NAFLD significantly increases with elevating TG/HDL-C ratios, independent of BMI, age, sex, smoking, HTN, AST, ALT, TC, DM, Scr, FBG, and HR.
The severity of coronary arteries was assessed using the Gensini score based on coronary angiography results. Furthermore, we examined the potential linear relationship between the TG/HDL-C ratio and the Gensini score. Spearman correlation analysis revealed a significant positive correlation between the TG/HDL-C ratio and the Gensini score (r = 0.475, P < 0.001), suggesting a quantitative association. This finding further implies a linear relationship between the TG/HDL-C ratio and the severity of coronary arteries in patients with NAFLD (Figure 2).
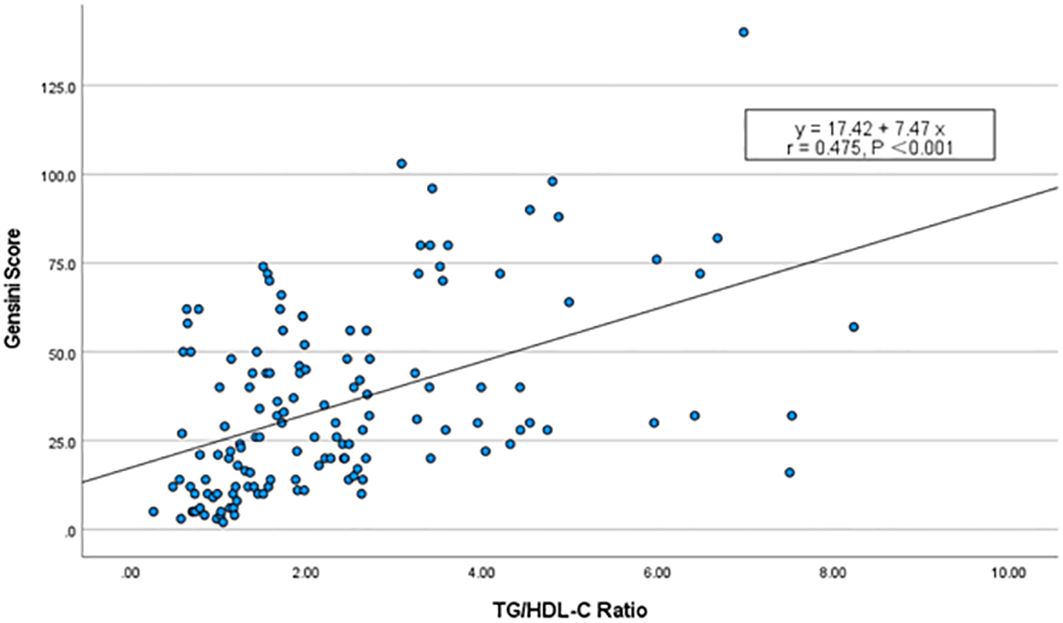
Figure 2 Scatterplot of TG/HDL-C ratio vs. Gensini score. Spearman’s correlation analysis found that there was a significant positive correlation between the TG/HDL-C ratio and the Gensini scores (r = 0.475, P < 0.001).
After adjusting for various factors including age, sex, smoking, HTN, DM, Scr, FBG, and HR, the results indicated that a one-unit increase in the TG/HDL-C ratio was independently linked to a 7.75-unit increase in the Gensini score (β=7.75; 95% CI, 5.35–10.15; P < 0.001) (Table 6).
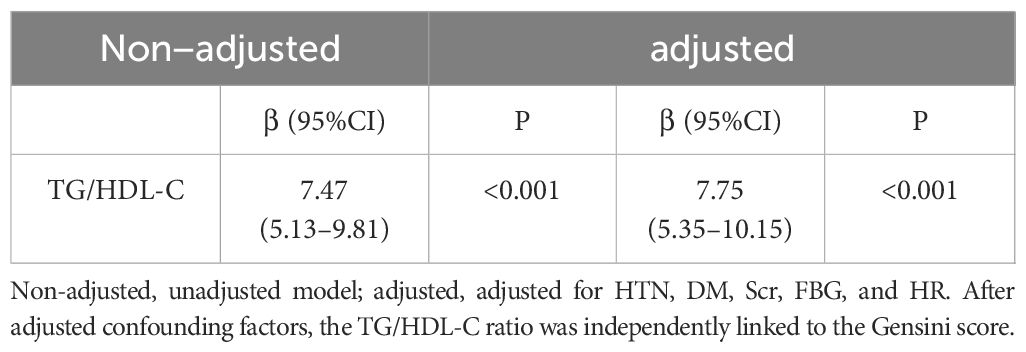
Table 6 Univariate and multivariate linear regression analysis of TG/HDL-C ratio and Gensini score.
NAFLD, a globally prevalent chronic hepatic metabolic disease, is strongly associated with an increased risk of coronary heart disease. Park et al. (13) prospectively studied the association between biopsy-confirmed NAFLD and atherosclerotic cardiovascular disease (ASCVD) over a 10-year period, revealing an independent correlation between NAFLD and heightened ASCVD risk. Toh et al. (14) performed a meta-analysis aimed at elucidating the association between NAFLD and the risk of CHD. Their findings revealed that the likelihood of developing CHD escalates in correlation with both NAFLD and its severity.
While the precise mechanism by which NAFLD elevates the risk of CHD is not fully understood, recent studies indicate a concurrent presence of NAFLD and ASCVD in patients with IR (15). Insulin resistance might play a mediating role in the development of CHD among patients with NAFLD. NAFLD initiates lipid metabolism disorders, oxidative stress, chronic inflammation, and additional associated pathological processes, ultimately leading to the development of IR (16). Simultaneously, the progression of IR is significantly associated with an increased risk of CHD (17, 18).
Although the gold standard for diagnosing IR is the high insulin-glucose clamp test, its cost and complexity have hindered clinical application. As a result, insulin resistance markers such as TG/HDL-C ratio, the triglyceride-glucose (TyG) index, and the lipid accumulation product (LAP) exhibit good clinical feasibility and utility (19, 20). Patients with NAFLD often present with dyslipidemia, primarily characterized by elevated TG levels and reduced HDL-C levels, while LDL-C levels may or may not be elevated (21). Thus, the TG/HDL-C ratio serves as a reliable indicator of insulin resistance and also reflects the abnormal lipid metabolism in patients with NAFLD.
Numerous studies have demonstrated a strong association between the TG/HDL-C ratio and an elevated risk of cardiovascular disease. In a prospective cohort study encompassing 9368 patients from four Chinese cohorts followed over 20 years, a positive correlation was observed between an elevated TG/HDL-C ratio and an increased risk of ASCVD (22). A separate study, comprising 403,335 participants from the UK Biobank, explored the association between the TG/HDL-C ratio and cardiovascular disease (CVD)risk, ultimately finding a positive correlation between the baseline TG/HDL-C ratio and an escalated CVD risk (7). Both studies consistently indicate a robust association between the TG/HDL-C ratio and CHD. Our findings suggest that in patients with NAFLD, there is a significant association between the TG/HDL-C ratio and an elevated risk of CHD (OR, 1.944; 95% CI, 1.502–2.515; P<0.001). After excluding the confounding effects of age, sex, smoking history, hypertension, DM, Scr, FBG, and HR, the results indicate that the TG/HDL-C ratio serves as an independent predictor of CHD in patients with NAFLD (OR, 1.791; 95% CI, 1.344–2.386; P < 0.001). The risk of CHD is significantly increased in patients with NAFLD compared to the general population, highlighting the critical clinical importance of investigating the correlation between the TG/HDL-C ratio and this high-risk group. Accordingly, this study generated a ROC curve using the presence or absence of CHD in NAFLD patients as the test variable. The results suggest that the TG/HDL-C ratio has some predictive value for CHD risk in NAFLD patients (AUC, 0.667; 95% CI, 0.615–0.740; P < 0.001). It exhibits high specificity but low sensitivity in predicting the outcome. This suggests that the TG/HDL-C ratio is particularly valuable in predicting positive outcomes for CHD risk in NAFLD patients. It is worth noting that, despite the lack of significant differences in AUC score, sensitivity, and specificity between the TG/HDL-C ratio and those parameters considered separately for TG or HDL-C. The TG/HDL-C ratio also serves as a reliable indicator of insulin resistance, reflecting the relationship between insulin resistance and the risk of coronary heart disease in NAFLD patients, while simultaneously highlighting the association between lipid abnormalities and the risk of coronary heart disease in NAFLD patients.
The TG/HDL-C ratio also holds a certain predictive value for assessing the severity of CHD in patients with NAFLD. Zhang et al. (23) retrospectively analyzed the TG/HDL-C ratio levels in patients with coronary artery disease (CAD) confirmed by coronary angiography. They found that the TG/HDL-C ratio was significantly higher in patients with multivessel CAD compared to those with single-vessel CAD. Similarly, Wu et al. (8) confirmed that the TG/HDL-C ratio can predict the severity of CAD in patients, as assessed by the Gensini score. In our study, Spearman correlation analysis revealed a significant positive correlation between the TG/HDL-C ratio and the Gensini score (r = 0.475, P < 0.001). This suggests a linear correlation between the TG/HDL-C ratio and the severity of coronary artery disease in NAFLD patients. And this linear relationship persists independently of various factors, including age, sex, smoking history, HTN, DM, Scr, FBG, and HR. These findings highlight the importance of managing not only traditional risk factors but also the CHD risk linked to the TG/HDL-C ratio in patients with NAFLD. Zhao et al. (24) investigated the relationship between the TyG index and both the risk of CHD and the severity of CAD in NAFLD patients. The results showed that the TyG index is associated with the risk of CHD and the severity of coronary artery disease in patients with NAFLD. However, due to its susceptibility to dietary influences, the feasibility of the TyG index is limited in certain conditions.
The TG/HDL-C ratio was positively correlated with CHD risk and reflected coronary atherosclerosis severity in NAFLD patients. TG/HDL-C ratio is an emerging index reflecting IR that differs from previous evaluation standards. This suggests that enhancing insulin sensitivity may potentially contribute to mitigating coronary artery disease and improving clinical outcomes. However, further validation through larger-scale studies is required.
Firstly, this study is an observational, single-center investigation with a limited sample size, thus requiring cautious interpretation of its findings. Being a retrospective study, it inherently bears certain limitations. Future multicenter, large-scale prospective studies are warranted for validation purposes. Secondly, this study excluded patients with severe NAFLD, including those with liver fibrosis and cellular necrosis. This exclusion might have resulted in an underestimation of the predictive value of the TG/HDL-C ratio for coronary heart disease. Lastly, this retrospective study did not take into account the impact of statins on lipid indices. Additionally, in patients with ACS, the routine administration of loading doses of statins, as per the management guidelines of Chinese chest pain centers, influenced the study outcomes.
The raw data supporting the conclusions of this article will be made available by the authors, without undue reservation.
The studies involving humans were approved by the Medical Ethics Committee of Shenzhen Traditional Chinese Medicine Hospital and the fourth Clinical Medical College of Guangzhou University of Chinese Medicine. The studies were conducted in accordance with the local legislation and institutional requirements. The ethics committee/institutional review board waived the requirement of written informed consent for participation from the participants or the participants’ legal guardians/next of kin because This was a retrospective study in which the history data were generated from the patients’ previous clinical consultations, and the study was conducted only by searching the medical record system to obtain the relevant history data.
BC: Visualization, Software, Methodology, Investigation, Formal analysis, Data curation, Conceptualization, Writing – review & editing, Writing – original draft. YY: Writing – review & editing, Validation, Supervision, Software, Methodology, Investigation. MC: Writing – review & editing, Validation, Supervision, Software, Methodology, Investigation. YW: Writing – review & editing, Validation, Supervision, Software, Methodology, Investigation. XS: Writing – review & editing, Validation, Supervision, Software, Methodology, Investigation. PC: Writing – review & editing, Validation, Supervision, Software, Methodology, Investigation. XL: Writing – review & editing, Validation, Supervision, Software, Methodology, Investigation. YG: Writing – review & editing, Validation, Supervision, Software, Methodology, Investigation. TL: Writing – review & editing, Validation, Supervision, Software, Methodology, Investigation. CX: Supervision, Software, Methodology, Investigation, Writing – review & editing, Validation. BL: Writing – review & editing, Supervision, Software, Project administration, Funding acquisition, Conceptualization. QL: Writing – review & editing, Supervision, Software, Project administration, Funding acquisition, Conceptualization.
The author(s) declare financial support was received for the research, authorship, and/or publication of this article. This article is supported by the Young Scientists Fund of the National Natural Science Foundation of China (No. 82200349) and Guangdong Basic and Applied Basic Research Foundation of China (No. 2022A1515011647).
We thank all participants in the present study.
The authors declare that the research was conducted in the absence of any commercial or financial relationships that could be construed as a potential conflict of interest.
All claims expressed in this article are solely those of the authors and do not necessarily represent those of their affiliated organizations, or those of the publisher, the editors and the reviewers. Any product that may be evaluated in this article, or claim that may be made by its manufacturer, is not guaranteed or endorsed by the publisher.
IR, Insulin resistance; CHD, coronary heart disease; NAFLD, non-alcoholic fatty liver disease; TG, triglyceride; HDL-C, high-density lipoprotein cholesterol; TG/HDL-C ratio, triglyceride to high-density lipoprotein cholesterol ratio; ROC, the receiver operating characteristic; HTN, hypertension; DM, diabetes mellitus; Scr, serum creatinine; FBG, fasting blood glucose; HR, heart rate; GS, Gensini Score; SBP, systolic blood pressure; DBP, diastolic blood pressure; BMI, Body Mass Index; ALT, alanine aminotransferase; AST, aspartate aminotransferase; Scr, serum creatinine; TC, total cholesterol; LDL-C, low-density lipoprotein cholesterol; OR, odd ratio; CI, confidence interval; cTnI, Cardiac troponin I; AMI, acute myocardial infarction; ACS, acute coronary syndrome; AUC, area under the curve; ASCVD, atherosclerotic cardiovascular disease; TyG index, triglyceride-glucose index; LAP, lipid accumulation product; CVD, cardiovascular disease; CAD, coronary artery disease.
1. Kivimaki M, Steptoe A. Effects of stress on the development and progression of cardiovascular disease. Nat Rev Cardiol. (2018) 15:215–29. doi: 10.1038/nrcardio.2017.189
2. Barquera S, Pedroza-Tobias A, Medina C, Hernandez-Barrera L, Bibbins-Domingo K, Lozano R, et al. Global overview of the epidemiology of atherosclerotic cardiovascular disease. Arch Med Res. (2015) 46:328–38. doi: 10.1016/j.arcmed.2015.06.006
3. Raposeiras-Roubin S, Rossello X, Oliva B, Fernandez-Friera L, Mendiguren JM, Andres V, et al. Triglycerides and residual atherosclerotic risk. J Am Coll Cardiol. (2021) 77:3031–41. doi: 10.1016/j.jacc.2021.04.059
4. Targher G, Byrne CD, Tilg H. NAFLD and increased risk of cardiovascular disease: clinical associations, pathophysiological mechanisms and pharmacological implications. Gut. (2020) 69:1691–705. doi: 10.1136/gutjnl-2020-320622
5. Di Pino A, DeFronzo RA. Insulin resistance and atherosclerosis: implications for insulin-sensitizing agents. Endocr Rev. (2019) 40:1447–67. doi: 10.1210/er.2018-00141
6. Zhang Z, Zhao L, Lu Y, Meng X, Zhou X. Association between non-insulin-based insulin resistance indices and cardiovascular events in patients undergoing percutaneous coronary intervention: a retrospective study. Cardiovasc Diabetol. (2023) 22:161. doi: 10.1186/s12933-023-01898-1
7. Che B, Zhong C, Zhang R, Pu L, Zhao T, Zhang Y, et al. Triglyceride-glucose index and triglyceride to high-density lipoprotein cholesterol ratio as potential cardiovascular disease risk factors: an analysis of UK biobank data. Cardiovasc Diabetol. (2023) 22:34. doi: 10.1186/s12933-023-01762-2
8. Wu Z, Cui H, Li W, Zhang Y, Liu L, Liu Z, et al. Comparison of three non-insulin-based insulin resistance indexes in predicting the presence and severity of coronary artery disease. Front Cardiovasc Med. (2022) 9:918359. doi: 10.3389/fcvm.2022.918359
9. Fatty Liver and Alcoholic Liver Disease Group of the Chinese Medical Association Liver Disease Branch and Fatty Liver Expert Committee of the Chinese Medical Doctor AssociationGuidelines of prevention and treatment for nonalcoholic fatty liver disease: a 2018 update. Zhonghua Gan Zang Bing Za Zhi. (2018) 26:195–203. doi 10.3760/cma.j.issn.1007-3418.2018.03.008
10. Page HJ. The judkin’s technique. Catheter Cardiovasc Diagnosis. (1979) 5:187–9. doi: 10.1002/ccd.1810050214
11. Rampidis GP, Benetos G, Benz DC, Giannopoulos AA, Buechel RR. A guide for Gensini Score calculation. Atherosclerosis. (2019) 287:181–3. doi: 10.1016/j.atherosclerosis.2019.05.012
12. Neeland IJ, Patel RS, Eshtehardi P, Dhawan S, McDaniel MC, Rab ST, et al. Coronary angiographic scoring systems: an evaluation of their equivalence and validity. Am Heart J. (2012) 164:547–52. doi: 10.1016/j.ahj.2012.07.007
13. Park JH, Koo BK, Kim W, Kim WH. Histological severity of nonalcoholic fatty liver disease is associated with 10-year risk for atherosclerotic cardiovascular disease. Hepatol Int. (2021) 15:1148–59. doi: 10.1007/s12072-021-10209-3
14. Toh J, Pan XH, Tay P, Ng CH, Yong JN, Xiao J, et al. A meta-analysis on the global prevalence, risk factors and screening of coronary heart disease in nonalcoholic fatty liver disease. Clin Gastroenterol Hepatol. (2022) 20:2462–73. doi: 10.1016/j.cgh.2021.09.021
15. Stols-Goncalves D, Hovingh GK, Nieuwdorp M, Holleboom AG. NAFLD and atherosclerosis: two sides of the same dysmetabolic coin? Trends Endocrinol Metab. (2019) 30:891–902. doi: 10.1016/j.tem.2019.08.008
16. Zhang CH, Zhou BG, Sheng JQ, Chen Y, Cao YQ, Chen C. Molecular mechanisms of hepatic insulin resistance in nonalcoholic fatty liver disease and potential treatment strategies. Pharmacol Res. (2020) 159:104984. doi: 10.1016/j.phrs.2020.104984
17. Louie JZ, Shiffman D, McPhaul MJ, Melander O. Insulin resistance probability score and incident cardiovascular disease. J Intern Med. (2023) 294:531–5. doi: 10.1111/joim.13687
18. Ormazabal V, Nair S, Elfeky O, Aguayo C, Salomon C, Zuniga FA. Association between insulin resistance and the development of cardiovascular disease. Cardiovasc Diabetol. (2018) 17:122. doi: 10.1186/s12933-018-0762-4
19. Zeng P, Cai X, Yu X, Gong L. Markers of insulin resistance associated with non-alcoholic fatty liver disease in non-diabetic population. Sci Rep. (2023) 13:20470. doi: 10.1038/s41598-023-47269-4
20. Li H, Shi Z, Chen X, Wang J, Ding J, Geng S, et al. Relationship between six insulin resistance surrogates and nonalcoholic fatty liver disease among older adults: A cross-sectional study. Diabetes Metab Syndr Obes. (2023) 16:1685–96. doi: 10.2147/DMSO.S409983
21. Deprince A, Haas JT, Staels B. Dysregulated lipid metabolism links NAFLD to cardiovascular disease. Mol Metab. (2020) 42:101092. doi: 10.1016/j.molmet.2020.101092
22. Zhou L, Mai J, Li Y, Guo M, Wu Y, Gao X, et al. Triglyceride to high-density lipoprotein cholesterol ratio and risk of atherosclerotic cardiovascular disease in a Chinese population. Nutr Metab Cardiovasc Dis. (2020) 30:1706–13. doi: 10.1016/j.numecd.2020.05.009
23. Zhang Y, Wang R, Fu X, Song H. Non-insulin-based insulin resistance indexes in predicting severity for coronary artery disease. Diabetol Metab Syndr. (2022) 14:191. doi: 10.1186/s13098-022-00967-x
Keywords: triglyceride, high-density lipoprotein cholesterol, insulin resistance, nonalcoholic fatty liver disease, coronary heart disease
Citation: Cheng B, Yi Y, Chen M, Wei Y, Su X, Chen P, Lin X, Gu Y, Li T, Xu C, Liu Q and Li B (2024) TG/HDL-C ratio is positively associated with risk and severity of CHD among NAFLD patients: a case control study. Front. Endocrinol. 15:1383489. doi: 10.3389/fendo.2024.1383489
Received: 19 February 2024; Accepted: 10 June 2024;
Published: 04 July 2024.
Edited by:
Kanwal Rehman, The Women University, Multan, PakistanReviewed by:
Seyed Arsalan Seyedi, Tehran University of Medical Sciences, IranCopyright © 2024 Cheng, Yi, Chen, Wei, Su, Chen, Lin, Gu, Li, Xu, Liu and Li. This is an open-access article distributed under the terms of the Creative Commons Attribution License (CC BY). The use, distribution or reproduction in other forums is permitted, provided the original author(s) and the copyright owner(s) are credited and that the original publication in this journal is cited, in accordance with accepted academic practice. No use, distribution or reproduction is permitted which does not comply with these terms.
*Correspondence: Qiang Liu, MTM4MDIyNjM5MTZAMTM5LmNvbQ==; Biao Li, bGliaWFvemFja0AxMjYuY29t
Disclaimer: All claims expressed in this article are solely those of the authors and do not necessarily represent those of their affiliated organizations, or those of the publisher, the editors and the reviewers. Any product that may be evaluated in this article or claim that may be made by its manufacturer is not guaranteed or endorsed by the publisher.
Research integrity at Frontiers
Learn more about the work of our research integrity team to safeguard the quality of each article we publish.