 Han Guo
 Chuan Wan
 Jingjing Zhu1
 Shufa Li
- 1Department of Endocrinology and Metabolism, The Affiliated Hospital of Qingdao University, Qingdao, China
- 2Frontier Medical Training Brigade, Third Military Medical University (Army Medical University), Xinjiang, China
Background and Objective: Previous research suggested a relationship between the Systemic Immune-Inflammation Index (SII) and multiple adverse health conditions. However, the role of SII in prediabetes and insulin resistance (IR) remains poorly understood. Therefore, this study aims to explore the potential relationship between SII and prediabetes and IR, providing data support for effective diabetes prevention by reducing systemic inflammation.
Methods: Linear regression models were used to assess the correlation between continuous SII and risk markers for type 2 diabetes (T2D). Subsequently, multivariate logistic regression models and subgroup analyses were employed to evaluate the association between SII tertiles and prediabetes and IR, controlling for various confounding factors. Finally, restricted cubic spline graphs were used to analyze the nonlinear relationship between SII and IR and prediabetes.
Results: After controlling for multiple potential confounders, SII was positively correlated with fasting blood glucose (FBG) (β: 0.100; 95% CI: 0.040 to 0.160), fasting serum insulin (FSI) (β: 1.042; 95% CI: 0.200 to 1.885), and homeostasis model assessment of insulin resistance (HOMA-IR) (β: 0.273; 95% CI: 0.022 to 0.523). Compared to participants with lower SII, those in the highest tertile had increased odds of prediabetes (OR: 1.17; 95% CI: 1.02-1.34; p for trend < 0.05) and IR (OR: 1.35; 95% CI: 1.18 to 1.51; p for trend<0.001).
Conclusions: Our study results demonstrate an elevated association between SII levels and both IR and prediabetes, indicating SII as a straightforward and cost-effective method identifying individuals with IR and prediabetes.
Introduction
Type 2 diabetes (T2D) poses a significant global public health challenge, profoundly affecting human health and quality of life (1). Prediabetes and insulin resistance (IR) stand out as primary contributors to T2D development, characterized by aberrant glucose metabolism (2). IR is a pivotal factor in various metabolic disorders, signifying a state where insulin-responsive tissues exhibit reduced responsiveness to physiological insulin levels. This state results in hyperinsulinemia and elevated fasting blood glucose (FBG), diagnostic indicators of IR (3). Despite being the gold standard for assessing IR, the hyperinsulinemic-euglycemic clamp is a costly, intrusive, and time-consuming procedure that needs to be performed by skilled staff. Therefore, the homeostasis model assessment of insulin resistance (HOMA-IR) offers a more straightforward and useful option by measuring insulin and fasting blood glucose (4).
IR is not only a key pathogenic factor in T2D but is also associated with various pathological conditions such as cardiovascular diseases, certain types of cancer, infertility, polycystic ovary syndrome, non-alcoholic fatty liver disease, and metabolic syndrome (5). Given the substantial harm that IR and prediabetes inflicts on human health, the early detection and intervention of them are hot topics among scholars in the relevant field. Previous research indicates that systemic chronic inflammation plays a pivotal role in IR and prediabetes, with obesity frequently triggering this inflammatory state (6). Obesity can induce a chronic inflammatory state in various insulin-target tissues, including adipose tissue, liver, muscles, and the pancreas. This is often attributed to potential interactions between immune processes and metabolic defects (7). Metabolic tissues induce the occurrence of this chronic low-grade inflammation by recruiting, accumulating, and activating pro-inflammatory macrophages. Although macrophages play a central role, other immune cell types are involved in these inflammatory processes (8). Satoshi discovered that CD8+ T cells can activate macrophages within adipose tissue. This alteration of the immune microenvironment leads to the shift of adipose tissue from an anti-inflammatory state to a pro-inflammatory state (9). Hence, controlling inflammation seems to be a pivotal intervention for mitigating IR and prediabetes. Nevertheless, studies on the population-level association between inflammation and IR and prediabetes are still limited. A comprehensive exploration of this potential connection necessitates an urgently required objective assessment indicator that precisely mirrors the immune and inflammatory status of populations with IR and prediabetes.
The systemic immune-inflammation index (SII), developed by Hu et al., is a novel, comprehensive biomarker for immune inflammation based on blood cells (10). It integrates three types of inflammatory cells-platelets, neutrophils, and lymphocytes. It accurately reflects the local immune response and systemic inflammatory status of body (11). Multiple studies have substantiated the prognostic value of SII in assessing outcomes for various cancer patients, encompassing bladder cancer (12), cervical cancer (11), non-small cell lung cancer (13), colorectal cancer (14), and gastric cancer (15). In recent years, SII has emerged as an indicator for detecting chronic inflammatory disease beyond tumors. Yang et al. reported that in patients with coronary artery disease after coronary intervention, SII demonstrates superior predictive value for major cardiovascular events compared to traditional risk factors (16). Wang et al. suggested using SII as an indicator for detecting diabetes depression (17). Additionally, several studies utilizing the NHANES database reveal a robust association between SII and various metabolic diseases, such as diabetic nephropathy (18), hepatic steatosis (19), and osteoporosis (20). Moreover, numerous studies indicate that, compared to traditional immune-inflammatory indicators [including lymphocyte/monocyte ratio (LMR), platelet/lymphocyte ratio (NLR)], SII is a more accurate predictor of malignant tumors (21, 22).
In summary, SII is a non-invasive quantitative indicator with higher research value compared to traditional inflammatory markers. Given the relationship between inflammation and IR as well as prediabetes, we hypothesize that a high SII level may be positively associated with the risk of developing IR and prediabetes. However, research in this field is currently limited. Therefore, this study plans to employ the NHANES database for a more rigorous statistical analysis methods, controlling confounding variables to validate this hypothesis. Our goal is to identify individuals at high risk of IR through SII and explore the association between SII and markers of T2D risk. This will help investigate its potential to identify prediabetic patients.
Materials and methods
Data source and study sample
The National Health and Nutrition Examination Survey (NHANES), conducted by the National Center for Health Statistics (NCHS), is a nationwide survey assessing the health and nutritional status of adults and children in the United States. It employs a cross-sectional, multi-stage, stratified, and sub-group probability sampling design, with a two-year cycle (23). The survey covers various aspects, including in-home face-to-face interviews (demographics, socioeconomic status, diet, and health-related questions), as well as health examinations conducted at Mobile Examination Centers (MEC) collecting medical data, anthropometry, and laboratory tests (24). The NHANES protocol is revised and approved by the NCHS Ethics Review Committee, and all participants provide written informed consent (25).
The population data used in this cross-sectional study are from the NHANES database, covering seven consecutive periods (2005-2006, 2007-2008, 2009-2010, 2011-2012, 2013-2014, 2015-2016, and 2017-2018). It involves 60,936 participants, consistent with the results of Liu, et al. (26). We excluded pregnant participants, those under 18, potential type 1 diabetes patients (defined as those <20 years receiving only insulin treatment), and T2D patients (self-reported diabetes, insulin or oral hypoglycemic medication use, HbA1c (≥6.5%), fasting blood glucose (≥126 mg/dL), or impaired glucose tolerance (≥200 mg/dL) (27), along with patients using various medications that may affect insulin sensitivity or with missing data (independent, dependent, and covariate data) (28). Finally, the study included 9,250 participants with complete data (Figure 1).
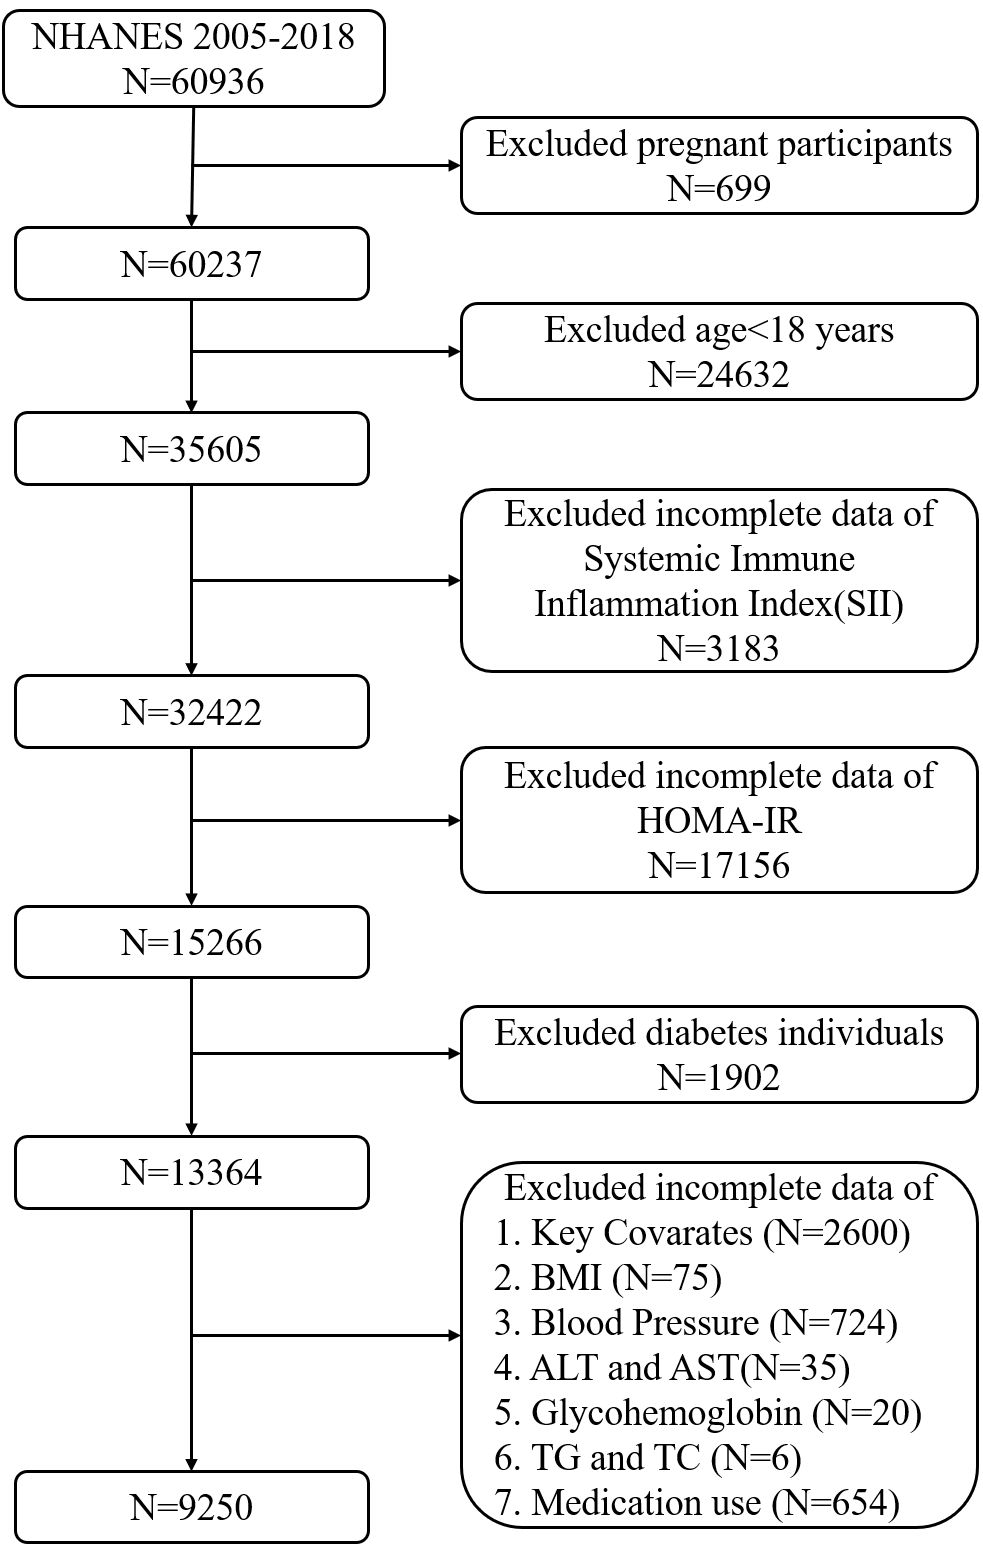
Figure 1 Flow chart of participants selection from the NHANES 2005-2018.
Exposure variable and outcome variables
The exposure variable is SII, calculated as platelet count × neutrophil count/lymphocyte count (29). Subsequently, participants were divided into three groups based on the tertiles of SII, namely Tertile 1 (1.53≤SII<356.6), Tertile 2 (356.67≤SII<552.75), and Tertile 3 (SII≥552.75). Outcome variables include risk markers for IR, prediabetes, and T2D, such as fasting blood glucose (FBG), glycated hemoglobin (HbA1c), fasting serum insulin (FSI), and Homeostatic Model Assessment for Insulin Resistance (HOMA-IR). The formula for calculating HOMA-IR is [FBG × FSI/22.5] (30). In this study, HOMA-IR>2.6 is considered the diagnostic criterion for IR (31). Prediabetes is defined based on questionnaire and laboratory tests, with HbA1c levels between 5.7% and 6.4% or impaired fasting glucose levels (100-125 mg/dL) and/or impaired glucose tolerance (140-199 mg/dL) (32).
Covariates
Provided participants with standardized questionnaires to collect sociodemographic and lifestyle information. Based on previous research, we included covariates related to metabolic health risk factors, including low socioeconomic status, smoking status, alcohol consumption, physical activity, systolic blood pressure (SBP), diastolic blood pressure (DBP), body mass index (BMI), total cholesterol (TC), serum triglycerides (TG), alanine aminotransferase (ALT), aspartate aminotransferase (AST), gamma-glutamyltransferase (γ-GGT), alkaline phosphatase (ALP), serum creatinine (Cr), and lactate dehydrogenase (LDH). This study also included gender (male or female), age as a continuous variable or categorical variable (18-39 years, 40-59 years, or ≥60 years), race/ethnicity (non-Hispanic Black, other Hispanic, non-Hispanic White, or other race), education level (less than high school, high school, and beyond high school), PIR (categorized as 1, 1-2, 2-4, and >4), smoking status categorized as never smoked (before the survey<100 cigarettes), former smoker (smoked >100 cigarettes before the survey but quit before the survey), and current smoker (smoked >100 cigarettes before the survey and smoked during the survey) (33). Participants who consumed at least 12 drinks of any type of alcoholic beverage (12 ounces of beer, 5 ounces of wine, or 1.5 ounces of distilled spirits) within the past year were classified as drinkers (34). MVPA was defined as completing at least 10 minutes of vigorous/moderate-intensity physical activity in a typical week (2007-2018 cycle), resulting in substantial sweating, or a significant increase in breathing or heart rate (35).
Statistical analysis
In the description of the study population, continuous variables, if normally distributed, are presented as the mean with standard deviation; if skewed, they are presented as the median (25th-75th percentile). Both the normally and skewed distributed variables are analyzed using weight linear regression. Categorical variables are expressed as percentages and analyzed using the weighted chi-square test. We first established three weighted multivariable linear regression models to analyze the correlation between SII and T2D risk markers (FBG, HbA1c, FSI, and HOMA-IR). Model 1 was unadjusted for any covariates, Model 2 adjusted for covariates including age, gender, race, smoking and drinking status, PIR, education level, and physical activity status, and Model 3 adjusted for age, gender, race, smoking and drinking status, PIR, education level, physical activity status, BMI, TC, TG, ALT, AST, γ-GGT, ALP, Cr, and LDH. Subsequently, to evaluate the association between continuous LgSII and participants stratified into three tertiles and IR and prediabetes, we conducted a multifactorial logistic regression. Afterward, subgroup analyses were performed to test for interaction and control of confounding categorical variables, including age (18-39 years, 40-59 years, or ≥60 years), gender, race, education level, PIR, smoking status, alcohol consumption, and MVPA. Subgroup analyses used weighted multifactorial logistic regression. These stratification variables were also considered predefined effect-modifying factors. To examine the heterogeneity of associations between subgroups, interaction terms were introduced. Finally, we used Restricted Cubic Spline (RCS) regression to examine the non-linear relationship between SII and IR and prediabetes. Likelihood ratio tests were employed to confirm this relationship. It is noteworthy that, during regression analysis, SII was log-transformed as it exhibited a right-skewed distribution. All analyses were conducted using R software (version 4.1.2).
Results
Baseline characteristics of the study population
Table 1 presents the baseline characteristics of participants categorized by SII status. The study comprised 9250 participants, including 4827 males and 4423 females, with a median age of 45 years. Among them, 43.11% were diagnosed with IR, and 19.7% were considered to have prediabetes. Participants were divided into groups based on SII tertiles: Tertile 1 represented the relatively lower SII group (1.53≤SII<356.67); Tertile 2 represented the relatively higher SII group (356.67≤SII<552.75); Tertile 3 represented the highest SII group (SII≥552.75). Compared to those in the lower SII group, subjects in SII Tertile 3 included more females, fewer non-Hispanic Blacks, more current or former smokers, individuals with lower educational attainment, and those engaged in less physical activity. Across the three SII groups, significant differences were observed in BMI, FBG, HbA1c, FSI, HOMA-IR, TC, TG, ALT, AST, chloride, SBP, alkaline phosphatase, and creatinine levels (all P values <0.05). Importantly, individuals with higher SII levels had a higher proportion of prediabetes and IR patients (P<0.05 in both cases).
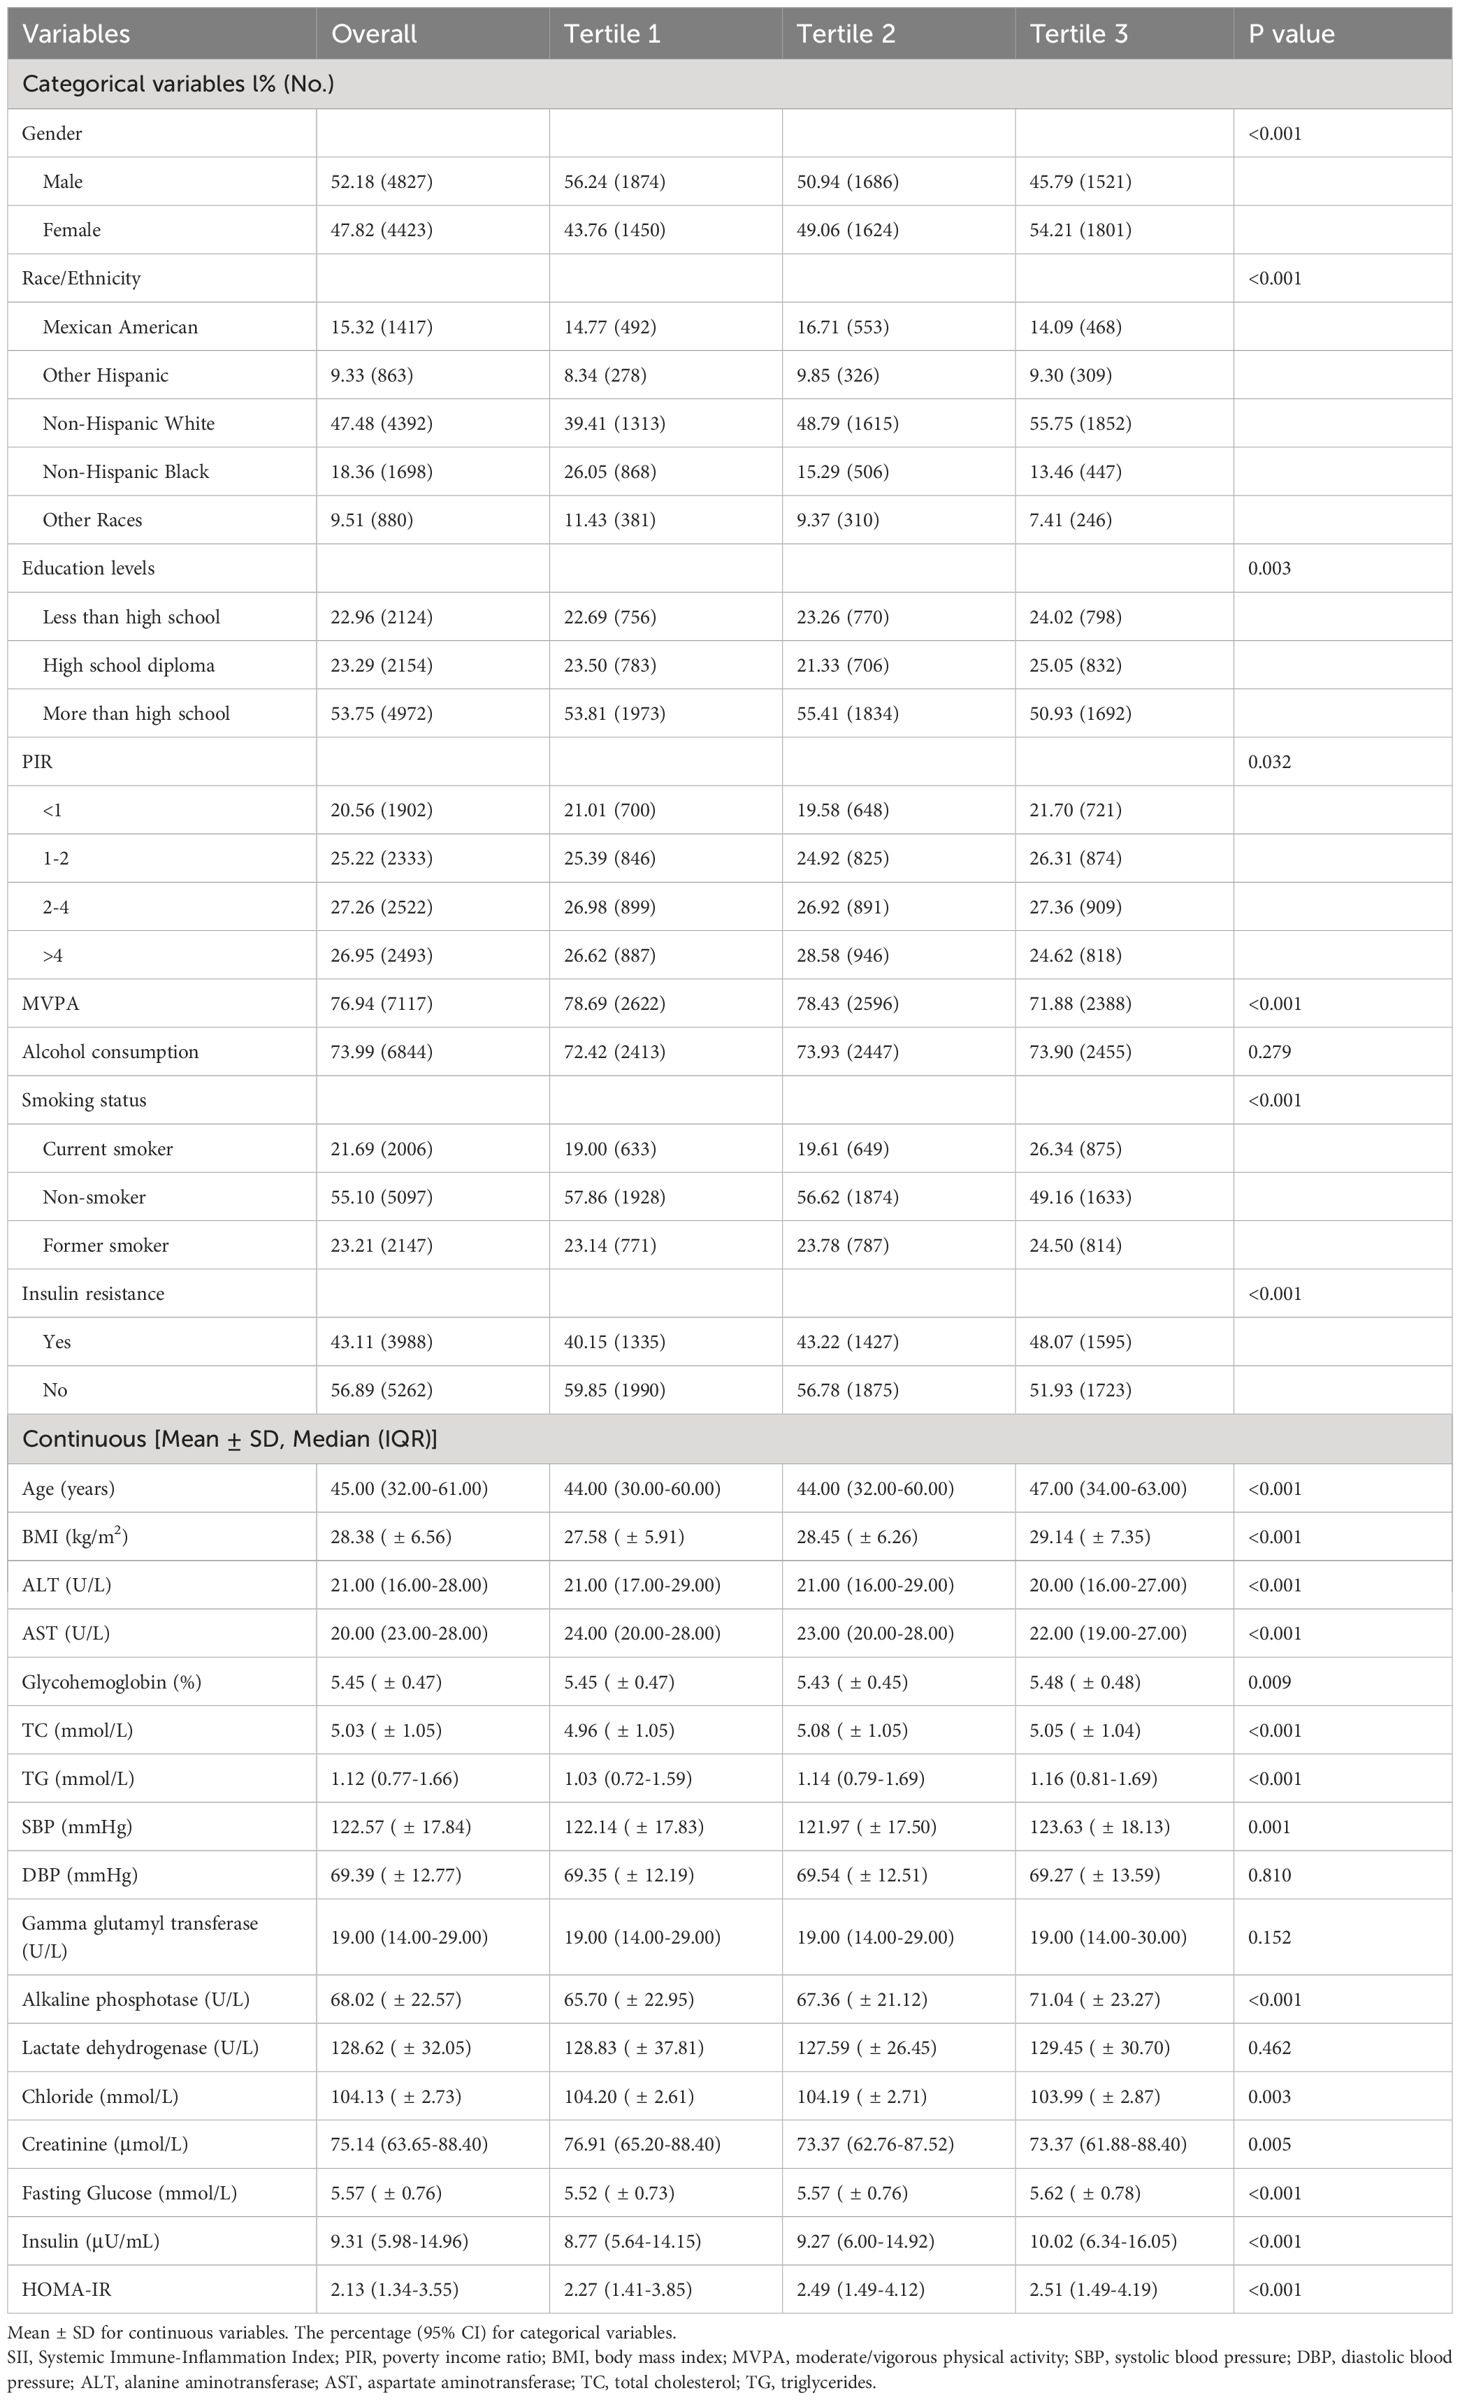
Table 1 Basic characteristics of the study population (n=9250) in the NHANES.
Association between SII and T2D risk markers
The correlation between SII and the risk markers of T2D was showed in Table 2. After adjusting for potential confounders, a significant correlation was observed between continuous SII and FBG, FSI, and HOMA-IR, while the relationship between SII and HbA1c was significant only when no covariates were adjusted. Following comprehensive adjustment for covariates in Model 3, participants in the second or third tertiles of SII had higher levels of FBG, FSI, and HOMA-IR compared to those in the first tertile. And the corresponding β coefficients (95% CI) for the highest tertile of SII were 0.048 (95% CI: 0.014 to 0.082), 0.658 (95% CI: 0.175 to 1.141), and 0.165 (95% CI: 0.021 to 0.309) for FBG, FSI, and HOMA-IR, respectively.
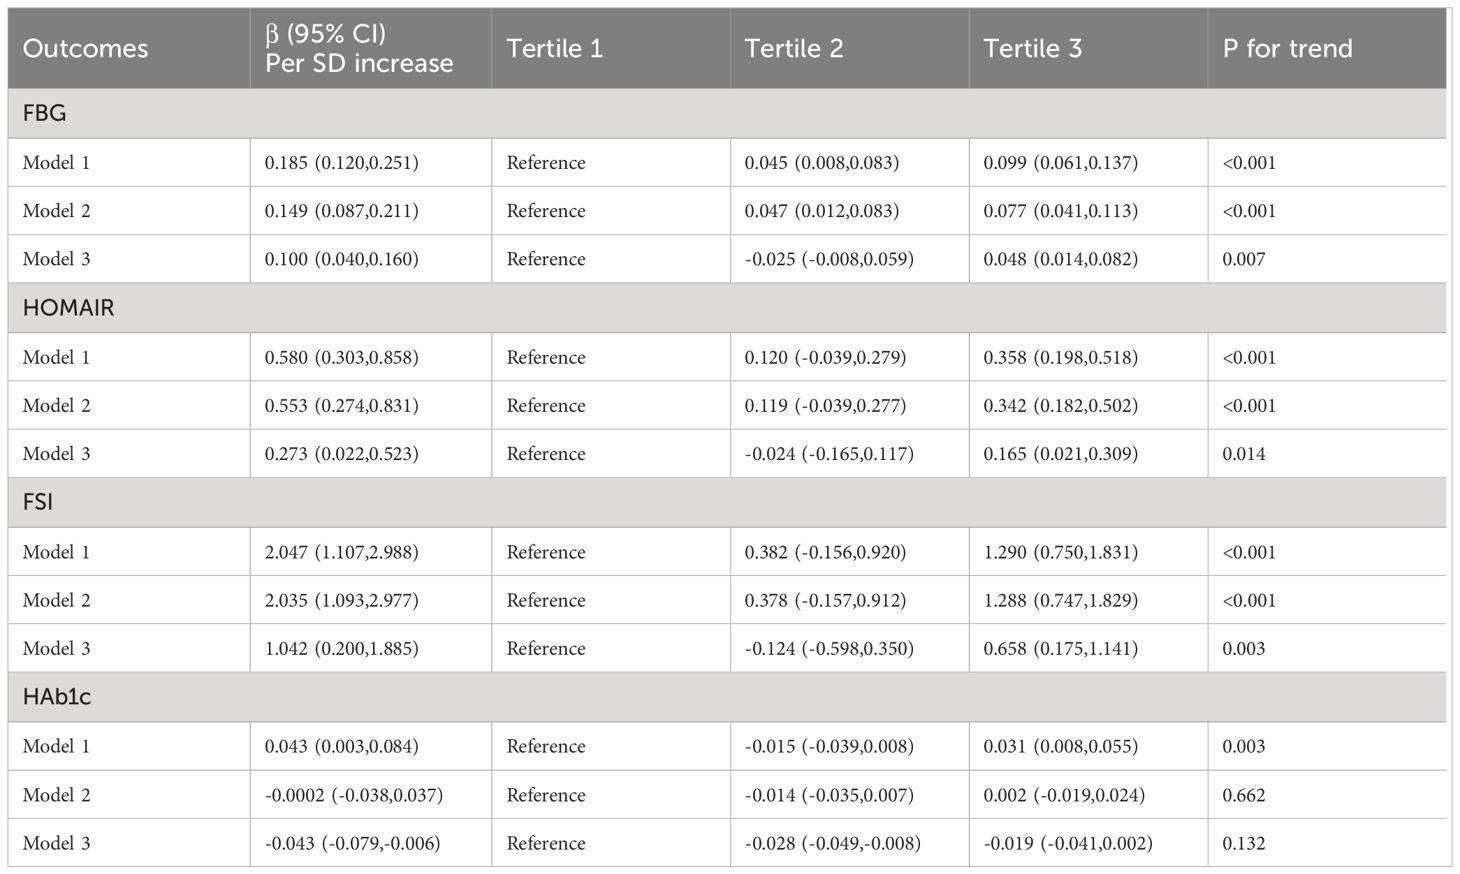
Table 2 Coefficients (95% CI) for the relationship between the SII and the markers of T2D risk.
Relationship between SII and IR
As shown in Table 3, a significant positive correlation between SII and IR was demonstrated in the unadjusted original model (Model 1) (odds ratio=1.73; 95% confidence interval (CI), 1.45-2.06; P<0.001) and in the minimally adjusted model (Model 2) (OR=1.89; 95% CI: 1.57-2.28; P<0.001). Even after adjusting for all covariates (Model 3), this positive correlation persisted (OR=1.64; 95% CI: 1.32-2.04; P<0.001). This implies that for every one-unit increase in LgSII, the risk of IR increases by 64%. We further transformed SII from a continuous variable to a categorical variable (tertiles) for sensitivity analysis. Compared to participants in the lowest Tertile 1 group of SII, those in the highest Tertile 3 group had a 34% increased risk of IR, with statistical significance (OR=1.34; 95% CI: 1.18-1.51; P<0.001). Although participants in the Tertile 2 group also exhibited a higher risk of IR compared to the Tertile 1 group, with a 4% increased risk, but this difference was not statistically significant.
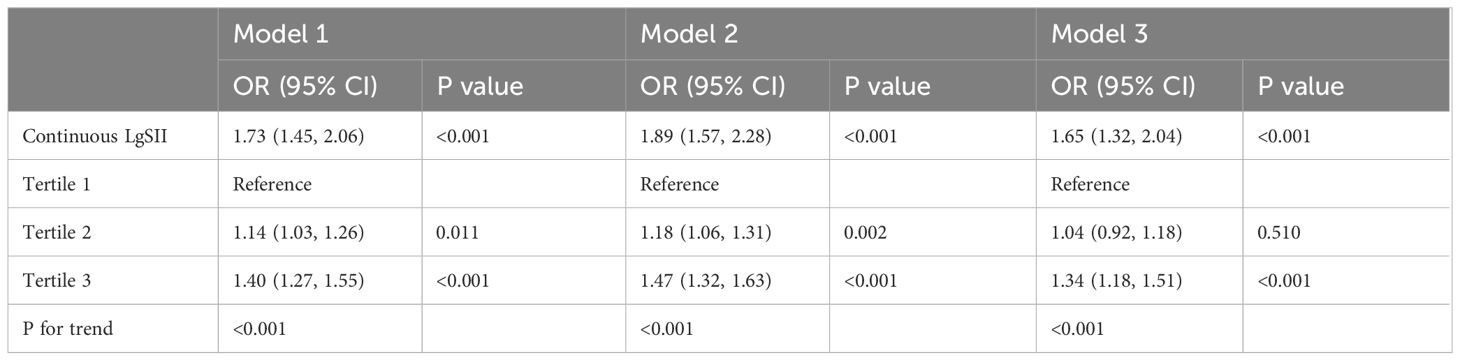
Table 3 The associations between SII and IR.
Relationship between SII and prediabetes
Table 4 presents the association between SII evaluated based on its tertiles and prediabetes. In Model 1, without adjusting for any factors, the relationship between continuous LgSII and prediabetes was significant (OR=1.60; 95% CI: 1.29-2.00; P<0.001). After adjusting for all potential covariates, an increase of 1 unit in SII score was associated with a 43% increased odds of having prediabetes (OR: 1.43; 95% CI: 1.13 to 1.82). Additionally, we assessed the relationship between tertiles of SII scores and prediabetes. Individuals with the highest SII tertile had a 17% increased odds of prediabetes compared to those in the lowest tertile (OR: 1.17; 95% CI: 1.02 to 1.34; P=0.029), whereas the association between the second SII tertile and prediabetes was not significant.
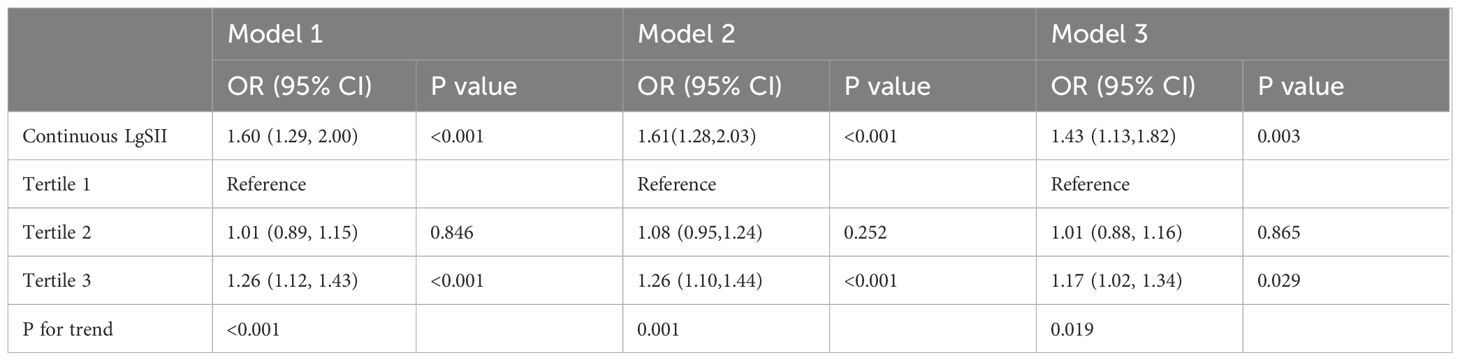
Table 4 The associations between SII and prediabetes.
The multivariable logistic regression model
In the fully adjusted multivariable logistic regression model, age, race, smoking, alcohol consumption, physical activity, ALT, AST, alkaline phosphatase, BMI, triglycerides, and blood chloride levels still show significant associations with the odds of IR (Table 5). Factors significantly associated with the risk of prediabetes include age, gender, race, ALT, AST, BMI, TG, blood chloride levels, and LDH (Table 6). Compared to participants aged 18-39, those aged 40-59 have 2.45 times higher odds of prediabetes, while participants over 60 have 7.04 times higher odds of prediabetes (P<0.001), and a 35.5% higher risk of IR (P<0.001). Compared to Mexican-American individuals, non-Hispanic white individuals have a 27.8% lower likelihood of IR and a 28.2% lower likelihood of prediabetes (P<0.001), while non-Hispanic black individuals have a 24.3% higher risk of IR (P=0.02). Compared to smokers, non-smokers and former smokers have a 50.9% and 56.5% increased odds of IR, respectively (P<0.001).With each unit increase in TG and ALT, the odds of IR increase by 292.2% (P<0.001) and 26% (P<0.001), respectively, while the odds of prediabetes increase by 53.6% and 1% (both P<0.001). Compared to non-obese participants with a BMI less than 30, obese participants have 448% higher odds of IR and 99.8% higher odds of prediabetes (P<0.001).
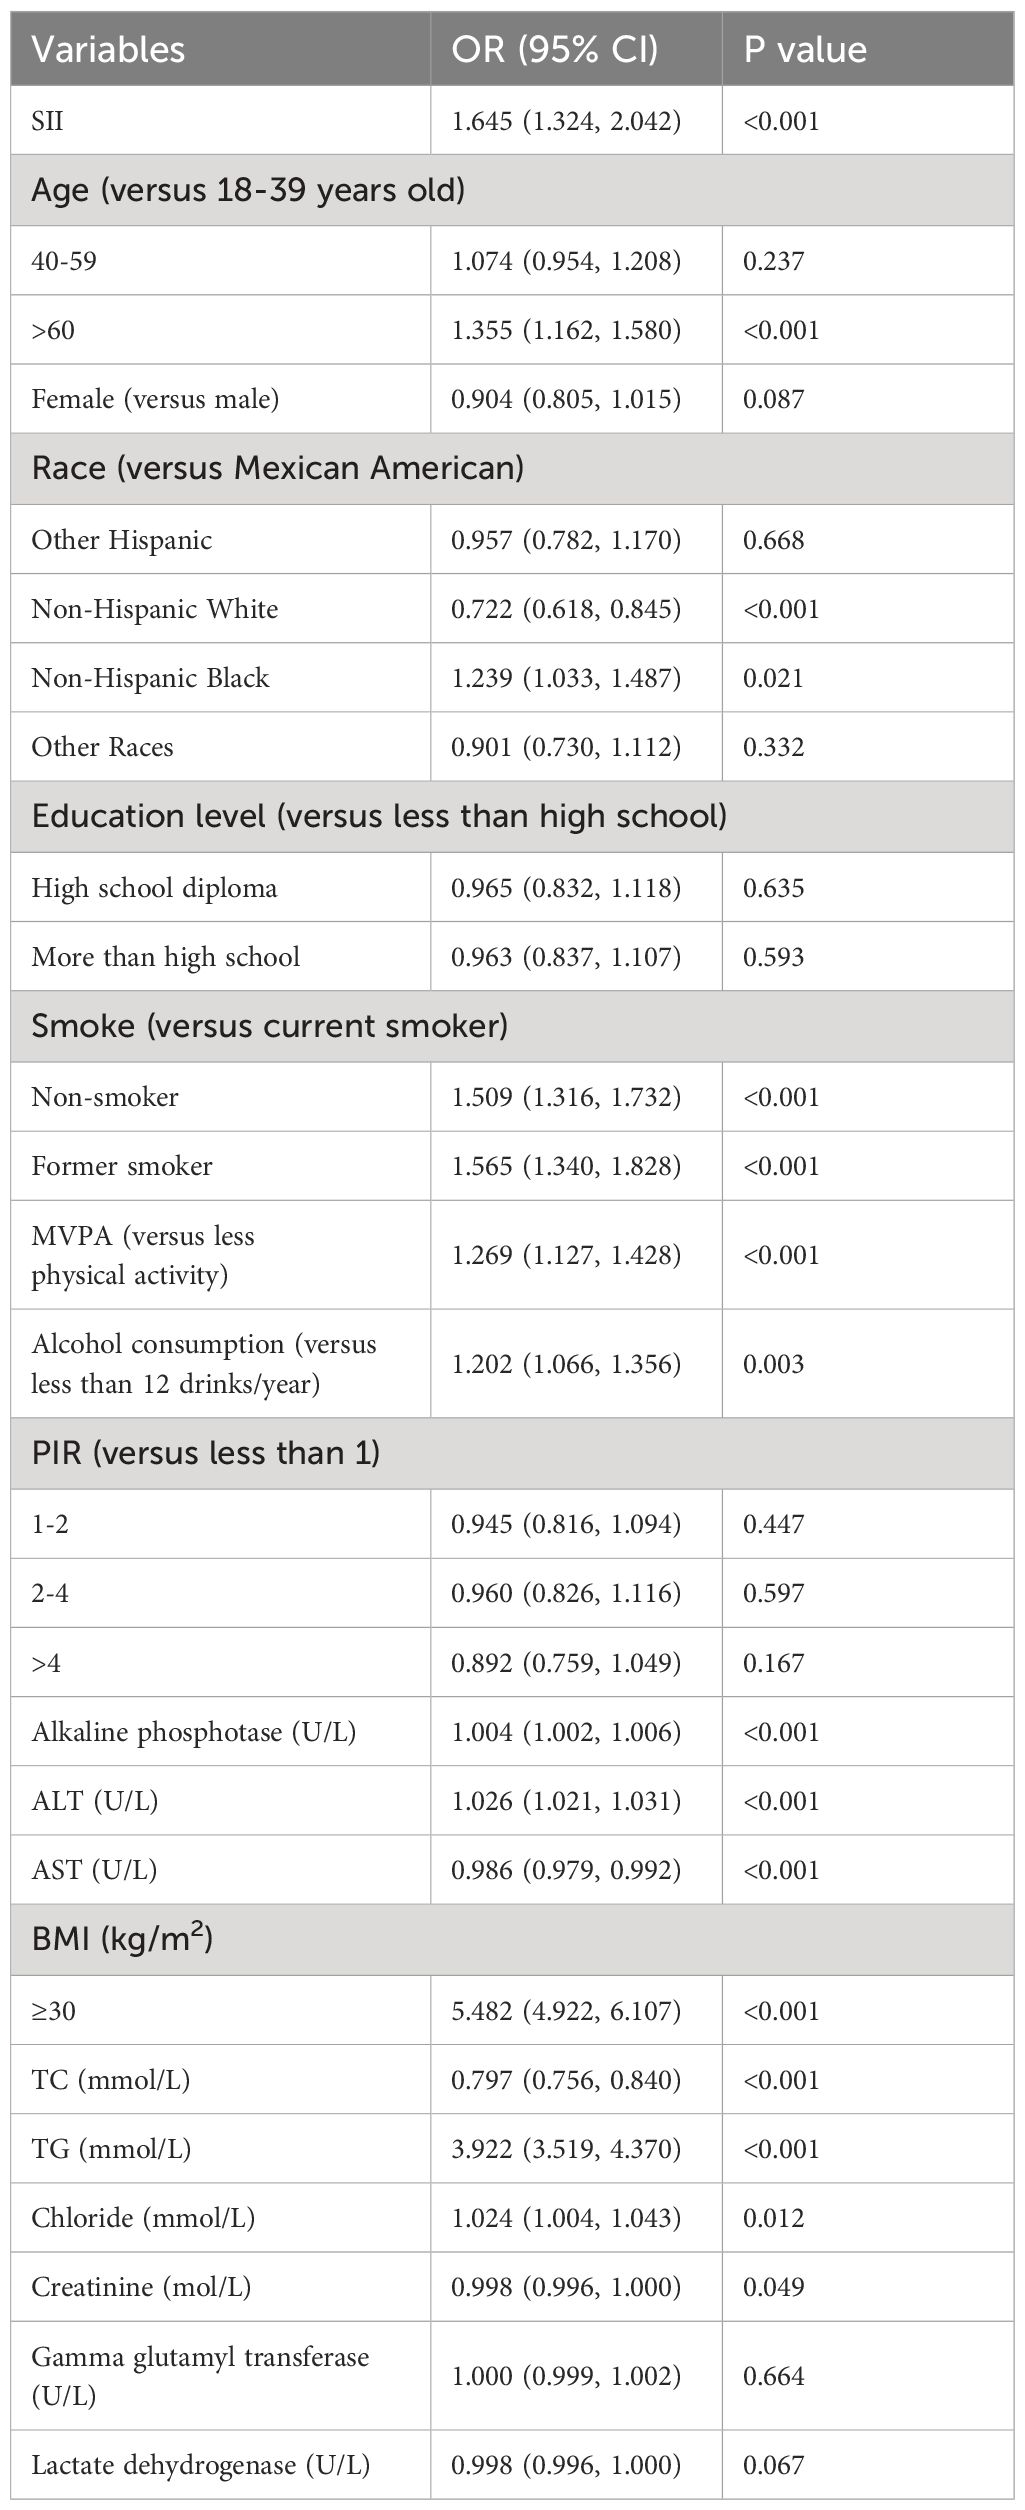
Table 5 Multivariate logistic regression models of IR.
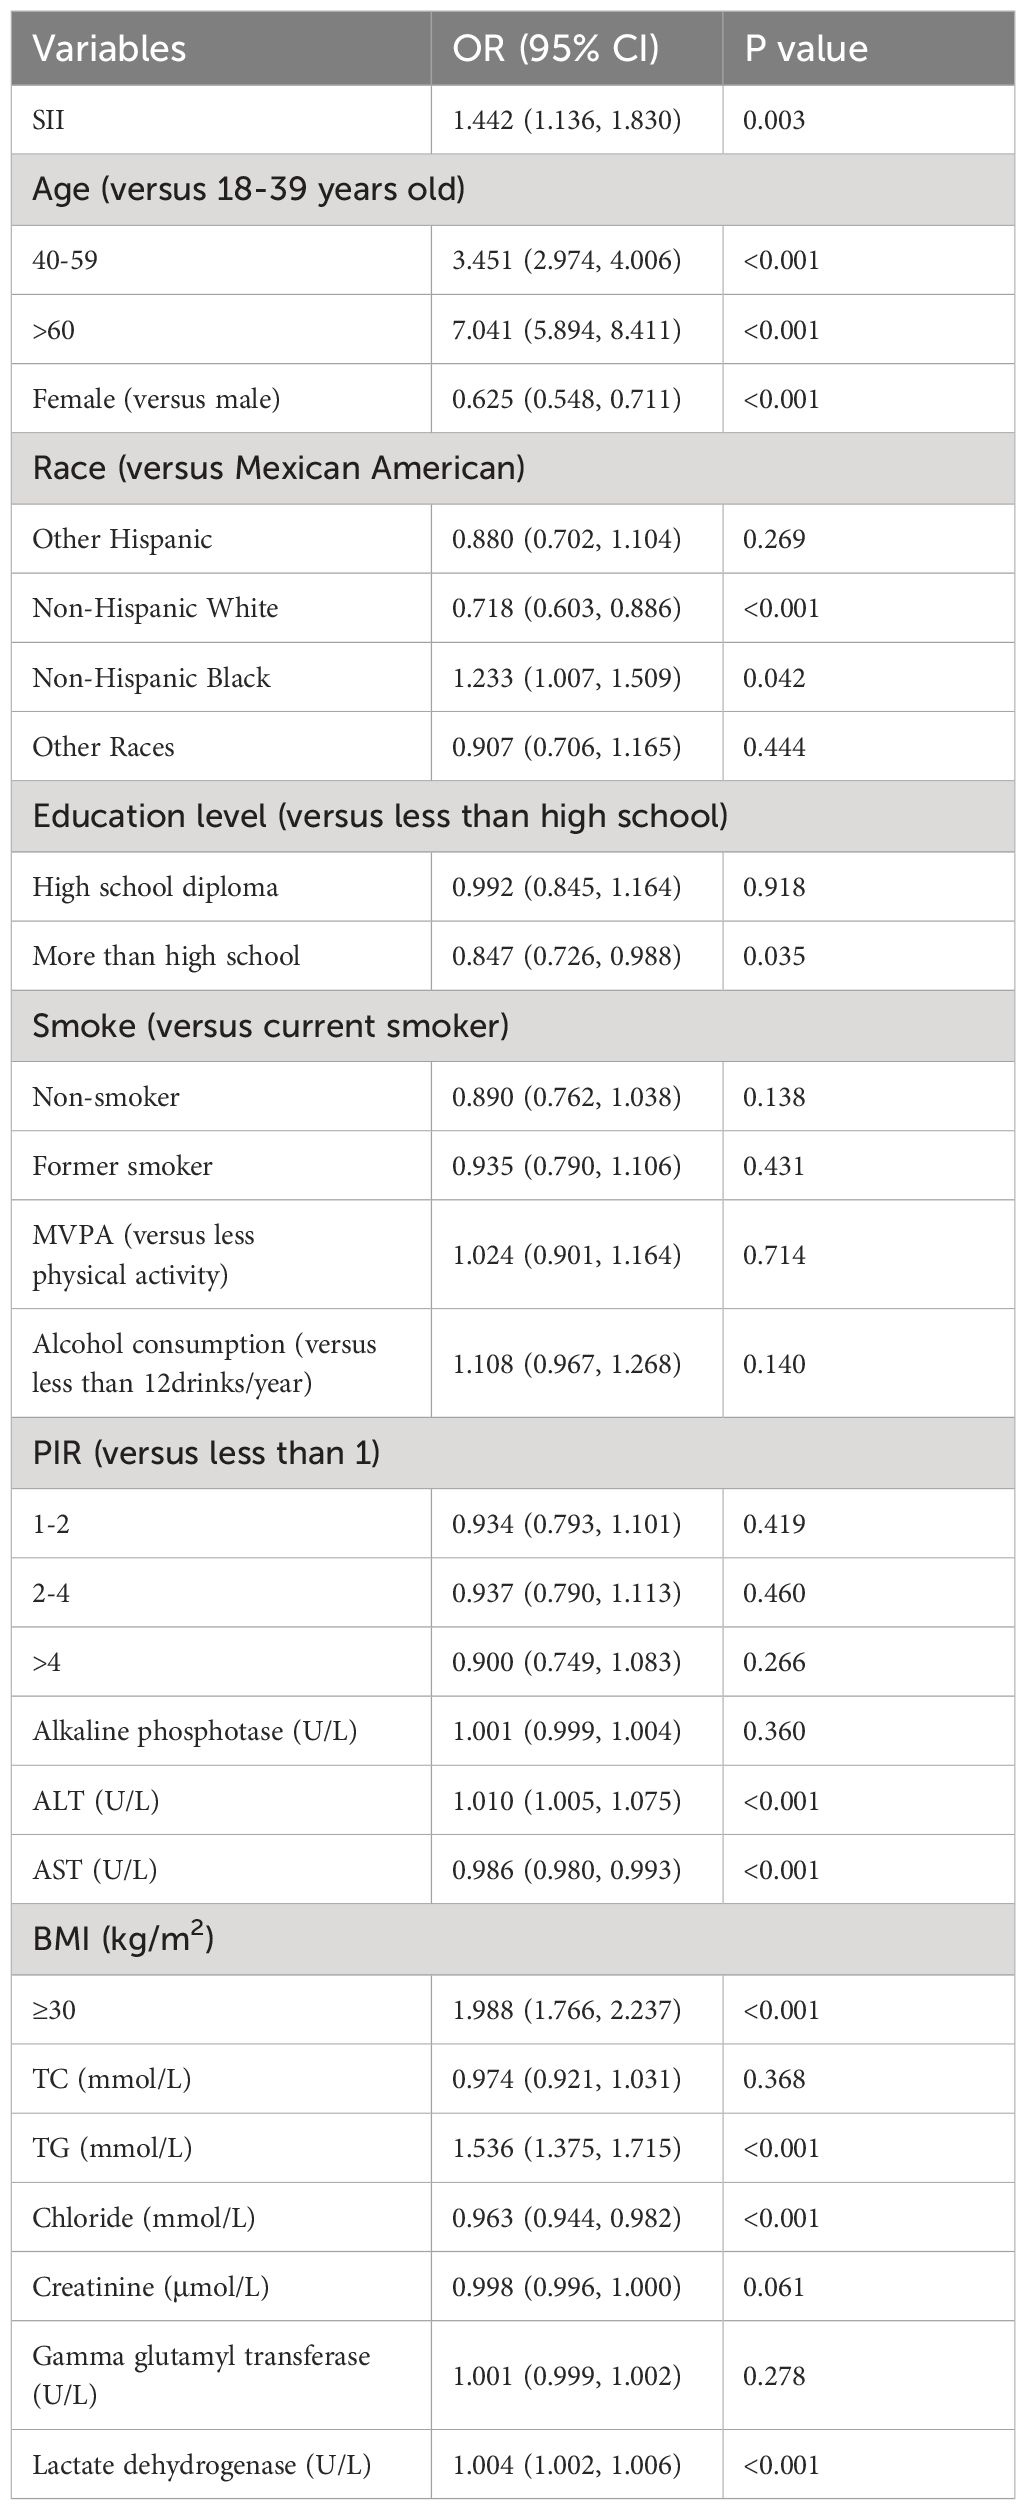
Table 6 Multivariate logistic regression models of prediabetes.
Subgroup analysis
Our subgroup analysis reveals inconsistent associations between SII levels and IR as well as prediabetes (Figures 2, 3). In subgroups based on gender, race, and alcohol consumption, significant associations between SII and IR are detected in each subgroup (all P<0.05).However, among participants with prediabetes, only females, those aged 18-39, non-Hispanic white individuals, those with high school education or less, PIR<1 and 2<PIR<4, former or current smokers, drinkers, and physically active participants show statistically significant associations in subgroups stratified by gender, age, race, education, PIR, smoking status, alcohol consumption, and physical activity. Additionally, interaction tests show that age is the most prominent interacting factor influencing the relationship between SII and IR as well as prediabetes. For younger participants (18-39 years old), with increasing SII levels, the risk of both IR (OR=4.29, 95% CI: 3.11-5.92) and prediabetes (OR=5.78, 95% CI: 3.31-10.08) is significantly higher than in middle-aged participants (P<0.001).Among other factors, physical activity and gender are prominent factors influencing the relationship between SII and IR (P<0.05), and education level may influence the positive correlation between SII and prediabetes (P=0.045).
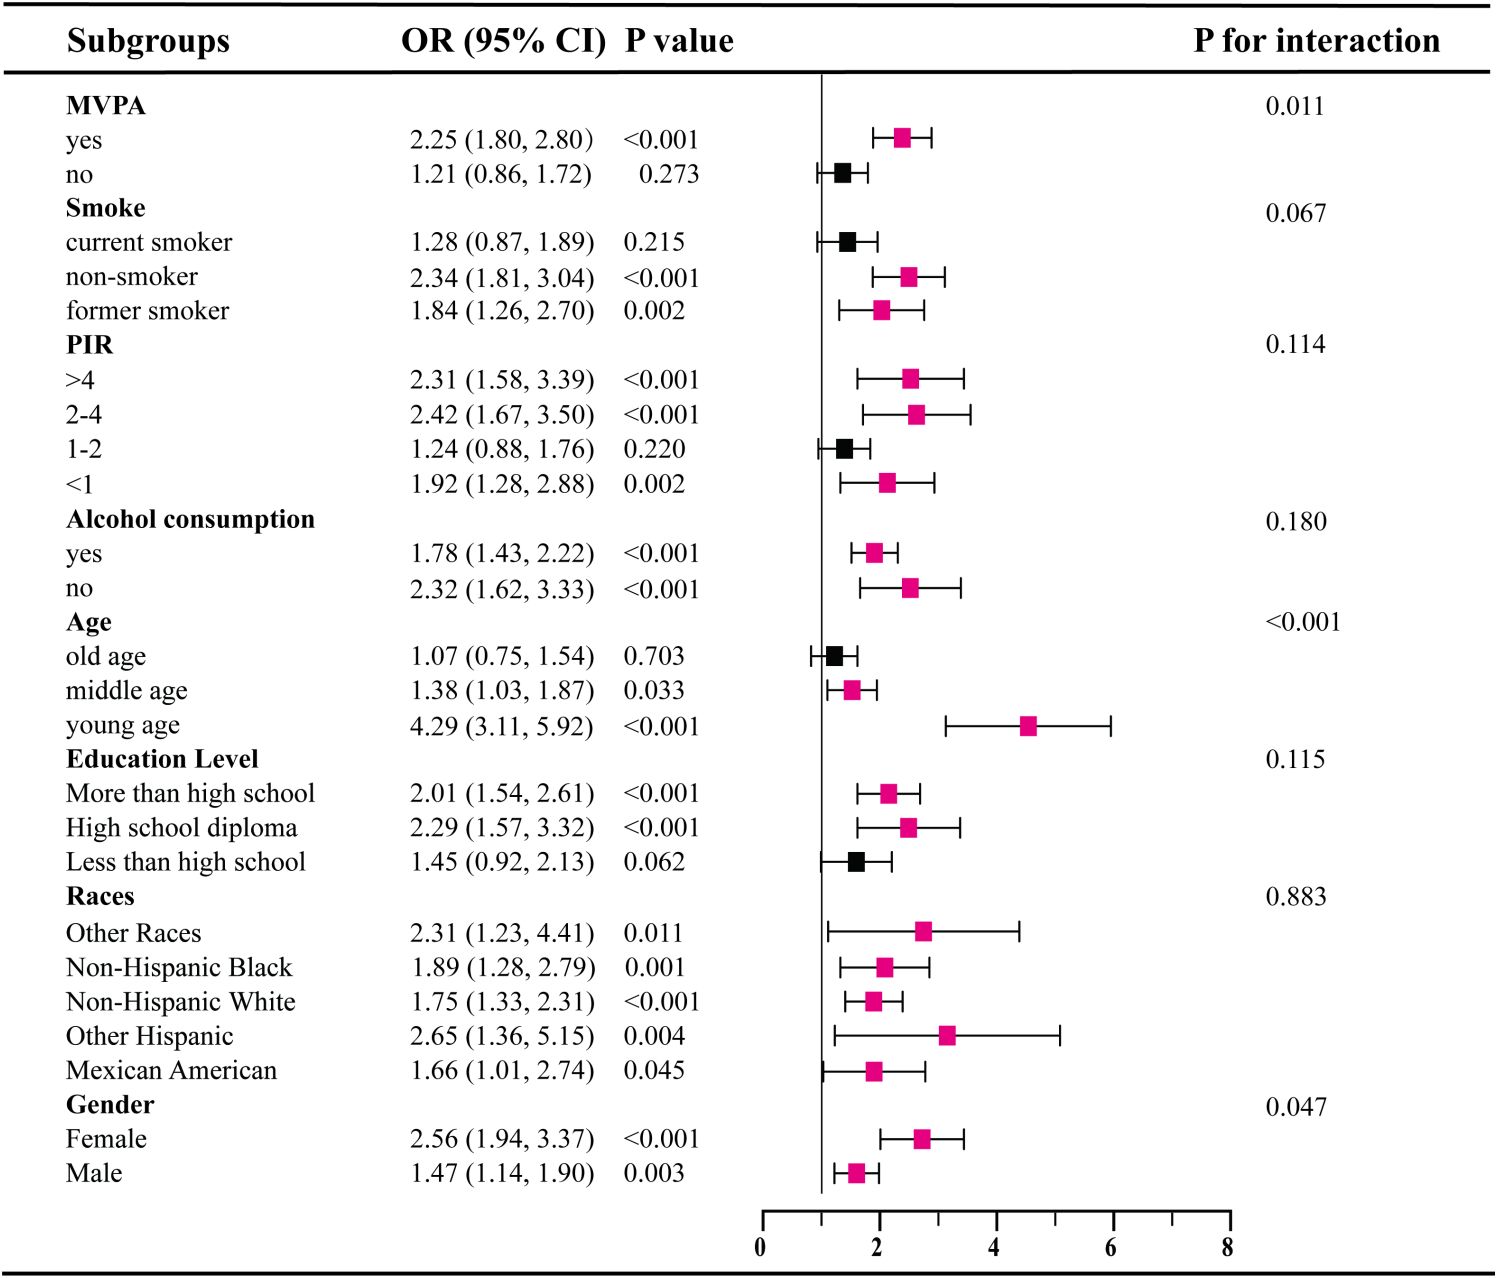
Figure 2 Subgroup analysis for the association between SII and IR.
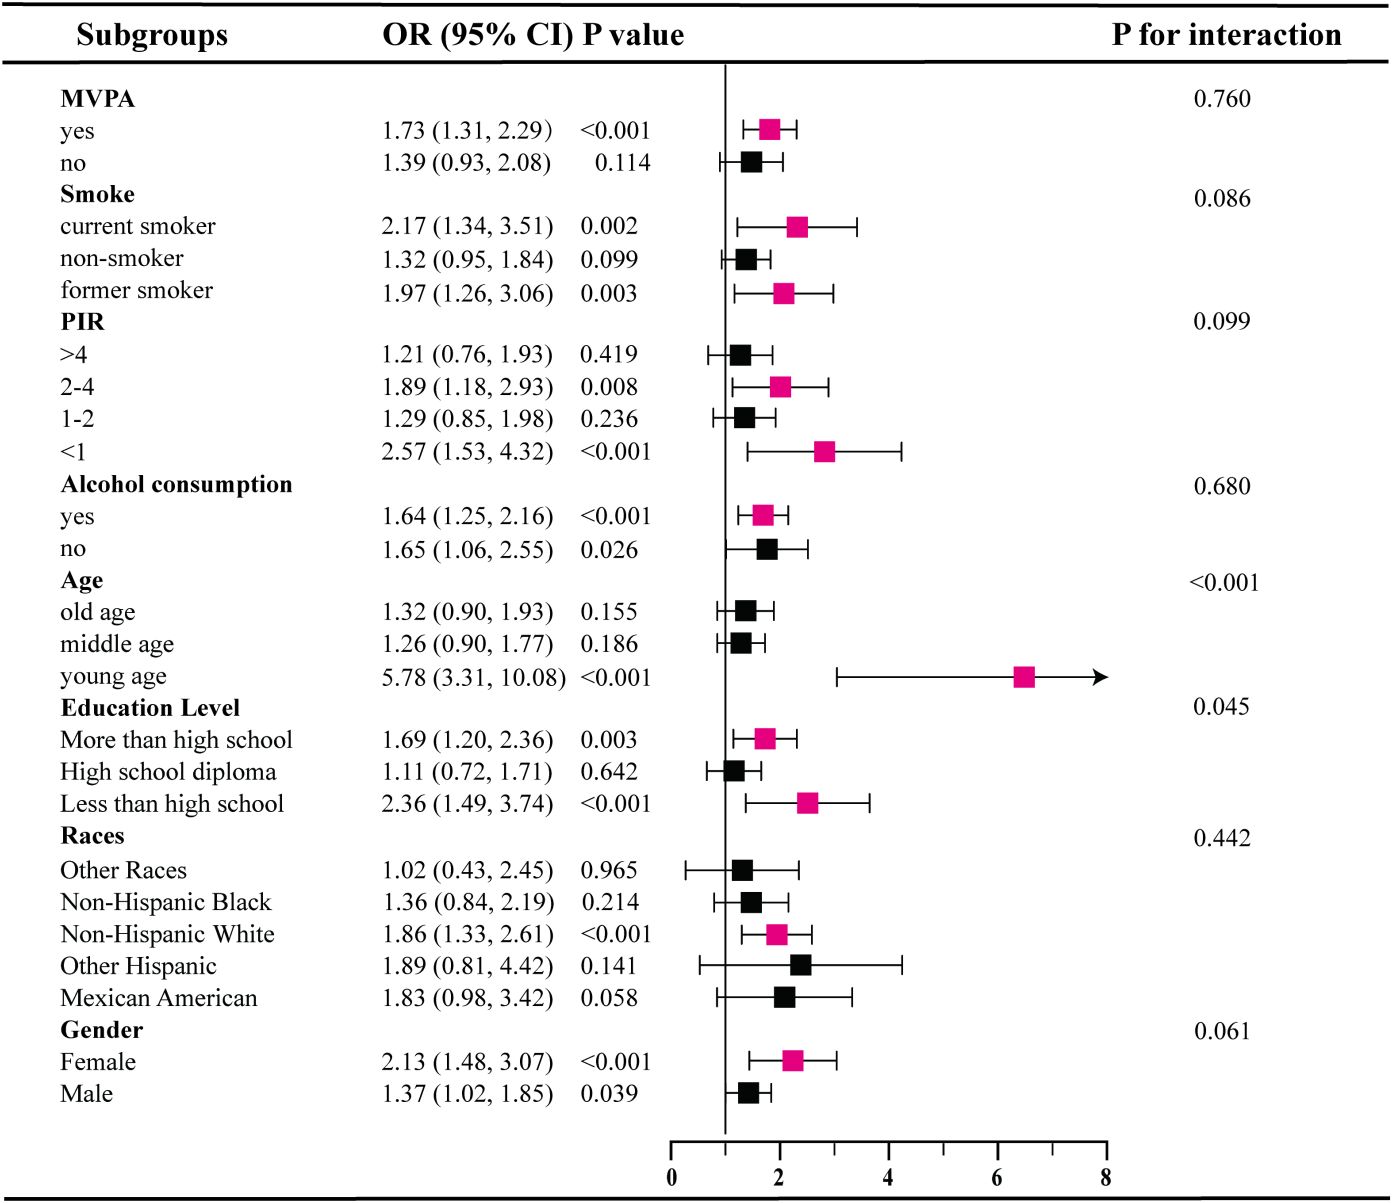
Figure 3 Subgroup analysis for the association between SII and Prediabetes.
Analysis of restricted cubic spline regression
We further assessed the dose-response relationship between SII and prediabetes as well as IR using restricted cubic splines. In a model without adjusting for any covariates, we found a significant non-linear relationship between SII and prediabetes (P=0.017, Figure 4A), and the dose-response curve exhibits an inverted U shape. However, after adjusting for several covariates, the relationship between SII and prediabetes became linear (P>0.05) (Figures 4B, C). Additionally, irrespective of covariate adjustments, there is a linear dose-response relationship between SII scores and IR (Figures 4D–F).
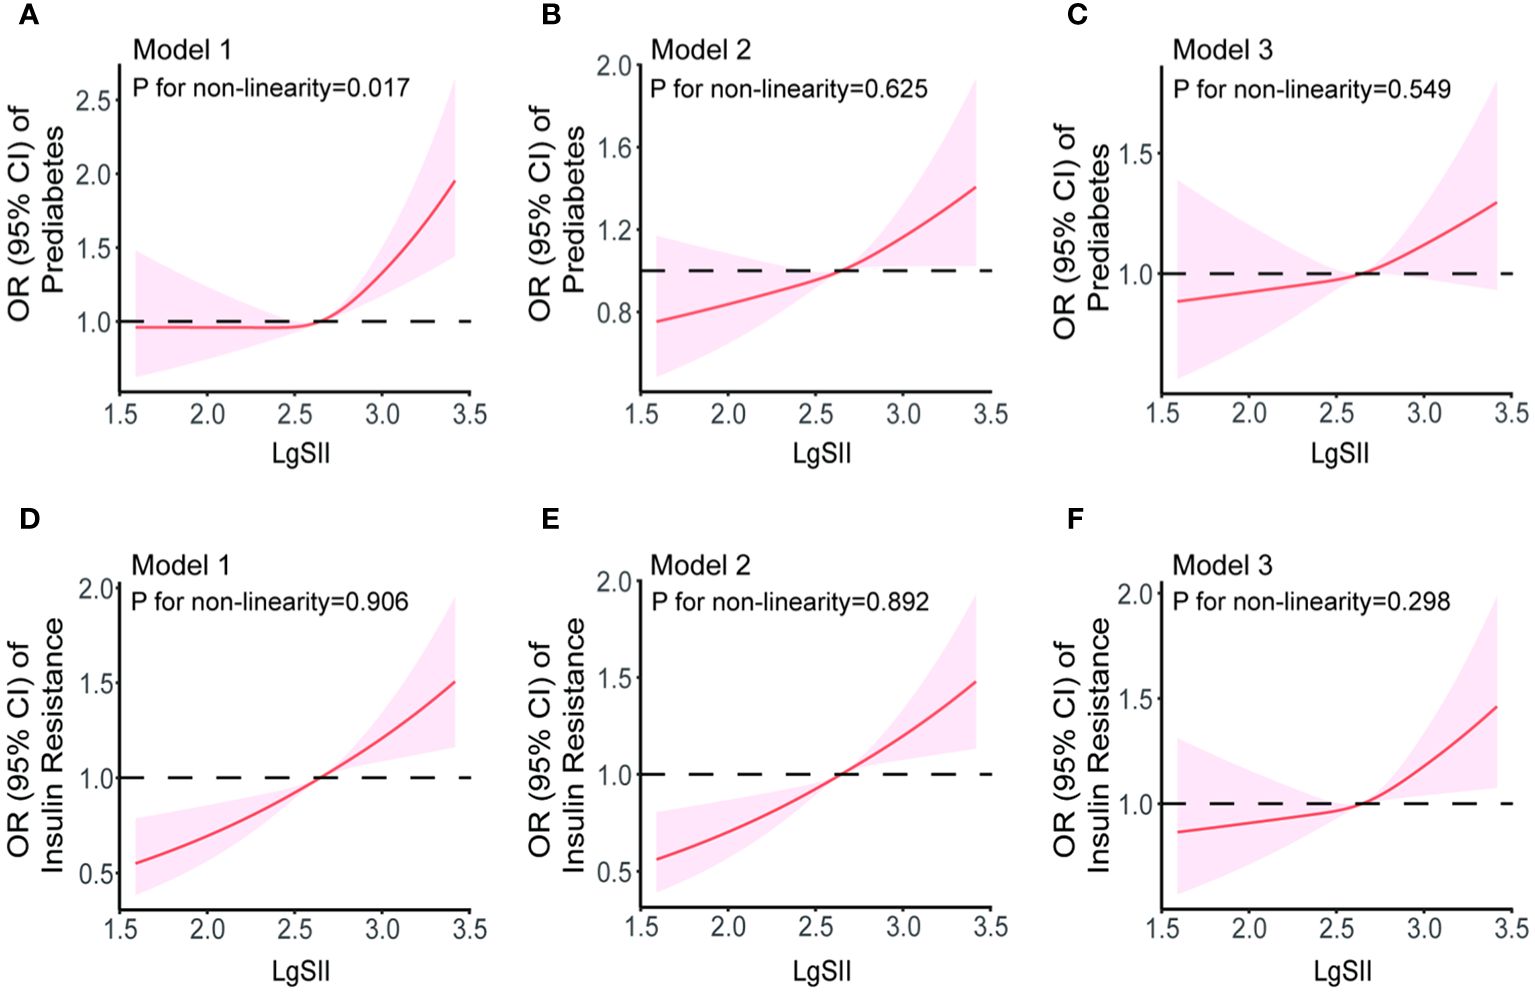
Figure 4 The dose-response relationships of SII with prediabetes (A–C) and IR (D–F) in Model 1 (unadjusted for any covariates), Model 2 (adjusted for covariates including age, gender, race, smoking and drinking status, PIR, education level, and physical activity status) and Model 3 (adjusted for age, gender, race, smoking and drinking status, PIR, education level, physical activity status, BMI, TC, TG, ALT, AST, γ-GGT, ALP, Cr, and LDH). Results were from restricted cubic spline models.
Discussion
To our knowledge, this is the initial investigation assessing the association between SII and prediabetes in the adults of the United States. A recent study have reported a positive linear associations between higher SII and increased risk of IR, which is consistent with our findings. However, their study did not adequately exclude patients with existing diabetes or those taking medications that could affect IR, and our research included a higher number of study populations (23). Therefore, our research results are more reliable and more complete.
In this cross-sectional study involving American adults, we observed a significant correlation between elevated SII levels and risk markers for T2D (FBG, FSI, and HOMA-IR). Furthermore, after further adjusting for potential confounding factors, the association between SII and increased risk of IR and prediabetes persisted. However, the positive correlation between SII and IR or prediabetes is more significant in females than in males. Additionally, the restricted cubic spline model indicates a linear dose-response relationship between SII and the odds of IR and prediabetes. These findings suggest that SII may serve as a monitoring indicator for IR and prediabetes.
Zhao et al. illustrated that continuous SII exhibit a skewed distribution, aligning with the structure of our original data. To approximate it to a normal distribution, they recommended logarithmic transformation of SII (24). From Table 1, it can be seen that some traditional diabetes risk factors, such as older age, smoking, and higher BMI, are more likely to have higher SII values, while protective factors like MVPA are more likely to have lower SII values. Additionally, our study revealed a positive correlation between continuous SII and glycated hemoglobin. However, this correlation vanished after adjusting for confounding factors and categorizing SII into tertiles.
SII is a recognized indicator for predicting cancer treatment outcomes and prognosis. Apart from cancer, the predictive value of SII for other metabolic-related diseases, such as diabetes and cardiovascular diseases, is also gaining attention (25, 26). The study by Nie et al. revealed an association between increased SII and increased prevalence of diabetes (27). Bian et al. found that CAD patients undergoing PCI with worse prognostic outcomes tended to have higher SII values (28). In a cross-sectional study conducted in the United States with 12,402 participants, a significant correlation between SII and metabolic syndrome was found after inclusion (24). Metabolic syndrome is a condition characterized by an aggregation of various metabolic risk factors related to IR and impaired glucose regulation (29). Inspired by this discovery, we focus on whether SII holds equal value in identifying and predicting IR and prediabetes. There are few studies that have independently evaluated the association between SII and IR as well as prediabetes. Numerous studies have indicated a significant association between SII and complications of diabetes.
In the work by Elbeyli, the SII was identified as a potential diagnostic biomarker for diabetic macular edema, with positive implications for improving diabetic retinopathy (30). Özata et al. further explored the correlation between SII and diabetic macular edema, revealing that an elevated SII level might lead to an increased incidence of serous retinal detachment (31). The research of Safak et al. unveiled the potential of SII as a predictive indicator for diabetic foot osteomyelitis (32). Moreover, in a survey of Indonesian diabetic patients, Yohanes and Andy found a significant association between low SII levels and the regulation of psychological well-being in diabetic patients (33).
In clinical studies, both IR and prediabetes have been found to be associated with several traditional inflammatory markers. Jia et al. used the rate nephelometry method to measure serum IMA and hs-CRP concentrations in patients with diabetic retinopathy, finding a positive correlation between hs-CRP concentration and the incidence of diabetic retinopathy (34). Liu et al. suggested that serum hs-CRP concentration can predict the incidence of diabetes (35). However, some studies have found no difference in the presence or absence of hs-CRP with IR. Systemic levels of TNF-a, IL-1b, IL-6, and CRP are elevated in both type 1 and type 2 diabetes patients (36, 37), which is a result of the chronic activation of pro-inflammatory pathways within insulin-target cells (38). Consequently, these cytokines and inflammatory mediators, especially TNF-α, monocyte chemoattractant protein-1 (MCP-1), CRP, and interleukins, are considered potential contributors to IR or impaired B-cell function (39). Additionally, in the study by Shu et al., it was found that the dietary inflammatory index is positively correlated with FBG, FSI, and HOMA-IR, and a more pro-inflammatory diet is associated with increased odds of IR and prediabetes (40).
In recent years, an increasing number of studies have focused on the significance of common inflammatory markers in blood routine examinations in the diagnosis and treatment of metabolic diseases. Additionally, Christine Lee and colleagues investigated the relationship between various white blood cell subtypes and IR in high-risk individuals, finding a positive correlation with all white blood cell subtypes, including granulocytes, lymphocytes, and monocytes (41). Karakaya studied 96 obese patients and 40 healthy controls, discovering a positive correlation between IR and white blood cell count, with NLR higher in obese IR patients than non-IR obese patients (42). Rodríguez-Rodríguez et al. also found a similar phenomenon in children (43). Some studies suggest that participants resistant to insulin have significantly higher platelet counts than insulin-sensitive participants (44). Hwang et al. found that with an increase in platelet count, the incidence of diabetes also increased, indicating that platelets are a potential risk marker (11). However, in the study by Rodríguez-Rodríguez, it was found that high platelet values do not constitute a risk factor for the occurrence of IR in children, and no relationship was observed between IR and PLR (43). In related reports, it seems that NLR is better at predicting inflammation than PLR, as neutrophils play a dominant role in inflammation by releasing vasoactive and cytotoxic substances (such as reactive oxygen species and digestive enzymes) during inflammation, leading to increased endothelial permeability (45). Therefore, it is necessary to introduce a more accurate SII index that includes platelet count for further research.
In various studies on inflammatory markers, SII, with its advantage of integrating three key immune cells, provides a more comprehensive description of the body’s inflammatory state compared to traditional single inflammatory biomarkers. For instance, Berbudi et al. revealed that SII, in predicting the impact of T2D on the immune system, demonstrates more precise and effective predictive capability than NLR, PLR, and MLR, as significantly confirmed by ROC curve analysis (46). Furthermore, the study by Nicoară’s team confirms that, in differentiating whether obese children have metabolic syndrome, SII exhibits higher diagnostic efficacy compared to NLR, PLR, and SIRI. It also shows a positive correlation with the HOMA-IR (47). These findings offer a new perspective for clinically assessing inflammatory and metabolic abnormal states.
The primary strength of this study is the inclusion of a large number of samples. Based on NHANES database, we analyzed a total of 9250 samples from 2005 to 2018, including self-reports, laboratory tests, and physical examinations. These data were collected by professionals through a standardized procedure, significantly reducing errors caused by different methods. The enormous sample size and standardized data contribute to obtaining meaningful and highly reliable results even after multiple condition screenings. And this study not only screened diabetic patients based on fasting blood glucose level >7.0 mmol/L but also excluded potential diabetic patients based on medication use and HbA1c levels. Additionally, to explore the impact of confounding factors on the association between SII and IR and prediabetes, we conducted stratified analyses. The results revealed that factors such as age, gender, race, education level, and family income-poverty ratio had some impact on the incidence of IR and prediabetes. For example, older patients have higher SII values and are at higher risk for IR and prediabetes. And our results show that women are more likely to have higher SII values than men, suggesting that they are more likely to have IR as well as pre-diabetes. Furthermore, lifestyle factors such as smoking, more alcohol consumption, and lower physical activity level were also positively associated with the risk of developing IR and prediabetes. Finally, we used non-restrictive cubic spline plots to analyze the nonlinear relationship between SII and IR and prediabetes, providing a more comprehensive understanding of their development and risk factors.
However, this study has certain limitations. Firstly, the nature of observational research restricts our analysis of causal relationships, leaving room for multiple interpretations, including both causation and reverse causation. Therefore, prospective studies are urgently needed to clarify the precise connections among these factors. Additionally, despite adjusting for various covariates, potential confounding factors such as dietary patterns and a family history of T2D might still be overlooked. It’s worth noting that, although diet has a significant impact on circulating TG levels, fasting blood samples collected in this study may not fully capture this aspect. Future research should delve into exploring the specific influence of dietary factors on study results.
Despite some limitations and drawbacks, our study still holds significant clinical relevance. As a novel inflammatory biomarker, SII not only offers the advantage of non-invasiveness but also provides a more comprehensive approach to assessing immune and inflammatory responses. The results of this study confirm our previous hypothesis that SII can serve as crucial indicators for diagnosing IR and prediabetes. In an era where IR is prevalent, often elusive, and troubling to primary care communities, the SII scoring system, comprising three simple and efficient hematological indicators, provides a practical diagnostic tool for primary healthcare practitioners. In the future, we plan to initiate a multicenter prospective cohort study to explore the effectiveness of SII as an independent predictor of IR and prediabetes. The goal is to offer prospective guidance and intervention for high-risk individuals through routine blood cell count monitoring, aiming for prevention and protection.
Conclusion
In conclusion, this study indicates a positive correlation between SII and FBG, FSI, and HOMA-IR, so higher SII levels may increase the odds of IR and prediabetes. Therefore, SII is poised to be a direct and cost-effective method for identifying patients with IR and prediabetes.
Data availability statement
The datasets presented in this study can be found in online repositories. The names of the repository/repositories and accession number(s) can be found below: https://www.cdc.gov/nchs/nhanes/.
Ethics statement
The studies involving humans were approved by National Center for Health Statistics. The studies were conducted in accordance with the local legislation and institutional requirements. The human samples used in this study were acquired from gifted from another research group. Written informed consent for participation was not required from the participants or the participants’ legal guardians/next of kin in accordance with the national legislation and institutional requirements. Written informed consent was obtained from the individual(s) for the publication of any potentially identifiable images or data included in this article.
Author contributions
HG: Writing – original draft, Validation, Methodology, Data curation. CW: Writing – original draft, Methodology. JZ: Writing – original draft. XJ: Writing – review & editing, Project administration. SL: Writing – review & editing, Supervision, Conceptualization.
Funding
The author(s) declare financial support was received for the research, authorship, and/or publication of this article. This work was supported by the National Natural Science Foundation of China (NSFC No. 81570694).
Conflict of interest
The authors declare that the research was conducted in the absence of any commercial or financial relationships that could be construed as a potential conflict of interest.
Publisher’s note
All claims expressed in this article are solely those of the authors and do not necessarily represent those of their affiliated organizations, or those of the publisher, the editors and the reviewers. Any product that may be evaluated in this article, or claim that may be made by its manufacturer, is not guaranteed or endorsed by the publisher.
References
1. Xu NY, Nguyen KT, DuBord AY, Pickup J, Sherr JL, Teymourian H, et al. Diabetes technology meeting 2021. J Diabetes Sci Technol. (2022) 16:1016–56. doi: 10.1177/19322968221090279
2. Association AD. Economic costs of diabetes in the U.S. @ in 2012. Diabetes Care. (2013) 36:1033–46. doi: 10.2337/dc12-2625
3. Brunetti A, Chiefari E, Foti D. Recent advances in the molecular genetics of type 2 diabetes mellitus. World J Diabetes. (2014) 5:128–40. doi: 10.4239/wjd.v5.i2.128
4. Rudvik A, Månsson M. Evaluation of surrogate measures of insulin sensitivity - correlation with gold standard is not enough. BMC Med Res Methodol. (2018) 18:64. doi: 10.1186/s12874-018-0521-y
5. Mirabelli M, Chiefari E, Arcidiacono B, Corigliano DM, Brunetti FS, Maggisano V, et al. Mediterranean diet nutrients to turn the tide against insulin resistance and related diseases. Nutrients. (2020) 12:1066. doi: 10.3390/nu12041066
6. Weaver JR, Odanga JJ, Breathwaite EK, Treadwell ML, Murchinson AC, Walters G, et al. An increase in inflammation and islet dysfunction is a feature of prediabetes. Diabetes Metab Res Rev. (2021) 37:e3405. doi: 10.1002/dmrr.3405
7. Rohm TV, Meier DT, Olefsky JM, Donath MY. Inflammation in obesity, diabetes, and related disorders. Immunity. (2022) 55:31–55. doi: 10.1016/j.immuni.2021.12.013
8. Daryabor G, Kabelitz D, Kalantar K. An update on immune dysregulation in obesity-related insulin resistance. Scand J Immunol. (2019) 89:e12747. doi: 10.1111/sji.12747
9. Nishimura S, Manabe I, Nagasaki M, Eto K, Yamashita H, Ohsugi M, et al. CD8+ effector T cells contribute to macrophage recruitment and adipose tissue inflammation in obesity. Nat Med. (2009) 15:914–20. doi: 10.1038/nm.1964
10. Hu B, Yang XR, Xu Y, Sun YF, Sun C, Guo W, et al. Systemic immune-inflammation index predicts prognosis of patients after curative resection for hepatocellular carcinoma. Clin Cancer Res. (2014) 20:6212–22. doi: 10.1158/1078-0432.CCR-14-0442
11. Huang H, Liu Q, Zhu L, Zhang Y, Lu X, Wu Y, et al. Prognostic value of preoperative systemic immune-inflammation index in patients with cervical cancer. Sci Rep. (2019) 9:3284. doi: 10.1038/s41598-019-39150-0
12. Chien TM, Li CC, Lu YM, Chou YH, Chang HW, Wu WJ. The predictive value of systemic immune-inflammation index on bladder recurrence on upper tract urothelial carcinoma outcomes after radical nephroureterectomy. J Clin Med. (2021) 10:5273. doi: 10.21203/rs.3.rs-829449/v1
13. Xu H, Feng H, Zhang W, Wei F, Zhou L, Liu L, et al. Prediction of immune-related adverse events in non-small cell lung cancer patients treated with immune checkpoint inhibitors based on clinical and hematological markers: Real-world evidence. Exp Cell Res. (2022) 416:113157. doi: 10.1016/j.yexcr.2022.113157
14. Chen JH, Zhai ET, Yuan YJ, Wu KM, Xu JB, Peng JJ, et al. Systemic immune-inflammation index for predicting prognosis of colorectal cancer. World J Gastroenterol. (2017) 23:6261–72. doi: 10.3748/wjg.v23.i34.6261
15. He K, Si L, Pan X, Sun L, Wang Y, Lu J, et al. Preoperative systemic immune-inflammation index (SII) as a superior predictor of long-term survival outcome in patients with stage I-II gastric cancer after radical surgery. Front Oncol. (2022) 12:829689. doi: 10.3389/fonc.2022.829689
16. Yang YL, Wu CH, Hsu PF, Chen SC, Huang SS, Chan WL, et al. Systemic immune-inflammation index (SII) predicted clinical outcome in patients with coronary artery disease. Eur J Clin Invest. (2020) 50:e13230. doi: 10.1111/eci.13230
17. Wang J, Zhou D, Dai Z, Li X. Association between systemic immune-inflammation index and diabetic depression. Clin Interv Aging. (2021) 16:97–105. doi: 10.2147/CIA.S285000
18. Guo W, Song Y, Sun Y, Du H, Cai Y, You Q, et al. Systemic immune-inflammation index is associated with diabetic kidney disease in Type 2 diabetes mellitus patients: Evidence from NHANES 2011-2018. Front Endocrinol (Lausanne). (2022) 13:1071465. doi: 10.3389/fendo.2022.1071465
19. Song Y, Guo W, Li Z, Guo D, Li Z, Li Y. Systemic immune-inflammation index is associated with hepatic steatosis: Evidence from NHANES 2015-2018. Front Immunol. (2022) 13:1058779. doi: 10.3389/fimmu.2022.1058779
20. Zhang J, Jiang J, Qin Y, Zhang Y, Wu Y, Xu H. Systemic immune-inflammation index is associated with decreased bone mass density and osteoporosis in postmenopausal women but not in premenopausal women. Endocr Connect. (2023) 12:e220461. doi: 10.1530/EC-22-0461
21. Ahmad T, Ismail A, Ahmad SA, Khalil KA, Kumar Y, Adeyemi KD, et al. Recent advances on the role of process variables affecting gelatin yield and characteristics with special reference to enzymatic extraction: A review. Food Hydrocolloids. (2017) 63:85–96. doi: 10.1016/j.foodhyd.2016.08.007
22. Jomrich G, Paireder M, Kristo I, Baierl A, Ilhan-Mutlu A, Preusser M, et al. High systemic immune-inflammation index is an adverse prognostic factor for patients with gastroesophageal adenocarcinoma. Ann Surg. (2021) 273:532–41. doi: 10.1097/SLA.0000000000003370
23. Deng X, Liu D, Li M, He J, Fu Y. Association between systemic immune-inflammation index and insulin resistance and mortality. Sci Rep. (2024) 14:2013. doi: 10.1038/s41598-024-51878-y
24. Zhao Y, Shao W, Zhu Q, Zhang R, Sun T, Wang B, et al. Association between systemic immune-inflammation index and metabolic syndrome and its components: results from the National Health and Nutrition Examination Survey 2011-2016. J Transl Med. (2023) 21:691. doi: 10.1186/s12967-023-04491-y
25. Fan W, Zhang Y, Gao X, Liu Y, Shi F, Liu J, et al. The prognostic value of a derived neutrophil-lymphocyte ratio in patients with acute coronary syndrome undergoing percutaneous coronary intervention. Clin Appl Thromb Hemost. (2021) 27:10760296211034579. doi: 10.1177/10760296211034579
26. Kelesoglu S, Yilmaz Y, Elcık D, Kalay N. Systemic immune inflammation index: a novel predictor for coronary collateral circulation. Perfusion. (2022) 37:605–12. doi: 10.1177/02676591211014822
27. Nie Y, Zhou H, Wang J, Kan H. Association between systemic immune-inflammation index and diabetes: a population-based study from the NHANES. Front Endocrinol (Lausanne). (2023) 14:1245199. doi: 10.3389/fendo.2023.1245199
28. Bian X, He J, Zhang R, Yuan S, Dou K. The combined effect of systemic immune-inflammation index and type 2 diabetes mellitus on the prognosis of patients undergoing percutaneous coronary intervention: A large-scale cohort study. J Inflammation Res. (2023) 16:6415–29. doi: 10.2147/JIR.S445479
29. DeBoer MD. Assessing and managing the metabolic syndrome in children and adolescents. Nutrients. (2019) 11:1788. doi: 10.3390/nu11081788
30. Elbeyli A, Kurtul BE, Ozcan SC, Ozarslan Ozcan D. The diagnostic value of systemic immune-inflammation index in diabetic macular oedema. Clin Exp Optom. (2022) 105:831–5. doi: 10.1080/08164622.2021.1994337
31. Özata Gündoğdu K, Doğan E, Çelik E, Alagöz G. Serum inflammatory marker levels in serous macular detachment secondary to diabetic macular edema. Eur J Ophthalmol. (2022) 32:3637–43. doi: 10.1177/11206721221083465
32. Ozer Balin S, Ozcan EC, Uğur K. A new inflammatory marker of clinical and diagnostic importance in diabetic foot infection: systemic immune-inflammation index. Int J Low Extrem Wounds. (2022). doi: 10.1177/15347346221130817
33. Rias YA, Tsai HT, Thato R, Apriyanto BS, Chou KR, Ho SC, et al. Synergistic interactions of insufficient physical activity and a high systemic immune-inflammation index on psychological problems in Indonesians with type 2 diabetes mellitus. Biol Res Nurs. (2023) 25:516–26. doi: 10.1177/10998004231162050
34. Jia ZT, Liu CY, Li H. Changes of the concentration of serum ischemia modified albumin and high sensitivity C-reactive protein in type 2 diabetic patients with retinopathy. Zhonghua Yan Ke Za Zhi. (2009) 45:805–8.
35. Liu HH, Zhao D, Wang W, Qin LP, Liu J, Sun JY, et al. Association between high sensitivity C-reactive protein levels in serum and the 5-year-accumulative-risk of diabetes. Zhonghua Liu Xing Bing Xue Za Zhi. (2011) 32:1–4.
36. Kim CS, Park HS, Kawada T, Kim JH, Lim D, Hubbard NE, et al. Circulating levels of MCP-1 and IL-8 are elevated in human obese subjects and associated with obesity-related parameters. Int J Obes (Lond). (2006) 30:1347–55. doi: 10.1038/sj.ijo.0803259
37. Kato K, Otsuka T, Saiki Y, Kobayashi N, Nakamura T, Kon Y, et al. Association between elevated C-reactive protein levels and prediabetes in adults, particularly impaired glucose tolerance. Can J Diabetes. (2019) 43:40–5.e2. doi: 10.1016/j.jcjd.2018.03.007
38. Olefsky JM, Glass CK. Macrophages, inflammation, and insulin resistance. Annu Rev Physiol. (2010) 72:219–46. doi: 10.1146/annurev-physiol-021909-135846
39. Yaribeygi H, Farrokhi FR, Butler AE, Sahebkar A. Insulin resistance: Review of the underlying molecular mechanisms. J Cell Physiol. (2019) 234:8152–61. doi: 10.1002/jcp.27603
40. Shu Y, Wu X, Wang J, Ma X, Li H, Xiang Y. Associations of dietary inflammatory index with prediabetes and insulin resistance. Front Endocrinol (Lausanne). (2022) 13:820932. doi: 10.3389/fendo.2022.820932
41. Lee CT, Harris SB, Retnakaran R, Gerstein HC, Perkins BA, Zinman B, et al. White blood cell subtypes, insulin resistance and β-cell dysfunction in high-risk individuals–the PROMISE cohort. Clin Endocrinol (Oxf). (2014) 81:536–41. doi: 10.1111/cen.12390
42. Karakaya S, Altay M, Kaplan Efe F, Karadağ İ, Ünsal O, Bulur O, et al. The neutrophil-lymphocyte ratio and its relationship with insulin resistance in obesity. Turk J Med Sci. (2019) 49:245–8. doi: 10.3906/medical
43. Rodríguez-Rodríguez E, Salas-González MD, Ortega RM, López-Sobaler AM. Leukocytes and neutrophil-lymphocyte ratio as indicators of insulin resistance in overweight/obese school-children. Front Nutr. (2021) 8:811081. doi: 10.3389/fnut.2021.811081
44. Chen LK, Lin MH, Chen ZJ, Hwang SJ, Chiou ST. Association of insulin resistance and hematologic parameters: study of a middle-aged and elderly Chinese population in Taiwan. J Chin Med Assoc. (2006) 69:248–53. doi: 10.1016/S1726-4901(09)70251-5
45. Boueiz A, Hassoun PM. Regulation of endothelial barrier function by reactive oxygen and nitrogen species. Microvasc Res. (2009) 77:26–34. doi: 10.1016/j.mvr.2008.10.005
46. Berbudi A, Rahmadika N, Tjahjadi AI, Ruslami R. Type 2 diabetes and its impact on the immune system. Curr Diabetes Rev. (2020) 16:442–9. doi: 10.2174/1573399815666191024085838
Keywords: systemic immune-inflammation index, insulin resistance, prediabetes, cross-sectional study, NHANES
Citation: Guo H, Wan C, Zhu J, Jiang X and Li S (2024) Association of systemic immune-inflammation index with insulin resistance and prediabetes: a cross-sectional study. Front. Endocrinol. 15:1377792. doi: 10.3389/fendo.2024.1377792
Received: 28 January 2024; Accepted: 20 May 2024;
Published: 05 June 2024.
Edited by:
Jian Ma, Harbin Medical University, ChinaReviewed by:
Jiakun Lu, University of California, Los Angeles, United StatesWei Sun, University of Michigan, United States
Yuning Shen, University of Michigan, United States
Copyright © 2024 Guo, Wan, Zhu, Jiang and Li. This is an open-access article distributed under the terms of the Creative Commons Attribution License (CC BY). The use, distribution or reproduction in other forums is permitted, provided the original author(s) and the copyright owner(s) are credited and that the original publication in this journal is cited, in accordance with accepted academic practice. No use, distribution or reproduction is permitted which does not comply with these terms.
*Correspondence: Shufa Li, shufali@qdu.edu.cn; Xiuxing Jiang, jxx0521@tmmu.edu.cn
†These authors have contributed equally to this work and share first authorship