 Zhao Liu
 Qianlan Xu2
- 1Department of Breast and Thyroid Surgery, Shaoxing Central Hospital, The Central Affiliated Hospital, Shaoxing University, Shaoxing, China
- 2Department of gynecology, Shaoxing Central Hospital, The Central Affiliated Hospital, Shaoxing University, Shaoxing, China
Background: The real-time prognostic data of patients with poorly differentiated thyroid carcinoma (PDTC) after surviving for several years was unclear. This study aimed to employ a novel method to dynamically estimate survival for PDTC patients.
Methods: A total of 913 patients diagnosed with PDTC between 2014 and 2015 from the Surveillance, Epidemiology, and End Results (SEER) database, was recruited in our study. Kaplan–Meier method was used to estimate the overall survival (OS). The conditional survival (CS) outcomes of PDTC were analyzed and CS rates were calculated using the formula CS(y/x) = OS(y+x)/OS(x), whereby CS(y/x) denotes the probability of a patient enduring an additional y years subsequent to surviving x years following the diagnosis of PDTC. The least absolute shrinkage and selection operator (LASSO) regression was employed to identify prognostic predicters and multivariate Cox regression was utilized to develop a CS-nomogram. Finally, the performance of this model was evaluated and validated.
Results: Kaplan–Meier survival analysis unveiled patient outcomes demonstrating an OS rate of 83%, 75%, and 60% respectively at the end of 3, 5, and 10 years. The novel CS analysis highlighted a progressive enhancement in survival over time, with the 10-year cumulative survival rate progressively augmenting from its initiation of 60% to 66%, 69%, 73%, 77%, 81%, 83%, 88%, 93%, and finally 97% (after surviving for 1-9 years, respectively) each year. And then 11 (11/15) predictors including age at diagnosis, sex, histology type, SEER stage, T stage, N stage, M stage, tumor size, coexistence with other malignancy, radiotherapy and marital status, were selected by LASSO analysis under the condition of lambda.min. Multivariate Cox regression analysis further highlighted the significant impact of all these predictors on the OS of PDTC and we successfully established and validated a novel CS-nomogram for real-time and dynamic survival prediction.
Conclusions: This was the first study to analyze the CS pattern and demonstrate a gradual improvement in CS over time in long-term PDTC survivors. We then successfully developed and validated a novel CS-nomogram for individualized, dynamic, and real-time survival forecasting, empowering clinicians to adapt and refine the patient-tailored treatment strategy promptly with consideration of evolving risks.
Introduction
Poorly differentiated thyroid carcinoma (PDTC), a predominantly rare clinical entity, comprises approximately 2-15% of the total diagnosed thyroid cancers (1–4). The term of PDTC emerged initially during the 1980s, yet its definitive acknowledgement as a unique pathological classification did not occur until the issuance of the most recent version of the Endocrine Tumor Classification system by the World Health Organization (WHO) in 2004 (5). As defined by the WHO classification, PDTC possesses a unique natural course and histopathological traits which establish it as an intermediary entity between well-differentiated and undifferentiated (anaplastic) thyroid malignancies (6). And in these tumors, advanced stage metastases are prevalent, with lung and bone representing the most frequent sites of disseminated metastases (7). Owing to its aggressive characteristics, PDTC stands as the predominant contributor to cancer-specific mortality within non-anaplastic follicular cell-derived thyroid carcinomas, signifying an urgent demand for further research on this disease.
With advancements in screening methodology and treatment strategy, the survival of these PDTC patients has improved significantly, demonstrating 5- and 10-year overall survival (OS) rates of 70% and 50%, respectively (8, 9). Nevertheless, these survival data offer solely a restricted predictive value for new individuals who receive their diagnoses. And long-term survivors may exhibit heightened concern regarding precise information on survival evaluation. However, traditional survival evaluations, estimated from the time of diagnosis, failed to provide accurate survival predictions for individuals who maintained survival for multiple years. Thus, utilization of an innovative prognostication computation methodology is imperative to supply precise and real-time survival data for these patients.
Conditional survival (CS), which was defined as the probability that a patient would survive for a further β years after surviving for α years after diagnosis, could calculate real-time survival data and provide continuously updated predictive insights for cancer patients (10–12). And CS analysis, compared to traditional survival methods like Kaplan-Meier estimates, offers the unique ability to provide dynamic survival probabilities that evolve over time, reflecting the changing risk for patients who have already survived a certain period post-diagnosis. And this novel computational methodology has been extensively employed across several cancer types (13–16); however, the CS outcomes for PDTC remains unexplored.
Therefore, the aim of the present study was to analyze the CS of PDTC patients and propose a novel CS-integrated nomogram model for dynamic prognosis prediction based on the latest version of the Surveillance, Epidemiology and End Results (SEER) database.
Methods
SEER data source, patients and clinical variables
The SEER database, which covers approximately 34.6% of the population of the United States, possessing prospective data collection, obviated the necessity for institutional review board approval for this research. PDTC cases diagnosed between 2004 and 2015 were extracted from the SEER database using SEER*Stat (version 8.3.8) software. A total of 913 poorly differentiated grade III samples recognized with a pathologically verified PDTC as defined by the International Classification of Diseases for Oncology 3rd Edition (ICD-O-3) site classification, encompassing papillary thyroid carcinoma (PTC, 8050/3, 8260/3, and 8340/3), follicular thyroid carcinoma (FTC, 8330/3), and insular thyroid carcinoma (ITC, 8337/3).
Variables of interest included age at diagnosis (aged ≤40, 41-60 and >60 years), sex, race (white and nonwhite), histology type (PTC, FTC and ITC), SEER stage (localized, regional and distant), tumor size (<20mm, 20-39mm, and ≥40mm), coexistence with other malignancy, T stage (T1, T2, T3 and T4), N stage (N0 and N1), M stage (M0 and M1), as well as surgical procedures performed (non-total thyroidectomy and total thyroidectomy), receipt of radiotherapy treatment (no and yes), marital status categories (single, married and unknown), rural-urban (nonmetropolitan and metropolitan) and household income (<$65000 and ≥$65000). In the context of the SEER database, the definition for radiotherapy relates exclusively to treatment employing beam radiation, radioiodine, or a blend of the aforementioned.
Statistical analysis
The primary endpoint of this study was OS, with designated duration being the period extending from the time of initial diagnosis until either mortality or the final documented follow-up appointment. Categorical data was presented in the form of counts and associated percentages.
Conditional survival analysis
The Kaplan-Meier method was used to estimate OS and absolute hazard ratio. The CS rate was calculated using the formula CS(y/x) = OS(y+x)/OS(x), whereby CS(y/x) denotes the probability of a patient enduring an additional y years subsequent to surviving x years following the diagnosis of PDTC; and OS(y/x) and OS(x), respectively refer to the (y/x)-and x-year OS rates estimated via the Kaplan-Meier approach.
Annual hazard rate
The annual hazard was computed by subdividing temporal duration into distinct sections over years, then determining the mortality statistic independently for each section, i.e., annual hazard rate=the count of casualties within a year/cumulative follow-up patients in the year (17).
CS-nomogram development
To establish the CS-nomogram, the identified patients were haphazardly stratified into the training and testing cohorts in a proportionate ratio of 7 to 3. For the predictor selection, we employed the Least Absolute Shrinkage and Selection Operator (LASSO) regression technique in conjunction with a stringent 10-fold cross-validation protocol, thereby mitigating the potential drawbacks of model overfitting. The filtered predictive indicators were elucidated regarding their influence on PDTC survival via multivariate Cox regression, subsequently utilized in the development of a CS-nomogram model. Our novel research endeavor incorporated the CS formula into the bespoke nomogram to allow for personalized predictors and dynamic survival estimation for individuals afflicted by PDTC.
Risk classification system construction
The CS-nomogram quantified these predictive factors as points, where incorporating the patient’s unique variables could culminate into a total point score. Then we developed a risk classification system based on the optimal threshold of point scores among all patients to execute risk stratification for these patients. The Kaplan–Meier method with a log-rank test was conducted to evaluate the discrepancies in OS across different risk groups.
Prediction model evaluation and validation
Calibration plots were employed for comparative evaluation of the projected survival outcomes from our nomogram against the observed outcome data. The discriminatory power of the CS-nomogram was critically evaluated via varies methodologies, encompassing the concordance index (C-index), and receiver operating characteristic (ROC) curves paired with the area under this curve (AUC). The C-index is a metric used to assess the predictive accuracy of survival models. The C-index value ranges from 0.5 to 1, with values closer to 1 indicating stronger predictive capability of the model. And the time-dependent ROC curve allows for the assessment of a model’s predictive performance at various time points. By examining these curves, one can evaluate how well the model performs throughout the follow-up period and discern whether it excels in early or late predictions. Moreover, the efficacy of the clinical application of this prediction model was verified through Decision Curve Analysis (DCA), which quantified the potential net advantage garnered by utilizing the nomogram.
This study’s statistical analysis was conducted utilizing the R (version 4.1.0), with a significance level set at P values inferior to 0.05 for binary analyses.
Results
Demographic and clinicopathological features
We incorporated clinical data of 913 individuals diagnosed with PDTC from the SEER database within our analysis, randomizing them into two distinct cohorts, including a training group and testing group at a ratio of 7:3. Among all individuals diagnosed with PDTC, those over the age of 60 represented 44.0%, females comprised 61.2%, and a substantial 77.9% were white. Concerning the clinical pathological attributes, the vast majority of PDTCs were of the PTC subtype (69.3%), exceeding 40mm in size (47.6%) and exhibiting a localized/regional stage (81.2%). Regarding treatment, the vast majority underwent total thyroidectomy (88.8%) and radiotherapy in 69.8% of patients. Detailed information on these PDTC patients is depicted in Table 1.

Table 1. Patient clinicopathologic characteristics in PDTC.
Conditional survival and annual hazards over time in PDTC patients
Traditional survival analysis unveiled patient outcomes demonstrating an OS rate of 83%, 75%, and 60% respectively at the end of 3, 5, and 10 years. The novel CS analysis highlighted a progressive enhancement in survival over time, with the 10-year cumulative survival rate progressively augmenting from its initiation of 60% to 66%, 69%, 73%, 77%, 81%, 83%, 88%, 93%, and finally 97% (after surviving for 1-9 years, respectively) each year (Figure 1A). The CS(1|x) curve, demonstrating the probability of patients enduring multiple years preceding an additional year of survival, showed graphically a potentially substantial enhancement in survival within the initial year post-diagnosis (Figure 1B). Moreover, the annual hazard curve elucidated the non-linear enhancement in PDTC survival over time by evaluating the instantaneous mortality of survivors and the Figure 1C showed the annual mortality rate of PDTC progressively declined from the initial diagnosis.

Figure 1. Conditional survival of PDTC patients. Kaplan-Meier method for estimating conditional survival after surviving for 0-9 years (A); 10-year conditional survival curves for PDTC patients and the survival rate curve for the next year after surviving a certain time (B); Annual hazard rate curve (C).
Prediction model variable screening and nomogram construction
We then carried out the LASSO regression with 10-fold cross-validation in training cohort to screen prognostic factors for CS-nomogram construction. Ultimately, 11 (11/15) predictors including age at diagnosis, sex, histology type, SEER stage, T stage, N stage M stage, tumor size, coexistence with other malignancy, radiotherapy and marital status, were selected by LASSO analysis under the condition of lambda.min (Figures 2A, B). In LASSO regression, lambda.min is determined as the value of lambda that minimizes the cross-validated prediction error. And multivariate Cox regression analysis further highlighted the significant impact of all these predictors on the OS of PDTC (Figure 2C, P<0.05) and was used to develop a CS-nomogram model. Compared to traditional survival prediction models, the CS-nomogram utilized in this study yielded CS predictions, enabling patients to ascertain not only 3-, 5- and 10-year OS after inputting personalized clinicopathological factors but also 10-year CS contingent upon the number of years they had survived post-diagnosis (Figure 3).

Figure 2. Prognostic factors identification. The least absolute shrinkage and selection operator (LASSO) regression for screening prognostic factors (A, B). Multivariate Cox regression forest plot showing the effect of predictors on overall survival of PDTC (C). HR, hazard ratio; PDTC, poorly differentiated thyroid carcinoma; PTC, papillary thyroid carcinoma; FTC, follicular thyroid carcinoma; ITC, insular thyroid carcinoma.
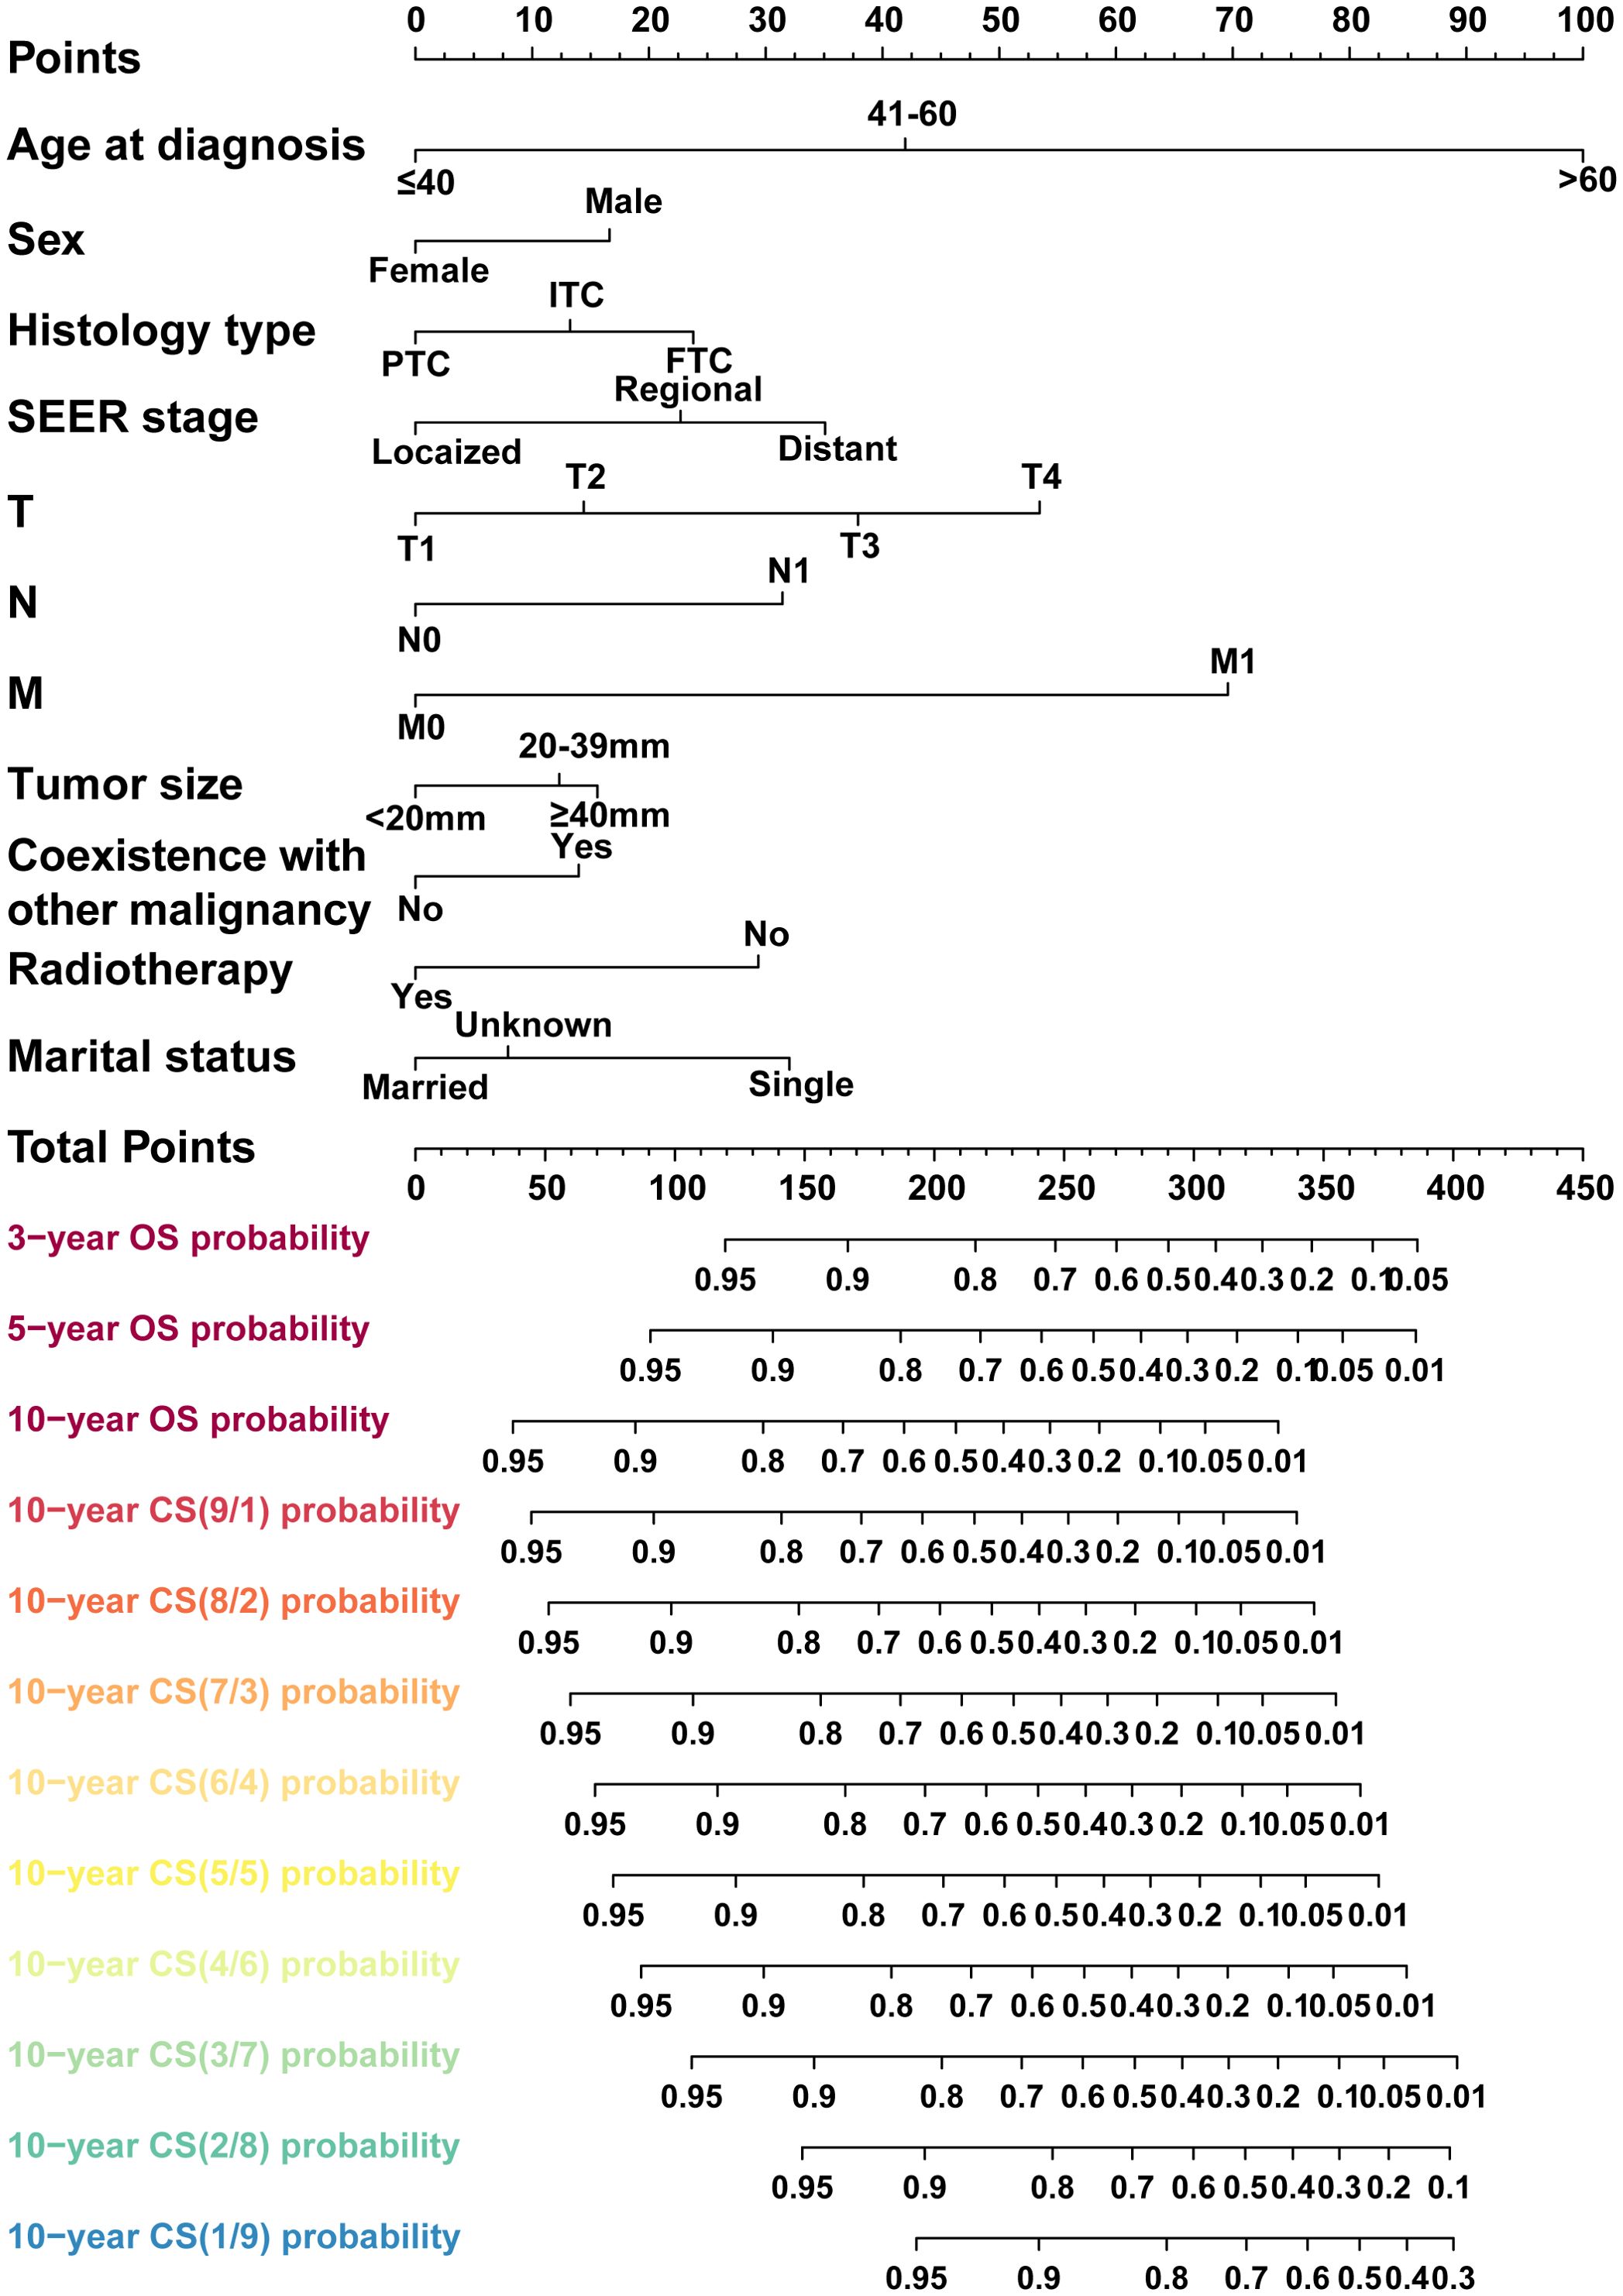
Figure 3. A conditional survival-based nomogram model was successfully developed for predicting 10-year CS for PDTC patients. PDTC, poorly differentiated thyroid carcinoma. PTC, papillary thyroid carcinoma; FTC, follicular thyroid carcinoma; ITC, insular thyroid carcinoma.
CS-nomogram evaluation and validation
The present investigation evaluated the performance of the model in regards to accuracy, discrimination and utility. The C-index was applied to quantify the prediction ability of the nomogram model, yielding respective values of 0.798 and 0.703 in internal training and validation cohorts. Subsequently, nomogram calibration curves were depicted for 3-year, 5-year and 10-year intervals within each cohort, indicating a substantial consistency between anticipated and actual survival probabilities in both cohorts (Figures 4A, B). Besides, the time-dependent ROC at 3-, 5-, and 10-year AUC values in predicting CS were 0.83, 0.82, and 0.86 for the training set as well as 0.81, 0.81 and 0.81 for the validation set, respectively (Figures 4C, D). These results demonstrated the model had strong and consistent predictive performance across different time points, with stable AUC values in both the training and validation sets, indicating its robustness and reliable long-term predictive capability. Ultimately, DCA analysis was employed to evaluate the demonstrable clinical utility and advantages of the CS-nomogram in terms of predicting CS for PDTC patients. And these analyses at 3, 5 and 10 years demonstrated elevated net benefits across a range of mortality risks in both training and validation cohort for our novel CS-nomogram (Figures 5A, B), confirming the practical value of this clinical tool.
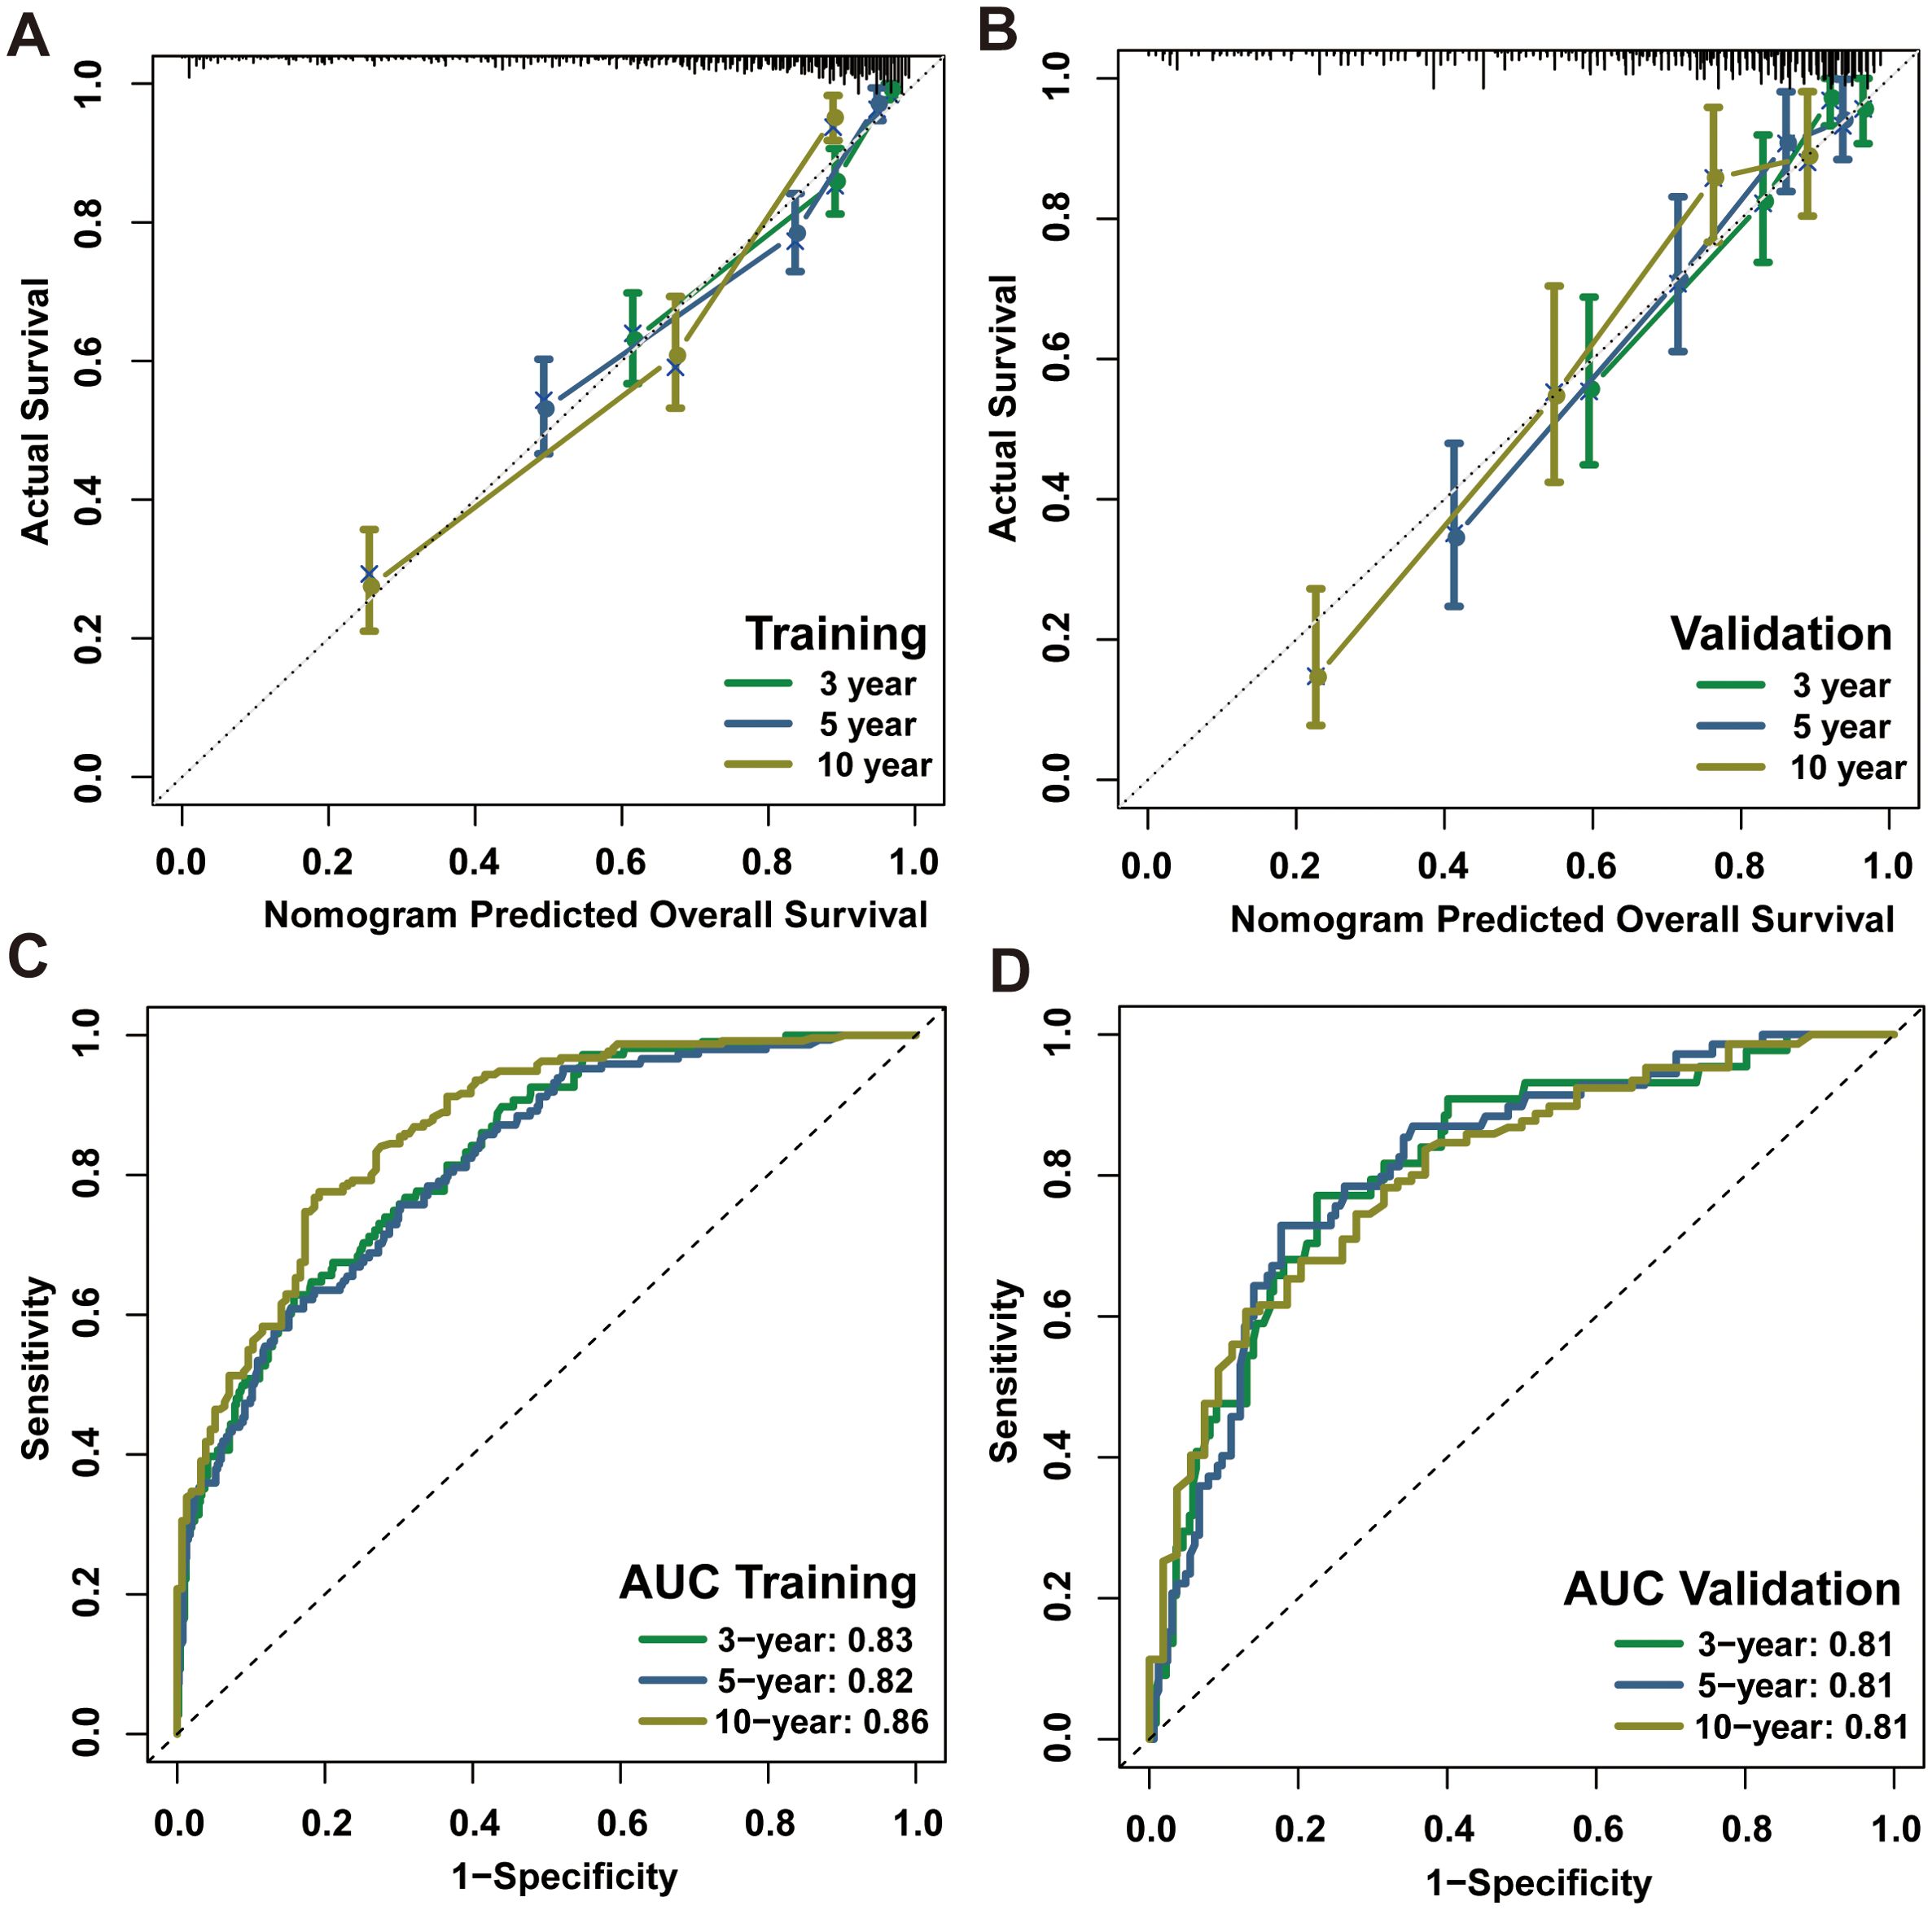
Figure 4. Calibration plots and ROC curves with AUC values for the CS-nomogram at 3, 5 and 10 years. Calibration plots of the CS-nomogram in training (A) and validation (B) cohorts; ROC curves of the CS-nomogram in training (C) and validation (D) cohorts. AUC, areas under the ROC curve; ROC, receiver operating characteristic curve; CS, conditional survival.
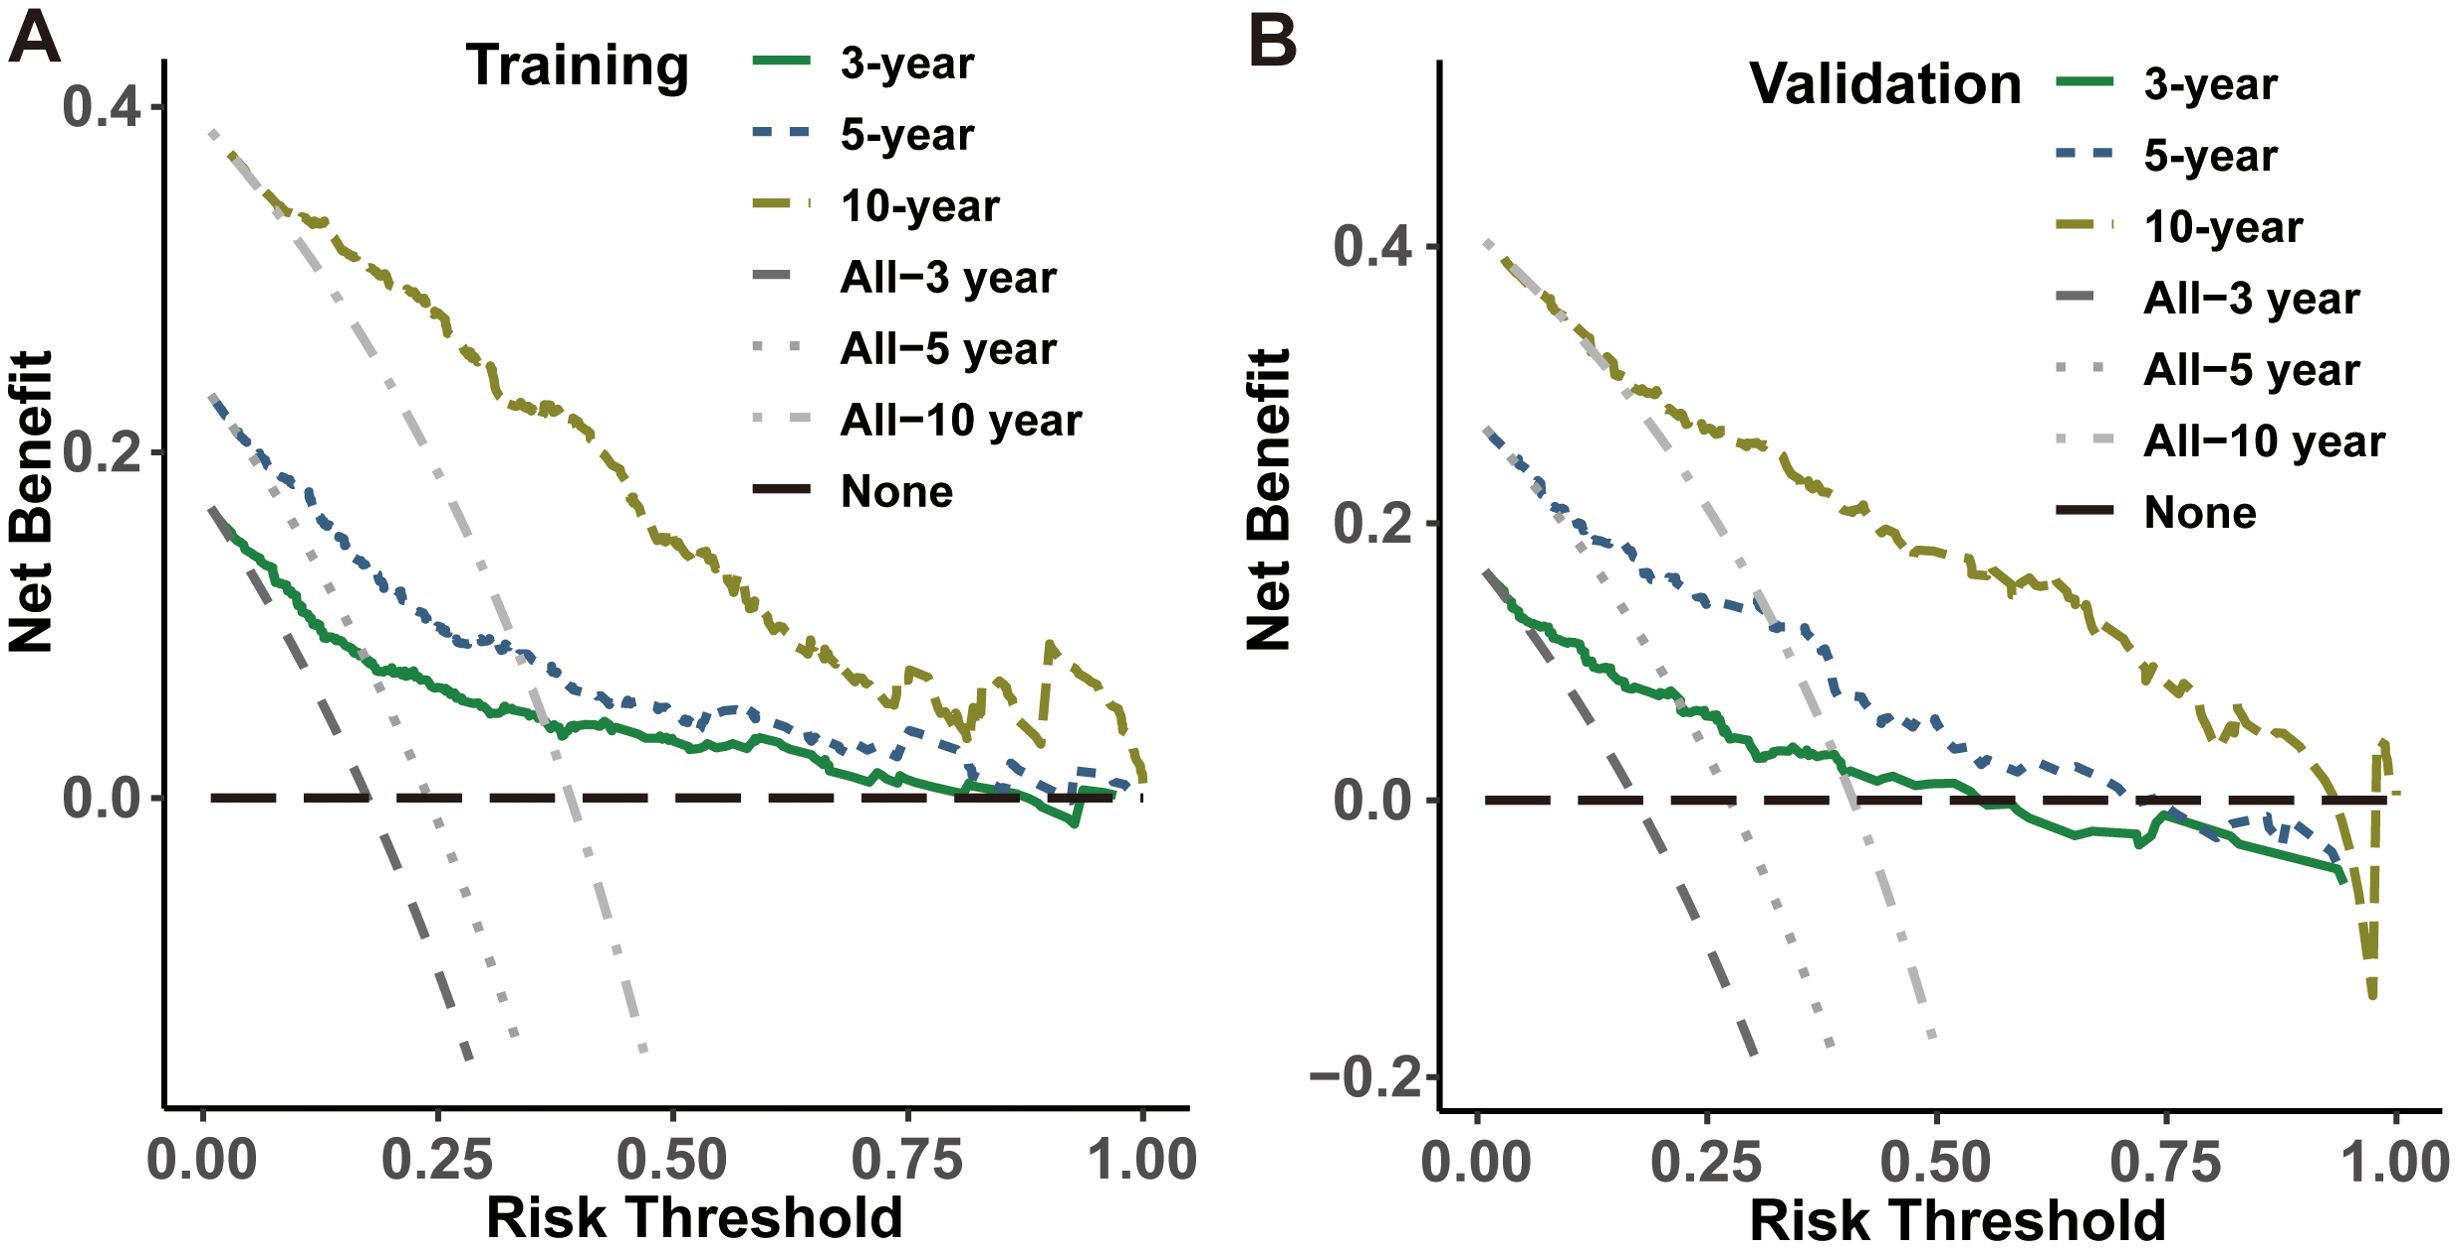
Figure 5. Decision curve analysis for the CS-nomogram in both the training (A) and validation (B) cohorts.
Risk stratification system development
Finally, a risk stratification system based on the CS-nomogram-derived scores was successfully developed. The CS-nomogram model was capable of quantifying all integrated variables as points and we calculated risk score for each individual. Then, based on the identified optimal threshold of 190, included patients were divided into low and high-risk groups (Figures 6A, B). Further analysis in the training and validation cohorts revealed that, for PDTC patients, individuals within the low-risk group exhibited significantly superior survival outcomes compared to those in the high-risk group (Figures 6C, D).
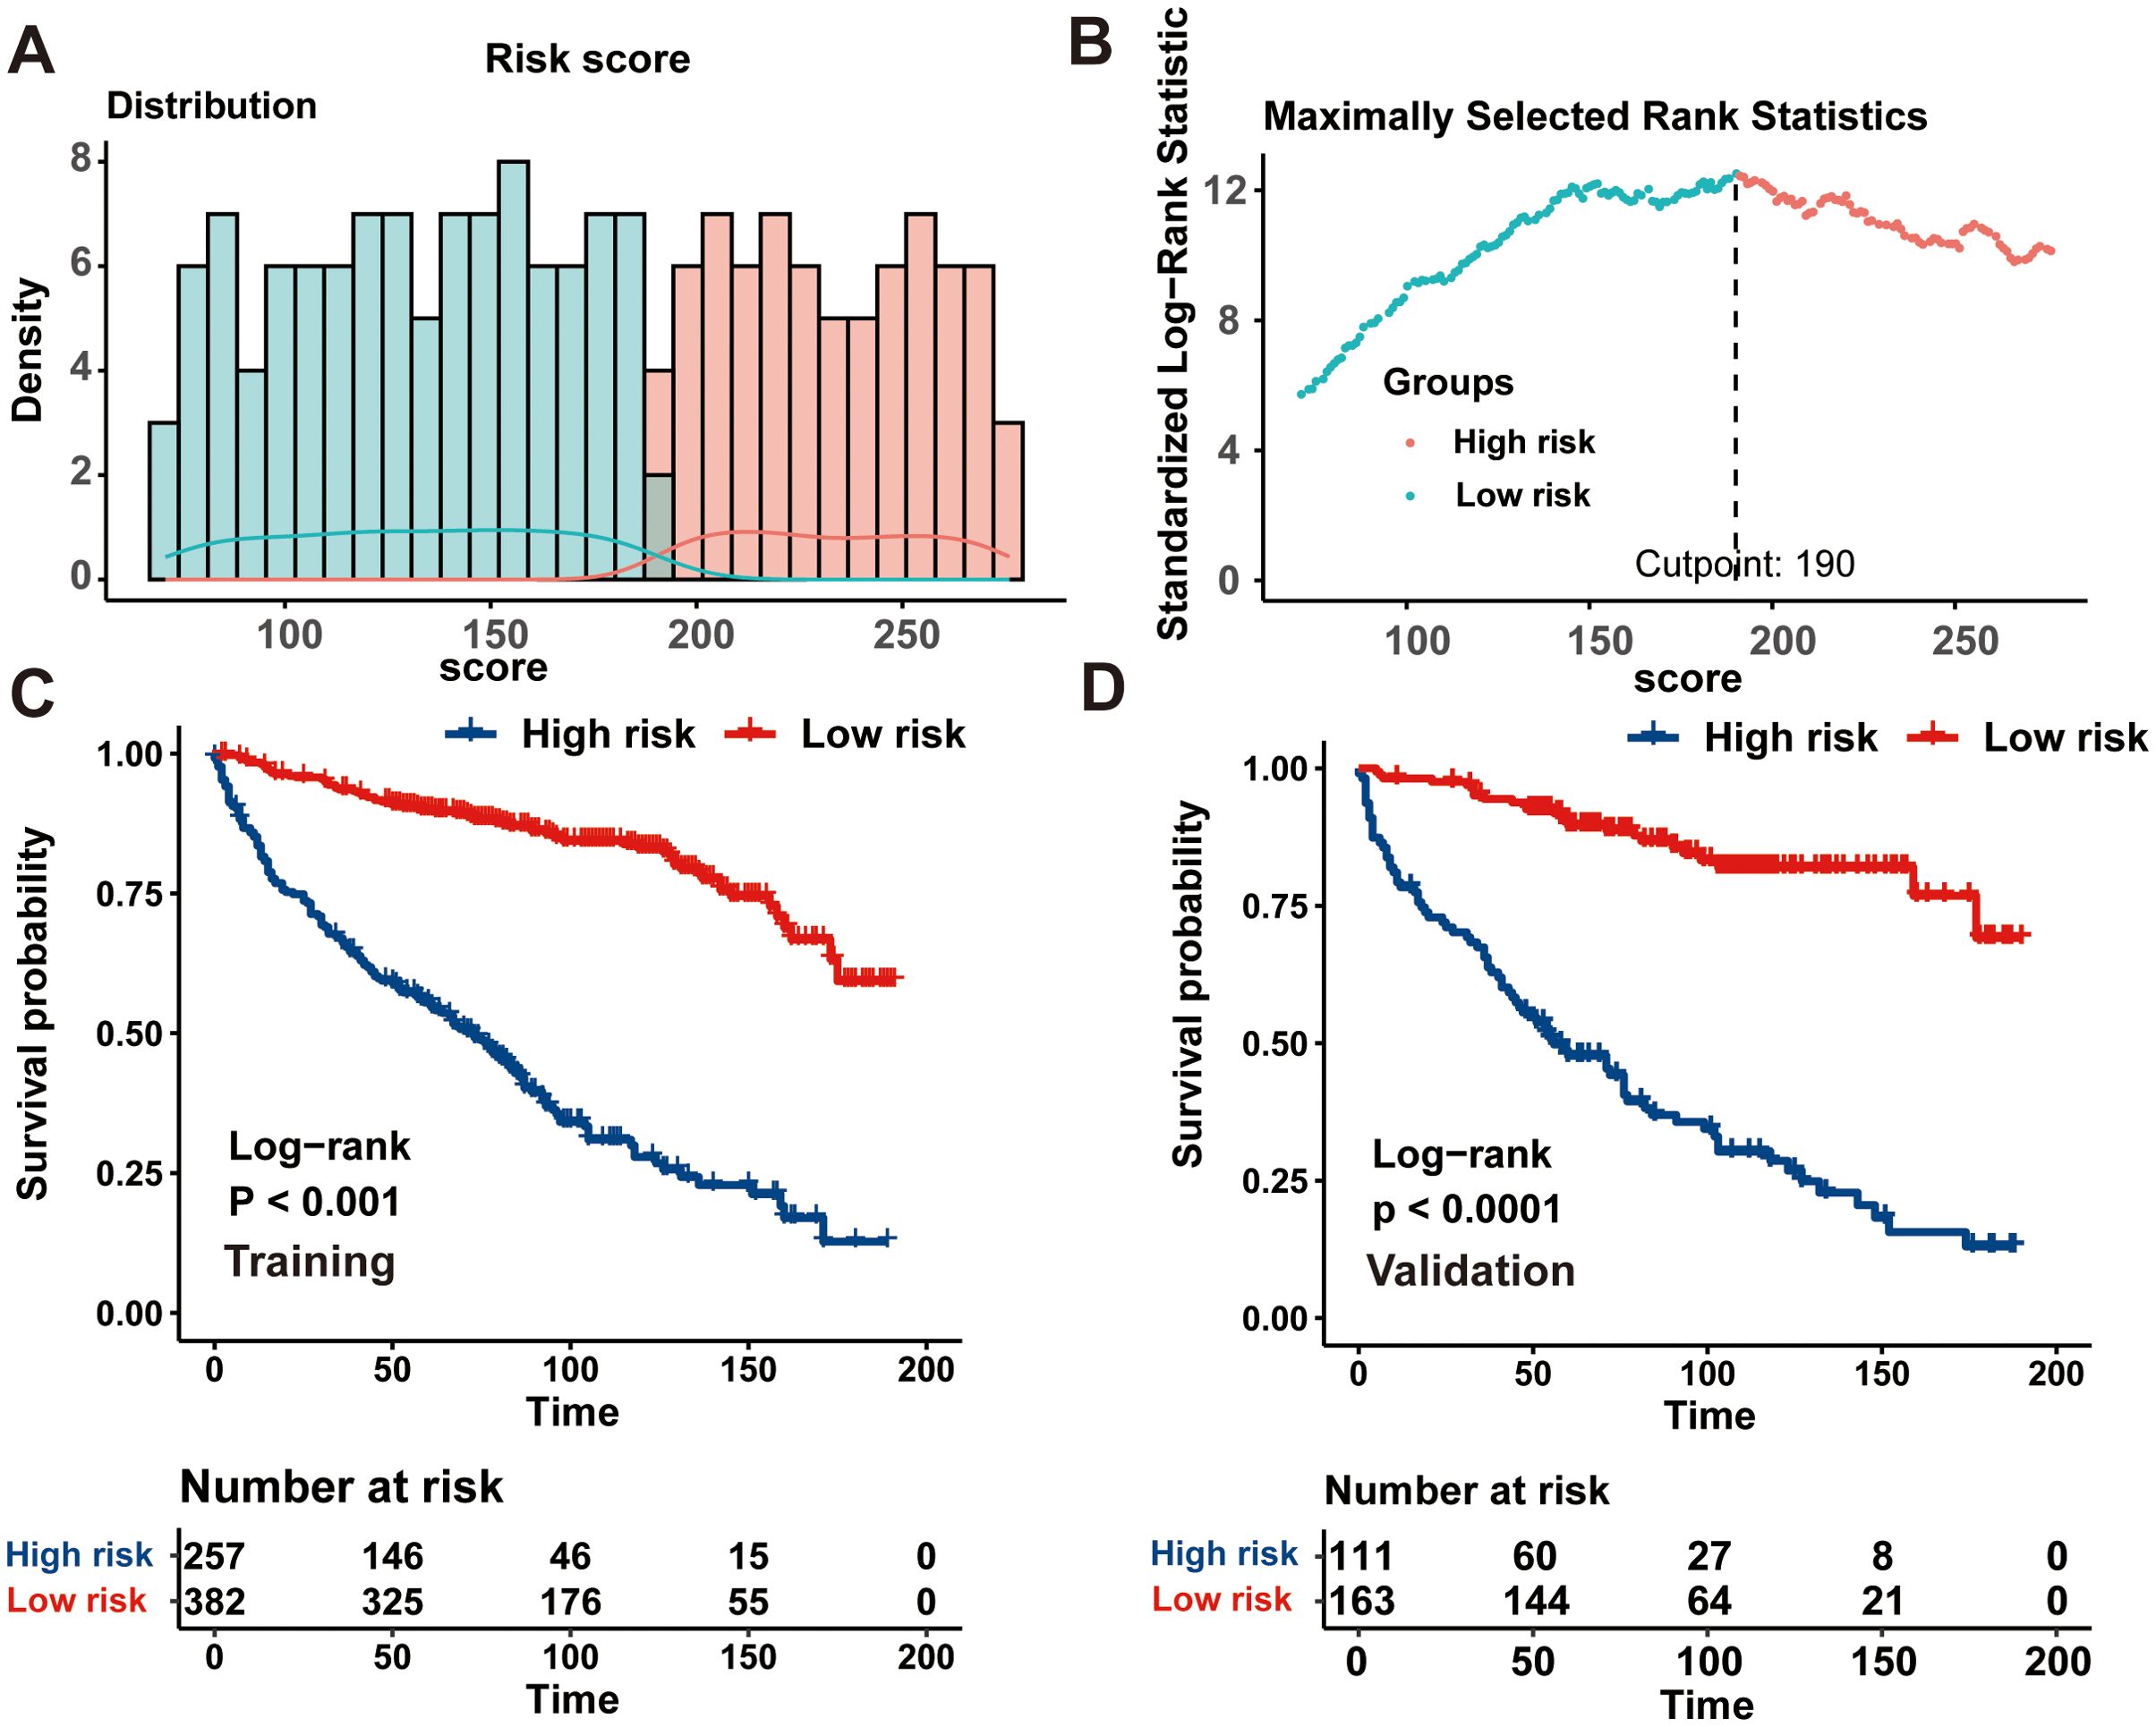
Figure 6. Establishment of a risk stratification system based on the condition survival- nomogram. (A) Distribution of risk points; (B) The standardized log-rank statistics; (C, D) Kaplan-Meier analysis utilizing the log-rank test for disparate risk groups across both training and validation cohorts.
Discussion
PDTC, an intermediate level of aggression of thyroid malignancies, remains under the investigation of limited research literature. This study was the first to analyze the CS outcomes of these patents, and to develop a novel CS-integrated nomogram model. And the strong predictive performance of this prediction model was verified via a series of evaluation methods. Finally, a risk stratification system was successfully established for a more accurate risk stratification for PDTCs.
In clinical practice, uncertainty about the prognosis of individuals who have survived multiple years postdiagnosis could impede clinical decision-making and potentially impact upon their psychological well-being and overall quality of life (18). In most prior investigations, the prognosis of PDTC was usually analyzed using traditional survival analysis (4, 19–22), but failing to provide more prognosis data for survivors who have survived for several years. The present investigation underscored the pivotal function of the CS in overcoming this limitation of traditional survival analysis. And our novel CS analysis demonstrated a progressive enhancement in the updated real-time survival over time. And it was notable to observe that within the initial stages post-diagnosis, the progressive enhancement in survivor rates overtime was considerable and was concurrent with the steepest trajectory on the survival rate curve. These findings underlined the necessity for increasing the intensity of therapeutic strategies and surveillance during the initial phases following diagnosis for this disease.
Surveillance subsequent to the diagnosis of this disease is an ongoing activity, necessitating the establishment of a dynamic survival estimation tool capable of generating precise predictive information in real-time, enabling tailored surveillance strategies (16). And there are some prognosis prediction models and survival staging systems having been proposed for PDTC patients (5, 20, 23, 24). Jin et al. constructed and validated a nomogram for forecasting the 5- and 10-year cancer-specific survival based on a large cohort with real-world samples (23). Sun et al. also developed a survival staging system providing a more accurate risk stratification for patients with PDTC than the 8th AJCC staging system (5). Nevertheless, despite all these currently published PDTC models, none have offered in real-time, updated prognostication data for survival patients. Consequently, our team developed an innovative CS-nomogram and a risk stratification system to contribute towards filling this existing research gap for PDTCs.
Our nomogram model integrated CS analysis with dynamic survival prediction capability. Moreover, it seamlessly incorporated individualized variables including age at diagnosis, sex, histology type, SEER stage, T stage, N stage M stage, tumor size, coexistence with other malignancy, radiotherapy and marital status, to enhance precise outcome evaluation. On one hand, these variables were identified using the LASSO algorithm; on the other hand, they have demonstrated a correlation with prognosis in clinical practice. Therefore, the predictive model built on these variables is both reasonable and robust. The application of the nomogram model across different clinical scenarios can significantly enhance its practical value. By inputting patients’ clinical characteristics, real-time survival probabilities can be obtained, which can be used to optimize clinical management and decision-making, and facilitate effective communication between doctors and patients. Moreover, this CS-nomogram has potential for providing continually updated prognostic data, empowering clinicians to adapt and refine the patient-tailored surveillance strategy promptly with consideration of evolving risks.
Indeed, the complexity of CS analysis necessitates a relatively large sample size and extended duration for follow-up study, thus, we employed SEER database to carry out this study at a population level. Concerning the performance of the CS-nomogram, it was verified that prediction model established in this study had favorable discriminative ability and accuracy for predicting 10-year CS of PDTC patients. Further DCA analysis demonstrated good clinical utility of the CS-nomogram in clinical practice. These results confirmed that our proposed model could substantially aid clinicians in predicting CS, thereby facilitating them in devising suitable therapeutic interventions for individuals with PDTC.
There are some limitations should be acknowledged in our study. Firstly, this was a retrospective study and potential bias are inevitable. If the SEER database fails to encompass the entire spectrum of patient demographics or treatment contexts, the findings may not apply to populations that differ from those in the database. For example, if specific demographic groups are underrepresented or certain treatment methods are not well-represented, the observed outcomes might not accurately reflect the results for these groups or scenarios. And during sample selection phase, participants with incompletely documented variables were excluded, potentially introducing bias into the results. Secondly, due to the inherent limitation of SEER database, we were unable to procure specific data on patient treatment, including specific radiotherapeutic protocols and surgical type. Thirdly, although our nomogram had been designed and verified within the SEER database, it remains imperative to perform prospective external validations for this predictive model. Finally, it’s imperative to dissect imaging and genetic factors associated with the prognosis of PDTC patients, and further optimize our prognostic nomogram.
Conclusion
This was the first study to analyze the CS pattern and demonstrated a gradual improvement in CS over time in long-term PDTC survivors. We then successfully developed and validated a novel CS-nomogram for individualized, dynamic, and real-time survival forecasting. And a risk classification system was also constructed for PDTC patient for risk stratification. We further confirmed excellent discriminative ability and potential clinical application of these models.
Data availability statement
The datasets presented in this study can be found in online repositories. The names of the repository/repositories and accession number(s) can be found below: https://seer.cancer.gov/data-software.
Author contributions
ZL: Conceptualization, Data curation, Formal Analysis, Investigation, Methodology, Project administration, Supervision, Validation, Visualization, Writing – original draft, Writing – review & editing. QX: Data curation, Formal Analysis, Investigation, Project administration, Supervision, Validation, Writing – review & editing. HX: Data curation, Formal Analysis, Investigation, Project administration, Supervision, Validation, Writing – review & editing. MW: Data curation, Formal Analysis, Investigation, Project administration, Supervision, Validation, Writing – review & editing.
Funding
The author(s) declare that no financial support was received for the research, authorship, and/or publication of this article.
Acknowledgments
We acknowledge the efforts made by the Surveillance, Epidemiology and End Results (SEER) Program in providing researchers with high-quality open resources.
Conflict of interest
The authors declare that the research was conducted in the absence of any commercial or financial relationships that could be construed as a potential conflict of interest.
Publisher’s note
All claims expressed in this article are solely those of the authors and do not necessarily represent those of their affiliated organizations, or those of the publisher, the editors and the reviewers. Any product that may be evaluated in this article, or claim that may be made by its manufacturer, is not guaranteed or endorsed by the publisher.
References
1. Asioli S, Erickson L, Righi A, Jin L, Volante M, Jenkins S, et al. Poorly differentiated carcinoma of the thyroid: validation of the Turin proposal and analysis of IMP3 expression. Modern Pathol: Off J United States Can Acad Pathol Inc. (2010) 23:1269–78. doi: 10.1038/modpathol.2010.117
2. Wan Z, Wang B, Yao J, Li Q, Miao X, Jian Y, et al. Predictive factors and clinicopathological characteristics of outcome in poorly differentiated thyroid carcinoma: a single-institution study. Front Oncol. (2023) 13:1102936. doi: 10.3389/fonc.2023.1102936
3. Alwelaie Y, Howaidi A, Tashkandi M, Almotairi A, Saied H, Muzzaffar M, et al. Revisiting the cytomorphological features of poorly differentiated thyroid carcinoma: a comparative analysis with indeterminate thyroid fine-needle aspiration samples. J Am Soc Cytopathol. (2023) 12:331–40. doi: 10.1016/j.jasc.2023.05.002
4. Ibrahimpasic T, Ghossein R, Shah J, Ganly I. Poorly differentiated carcinoma of the thyroid gland: current status and future prospects. Thyroid: Off J Am Thyroid Assoc. (2019) 29:311–21. doi: 10.1089/thy.2018.0509
5. Sun W, Wang Z, Xiang J, Qin Y, Zhang F, Zhang H. Newly proposed survival staging system for poorly differentiated thyroid cancer: a SEER-based study. J Endocrinol Invest. (2023) 46:947–55. doi: 10.1007/s40618-022-01958-5
6. Lee D, Won J, Lee S, Park D, Jung K, Sung M, et al. Changes of clinicopathologic characteristics and survival outcomes of anaplastic and poorly differentiated thyroid carcinoma. Thyroid: Off J Am Thyroid Assoc. (2016) 26:404–13. doi: 10.1089/thy.2015.0316
7. Lee Y, Moon S, Seok J, Lee J, Nam S, Chung Y. Characterization of the genomic alterations in poorly differentiated thyroid cancer. Sci Rep. (2023) 13:19154. doi: 10.1038/s41598-023-46466-5
8. Basu S, Kalshetty A. Sub-segmentation specific paradigms for better individualized management of poorly differentiated thyroid carcinoma: can a systematic approach be evolved? Nucl Med Commun. (2020) 41:1–4. doi: 10.1097/mnm.0000000000001100
9. Pulcrano M, Boukheris H, Talbot M, Caillou B, Dupuy C, Virion A, et al. Poorly differentiated follicular thyroid carcinoma: prognostic factors and relevance of histological classification. Thyroid: Off J Am Thyroid Assoc. (2007) 17:639–46. doi: 10.1089/thy.2007.0029
10. Hieke S, Kleber M, König C, Engelhardt M, Schumacher M. Conditional survival: A useful concept to provide information on how prognosis evolves over time. Clin Cancer Res: Off J Am Assoc Cancer Res. (2015) 21:1530–6. doi: 10.1158/1078-0432.Ccr-14-2154
11. Zabor E, Gonen M, Chapman P, Panageas K. Dynamic prognostication using conditional survival estimates. Cancer. (2013) 119:3589–92. doi: 10.1002/cncr.28273
12. Liu X, Wu T, Zhu S, Shi M, Su H, Wang Y, et al. Risk-dependent conditional survival and failure hazard after radiotherapy for early-stage extranodal natural killer/T-cell lymphoma. JAMA Netw Open. (2019) 2:e190194. doi: 10.1001/jamanetworkopen.2019.0194
13. Qian H, Yang Z, Cai L, Chen H. Conditional survival of elderly primary central nervous system lymphoma. J Cancer Res Clin Oncol. (2023) 149:13391–401. doi: 10.1007/s00432-023-05200-4
14. Luo J, Hu X, Ge X. Conditional survival nomogram for monitoring real-time survival of young non-metastatic nasopharyngeal cancer survivors. J Cancer Res Clin Oncol. (2023) 149:10181–8. doi: 10.1007/s00432-023-04952-3
15. Tappero S, Cano Garcia C, Incesu R, Piccinelli M, Barletta F, Morra S, et al. Conditional survival for non-metastatic muscle-invasive adenocarcinoma of the urinary bladder after radical cystectomy. Surg Oncol. (2023) 48:101947. doi: 10.1016/j.suronc.2023.101947
16. Meng X, Cai Y, Chang X, Guo Y. A novel conditional survival nomogram for monitoring real-time prognosis of non-metastatic triple-negative breast cancer. Front Endocrinol. (2023) 14:1119105. doi: 10.3389/fendo.2023.1119105
17. Hess K, Levin V. Getting more out of survival data by using the hazard function. Clin Cancer Res: Off J Am Assoc Cancer Res. (2014) 20:1404–9. doi: 10.1158/1078-0432.Ccr-13-2125
18. Meng X, Chang X, Qin P, Li Y, Guo Y. Risk-dependent conditional survival analysis and annual hazard rate of inflammatory breast cancer. Eur J Surg Oncol: J Eur Soc Surg Oncol Br Assoc Surg Oncol. (2023) 49:106957. doi: 10.1016/j.ejso.2023.06.009
19. Kersting D, Seifert R, Kessler L, Herrmann K, Theurer S, Brandenburg T, et al. Predictive factors for RAI-refractory disease and short overall survival in PDTC. Cancers. (2021) 13. doi: 10.3390/cancers13071728
20. Xu L, Zou Q, Jiao J, Zhang Y. Postoperative radioiodine therapy impact on survival in poorly differentiated thyroid carcinoma: a population-based study. Nucl Med Commun. (2022) 43:145–51. doi: 10.1097/mnm.0000000000001499
21. Hescot S, Al Ghuzlan A, Henry T, Sheikh-Alard H, Lamartina L, Borget I, et al. Prognostic of recurrence and survival in poorly differentiated thyroid cancer. Endocrine-related Cancer. (2022) 29:625–34. doi: 10.1530/erc-22-0151
22. Jung T, Kim T, Kim K, Oh Y, Park D, Cho B, et al. Clinical features and prognostic factors for survival in patients with poorly differentiated thyroid carcinoma and comparison to the patients with the aggressive variants of papillary thyroid carcinoma. Endocrine J. (2007) 54:265–74. doi: 10.1507/endocrj.k06-166
23. Jin S, Liu H, Yang J, Zhou J, Peng D, Liu X, et al. Development and validation of a nomogram model for cancer-specific survival of patients with poorly differentiated thyroid carcinoma: A SEER database analysis. Front Endocrinol. (2022) 13:882279. doi: 10.3389/fendo.2022.882279
Keywords: poorly differentiated thyroid carcinoma, SEER, prognosis, conditional survival, nomogram
Citation: Liu Z, Xu Q, Xia H and Wang M (2024) Dynamic estimates of survival of patients with poorly differentiated thyroid carcinoma: a population-based study. Front. Endocrinol. 15:1375274. doi: 10.3389/fendo.2024.1375274
Received: 23 January 2024; Accepted: 28 August 2024;
Published: 13 September 2024.
Edited by:
Vincenzo Marotta, AOU S. Giovanni di Dio e Ruggi D’Aragona, ItalyReviewed by:
Barbara Maria Jarzab, Maria Skłodowska-Curie National Research Institute of Oncology, PolandCristina Martín-Arriscado Arroba, Fundación Investigación Biomédica Hospital 12 de Octubre, Spain
Copyright © 2024 Liu, Xu, Xia and Wang. This is an open-access article distributed under the terms of the Creative Commons Attribution License (CC BY). The use, distribution or reproduction in other forums is permitted, provided the original author(s) and the copyright owner(s) are credited and that the original publication in this journal is cited, in accordance with accepted academic practice. No use, distribution or reproduction is permitted which does not comply with these terms.
*Correspondence: Zhao Liu, bGl1emhhbzE1ODU3NTc4MTkyQDE2My5jb20=