 Shannon E. McCollum
 Olivia Canter
 Vincent J. Fasanello1
 Mark F. Haussmann
94% of researchers rate our articles as excellent or good
Learn more about the work of our research integrity team to safeguard the quality of each article we publish.
Find out more
ORIGINAL RESEARCH article
Front. Endocrinol., 14 May 2024
Sec. Endocrinology of Aging
Volume 15 - 2024 | https://doi.org/10.3389/fendo.2024.1363468
This article is part of the Research TopicChronic Stress, Telomeres and AgingView all 6 articles
Social support is vital for mental and physical health and is linked to lower rates of disease and early mortality. Conversely, anti-social behavior can increase mortality risks, both for the initiator and target of the behavior. Chronic stress, which also can increase mortality, may serve as an important link between social behavior and healthy lifespan. There is a growing body of literature in both humans, and model organisms, that chronic social stress can result in more rapid telomere shortening, a measure of biological aging. Here we examine the role of anti-social behavior and social support on physiological markers of stress and aging in the social Japanese quail, Coturnix Japonica. Birds were maintained in groups for their entire lifespan, and longitudinal measures of antisocial behavior (aggressive agonistic behavior), social support (affiliative behavior), baseline corticosterone, change in telomere length, and lifespan were measured. We found quail in affiliative relationships both committed less and were the targets of less aggression compared to birds who were not in these relationships. In addition, birds displaying affiliative behavior had longer telomeres, and longer lifespans. Our work suggests a novel pathway by which social support may buffer against damage at the cellular level resulting in telomere protection and subsequent longer lifespans.
Social relationships are one of the most well-documented psychosocial factors that can affect a person’s mental and physical health (1, 2). High levels of social support correlate with lower rates of cardiovascular disease, cancer, and infectious disease (3, 4), while low social support correlates with increased morbidity and mortality (5). Conversely, the lack of social support (6), and more importantly antisocial behavior during childhood or adolescence is associated with higher rates of death and disability by middle age (7–9). Anti-social behavior describes acts that violate societal rules and norms such as theft or violence, often marked by aggression toward others. Interestingly, social support systems allow individuals to cope with stressful anti-social encounters (10). However, while the literature is rife with studies demonstrating the connection between social support and healthy aging, fewer studies explore how antisocial behavior affects health and aging (but see 8, 11), specifically at the cellular level.
Social stressors can trigger the highly-conserved vertebrate endocrine stress response, which can help individuals respond to challenges, such as an aggressive encounter (12). This multifaceted response is characterized by the release of catecholamines and glucocorticoids. Catecholamines result in rapid changes that define the fight or flight response, including increasing heart rate, altering blood flow, and mobilizing energy resources. Glucocorticoids work in tandem with catecholamines by modulating their effects, inhibiting unnecessary physiological functions, and assisting in energy mobilization that can help the animal to recover from the stress (13). Together, the actions of these hormones help individuals survive short-term stressors, but prolonged exposure to glucocorticoids is associated with increased levels of oxidative stress (14), cardiovascular disease (15), depression (16), and mortality risk (17).
At the cellular level, one way that prolonged glucocorticoid exposure may have negative health effects is by increasing oxidative stress (14, 18–21). Oxidative stress occurs when reactive oxygen species (ROS), many of which are byproducts of inefficient mitochondrial metabolism, damage biomolecules like DNA, lipids, and proteins (22). One molecule damaged by oxidative stress is telomeres (23), the terminal DNA caps important for chromosomal integrity. This damage, in addition to replication restrictions of DNA polymerase, result in progressive telomere shortening throughout both the life of the cell (24), and more broadly, the life of an organism (25). However, rather than just shortening due to the passage of time, telomeres may also shorten more rapidly, or slowly, based on the level of damage a cell is exposed to. Thus, telomeres are also a biomarker of biological aging (25, 26). Importantly, when telomeres shorten to a critical length, cells enter senescence: an irreversible change in which the cell ceases to divide and damage neighboring healthy cells. These changes result in a loss of the regenerative capacity of tissues and an increased risk of disease (27).
In social species, the complex social structure can either be a source of, or buffer against many types of stressors (28–30). In animals that live in groups, social interactions shape the relationships among individuals. Affiliative interactions strengthen social bonds, and provide benefits, while agonistic interactions are associated with costs that negatively affect social bonds (31). Individuals that are the continuous target of agonistic interactions can lead to long-term activation of the endocrine stress response and the subsequent negative health outcomes (28). Conversely, affiliative interactions that lead to membership in a social group can reduce exposure to the anti-social behavior, and thus lessen prolonged activation of the stress response (22). A recent review in humans, reported that chronic social stress, in both children and adults, is linked to telomere shortening (32). All of the studies reviewed were either cross-sectional or only followed subjects for only a short time as human longitudinal studies are difficult and very rarely follow subjects over their full lifetime. In this regard, social animal models can provide an incredibly useful framework for studies on lifespan. For example, experimental work in social birds showed that both pre- and post-natal stress can permanently after the sensitivity of the stress endocrine axis, which can affect longevity (33).
In this study, we explored the links between behavior, stress, and lifespan in the social Japanese quail (Coturnix japonica). Japanese quail are ideal models as they live in social groups and form dominance hierarchies, those these hierarchies are notably unstable and change through time depending on resource availability, season, and dynamic group relationships (34). While these quail show clear agonistic interactions–pecking and chasing–in the formation of these hierarchies, they also show affiliative behavior where they preferentially spend time with members of the group without engaging in agonistic interactions (35). We capitalized on this complex social system to explore how both affiliative and agonistic behavior affected baseline glucocorticoids, telomere rates of change, and lifespan.
All procedures were conducted with approval from the Bucknell University Institutional Animal Care and Use Committee and the reporting.
A breeding colony of Japanese quail (Coturnix japonica) from a feral line originally captured on the Big Island of Hawaii in 1980 was maintained at Bucknell University as previously described (14). Because the birds were wild until recently, they have faced different natural selection pressures and have undergone less intensive artificial selection than domestic breeds of Coturnix japonica (36). In our colony, the birds have a mean lifespan 2.1 ± 1.08 (sd) years. The birds were housed in a 1.2 x 1.2 m pens and maintained on a light-dark cycle that mimicked the outdoor ambient light cycle in Lewisburg, Pennsylvania. Throughout the entire study, all birds received ad libitum access to food (Sporting Bird Starter and Sporting Bird Flight Developer, Southern States, USA) and water. For this study, six age-matched breeding pairs were established (180 ± 10 days) from the larger colony to produce six sibling sets each containing six genetically-related offspring (Figure 1A). Each parental pair lived in a separate pen for a period of two months at a 10-hour light:14 hour dark (10L:14D) cycle. To stimulate breeding, an additional hour of light was added to the start of the light cycle each week until a light cycle of 16L:8D was reached. Egg laying began sporadically when the light cycle reached 14L:10D, and we began collecting freshly laid eggs from each pair once the light cycle reached 16L:8D.
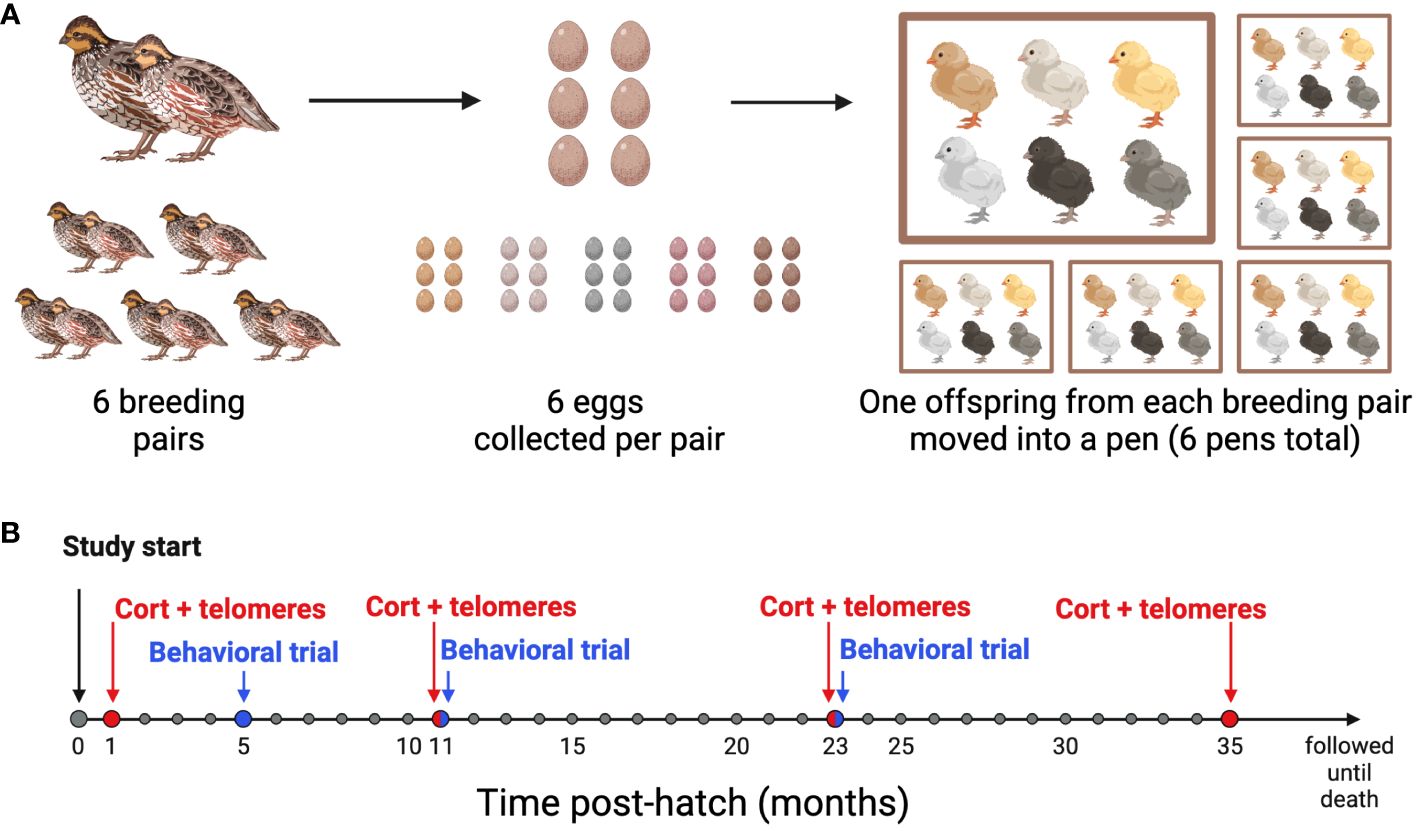
Figure 1 Experimental design timeline. (A) Breeding Schematic: 6 breeding pairs were age-matched, and 6 eggs were collected from each pair. At 4 weeks post-hatch, one offspring from each of the 6 families was moved into one of 6 pens, so that each pen had 6 unrelated offspring housed together. (B) Sampling and behavioral trial timeline: All birds were studied from hatch until death. Blood samples for baseline conrticosterone concentrations and telomere length (CORT + telomeres) were collected at 1, 11, 23, and 35 months of age. Behavioral Trials were performed at 5, 11, and 23 months of age. Created with BioRender.com.
Within 24 hours of laying, eggs were placed in a GQF 1502 Digital Sportsman incubator (GQF Manufacturing Co., Savannah, GA, USA) maintained at 37.8°C and 50-65% humidity and were turned every 2 hours. On day 15 of incubation, the cohort was transferred to a GQF 1550 Digital Hatcher (1550 Cabinet Model, GQF Manufacturing Co., Savannah, GA, USA) and kept at 98°C and 85% humidity. Starting on day 18 of incubation, the eggs were checked every 12 hours for hatch. The 36 birds used in this study were all similarly aged and hatched within 9.1 ± 6.1 (sd) days of one another. After hatching, the birds were weighed, marked with numbered leg bands so we could track sibling sets, and housed in a Brower brooder maintained at 38°C. Temperature was then decreased at a rate of 2.5°C per week until 24°C was reached. At 14 days of age, we collected blood samples from the alar vein, and sex was determined via molecular sexing assay (see below). Only female offspring were used in this study. At approximately 4 weeks of age, offspring were transferred to six 1.2 × 1.2 m pens each housing six birds. Each pen contained one bird from each of the six sibling sets. Birds remained in their respective pens though the last sampling period.
Blood samples were taken at 14 days of age, and then again at one, eleven, twenty-three, and thirty-five months of age (Figure 1B). At each sample, approximately 75 µl of blood was collected from the alar vein within three minutes of entry into the room. Blood samples were collected with heparinized capillary tubes, transferred to microcentrifuge tubes, and kept on ice for a short period until refrigerated centrifugation (4°C) for 5 min at 3500 rpm. Plasma was removed and frozen in aliquots at -20°C. The remaining red blood cells were resuspended in a cryoprotectant buffer (10% dimethyl sulphoxide, 90% newborn bovine serum) and frozen at -20°C. All corticosterone and telomere assays were run at the end of the study after all samples were collected so that samples in each assay could be randomized by identity, family, pen, and age.
To identify the sex of each bird, we extracted genomic DNA from blood samples taken at two weeks of age using a modified version of the protocol developed by Griffiths et al. (37). The DNA was amplified using standard polymerase chain reaction (PCR) conditions with the P8⁄P2 primer set to determine the sex of each bird, based on the chromo-helicase-binding domain (CHD) gene in poultry (38). Amplified DNA was visualized after electrophoresis and sex was assigned based on the absence (male:ZZ) or presence (female:ZW) of the band for the W chromosome.
We determined plasma corticosterone levels by radioimmunoassay (RIA), based on the protocol of Wingfield & Farner (39) and validated in our laboratory (14). Briefly, we extracted corticosterone from plasma diluted with double deionized water using anhydrous diethyl ether. The samples were dried with nitrogen gas and then resuspended in 90% ethanol and stored at 4°C overnight. Samples were then centrifuged, and the supernatant was dried under nitrogen gas and resuspended in phosphate-buffered saline with gelatin (PBSg).
We ran the samples in a competitive-binding RIA with a corticosterone-specific antibody Corticosterone-3-Carboxymethyloxime : BSAhost:rabbit (MP Biomedicals, Solon, OH, USA) and tritiated corticosterone (2000 cpm, NET 399, New England Nuclear Research Products, Boston, MA, USA). Bound and free corticosterone were separated using dextran coated charcoal. After centrifugation, charcoal was removed and radioactivity was determined using a liquid scintillation counter. Plasma CORT concentrations were determined from comparison against a standard curve. The average detection limit was approximately 0.30 ng/mL. All samples were run in duplicate, which were averaged for analysis, and the intra-assay and inter-assay coefficients of variation were 15.8% and 12.8%, respectively.
Telomeres were measured with the Telomere Restriction Fragment (TRF) assay, and the procedure was carried out according to previous studies (26, 40). Briefly, DNA was extracted from packed blood cells using the Puregene Blood Core Kit B following the manufacturer’s specifications (Qiagen). DNA integrity was assessed through the use of integrity gels (41), and telomeres of high integrity DNA samples were then measured using the TRF assay. A 10 μg quantity of DNA was digested using 1.0 ml of RsaI (New England Biolabs, R0167L) and 0.2 ml of HinfI (New England Biolabs, R0155M) in CutSmart Buffer (New England Biolabs, B7204S) overnight at 37°C. The digested DNA was separated using pulsed‐field gel electrophoresis (3 V/cm, 0.5‐ to 7.0‐s switch times, 14°C) for 19 hr on a 0.8% nondenaturing agarose gel. The gel was then dried without heating and hybridized overnight with a 32P‐labeled oligo (5′CCCTAA‐3′) that binds to the 3′ overhang of telomeres. Hybridized gels were placed on a phosphor screen (Amersham Biosciences, Buckinghamshire, UK), which was scanned on a Storm 540 Variable Mode Imager (Amersham Biosciences). We used densitometry (ImageQuant 5.03v and ImageJ 1.42q) to determine the position and strength of the radioactive signal in each of the lanes compared to the molecular marker (1 kb DNA Extension Ladder; Invitrogen, CA). The background was fixed as the nadir of the low‐molecular weight (MW) region on the gel (<1 kb). Samples were distributed among six gels and mixed by pen and age class.
Behavioral observations to determine agonistic and affiliative interactions were conducted in each pen, during two one-hour trials at five, eleven, and twenty-three months of age (Figure 1B). A Canon Vixia HFS30s camera was suspended from the top of each pen four feet from the ground which could view the entirety of the pen floor. At the end of the light period on the day before the behavioral trial all food was removed from the pens so that the birds did not have access to food on the trial day at the start of the light period. On the trial day at 1300 hr, all birds were removed from the pen and temporarily placed into an adjacent pen. Birds were quickly placed back into the original pen one at a time and their band numbers were recited so that each bird could be identified when the video was later analyzed. This procedure of removing the birds and replacing them took less than two minutes. Following this, the birds were not disturbed for an additional 30 min. After this time, the food was replaced in the pen at ~1330 hr and interactions in the pen were recorded for the next 60 min. During the trials birds were very active as they were either attempting to access food, involved in agonistic behaviors (chases and pecking), or huddling together (affiliative behavior). This was repeated one week later at each of the three ages.
Videos were analyzed by two independent observers using Observational Data Recorder v2 Beta (Samuel Péan) and the data were averaged between both observations (repeatability calculated by the intraclass correlation coefficient = 0.97). This software allowed for easy observation of each bird over the entirety of the trial. We defined pecks and chases as agonistic interactions, and for each interaction we recorded which bird was the aggressor and which was the target. This also allowed us to determine when birds did not agonistically interact, which we defined as affiliative behavior (described below). A figure showing two birds from one pen, at one age, and for one of the two trials is shown to illustrate these complex relationships (Figure 2). Based off of these data we calculated four different behavioral scores.
• Agonistic aggressor score: To calculate agonistic aggressor score we divided the total times a quail aggressed other quail in their pen (chased or pecked others) by the total number of aggressive pen interactions among all quail in that pen for that trial.
• Agonistic target score: To calculate agonistic target score we divided the total times a quail was aggressed by the other quail in their pen (chased or pecked by others) by the total number of aggressive interactions among all quail in that pen for that trial.
• David’s Dominance Score: We used David’s score as a calculation of dominance behavior (42). David’s score is dependent on the outcomes of aggressive interactions with group members, as well as the relative strengths of each opponent. It also takes into consideration repeated interactions between group members and is therefore, not disproportionately impacted by slight deviations from the leading dominance direction. In addition, an individual’s status is independent of interactions in which they did not take part (42).

Figure 2 A behavioral trial diagram to illustrate the complex social relationships among birds in a pen. This diagram represents two birds in the pen and their interactions with their pen mates. Solid arrows denote when aggressive agonistic behaviors occurred between two pen members. Dashed arrows show where no aggressive agonistic behaviors occurred, which were categorized as affiliative relationships. Numbers beside arrows describe the nature of the interactions. The number before the colon is the number of aggressive actions (chases or pecks) that the focal bird performed on the target connected by the arrow, while the number after the colon is the numbers of times the focal bird was targeted by the bird connected by the arrow. For example, Bird A was involved in aggressive interactions with every other bird in the pen. It aggressed Bird F 5 times, and was targeted by Bird F once. Bird E was in two affiliative relationships, one with Bird F and the other with Bird D. While Bird A aggressed upon Bird E 16 times, Bird E never aggressed upon Bird A. This diagram displays data for Birds A and E for one of the two trials that occurred at a single age. While this diagram shows affiliative behavior between a number of Birds in the pen, this behavior would have to occurred in both the trials that were one week apart for these birds to actually be categorized in an affiliative relationship.
Affiliative score: Affiliative behavior in birds is complex, and can occur between both the same and opposite sexes (31, 35). A common measure of affiliative behavior is when specific members of a group spend time in close proximity without interacting agonistically (35, 43). During these affiliations birds may groom one another or rest in contact (31, 44). To measure affiliative behavior during the behavioral trials, if two or more birds rarely, or never, aggressively interacted they were categorized as displaying affiliative behavior. This measure of affiliative behavior, focusing on birds that huddled together rather than those engaged in resting or grooming behavior, was necessary. Resting and grooming were common behaviors observed in each pen outside of the behavioral trials. However, during the trials, the environment was more chaotic, with birds primarily engaged in eating, chasing and pecking (agonistic behaviors), or huddling together (affiliative behavior), and resting and grooming were not commonly observed. Affiliative behavior was analyzed by observing dyadic relationships, and this data allowed us to categorize each bird as having zero, one, or two affiliative relationships with other members of the pen (see Figure 2 for an example) Specifically, for every pair combination in a pen, total aggressive pair encounters (each time those two individuals were involved in a chase or peck event) were divided by the total number of aggressive interactions among all quail in that pen for that behavioral trial. If this number of encounters was lower than 2%, those birds were considered to display affiliative behavior with one another. We chose this threshold because while analyzing behavior we noticed that on some rare occasions a chased bird may run into the back of another bird which might then quickly turn and peck it. This rare and undirected aggression, suggested we should slightly loosen our measure of affiliative behavior. In addition, we were only able to determine a bird’s affiliative membership status if we performed at least one behavioral analysis before they died. One bird died within the first year of life before the first behavioral trial, and so they were not included in any of the behavioral analyses.
We ran linear mixed effects models (LMMs) or general linear mixed models (GLMMs) using JMP Pro software (v.14.0.0, SAS Institute Inc. 2018, Cary, NC, USA). For every LMM, we checked for homogeneity of variances (Levene’s test), and for normality of residuals (Kolmogorov–Smirnov test). If heteroscedasticity or non-normality were detected we switched to a general linear mixed model (GLMM) framework, as GLMMs can more easily accommodate non-normal and heteroscedastic data. For LMMs, we fitted the models with a Gaussian error distribution and an identity link function. For GLMMs we fitted the models with a gamma distribution and bounded variance components. Regardless of whether LMMs or GLMMs were used, in each model we included ‘individual’ as a random factor to control for the non-independence of data due to repeated measurements on the same individuals. ‘Pen’ (six pens) and ‘family’ (six families) were also included unless specified differently below. For all models that included interactions. we sequentially removed non-significant interactions from the models, starting from the higher order interactions, and repeated the analyses until we obtained a model with only significant terms.
Behavior repeatabilities of agonistic aggressor, agonistic target, and David’s score were calculated using the within- and between-variance components in a linear mixed effects model, following the restricted maximum-likelihood method (45, 46).
To determine what factors affected aggressive agonistic scores; we ran a LMM that included the fixed factors: affiliative behavior, age (four ages), corticosterone and all interactions.
To determine what factors affected whether birds were in an affiliative relationship, we ran a GLMM with a binomial response variable and logit link function with pen, family, corticosterone and all interactions included as model effects. Likelihood ratio tests following a chi-square distribution was used to assess significance of model effects.
To explore effects on telomere length, we ran analyses both on telomere length at four ages (1, 11, 23, and 35 months) and also on telomere loss rates expressed as change per month over the first and second year of the study. We did not include loss rates over the third year as 75% of the birds were dead by 35 months of age. In a first analysis, we ran a LMM and included age (four ages), CORT, and their interaction as fixed effects to see how they affected telomere length. In a second analysis, we ran a GLMM and included the four behavioral scores (aggressor, target, David’s, affiliative) and all interactions as fixed effects to determine how they affected telomere length. We could only include telomere at 11 and 23 months of age, as these were the only two where the behavioral trials and blood samples matched. Finally, we ran a GLMM to explore how the four behavioral scores and all interactions affected telomere loss rates. For the first year of telomere loss we used the 11 month behavioral trial data, and for the second year of loss we used the 23 month behavioral trial data.
To understand how a number of factors in our experiment affected lifespan we performed two analyses. First, we ran a LMM that included the fixed factors: average corticosterone levels, telomere length at 1 month of age, telomere loss rates in the first and second year, affiliative relationship status, and average David’s score, aggressor score, and target score. Limited sample size did not allow us to run interactions in this analysis. We used the results of this and previous analysis to more deeply explore the connection among significant variables using a path analysis. Briefly, path analysis is an extension of multiple regression that allows us to consider more than one dependent variable at a time and, more importantly, allows variables to be both dependent and independent variables (47, 48). In other words, it permits us to consider chains of association, where, for example, variable A influences variable B, which in turn affects variable C. For lifespan path analyses; affiliative relationship status and telomere loss rates (two measurements, change over the first and second year) were included.
Following standard procedures, we first evaluated a full (complete) path model, and subsequently tested simpler models that were nested within this basic model (49). Then, evaluation of alternative models involved several approaches:
• χ2 goodness of fit test statistic, in which a smaller value indicates better consistency with observed data (50).
• Root Mean Square Error of Approximation (RMSEA), which estimates the amount by which estimated values differ from actual values, was also used for model comparison. Values over 0.10 are considered to be a bad fit, those less than 0.08 reflect a reasonable fit, and values less than 0.05 indicate a good fit (50).
• Bentler’s Comparative Fit Index (CFI) is an incremental fit index that compares the fit of a hypothesized model with that of an independent model, which has the worst fit (51). This is In contrast to RMSEA which is an absolute fit index, in that it assesses how far a hypothesized model is from a perfect model. In the past, a CFI above 0.90 was used as a cutoff for good fitting models, but more recent consensus suggests that this value should be increased to approximately above 0.95 (52).
•Corrected Akaike information criterion (AICc) distinguishes between models derived from the maximum likelihood with the most parsimonious model being associated with the smallest AICc value as long as it is more than two AICc units lower than other models. AICc is especially useful where the sample size is small relative to the number of parameters being estimated.
Together, these tests provide a rigorous assessment and comparison of different models. For brevity, only model results for the top three models are presented.
In each behavioral trial across the four years of the study, we consistently observed agonistic interactions in all pens. Individual’s aggressor score and David’s score were repeatable showing that levels of aggression and dominance, respectively, were consistent in individuals over time (Table 1). In addition, aggressor score, target score, and David’s score were repeatable in pens suggesting that some pens had consistently higher levels of aggression over time (Table 1).
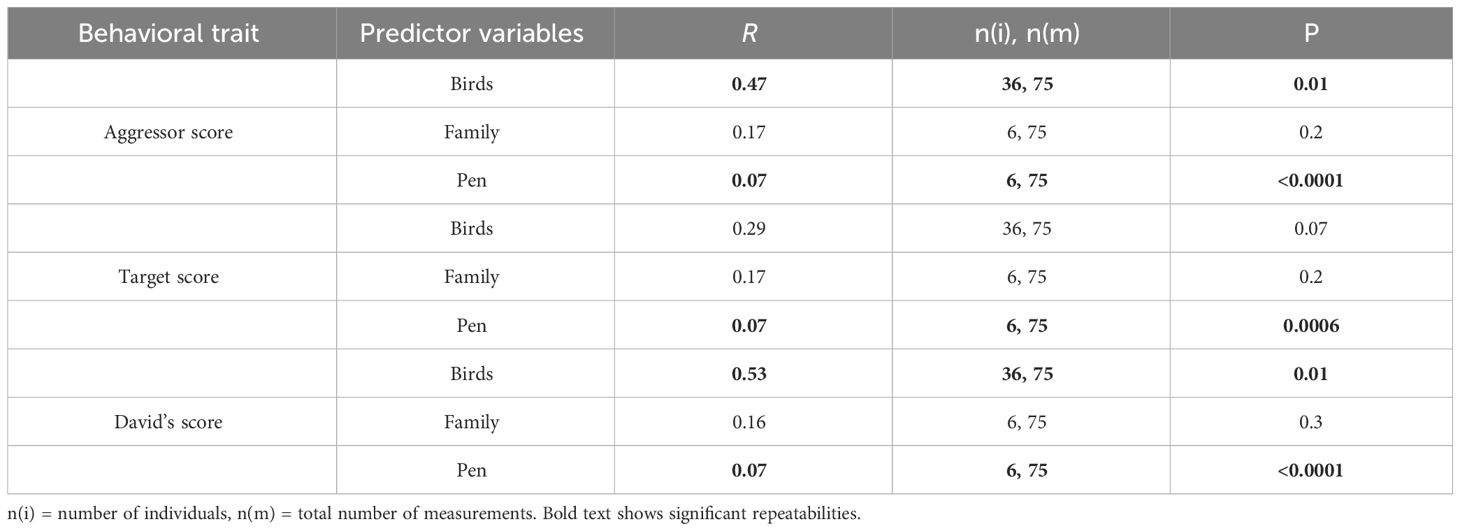
Table 1 Repeatability of behavior across the bird’s lifespan, and also across families, and pens over time.
None of the agonistic scores changed with age (all p>0.8, Table 2), but birds with the highest aggressor score also had significantly lower corticosterone levels regardless of age (F1,17.1 = 7.2; p=0.01, Table 2). While affiliative behavior had no effect on David’s score (p=0.5), it did have a significant effect on aggressor score (F1,16.5 = 4.4; p=0.05) and target score (F1,32 = 4.2; p=0.04, Table 2). Specifically, any birds that displayed affiliative behavior spent less time aggressing other birds (Figure 3A) and were also less likely to be a target (Figure 3B).
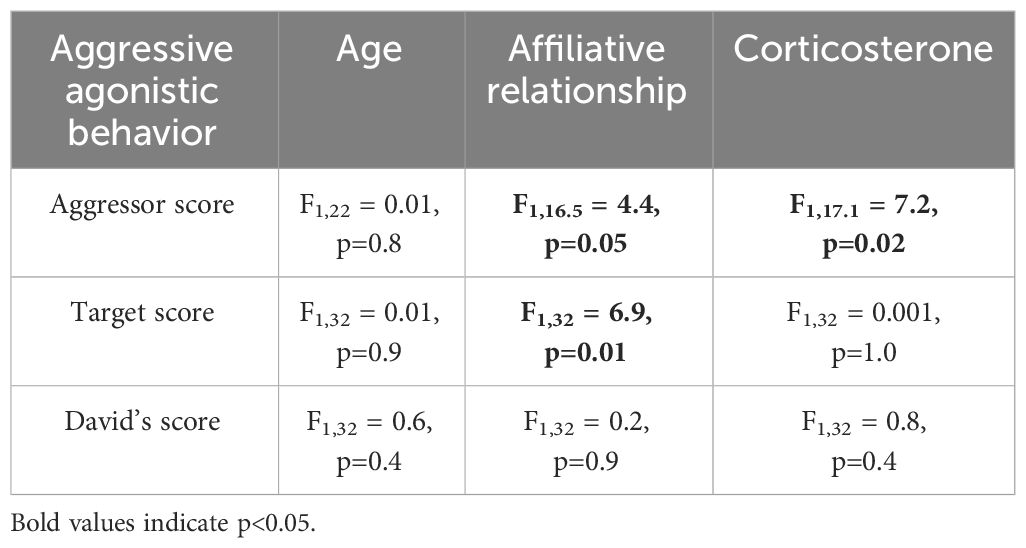
Table 2 Results of linear mixed models (LMM) analyzing the response to age, affiliative relationship, and corticosterone for the three aggressive agonistic behaviors.
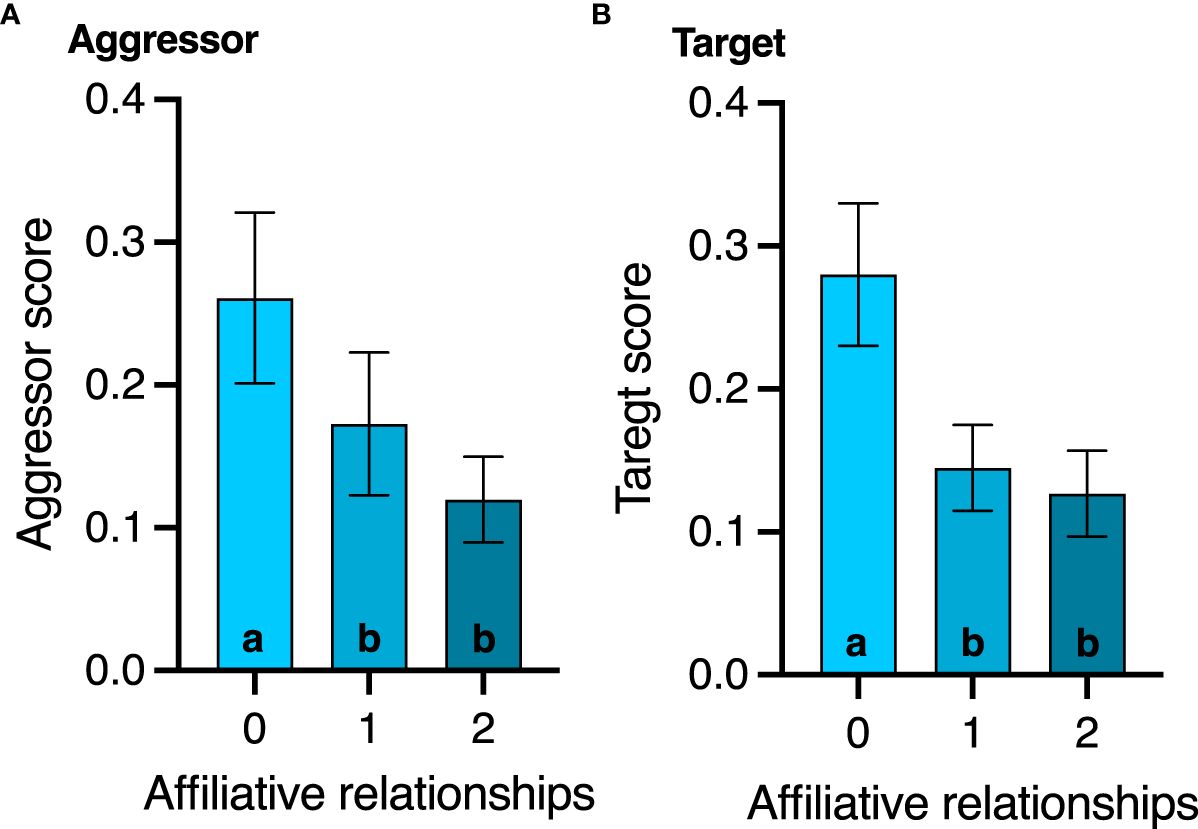
Figure 3 Effect of affiliative membership on (A) aggressor score and (B) victim score. Mean ± standard deviation is plotted. Different letters within a graph denote behavior score differences among the affiliative groups (p < 0.05).
Among our study birds, 14 (39%) did not display affiliative behavior, 12 (33%) had one single affiliative relationship, and 9 had two affiliative relationships (25%). Interestingly, affiliative relationships were remarkably stable over time, so any birds with an affiliative relationship that was found at the first behavioral analysis remained at the subsequent behavioral analyses as long as the birds in that relationship were still alive. Corticosterone levels (χ1 = 3.3; p=0.07), pen (χ1 = 3.3; p=0.07), and family (χ1 = 3.3; p=0.07) had no effect on whether birds were in affiliative relationships.
While there was no effect of corticosterone on telomere length (P=1.0), telomere length did decrease with advancing age (F3,66.2 = 57.7, P < 0.0001, Figure 4A). Aggressor score, target score, David’s score and all interactions were not associated with telomere length at any age or telomere loss rates (Table 3, all p>0.2). Telomere length decreased with age both in birds who were in affiliative relationships (F3,42.3 = 37.7, P < 0.0001, Figure 4B), and for birds who were not in affiliative relationships (F2,21.4 = 50.2, P < 0.0001, Figure 2C). However, birds displaying affiliative behavior had longer telomeres at both 11 and 23 mo (Figures 4B, C), and slower rates of telomere change over the first year of life, compared to birds that did not display affiliative behavior. Telomere length did not differ between these groups of birds at 1 mo of age (Figures 4B, C), and only birds who were in affiliative relationships were still alive at 35 mo of age (Figures 4B, C).
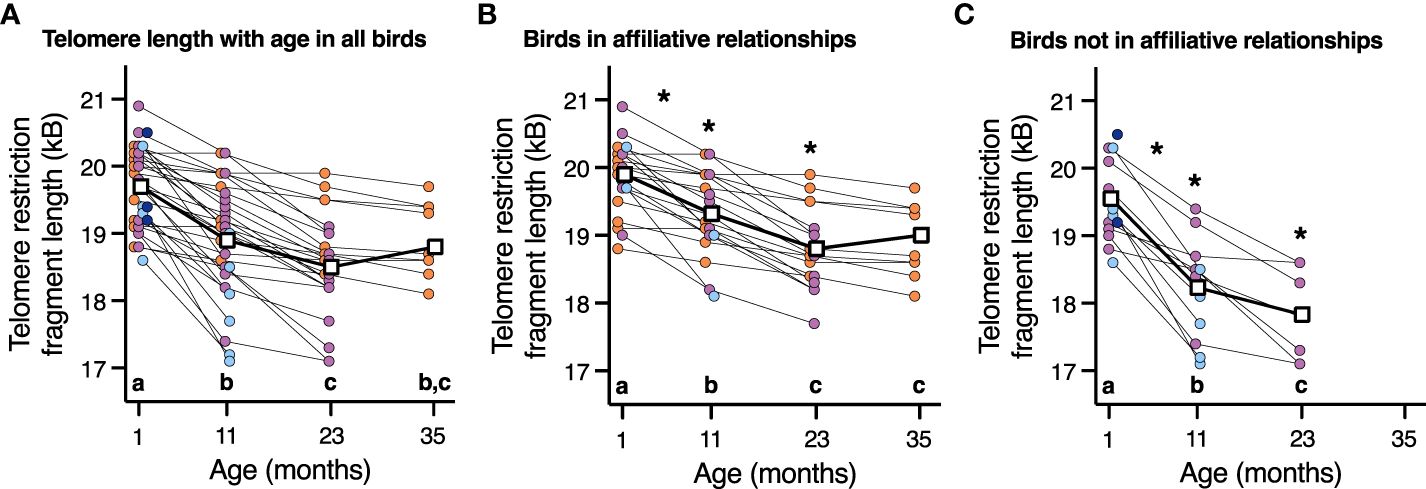
Figure 4 The relationship between telomere length and age in (A) all birds, (B) birds who are in an affiliation, and (C) birds who are not in an affiliation. Scatter plots are shown, and data points from individuals are joined by lines. For easier viewing of telomere length changes over time, birds are color-coded by approximate lifespan with birds who lived < 11 mo (dark blue), 11-23 mo (light blue), 23-35 mo (purple), and >35 mo (orange). Group means are denoted by open white squares joined by lines. Different letters within each plot denote telomere length differences among the ages on that specific plot (p < 0.05). An * denotes statistically significant difference among affiliative groups either at a specific age or rate of change shown in plot B and C at those specific ages (p < 0.05).
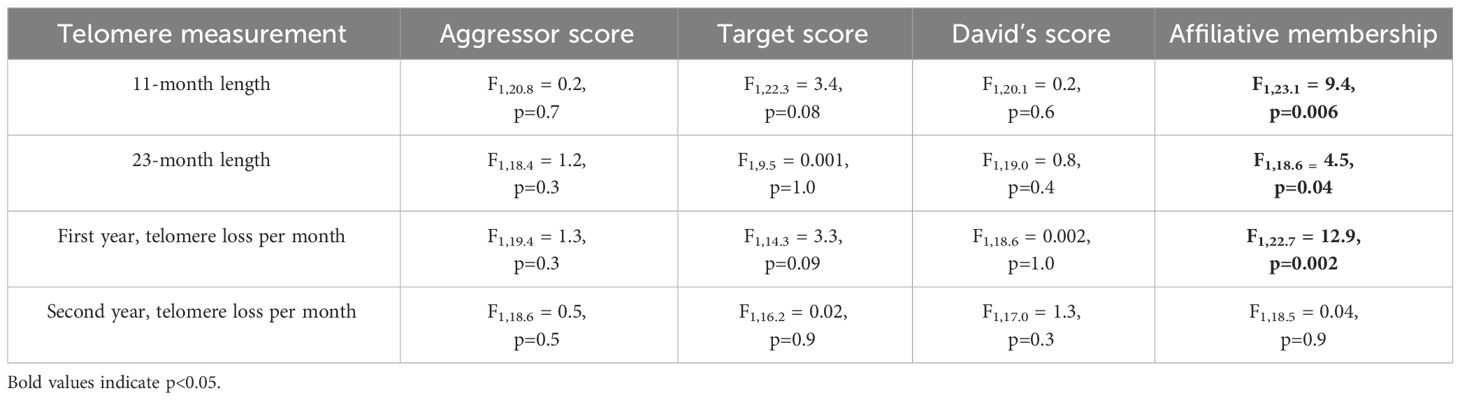
Table 3 Results of generalized linear mixed models (LMM) analyzing the response to aggressor score, target score, David’s score, and affiliative relationship on telomere lengths at different ages or telomere loss rates.
Birds with slower telomere loss rates in both the first and second year of life had significantly longer lifespans (Table 4, Figure 5). Average corticosterone concentrations, TRF length at 1 mo of age, and the four behavioral scores had no impact on lifespan (Table 4). Based on the significant relationships between affiliative behavior and telomeres and between telomeres and lifespan, we explored the linkages among these variables using path analysis. The top three models based on the four model evaluation statistics (Table 5) are shown Figures 6A–C. Importantly, all three of these models provided a good fit to the data and showed that affiliative relationships were related to telomere loss, which in turn predicted lifespan (Figure 6, Table 5). While distinguishing among these three models is difficult, for illustrative purposes, the model that satisfied all of the selection criteria (Figure 6D, Table 5) shows that for each for each affiliative relationship a bird possesses there was a reduction in telomere loss of 0.4kb in the first year (F3,42.3 = 37.7, P < 0.0001), and 0.2 kb in the second year (F3,42.3 = 37.7, P < 0.0001). In addition, each 1kb of telomere loss in the first year of life resulted in a 0.99 year reduction in lifespan, and in the second year of life, each 1kb of telomere loss subtracted an additional 0.82 years of life.
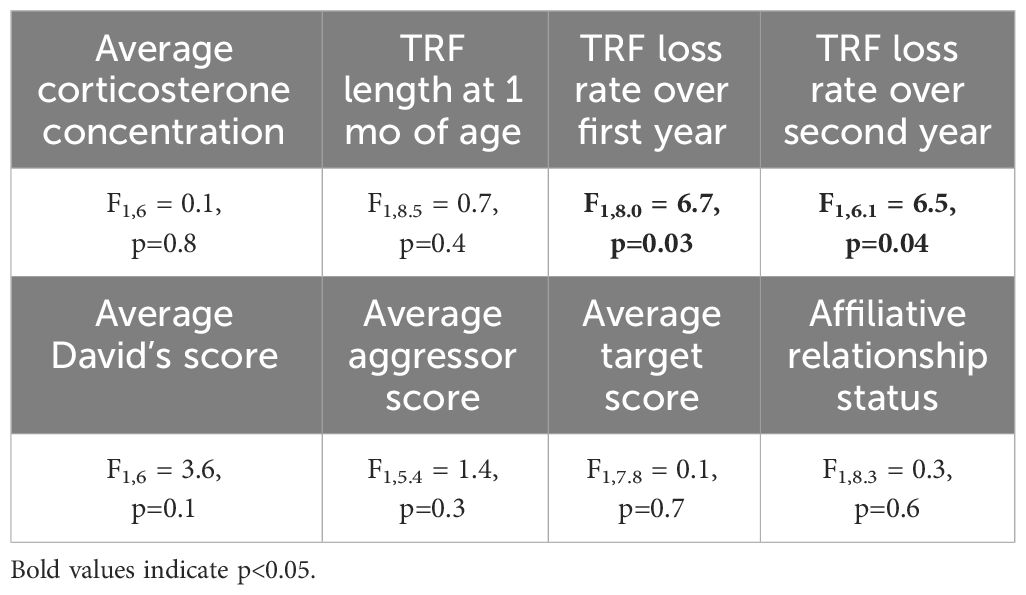
Table 4 Results of generalized linear mixed models (GLMM) analyzing the response average corticosterone concentration, TRF length at 1 mo of age, and TRF loss rates over the first and second year of life on lifespan.
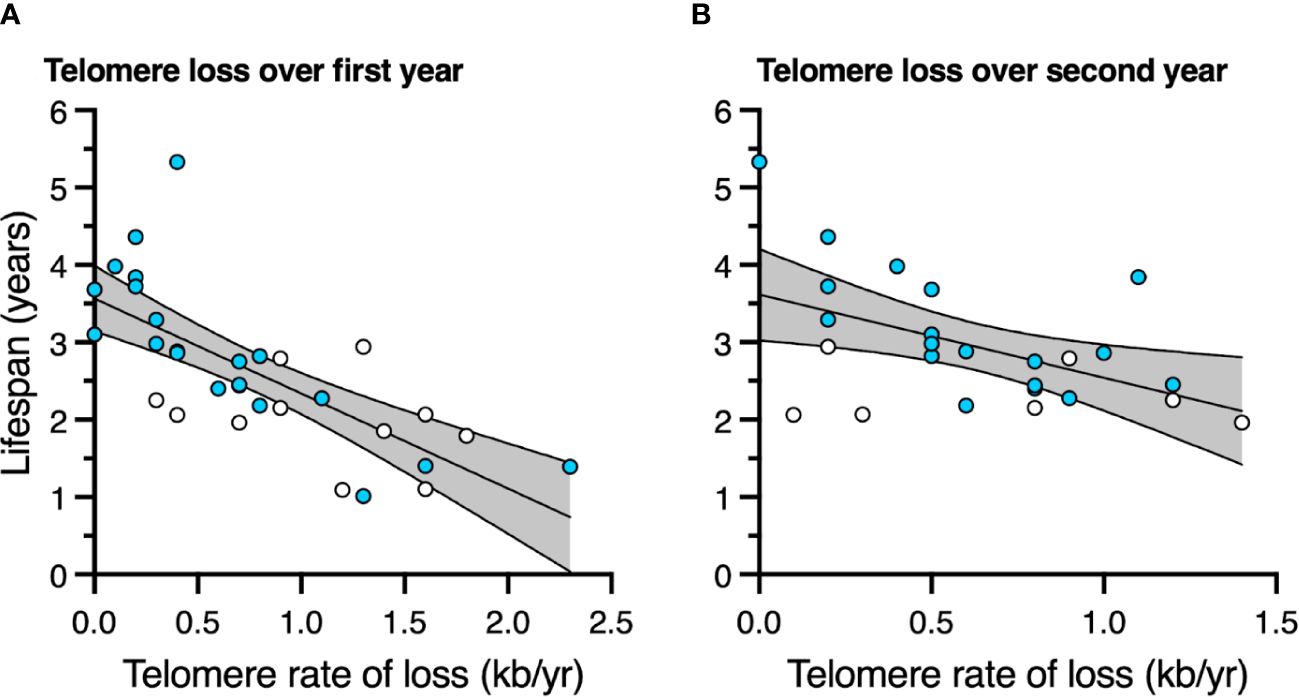
Figure 5 The relationship between telomere rate of loss and lifespan (A) over the first year of life, and (B) over the second year of life. Scatter plots are shown with data points for those birds not in an affiliation (white) and those in an affiliation (blue). Linear regression lines with 95% confidence intervals are plotted.
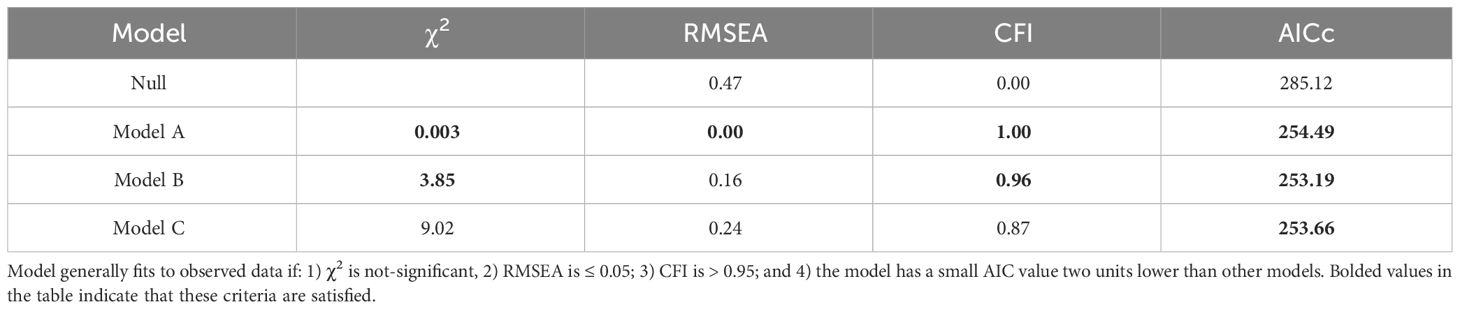
Table 5 Model fit parameters for the null model and the three best-supported path analysis models affiliative membership, telomere loss in the first and second year, and lifespan.
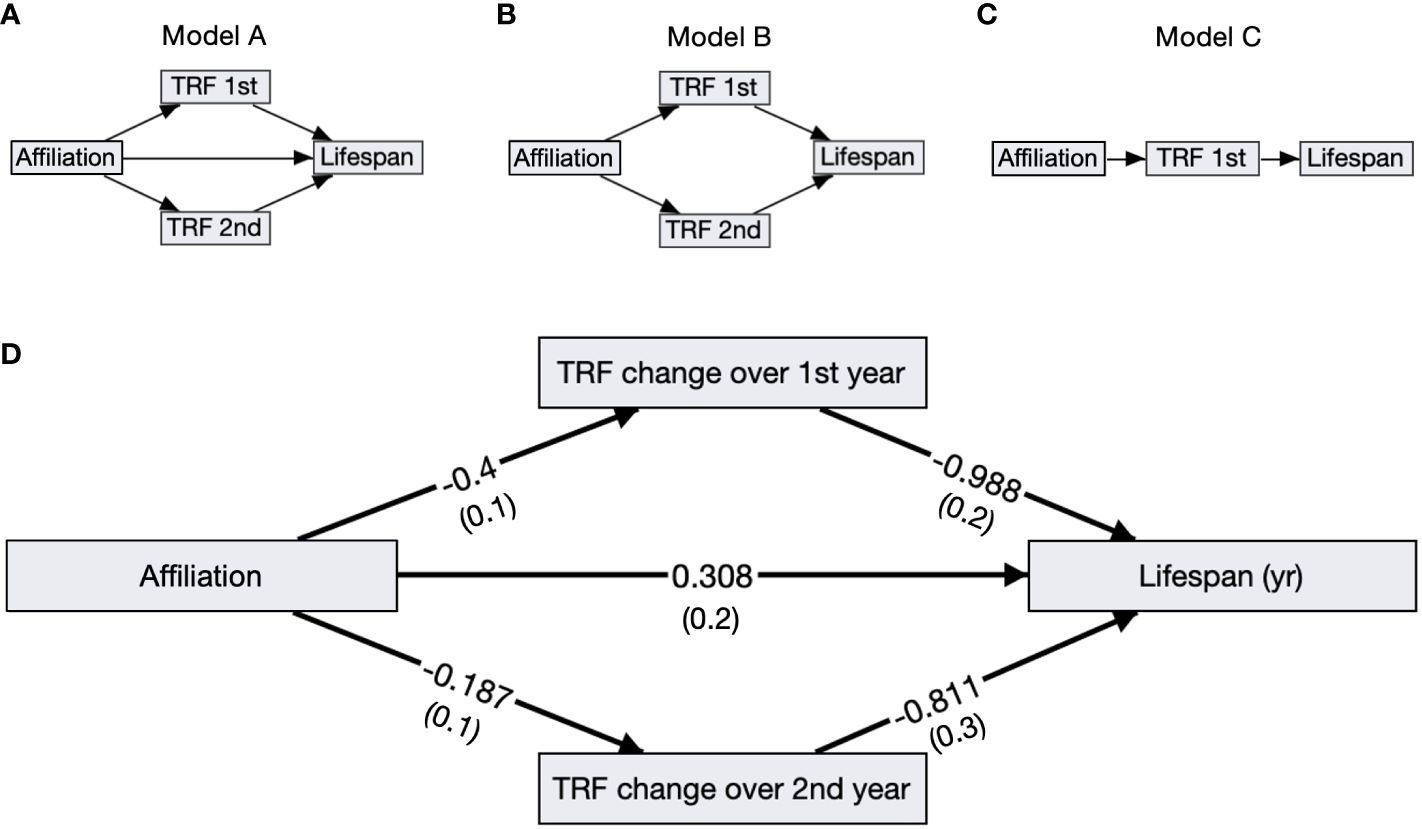
Figure 6 Path analysis diagrams. (A–C) Diagrams of the top ranked paths as determined by four model evaluation statistics; showing affiliative membership (Affiliation), telomere loss rates in the first (TRF 1st) and second year (TRF 2nd), and lifespan. (D) The top model A including standardized path coefficients with SEM in parentheses reported next to its corresponding arrow. All of the relationships, denoted by arrows, are significant in this model.
Our study investigates the effects of social support and anti-social behavior on chronic stress levels and lifespan in the social Japanese quail. We found that while affiliative behavior did not affect baseline corticosterone levels, it was linked to slower rates of telomere loss in the first and second year of life. In addition, affiliative behavior and telomere loss rates were independently connected to longer lifespans in these birds. To our knowledge, this is the first report of a connection between affiliative behavior, telomeres, and lifespan.
While agonistic interactions were common during behavioral trials, we also found that some pairs or trios of birds in each pen rarely or never engaged in aggressive encounters with one another. Importantly, these birds were still involved in aggressive encounters with other birds in the pen, but avoided aggressive interactions with one another. Affiliative behavior is common in social animals (53). In our study, these affiliative behaviors during the trials could provide a number of benefits including, but not limited to, (i) protecting members from agonistic interactions before they occur, so that less aggression is experienced, (ii) providing a social network to buffer against the negative effects of aggression after an encounter has occurred, or (iii) making an individual less likely to initiate agonistic interactions. We allowed social groups to form naturally, and therefore our experimental design does not allow us to differentiate among these three situations, which may not be mutually exclusive. Regardless, we found that birds displaying affiliative behavior were involved in less aggressive agonistic interactions throughout their lifespan. In humans, greater perceived social support is correlated with both less aggression toward others and less exposure to violence (54–56), suggesting that affiliative behavior could provide for both i and iii above. Interestingly, affiliative behavior may have a genetic component, as we found birds in some families were significantly more likely to be a part of a coalition. This is not entirely surprising, as genetic variation among individuals can lead to variation in social behavior and in turn, social information can alter brain gene expression and social behavior (57).
Birds in affiliative relationships had longer telomeres and less telomere loss over the first year of life compared to birds who did not display affiliative behavior. In humans, social support is also correlated with longer telomere length (58, 59 but see 60). Social support is known to decrease inflammation and oxidative stress (61, 62), both of which can shorten telomeres (23, 63). Thus, in our study, it is possible that affiliative behavior and the protection against agonistic interaction it provides may buffer cellular damage and protect telomeres.
Telomere length decreased with advancing age in the birds in our population. In addition, birds with slower telomere loss rates in both the first and second year of life had significantly longer lifespans. Previous work in birds (64–69) and humans (70–73) have reported that individuals with longer telomeres or slower loss rates have higher survival prospects (but see 74). To our knowledge, only one study to date has investigated telomere dynamics over the entire lifespan of the study organisms. Heidinger et al. (68) found that telomere length at 25 days of age in zebra finches was a very strong predictor of longevity. While we saw no effect of telomere length at one month of age on lifespan, we did find that telomere loss rates over the first year of life predicted lifespan. In agreement with Heidinger et al. (68), our work suggests that early life experiences and environment can have long-term effects on levels of cellular damage and organismal lifespan.
Due to the relationships between affiliative behavior, telomere loss, and lifespan, we performed path analysis to determine whether there was a causal pathway of effects between these three variables. The top three models were not easily distinguishable based on our four model selection criteria, and all show that affiliative relationships resulted in telomere loss in the first and second year of life compared to birds who were not involved in an affiliative relationship. In addition, birds with higher telomere loss rates also had shorter lifespans. Interestingly, in the model that passed all four selection criteria, affiliative behavior also had a beneficial effect on lifespan independent of its effects on telomeres. Other recent work in zebra finches showed that birds who experienced the most aggression had the highest levels of oxidative damage and the shortest telomeres (75). While this study did not measure affiliative behavior, it is possible that the birds that experienced the most aggression also received the smallest level of social support. Taken together with the work we present here, these results are exciting and suggest new possible lines of investigation for how social support, and specifically affiliative behavior could affect cellular aging and lifespan. We need more studies exploring the mechanistic links that underlie how social behavior can affect specific cellular damage and repair pathways.
One possible mechanistic link that connects social stressors to cellular damage are glucocorticoid levels. We measured baseline glucocorticoid levels at four times across the bird’s lifespans. Baseline glucocorticoids provide information on an individual’s energetic state, and baseline levels rise in response to frequent environmental challenges (18). We found that, regardless of age, birds with the highest agonistic aggressor score had significantly lower corticosterone levels. Higher levels of glucocorticoids inhibit aggressive behavior (76, 77), which agrees with the results from our study. In previous work from our lab, we found that being the target of aggressive behavior increased baseline corticosterone, but only if the individuals were exposed to high levels of maternal corticosterone during embryonic development (21). This previous study suggested that maternal glucocorticoids may provide for endocrine flexibility in stressful postnatal environments, and in the light of our current work it would be interesting to know if maternal glucocorticoid exposure may also prepare offspring for a stressful environment by increasing affiliative behavior.
While previous studies in humans (78–80) and birds (19, 81) reported links between glucocorticoids and telomere shortening; we did not find any connection between baseline corticosterone and telomeres in the present study. Circulating glucocorticoid levels are dynamic, and it is possible that simple measures of baseline levels do not fully capture this complexity. For example, previous work in chickens reported that telomere loss was not related to baseline levels of corticosterone, but rather corticosterone regulation through the efficacy of negative feedback (19). Interestingly, glucocorticoid regulation and the pattern of stress exposure also appears to be tied to increased oxidative stress (14). Ideally, future work would explore how lifetime measures of baseline and stress-induced glucocorticoid levels, as well as glucocorticoid negative feedback efficiency can affect cellular damage levels and organismal lifespan.
Social behavior is complex and consists of both beneficial affiliative behaviors and costly agonistic behaviors. In humans, high levels of social support are linked to better age-related outcomes, including reduced rates of cancer, increased immunity, and longer lifespan (3). Conversely, agonistic and antisocial behavior, which is difficult to study in humans, comes with several health risks (7). Using a model social animal, we found that affiliative behavior was linked with slower telomere attrition, and in turn, slower telomere attrition was linked with greater longevity. Our study highlights how the complexity of social behavior can have lifelong consequences. Future work should continue to address the underlying mechanisms by which social behavior affects aging and lifespan, and explore how environmental complexity and context can affect both affiliative and agonistic behaviors.
The raw data supporting the conclusions of this article will be made available by the authors, without undue reservation.
The animal study was approved by Bucknell Institutional Animal Care and Use Committee. The study was conducted in accordance with the local legislation and institutional requirements.
SM: Validation, Visualization, Writing – original draft, Writing – review & editing. OC: Validation, Writing – original draft, Writing – review & editing. VF: Conceptualization, Data curation, Investigation, Methodology, Validation, Writing – original draft, Writing – review & editing. SG: Data curation, Investigation, Validation, Writing – original draft, Writing – review & editing. MH: Conceptualization, Data curation, Formal Analysis, Funding acquisition, Investigation, Methodology, Project administration, Resources, Software, Supervision, Validation, Visualization, Writing – original draft, Writing – review & editing.
The author(s) declare financial support was received for the research, authorship, and/or publication of this article. MH was supported by the National Institutes of Health (Grant no. R15HD083870) and the Bucknell Biology Department.
We thank Cindy Rhone, Amber Hackenberg, and Kelsey Lingenfelter for help with the quail.
The authors declare that the research was conducted in the absence of any commercial or financial relationships that could be construed as a potential conflict of interest.
All claims expressed in this article are solely those of the authors and do not necessarily represent those of their affiliated organizations, or those of the publisher, the editors and the reviewers. Any product that may be evaluated in this article, or claim that may be made by its manufacturer, is not guaranteed or endorsed by the publisher.
1. Matthews T, Danese A, Wertz J, Odgers CL, Ambler A, Moffitt TE, et al. Social isolation, loneliness and depression in young adulthood: a behavioural genetic analysis. Soc Psychiatry Psychiatr Epidemiol. (2016) 51:339–48. doi: 10.1007/s00127-016-1178-7
2. Qualter P, Vanhalst J, Harris R, Van Roekel E, Lodder G, Bangee M, et al. Loneliness across the life span. Perspect Psychol Sci. (2015) 10:250–64. doi: 10.1177/1745691615568999
3. Uchino BN. Understanding the links between social support and physical health: A life-span perspective with emphasis on the separability of perceived and received support. Perspect Psychol Sci. (2009) 4:236–55. doi: 10.1111/j.1745-6924.2009.01122.x
4. Uchino BN, Rook KS. Emotions, relationships, health and illness into old age. Maturitas. (2020) 139:42–8. doi: 10.1016/j.maturitas.2020.05.014
5. Hawkley LC, Cacioppo JT. Loneliness and pathways to disease. Brain Behav Immun. (2003) 17 Suppl 1:S98–105. doi: 10.1016/S0889-1591(02)00073-9
6. Orben A, Tomova L, Blakemore S-J. The effects of social deprivation on adolescent development and mental health. Lancet Child Adolesc Health. (2020) 4:634–40. doi: 10.1016/S2352-4642(20)30186-3
8. Shepherd JP, Shepherd I, Newcombe RG, Farrington D. Impact of antisocial lifestyle on health: chronic disability and death by middle age. J Public Health (Oxf). (2009) 31:506–11. doi: 10.1093/pubmed/fdp054
9. Fulda KG, Roper KL, Dotson CH, Cardarelli R. Physical aggression and coronary artery calcification: A North Texas healthy heart study. Int J Behav Med. (2022) 29:14–24. doi: 10.1007/s12529-021-09989-7
10. Ozbay F, Johnson DC, Dimoulas E, Morgan CA, Charney D, Southwick S. Social support and resilience to stress. Psychiatry (Edgmont). (2007) 4:35–40.
11. Shepherd J, Farrington D, Potts J. Impact of antisocial lifestyle on health. J Public Health. (2004) 26:347–52. doi: 10.1093/pubmed/fdh169
12. Knight EL, Mehta PH. Hierarchy stability moderates the effect of status on stress and performance in humans. Proc Natl Acad Sci. (2017) 114:78–83. doi: 10.1073/pnas.1609811114
13. Romero LM, Wingfield JC. Tempests, poxes, predators, and people: stress in wild animals and how they cope. Oxford Univ Press. (2015). doi: 10.1093/acprof:oso/9780195366693.001.0001
14. Majer AD, Fasanello VJ, Tindle K, Frenz BJ, Ziur AD, Fischer CP, et al. Is there an oxidative cost of acute stress? Characterization, implication of glucocorticoids and modulation by prior stress experience. Proc R Soc B: Biol Sci. (2019) 286:20191698. doi: 10.1098/rspb.2019.1698
15. O’Regan D, Kenyon CJ, Seckl JR, Holmes MC. Glucocorticoid exposure in late gestation in the rat permanently programs gender-specific differences in adult cardiovascular and metabolic physiology. Am J Physiology-Endocrinology Metab. (2004) 287:E863–70. doi: 10.1152/ajpendo.00137.2004
16. Sapolsky RM. Stress, the aging brain, and the mechanisms of neuron death. Cambridge, Mass: MIT Press (1992).
17. Romero LM, Wikelski M. Stress physiology as a predictor of survival in Galapagos marine iguanas. Proc R Soc B: Biol Sci. (2010) 277:3157–62. doi: 10.1098/rspb.2010.0678
18. Romero LM. Physiological stress in ecology: lessons from biomedical research. Trends Ecol Evol. (2004) 19:249–55. doi: 10.1016/j.tree.2004.03.008
19. Haussmann MF, Longenecker AS, Marchetto NM, Juliano SA, Bowden RM. Embryonic exposure to corticosterone modifies the juvenile stress response, oxidative stress and telomere length. Proc R Soc B: Biol Sci. (2011) 279:1447–56. doi: 10.1098/rspb.2011.1913
20. Stevenson JR, McMahon EK, Boner W, Haussmann MF. Oxytocin administration prevents cellular aging caused by social isolation. Psychoneuroendocrinology. (2019) 103:52–60. doi: 10.1016/j.psyneuen.2019.01.006
21. Majer AD, Paitz RT, Tricola GM, Geduldig JE, Litwa HP, Farmer JL, et al. The response to stressors in adulthood depends on the interaction between prenatal exposure to glucocorticoids and environmental context. Sci Rep. (2023) 13:6180. doi: 10.1038/s41598-023-33447-x
22. Finkel T, Holbrook NJ. Oxidants, oxidative stress and the biology of ageing. Nature. (2000) 408:239–47. doi: 10.1038/35041687
23. Boonekamp JJ, Bauch C, Mulder E, Verhulst S. Does oxidative stress shorten telomeres? Biol Lett. (2017) 13:20170164. doi: 10.1098/rsbl.2017.0164
24. Aubert G, Lansdorp PM. Telomeres and aging. Physiol Rev. (2008) 88:557–79. doi: 10.1152/physrev.00026.2007
25. Monaghan P, Haussmann MF. Do telomere dynamics link lifestyle and lifespan? Trends Ecol Evol. (2006) 21:47–53. doi: 10.1016/j.tree.2005.11.007
26. Haussmann MF, Marchetto NM. Telomeres: Linking stress and survival, ecology and evolution. Curr Zoology. (2010) 56:714–27. doi: 10.1093/czoolo/56.6.714
27. López-Otín C, Blasco MA, Partridge L, Serrano M, Kroemer G. The hallmarks of aging. Cell. (2013) 153:1194–217. doi: 10.1016/j.cell.2013.05.039
28. Ouellet-Morin I, Cantave C, Paquin S, Geoffroy M-C, Brendgen M, Vitaro F, et al. Associations between developmental trajectories of peer victimization, hair cortisol, and depressive symptoms: a longitudinal study. J Child Psychol Psychiatry. (2021) 62:19–27. doi: 10.1111/jcpp.13228
29. Riehl C, Strong MJ. Stable social relationships between unrelated females increase individual fitness in a cooperative bird. Proc R Soc B: Biol Sci. (2018) 285:20180130. doi: 10.1098/rspb.2018.0130
30. Grand TC, Dill LM. The effect of group size on the foraging behaviour of juvenile coho salmon: reduction of predation risk or increased competition? Anim Behav. (1999) 58:443–51. doi: 10.1006/anbe.1999.1174
31. Teunissen N, Kingma SA, Hall ML, Hidalgo Aranzamendi N, Komdeur J, Peters A. More than kin: subordinates foster strong bonds with relatives and potential mates in a social bird. Behav Ecol. (2018). doi: 10.1093/beheco/ary120
32. Oliveira BS, Zunzunegui MV, Quinlan J, Fahmi H, Tu MT, Guerra RO. Systematic review of the association between chronic social stress and telomere length: A life course perspective. Ageing Res Rev. (2016) 26:37–52. doi: 10.1016/j.arr.2015.12.006
33. Monaghan P. Organismal stress, telomeres and life histories. J Exp Biol. (2014) 217:57–66. doi: 10.1242/jeb.090043
34. Mills AD, Crawford LL, Domjan M, Faure JM. The behavior of the Japanese or domestic quail Coturnix japonica. Neurosci Biobehav Rev. (1997) 21:261–81. doi: 10.1016/S0149-7634(96)00028-0
35. White DJ, Galef BG. Affiliative preferences are stable and predict mate choices in both sexes of Japanese quail, Coturnix japonica. Anim Behav. (1999) 58:865–71. doi: 10.1006/anbe.1999.1210
36. Nichols CR. A comparison of the reproductive and behavioural differences in feral and domestic Japanese quail. Univ Br Columbia. (1991).
37. Griffiths R, Double MC, Orr K, Dawson RJ. A DNA test to sex most birds. Mol Ecol. (1998) 7:1071–5. doi: 10.1046/j.1365-294x.1998.00389.x
38. Fridolfsson A-K, Ellegren H. A simple and universal method for molecular sexing of non-ratite birds. J Avian Biol. (1999) 30:116–21. doi: 10.2307/3677252
39. Wingfield JC, Farner DS. The determination of five steroids in avian plasma by radioimmunoassay and competitive protein-binding. Steroids. (1975) 26:311–27. doi: 10.1016/0039-128X(75)90077-X
40. Haussmann MF, Mauck RA. Telomeres and longevity: testing an evolutionary hypothesis. Mol Biol Evol. (2008) 25:220–8. doi: 10.1093/molbev/msm244
41. Nussey DH, Baird D, Barrett E, Boner W, Fairlie J, Gemmell N, et al. Measuring telomere length and telomere dynamics in evolutionary biology and ecology. Methods Ecol Evol. (2014) 5:299–310. doi: 10.1111/2041-210X.12161
42. Gammell MP, de Vries H, Jennings DJ, Carlin CM, Hayden TJ. David’s score: a more appropriate dominance ranking method than Clutton-Brock et al.’s index. Anim Behav. (2003) 66:601–5. doi: 10.1006/anbe.2003.2226
43. Seibert LM, Crowell-Davis SL. Gender effects on aggression, dominance rank, and affiliative behaviors in a flock of captive adult cockatiels (Nymphicus hollandicus). Appl Anim Behav Sci. (2001) 71:155–70. doi: 10.1016/s0168-1591(00)00172-6
44. Kenny E, Birkhead TR, Green JP. Allopreening in birds is associated with parental cooperation over offspring care and stable pair bonds across years. Behav Ecol. (2017) 28:1142–8. doi: 10.1093/beheco/arx078
45. Lessells CM, Boag PT. Unrepeatable repeatabilities: A common mistake. Auk. (1987) 104:116–21. doi: 10.2307/4087240
46. Nakagawa S, Schielzeth H. Repeatability for Gaussian and non-Gaussian data: a practical guide for biologists. Biol Rev. (2010) 85:935–56. doi: 10.1111/j.1469-185X.2010.00141.x
47. Shipley B. Cause and correlation in biology: A user’s guide to path analysis, structural equations and causal inference. 1st edition. Cambridge: Cambridge University Press (2002). 332 p.
48. Streiner DL. Finding our way: an introduction to path analysis. Can J Psychiatry. (2005) 50:115–22. doi: 10.1177/070674370505000207
49. Gómez JM, Zamora R. Spatial variation in the selective scenarios of hormathophylla spinosa (Cruciferae). Am Nat. (2000) 155:657–68. doi: 10.1086/303353
50. Streiner DL. Building a better model: an introduction to structural equation modelling. Can J Psychiatry. (2006) 51:317–24. doi: 10.1177/070674370605100507
51. Xia Y, Yang Y. RMSEA, CFI, and TLI in structural equation modeling with ordered categorical data: The story they tell depends on the estimation methods. Behav Res. (2019) 51:409–28. doi: 10.3758/s13428-018-1055-2
52. Hu L, Bentler PM. Cutoff criteria for fit indexes in covariance structure analysis: Conventional criteria versus new alternatives. Struct Equation Modeling: A Multidiscip J. (1999). doi: 10.1080/10705519909540118
53. Jasso del Toro C, Nekaris KA-I. Affiliative behaviors. In: Vonk J, Shackelford TK, editors. Encyclopedia of animal cognition and behavior. Springer International Publishing, Cham (2022). p. 106–11.
54. Benhorin S, McMahon SD. Exposure to violence and aggression: protective roles of social support among urban African American youth. J Community Psychol. (2008) 36:723–43. doi: 10.1002/jcop.20252
55. Hamama L, Ronen-Shenhav A. Self-control, social support, and aggression among adolescents in divorced and two-parent families. Children Youth Serv Rev. (2012) 34:1042–9. doi: 10.1016/j.childyouth.2012.02.009
56. Jenkins LN, Demaray MK. Social support and self-concept in relation to peer victimization and peer aggression. J School Violence. (2012) 11:56–74. doi: 10.1080/15388220.2011.630958
57. Robinson GE, Fernald RD, Clayton DF. Genes and social behavior. Science. (2008) 322:896–900. doi: 10.1126/science.1159277
58. Carroll JE, Diez Roux AV, Fitzpatrick AL, Seeman T. Low social support is associated with shorter leukocyte telomere length in late life: multi-ethnic study of atherosclerosis. Psychosomatic Med. (2013) 75:171. doi: 10.1097/PSY.0b013e31828233bf
59. Stein JY, Levin Y, Lahav Y, Uziel O, Abumock H, Solomon Z. Perceived social support, loneliness, and later life telomere length following wartime captivity. Health Psychol. (2018) 37:1067–76. doi: 10.1037/hea0000669
60. Montoya M, Uchino BN. Social support and telomere length: a meta-analysis. J Behav Med. (2023) 46:556–65. doi: 10.1007/s10865-022-00389-0
61. Yang YC, Schorpp K, Harris KM. Social support, social strain and inflammation: Evidence from a national longitudinal study of U.S. adults. Soc Sci Med. (2014) 107:124–35. doi: 10.1016/j.socscimed.2014.02.013
62. Schumann S, Mozzi G, Piva E, Devigili A, Negrato E, Marion A, et al. Social buffering of oxidative stress and cortisol in an endemic cyprinid fish. Sci Rep. (2023) 13:20579. doi: 10.1038/s41598-023-47926-8
63. Jurk D, Wilson C, Passos JF, Oakley F, Correia-Melo C, Greaves L, et al. Chronic inflammation induces telomere dysfunction and accelerates ageing in mice. Nat Commun. (2014) 5:4172. doi: 10.1038/ncomms5172
64. Asghar M, Hasselquist D, Hansson B, Zehtindjiev P, Westerdahl H, Bensch S. Hidden costs of infection: Chronic malaria accelerates telomere degradation and senescence in wild birds. Science. (2015) 347:436–8. doi: 10.1126/science.1261121
65. Barrett ELB, Burke TA, Hammers M, Komdeur J, Richardson DS. Telomere length and dynamics predict mortality in a wild longitudinal study. Mol Ecol. (2013) 22:249–59. doi: 10.1111/mec.12110
66. Bize P, Criscuolo F, Metcalfe NB, Nasir L, Monaghan P. Telomere dynamics rather than age predict life expectancy in the wild. Proc R Soc B: Biol Sci. (2009) 276:1679–83. doi: 10.1098/rspb.2008.1817
67. Haussmann MF, Winkler DW, Vleck CM. Longer telomeres associated with higher survival in birds. Biol Lett. (2005) 1:212–4. doi: 10.1098/rsbl.2005.0301
68. Heidinger BJ, Blount JD, Boner W, Griffiths K, Metcalfe NB, Monaghan P. Telomere length in early life predicts lifespan. Proc Natl Acad Sci. (2012) 109:1743–8. doi: 10.1073/pnas.1113306109
69. Salomons HM, Mulder GA, van de Zande L, Haussmann MF, Linskens MHK, Verhulst S. Telomere shortening and survival in free-living corvids. Proc R Soc B: Biol Sci. (2009) 276:3157–65. doi: 10.1098/rspb.2009.0517
70. Bakaysa SL, Mucci LA, Slagboom PE, Boomsma DI, McClearn GE, Johansson B, et al. Telomere length predicts survival independent of genetic influences. Aging Cell. (2007) 6:769–74. doi: 10.1111/j.1474-9726.2007.00340.x
71. Boonekamp JJ, Simons MJP, Hemerik L, Verhulst S. Telomere length behaves as biomarker of somatic redundancy rather than biological age. Aging Cell. (2013) 12:330–2. doi: 10.1111/acel.12050
72. Cawthon RM, Smith KR, O’Brien E, Sivatchenko A, Kerber RA. Association between telomere length in blood and mortality in people aged 60 years or older. Lancet. (2003) 361:393–5. doi: 10.1016/S0140-6736(03)12384-7
73. Njajou OT, Hsueh W-C, Blackburn EH, Newman AB, Wu S-H, Li R, et al. Association between telomere length, specific causes of death, and years of healthy life in health, aging, and body composition, a population-based cohort study. Journals Gerontology: Ser A. (2009) 64A:860–4. doi: 10.1093/gerona/glp061
74. Arai Y, Martin-Ruiz CM, Takayama M, Abe Y, Takebayashi T, Koyasu S, et al. Inflammation, but not telomere length, predicts successful ageing at extreme old age: A longitudinal study of semi-supercentenarians. EBioMedicine. (2015) 2:1549–58. doi: 10.1016/j.ebiom.2015.07.029
75. Quque M, Ferreira C, Sosa S, Schull Q, Zahn S, Criscuolo F, et al. Cascading effects of conspecific aggression on oxidative status and telomere length in zebra finches. Physiol Biochem Zool. (2022). doi: 10.1086/721252
76. Haller J. Glucocorticoids and aggression: A tripartite interaction. Curr Top Behav Neurosci. (2022) 54:209–43. doi: 10.1007/7854_2022_307
77. Haller J. “The glucocorticoid/aggression relationship in animals and humans: an analysis sensitive to behavioral characteristics, glucocorticoid secretion patterns, and neural mechanisms.,”. In: Miczek KA, Meyer-Lindenberg A, editors. Neuroscience of aggression. Springer, Berlin, Heidelberg (2014). p. 73–109.
78. Athanasoulia-Kaspar AP, Auer MK, Stalla GK, Jakovcevski M. Shorter telomeres associated with high doses of glucocorticoids: the link to increased mortality? Endocrine Connections. (2018) 7:1217–26. doi: 10.1530/EC-18-0362
79. Epel ES, Blackburn EH, Lin J, Dhabhar FS, Adler NE, Morrow JD, et al. Accelerated telomere shortening in response to life stress. Proc Natl Acad Sci U.S.A. (2004) 101:17312–5. doi: 10.1073/pnas.0407162101
80. Puterman E, Gemmill A, Karasek D, Weir D, Adler NE, Prather AA, et al. Lifespan adversity and later adulthood telomere length in the nationally representative US Health and Retirement Study. Proc Natl Acad Sci. (2016) 113:E6335–42. doi: 10.1073/pnas.1525602113
Keywords: social support, telomere length, lifespan, social stress, aggression, anti-social behavior
Citation: McCollum SE, Canter O, Fasanello VJ, Gronsky S and Haussmann MF (2024) Birds of a feather age together: telomere dynamics and social behavior predict life span in female Japanese quail (Coturnix japonica). Front. Endocrinol. 15:1363468. doi: 10.3389/fendo.2024.1363468
Received: 30 December 2023; Accepted: 23 April 2024;
Published: 14 May 2024.
Edited by:
Gabriele Christine Saretzki, Newcastle University, United KingdomReviewed by:
Michael L. Pepke, University of Copenhagen, DenmarkCopyright © 2024 McCollum, Canter, Fasanello, Gronsky and Haussmann. This is an open-access article distributed under the terms of the Creative Commons Attribution License (CC BY). The use, distribution or reproduction in other forums is permitted, provided the original author(s) and the copyright owner(s) are credited and that the original publication in this journal is cited, in accordance with accepted academic practice. No use, distribution or reproduction is permitted which does not comply with these terms.
*Correspondence: Mark F. Haussmann, bWZoMDA4QGJ1Y2tuZWxsLmVkdQ==
Disclaimer: All claims expressed in this article are solely those of the authors and do not necessarily represent those of their affiliated organizations, or those of the publisher, the editors and the reviewers. Any product that may be evaluated in this article or claim that may be made by its manufacturer is not guaranteed or endorsed by the publisher.
Research integrity at Frontiers
Learn more about the work of our research integrity team to safeguard the quality of each article we publish.