
94% of researchers rate our articles as excellent or good
Learn more about the work of our research integrity team to safeguard the quality of each article we publish.
Find out more
ORIGINAL RESEARCH article
Front. Endocrinol., 13 November 2024
Sec. Cancer Endocrinology
Volume 15 - 2024 | https://doi.org/10.3389/fendo.2024.1362278
This article is part of the Research TopicObesity and Metabolism in Endocrine-Related CancersView all 3 articles
Introduction: Adamantinomatous craniopharyngioma (ACP) is difficult to cure completely and prone to recurrence after surgery. Ferroptosis as an iron-dependent programmed cell death, may be a critical process in ACP. The study aimed to screen diagnostic markers related to ferroptosis in ACP to improve diagnostic accuracy.
Methods: Gene expression profiles of ACP were obtained from the gene expression omnibus (GEO) database. Limma package was used to analyze the differently expressed genes (DEGs). The intersection of DEGs and ferroptosis-related factors was obtained as differently expressed ferroptosis-related genes (DEFRGs). Enrichment analysis was processed, including Gene Ontology (GO), Kyoto Encyclopedia of Genes and Genomes (KEGG), disease ontology (DO), gene set enrichment analysis (GSEA), and Gene Set Variation Analysis (GSVA) analysis. Machine learning algorithms were undertaken for screening diagnostic markers associated with ferroptosis in ACP. The levels of DEFRGs were verified in ACP patients. A nomogram was drawn to predict the relationship between key DEFRG expression and risk of disease. The disease groups were then clustered by consensus clustering analysis.
Results: DEGs were screened between ACP and normal samples. Ferroptosis-related factors were obtained from the FerrDb V2 and GeneCard databases. The correlation between DEFRGs and ferroptosis markers was also confirmed. A total of 6 overlapped DEFRGs were obtained. Based on the results of the nomogram, CASP8, KRT16, KRT19, and TP63 were the protective factors of the risk of disease, while GOT1 and TFAP2C were the risk factors. According to screened DEFRGs, the consensus clustering matrix was differentiated, and the number of clusters was stable. CASP8, KRT16, KRT19, and TP63, were upregulated in ACP patients, while GOT1 was downregulated. CASP8, KRT16, KRT19, TP63, CASP8, and GOT1 affect multiple ferroptosis marker genes. The combination of these genes might be the biomarker for ACP diagnosis via participating ferroptosis process.
Discussion: Ferroptosis-related genes, including CASP8, KRT16, KRT19, TP63, and GOT1 were the potential markers for ACP, which lays the theoretical foundation for ACP diagnosis.
Craniopharyngioma (CP) is a rare epithelial neoplasm, accounting for about 2% to 5% of primary intracranial tumors (1, 2). According to histological typing, there is a higher percentage of adamantinomatous craniopharyngiomas (ACP) compared with papillary craniopharyngioma (PCP) (3). Due to its unique location, complications, such as hypothalamic dysfunction, endocrine deficiencies, and visual impairment result in a low survival rate of CP patients (4). CP has malignant outcomes. Radiotherapy, stereotactic radiosurgery, internal irradiation therapy, and chemotherapy for the treatment of malignant tumors are used as treatment for craniopharyngiomas (5, 6). However, the risk of high recurrence rates and complications is always present (7). More effective treatments need to be researched.
Molecular biology techniques provide more theoretical support for genetic alterations in CPs, facilitate the identification of different biomarkers, and offer new perspectives for target treatment (8). As reported in a previous study, mutations in the Catenin Beta 1 (CTNNB1) cause the deposition of β-chain proteins in the cytoplasm of the nucleus, which activates the Wingless-Type MMTV Integration Site Family (WNT)/β⁃catenin signaling pathway, leading to ACP occurrence (9). β⁃catenin mutations activate the WNT pathway and cause alterations in the MEK/ERK pathway, resulting in proliferation and invasion of ACP cells (10). These ACP-specific genes have expanded therapeutic selectivity and provided the basis for individualized treatment. Further translational research and clinical trials are in progress, and more effective targets are needed to provide a theoretical basis for drug development.
Ferroptosis is an iron-dependent and programmed cell death distinct from apoptosis, necrosis, and autophagy (11, 12). In recent years, it plays an important role in a variety of diseases, including cancer (13), neurodegeneration (14) and ischemic organ damage (15). Although ferroptosis has been studied in various diseases, its mechanism in ACP remains unclear. Traditional methods for marker screening included single-factor statistical analysis, multi-factor statistical analysis, and single machine learning methods (16). Weak screening ability, the complex panel of markers, and poor accuracy of markers limited the screening ability. To screen potential biomarkers with high sensitivity, accuracy, and stability, multiple algorithms of machine learning methods for marker screening were applied (17). Machine learning algorithms have been used to screen precise biomarkers for the treatment of various diseases (18). In this study, we screened differently expressed ferroptosis-related genes (DEFRGs) via machine learning techniques, aiming to provide a ferroptosis-related therapeutic target and further lay the theoretical foundation for the ACP treatment.
Gene expression profiles, including GSE68015 (19) and GSE94349 (20) were obtained from the gene expression omnibus (GEO) database (https://www.ncbi.nlm.nih.gov/geo/). Therefore, the GSE68015 database contains 15 ACP samples and 16 normal brain tissue samples. The GSE94349 database contained 9 ACP and 17 normal brain tissue samples. Using the “sva” R package, we merged the two datasets. There are 24 ACP and 33 normal brain tissue samples. The platform was Affymetrix HG-U133plus2 chips (Platform GPL570). Through the “sva” R package, the two data sets were merged and normalized. To eliminate the batch effect, we normalized the gene expression matrices of the two datasets and removed the genes that were missing from each other. The ComBat function of the SVA package in R was used to eliminate the batch effect.
Limma package of R language was used to screen different expressed genes (DEGs) between 24 ACP and 33 normal brain tissue samples with the threshold of |LogFC| > 2 and P < 0.05. Then, the ggVolcano package and TBtools were used to show the heatmap and volcano plot, respectively. We obtained ferroptosis-related factors from the databases of FerrDb V2 (zhounan. org/ferrdb/current/) and GeneCard [GeneCards - Human Genes | Gene Database | Gene Search (weizmann. ac. il)]. Then, the intersection of DEGs and ferroptosis-related factors was obtained as DEFRGs for further analysis, which was shown by the Venn diagram. Furthermore, protein-protein interaction (PPI) analysis of DEFRGs was conducted based on the STRING website (STRING: functional protein association networks (string db. org) to demonstrate the regulatory relationships.
According to the database of DAVID (http://david.ncifcrf.gov/), the candidate DEFRGs were processed for GO annotations. FunRich tool (http://www.funrich.org/) was undertaken for the Kyoto Encyclopedia of Genes and Genomes (KEGG) analysis. Disease Ontology (DO) enrichment was conducted via OmicShare tools (www.omicshare.com) The enrichment list with a P-value < 0.05 was screened with statistical significance. Msigdb database of gene set enrichment analysis (GSEA, gsea-msigdb.org) was used to analyze the enriched KEGG pathways. We used the GSVA package of R software to analyze up- and down-regulated DEGs.
Least absolute shrinkage and selection operator (LASSO) and support vector machine recursive feature elimination (SVM-RFE) are two important algorithms of machine learning techniques. Lasso linear regression (21–23) is capable of feature selection and regularization. The basic principle is to add the absolute value of the model weight coefficients to the loss function. The overfitting of the model is prevented and the generalization ability of the model is increased by reducing the weights and lowering the weight values. The SVM-RFE algorithm (24) is a combination of SVM and RFE algorithms. Importance assessment of features was performed by SVM model and unimportant features were eliminated using the iterative process of RFE. The SVM-RFE algorithm was based on the principle of maximum interval of SVM, and scores of each feature are ranked by model training samples. The features with the smallest feature scores were removed using the RFE algorithm in a step-by-step iterative manner. Then, the remaining features were used to train the model again for the next iteration, and the optimal feature combination was selected. In this study, we used these algorithms to screen DEFRGs. e1071 and glmnet packages were used for SVM-RFE and LASSO algorithms, respectively. The screened genes were characterized by higher discriminative power and variable, respectively. The overlapped genes were obtained as key DEFRGs. Correlation analysis between DEFRGs was undertaken, and visualized by ggplot 2.
The study was approved by the Medical Ethics Committee of The Seventh Affiliated Hospital of Sun Yat-sen University (2019SYSUSH-020). A total of 35 ACP patients were included. All patients were hospitalized and underwent surgery in our hospital from Mar 2018 through May 2022, and they did not receive radiotherapy and chemotherapy treatments. A total of 10 normal brain samples as controls were obtained by autopsies. All patients or their family were informed and consented. ACP and control tissues were obtained and refrigerated at −80°C.
Purlink RNA Mini assay kit (Thermo Fisher Scientific, Waltham, MA, USA) was used for isolating the total RNA. Then, the obtained RNA was reversed and transcribed into complementary DNA (cDNA). The primers were designed and obtained from Sangon Biotech (Shanghai, China). These are shown as follows:
CASP8, (F) 5′-ATGGCTACGGTGAAGAACTGCG-3′,
(R) 5′-TAGTTCACGCCAGTCAGGATGC-3′;
GOT1, (F) 5′-CTGGGAGTGGGAGCATAT-3′,
(R) 5′-CAAGGGCAAGACGAGAAG-3′;
KRT16, (F) 5′- GAGATCAAAGACTACAGCCC-3′,
(R) 5′-CATTCTCGTACTTGGTCCTG-3′;
KRT19, (F) 3’-GCACTACAGCCACTACTACACGA-5’,
(R) 3’-CTCATGCGCAGAGCCTGTT-5’;
TFAP2C, (F) 5′-ATCGAAAAATGGAGGCCGGT-3′,
(R) 5′-CGGCTTCACAGACATAGGCA-3′;
TP63 (F) 5’-CAATGGCTGGAGACATGAATGGACTCA-3’,
(R) 5’-CTGCCTTCTGTGAGCCAGCTTATCAACC-3’.
The SuperReal PreMix Color kit (Tiangen, Beijing, China) was applied to detect the expressions of the above genes. The 2-ΔΔCt was applied to show the expression levels of key DEFRGs. β-actin was used as a reference.
Ferroptosis markers, including SLC40A1, NFE2L2, HSPB1, GPX4, CHAC1, PTGS2, TF, TFRC, and FTH1 were detected using ELISA kits (Multi Sciences Co., Ltd., China) according to the instructions. The steps were as follows. A total of 20 mg of fresh tissue was obtained and used to detect the expression levels of ferroptosis markers, including SLC40A1, NFE2L2, HSPB1, GPX4, CHAC1, PTGS2, TF, TFRC, and FTH1. The homogenizing medium was added and centrifuged at 4°C, 1500×g for 10 min. The middle layer was aspirated for the experiment. Specific anti-mouse antibodies were pre-coated on an enzyme-labeled plate. The wells of the plate were filled with a standard, the sample to be tested, and a biotinylated detection antibody. After incubation, the unbound antibody was removed and horseradish peroxidase-labeled streptavidin (Streptavidin-HRP) was added. TMB was added and the color was developed avoiding light. After color development, samples were detected by Automatic Microplate Reader (MuhiskanMk3, Thermo Labsystems Ltd., USA).
R (version 4.1.2) was used for statistical analyses. Receiver operating characteristic (ROC) curves were applied to validate the accuracy of machine learning algorithms. Student t-test was used for comparison between the two groups. P < 0.05 was the threshold of significance. All experiments were repeated more than 3 times. According to the multivariate Cox proportional hazards regression model, a nomogram was drawn to predict the relationship between key DEFRG expression and risk of disease. The disease groups were clustered by consensus clustering analysis. The correlation analysis between 6 genes with 9 Ferroptosis related markers, including SLC40A1, NFE2L2, HSPB1, GPX4, CHAC1, PTGS2, TF, TFRC, and FTH1 (25), was calculated using the Pearson correlation method. The statistical software used was Statistical Package for the Social Sciences (SPSS) 20.0.
GSE68015 and GSE94349 were obtained from the GEO database (Home - GEO - NCBI (nih.gov)). GSE68015 contains 15 ACP and 16 normal brain tissue samples. GSE94349 contains 9 ACP and 17 normal brain tissue samples. Using the “sva” R package, we merged the two datasets and normalized them. According to the threshold of | LogFC |>2 and P < 0.05, differential analysis was conducted on 24 ACP and 33 normal brain tissue samples. We obtained 2419 DEGs, including 1181 upregulated DEGs and 1238 downregulated DEGs. The heatmap and volcano plot of these DEGs are shown in Figures 1A, B. The intersection of DEGs and ferroptosis-related factors was shown by the Venn diagram. A total of 579 ferroptosis-related factors were obtained from the FerrDb V2 and GeneCard databases (Figure 1C). Venn diagram showed that a total of 69 DEFRGs were identified. Then, PPI network analysis was processed to show the regulated relationship of these DEFRGs (Figure 1D).
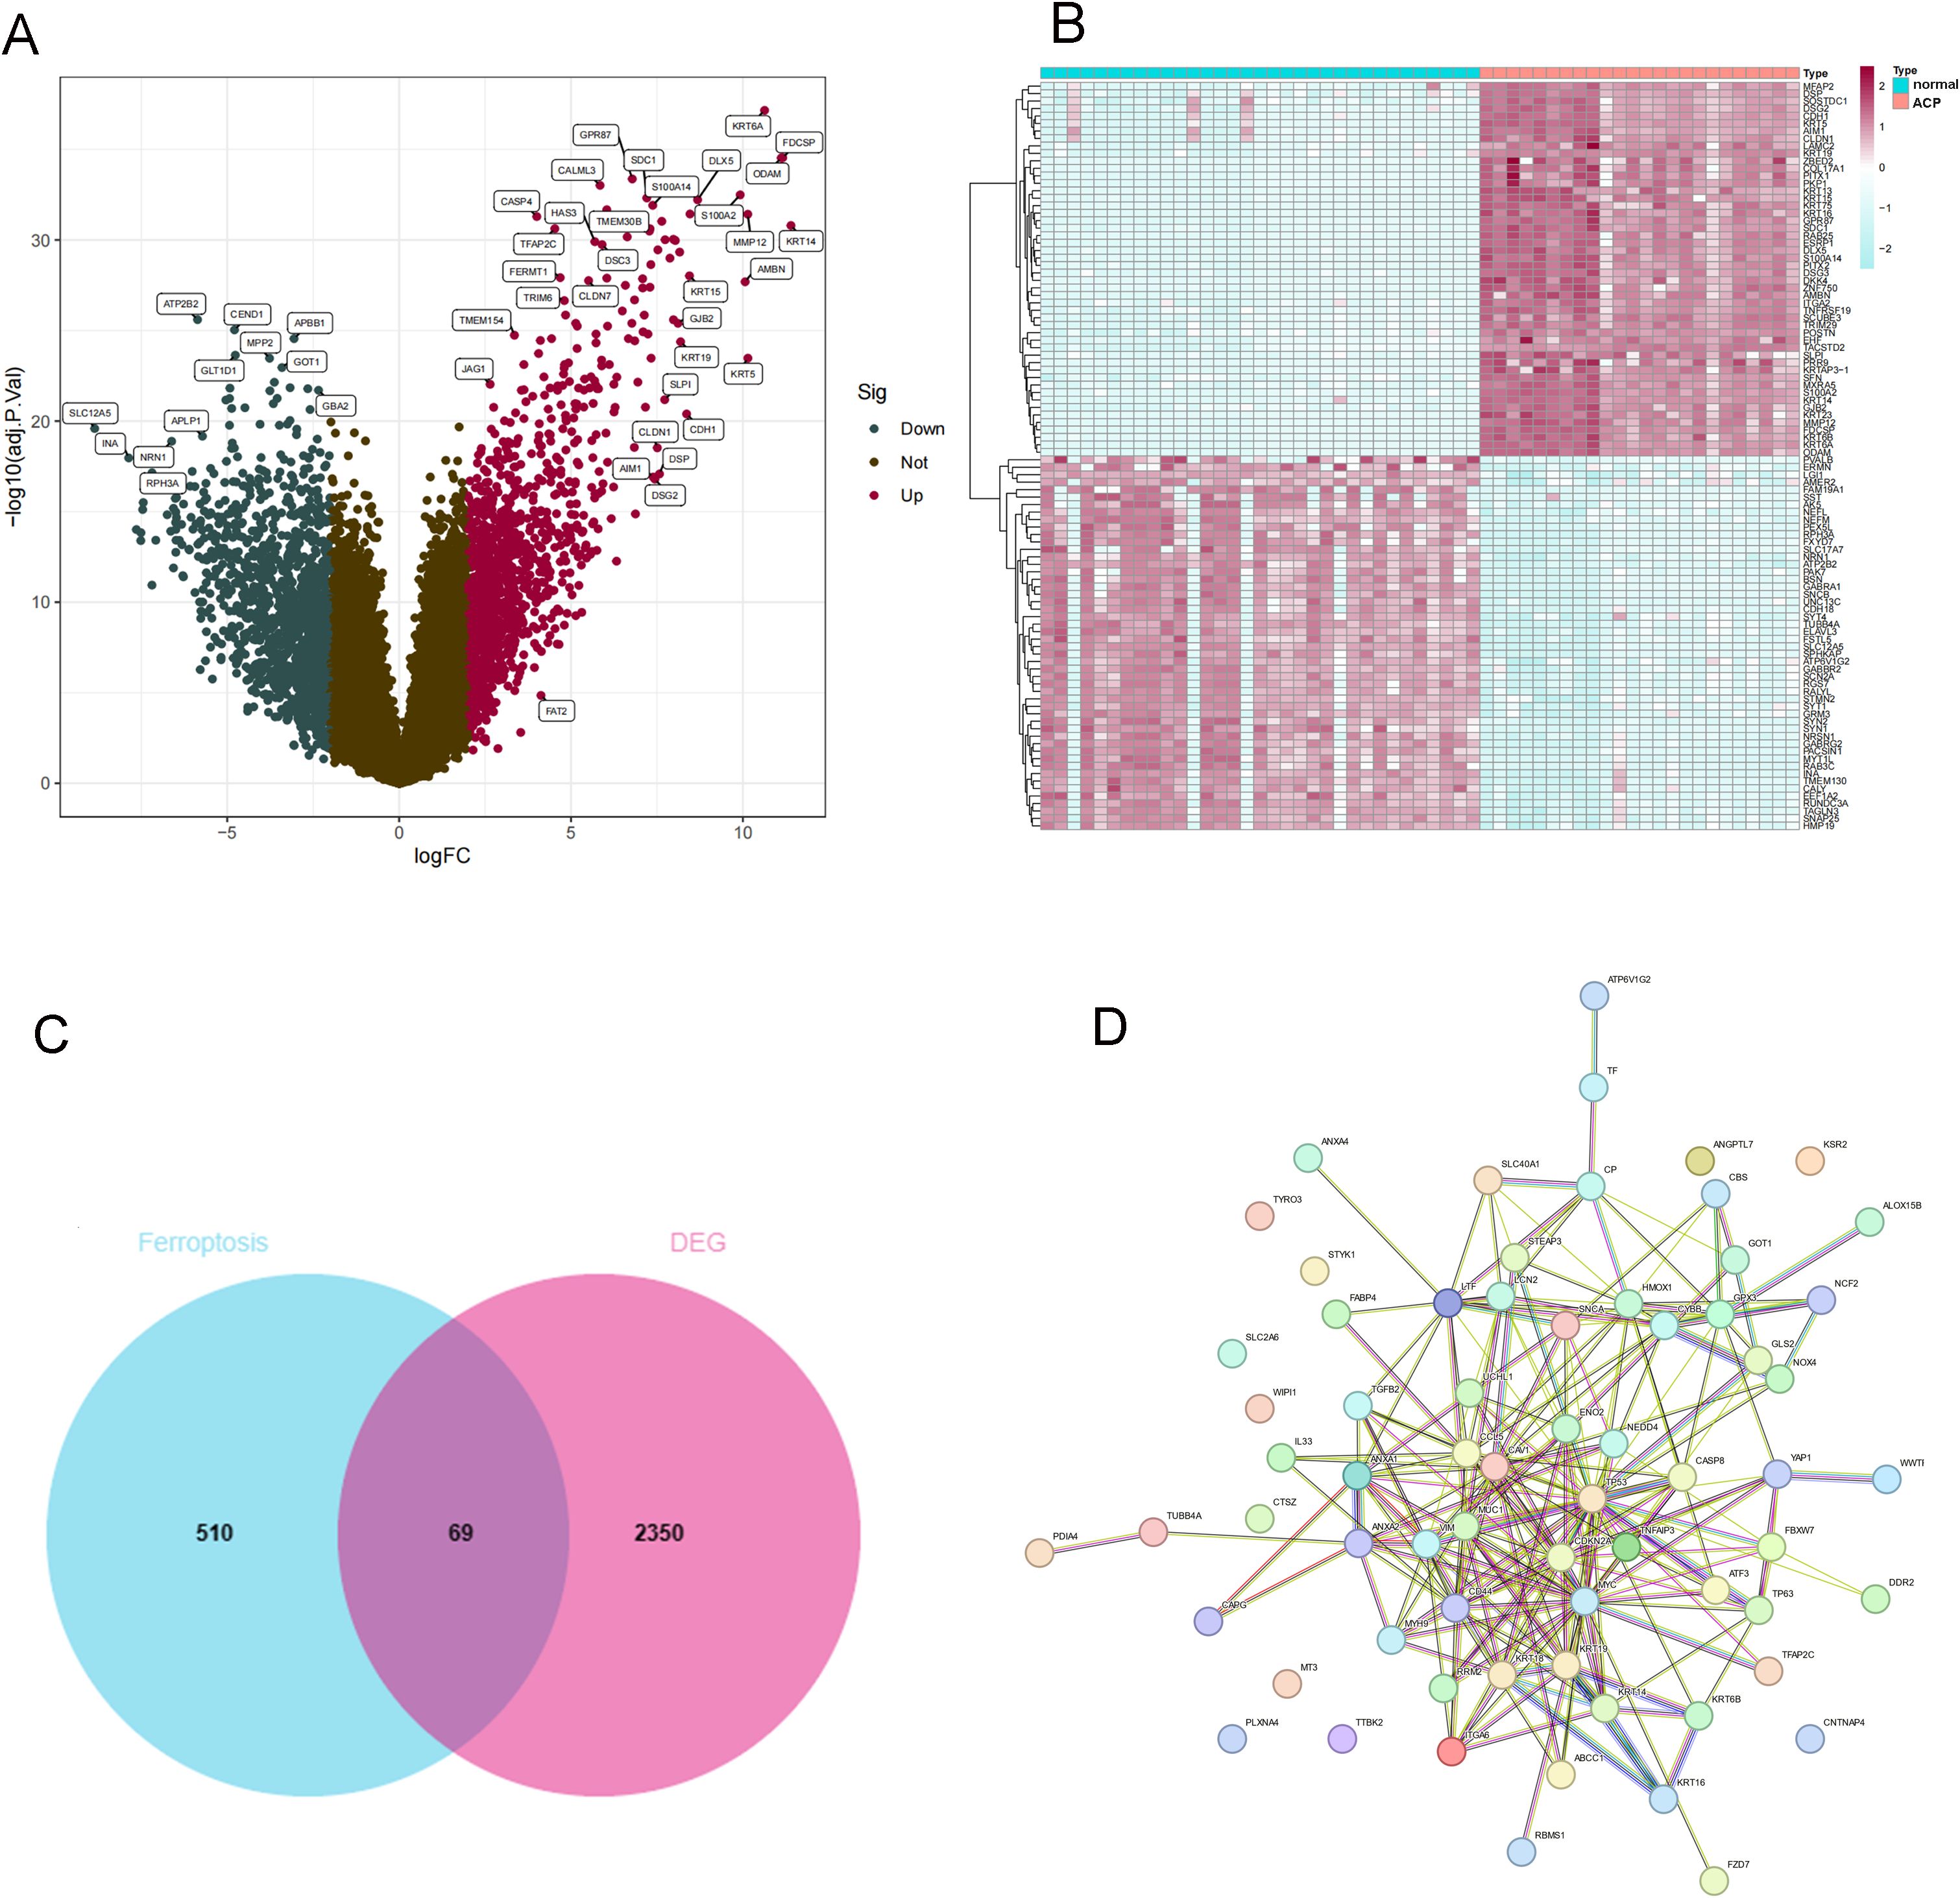
Figure 1. Identification of DEGs between ACP sample and controls. (A) Volcano plot analysis. (B) The heatmap of DEGs. (C) The Venn diagram for screening DEFRGs. (D) PPI Networks of DEFRGs. (C) Venn diagram for identification of DEFRGs. (D) PPI network analysis of DEFRGs.
According to the results of GO functional and KEGG pathway enrichment analysis, DEGs were enriched in various functions, such as synapse organization, synaptic membrane, neuronal cell body, and channel activity (Figures 2A, B). KEGG pathways enriched by DEGs included circadian entrainment, ECM-receptor interaction, GABAergic synapse, and glutamatergic synapse (Figures 2C, D). As shown in Figures 2E, F, these DEGs were enriched into many diseases, including pervasive developmental disorder, ovarian cancer, renal cell carcinoma, and cell-type benign neoplasm. Based on the results of the GSEA analysis, critical pathways were obtained. A total of 5 KEGG pathways were enriched, including calcium signaling pathway, cardiac muscle contraction, long-term depression, long-term potentiation, and neuroactive ligand-receptor interaction. Besides, there were 5 KEGG pathways obtained in the disease, including complement and coagulation cascades, cytokine receptor interaction, ECM receptor interaction, hemopoietic cell uncage, and pathways in cancer (Figure 2G). Then, GSVA analysis was processed for up- and down-regulated DEFRGs. The up-regulated DEGs were enriched in various pathways, such as glycine serine and threonine metabolism, alanine aspartate and glutamate metabolism, histidine metabolism, and tight junction. While down-regulated DEGs were involved in different KEGG pathways, including aminoacyl trna biosynthesis, spliceosome, and riboflavin metabolism (Figure 2H).
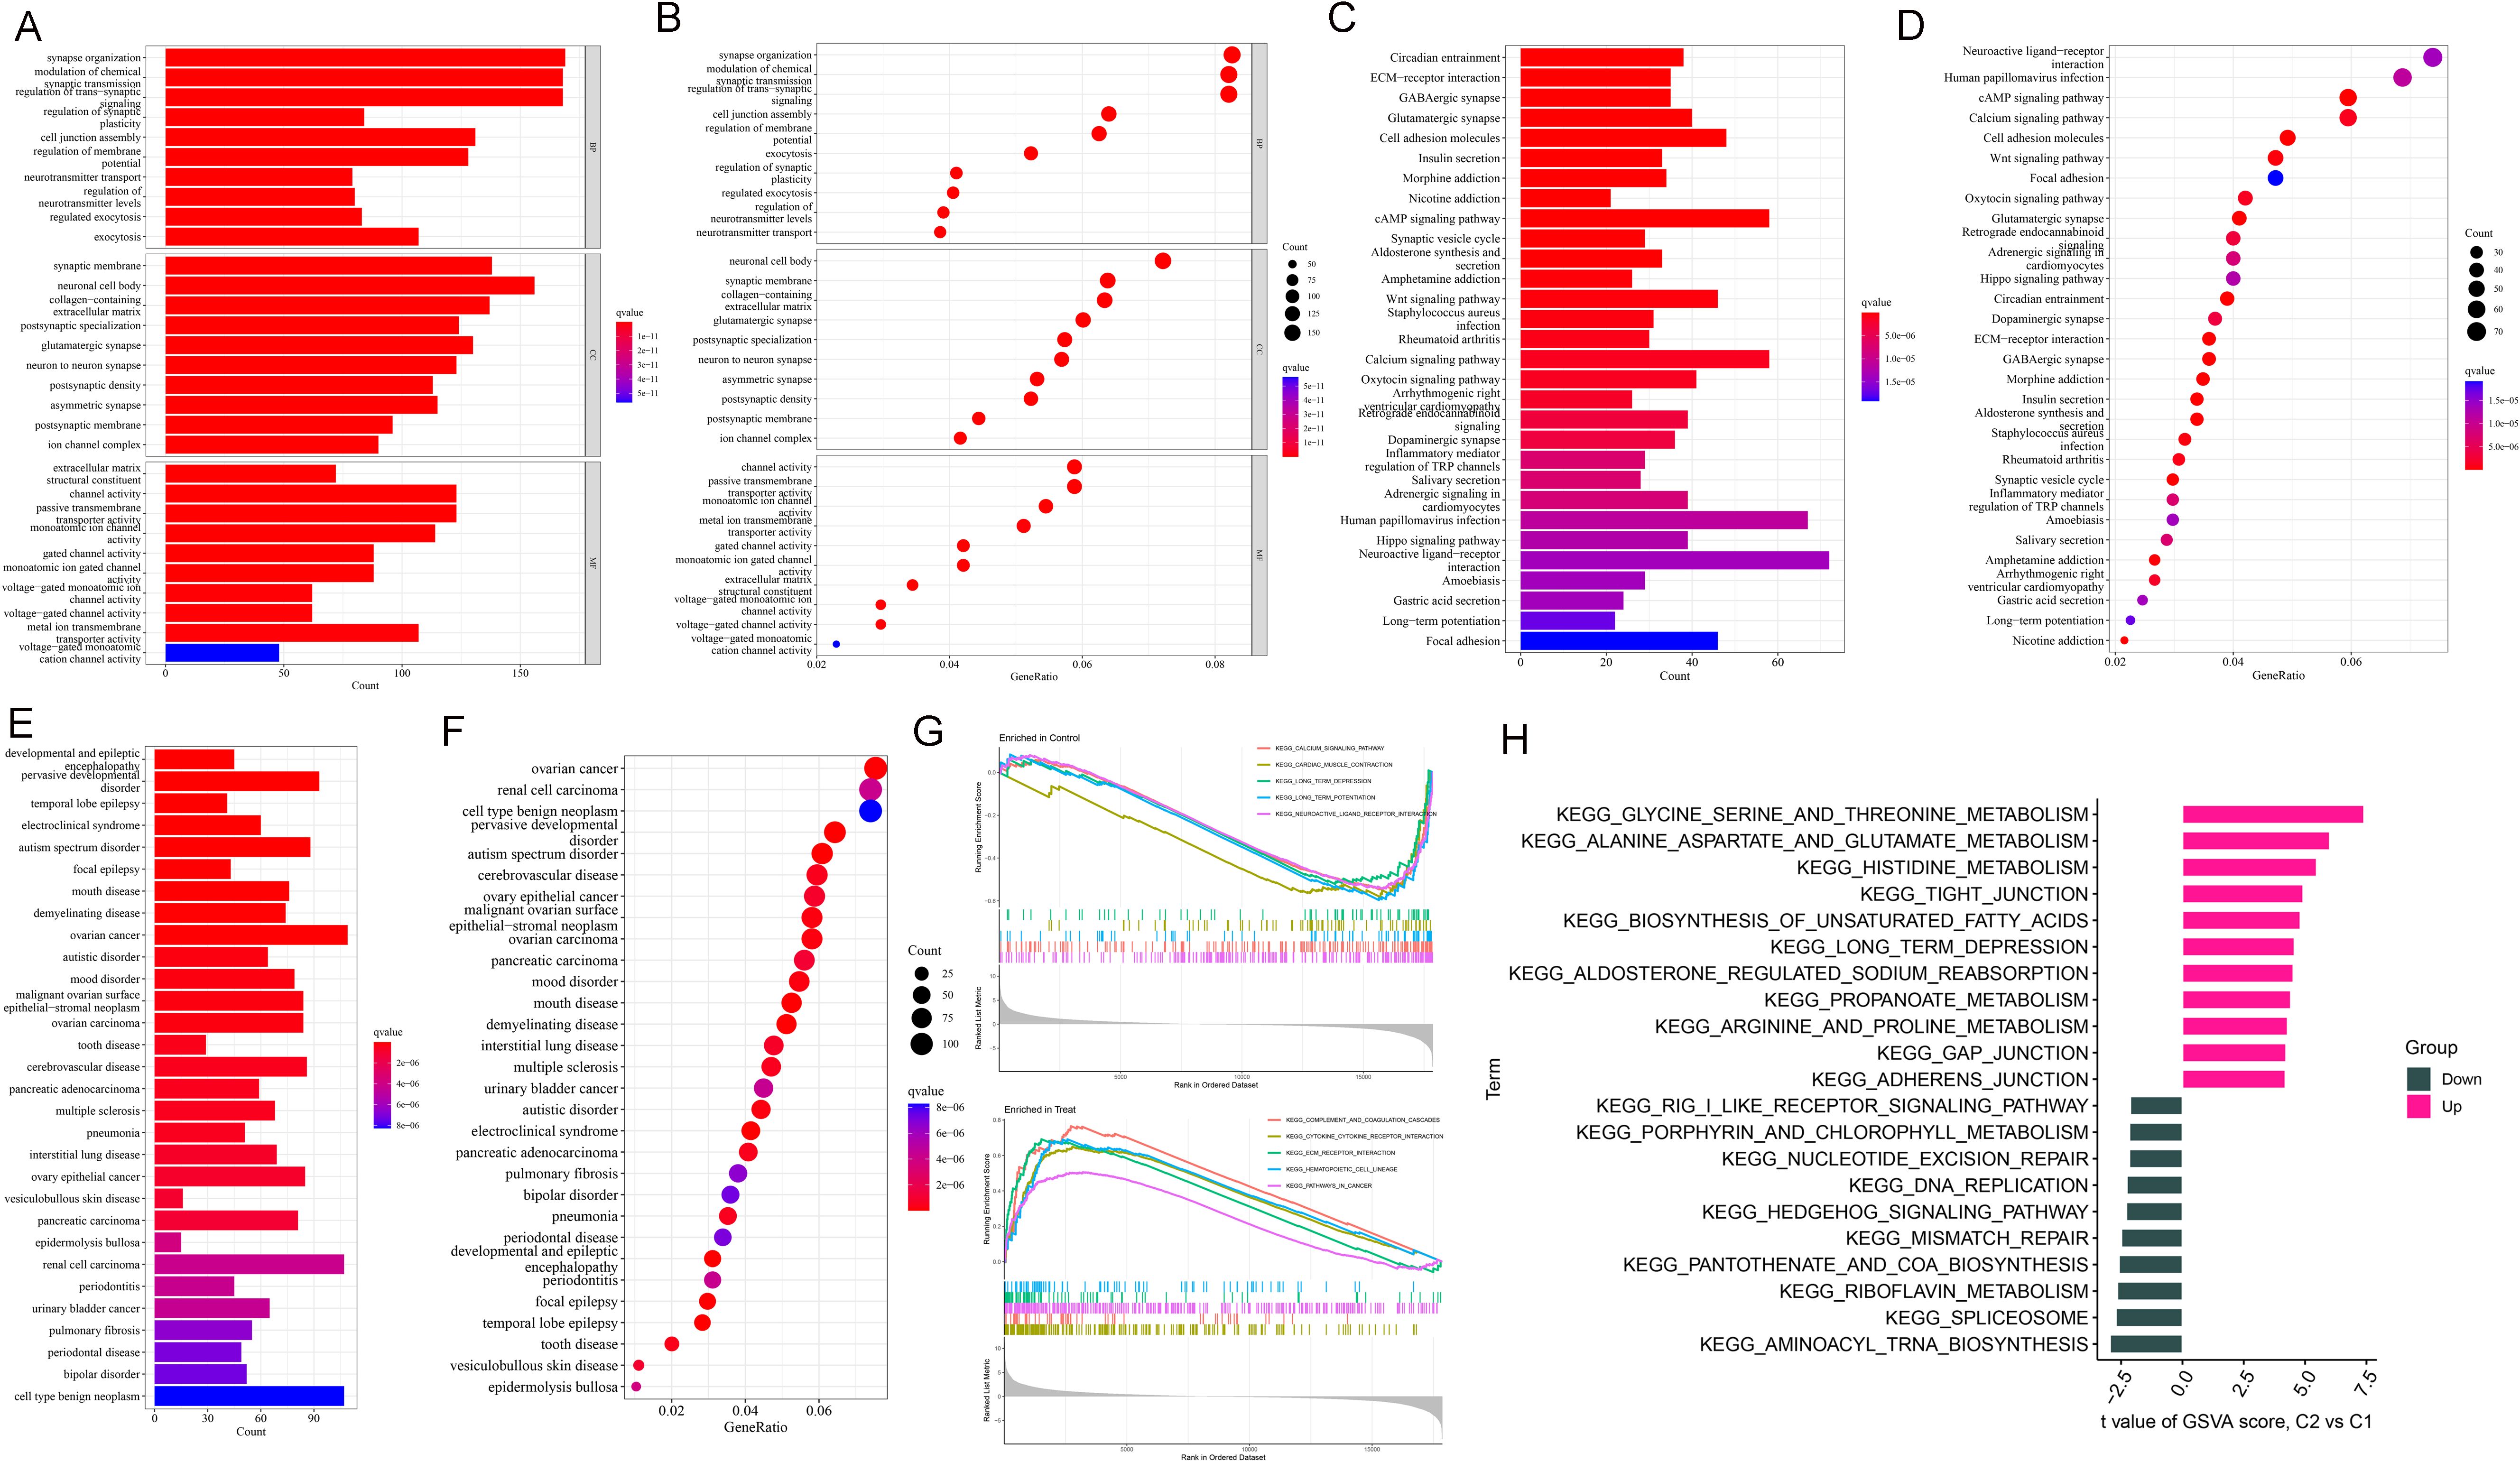
Figure 2. Enrichment analysis of DEGs. (A, B) GO analysis. (C, D) KEGG analysis. (E, F) DO analysis. (G) GSEA snapshots of KEGG pathway enrichment analysis. (H) GSVA analysis for up- and down-regulated DEGs.
SVM-RFE and LASSO algorithms were used for the identification of variable DEFRGs with higher discriminative power. As the results are shown in Figures 3A, B, a total of 11 and 10 features were obtained by SVM-RFE and LASSO algorithms, respectively. There were 6 overlapped DEFRGs were obtained, including CASP8, GOT1, KRT16, KRT19, TFAP2C, and TP63 (Figure 3C). The ROC curves of the six diagnostic markers are shown in Figure 3D. Their AUC values showed the accuracy of the machine learning algorithm. These Overlapped DEFRGs were located on chromosomes 2, 3, 10, 17 and 20 (Figure 3E). The correlation between 6 DEFRGs was calculated. GOT1 was negatively correlated with other DEFRGs, while KRT16, KRT19, and TFAP2C were with positive regulate relationships (Figure 3F).
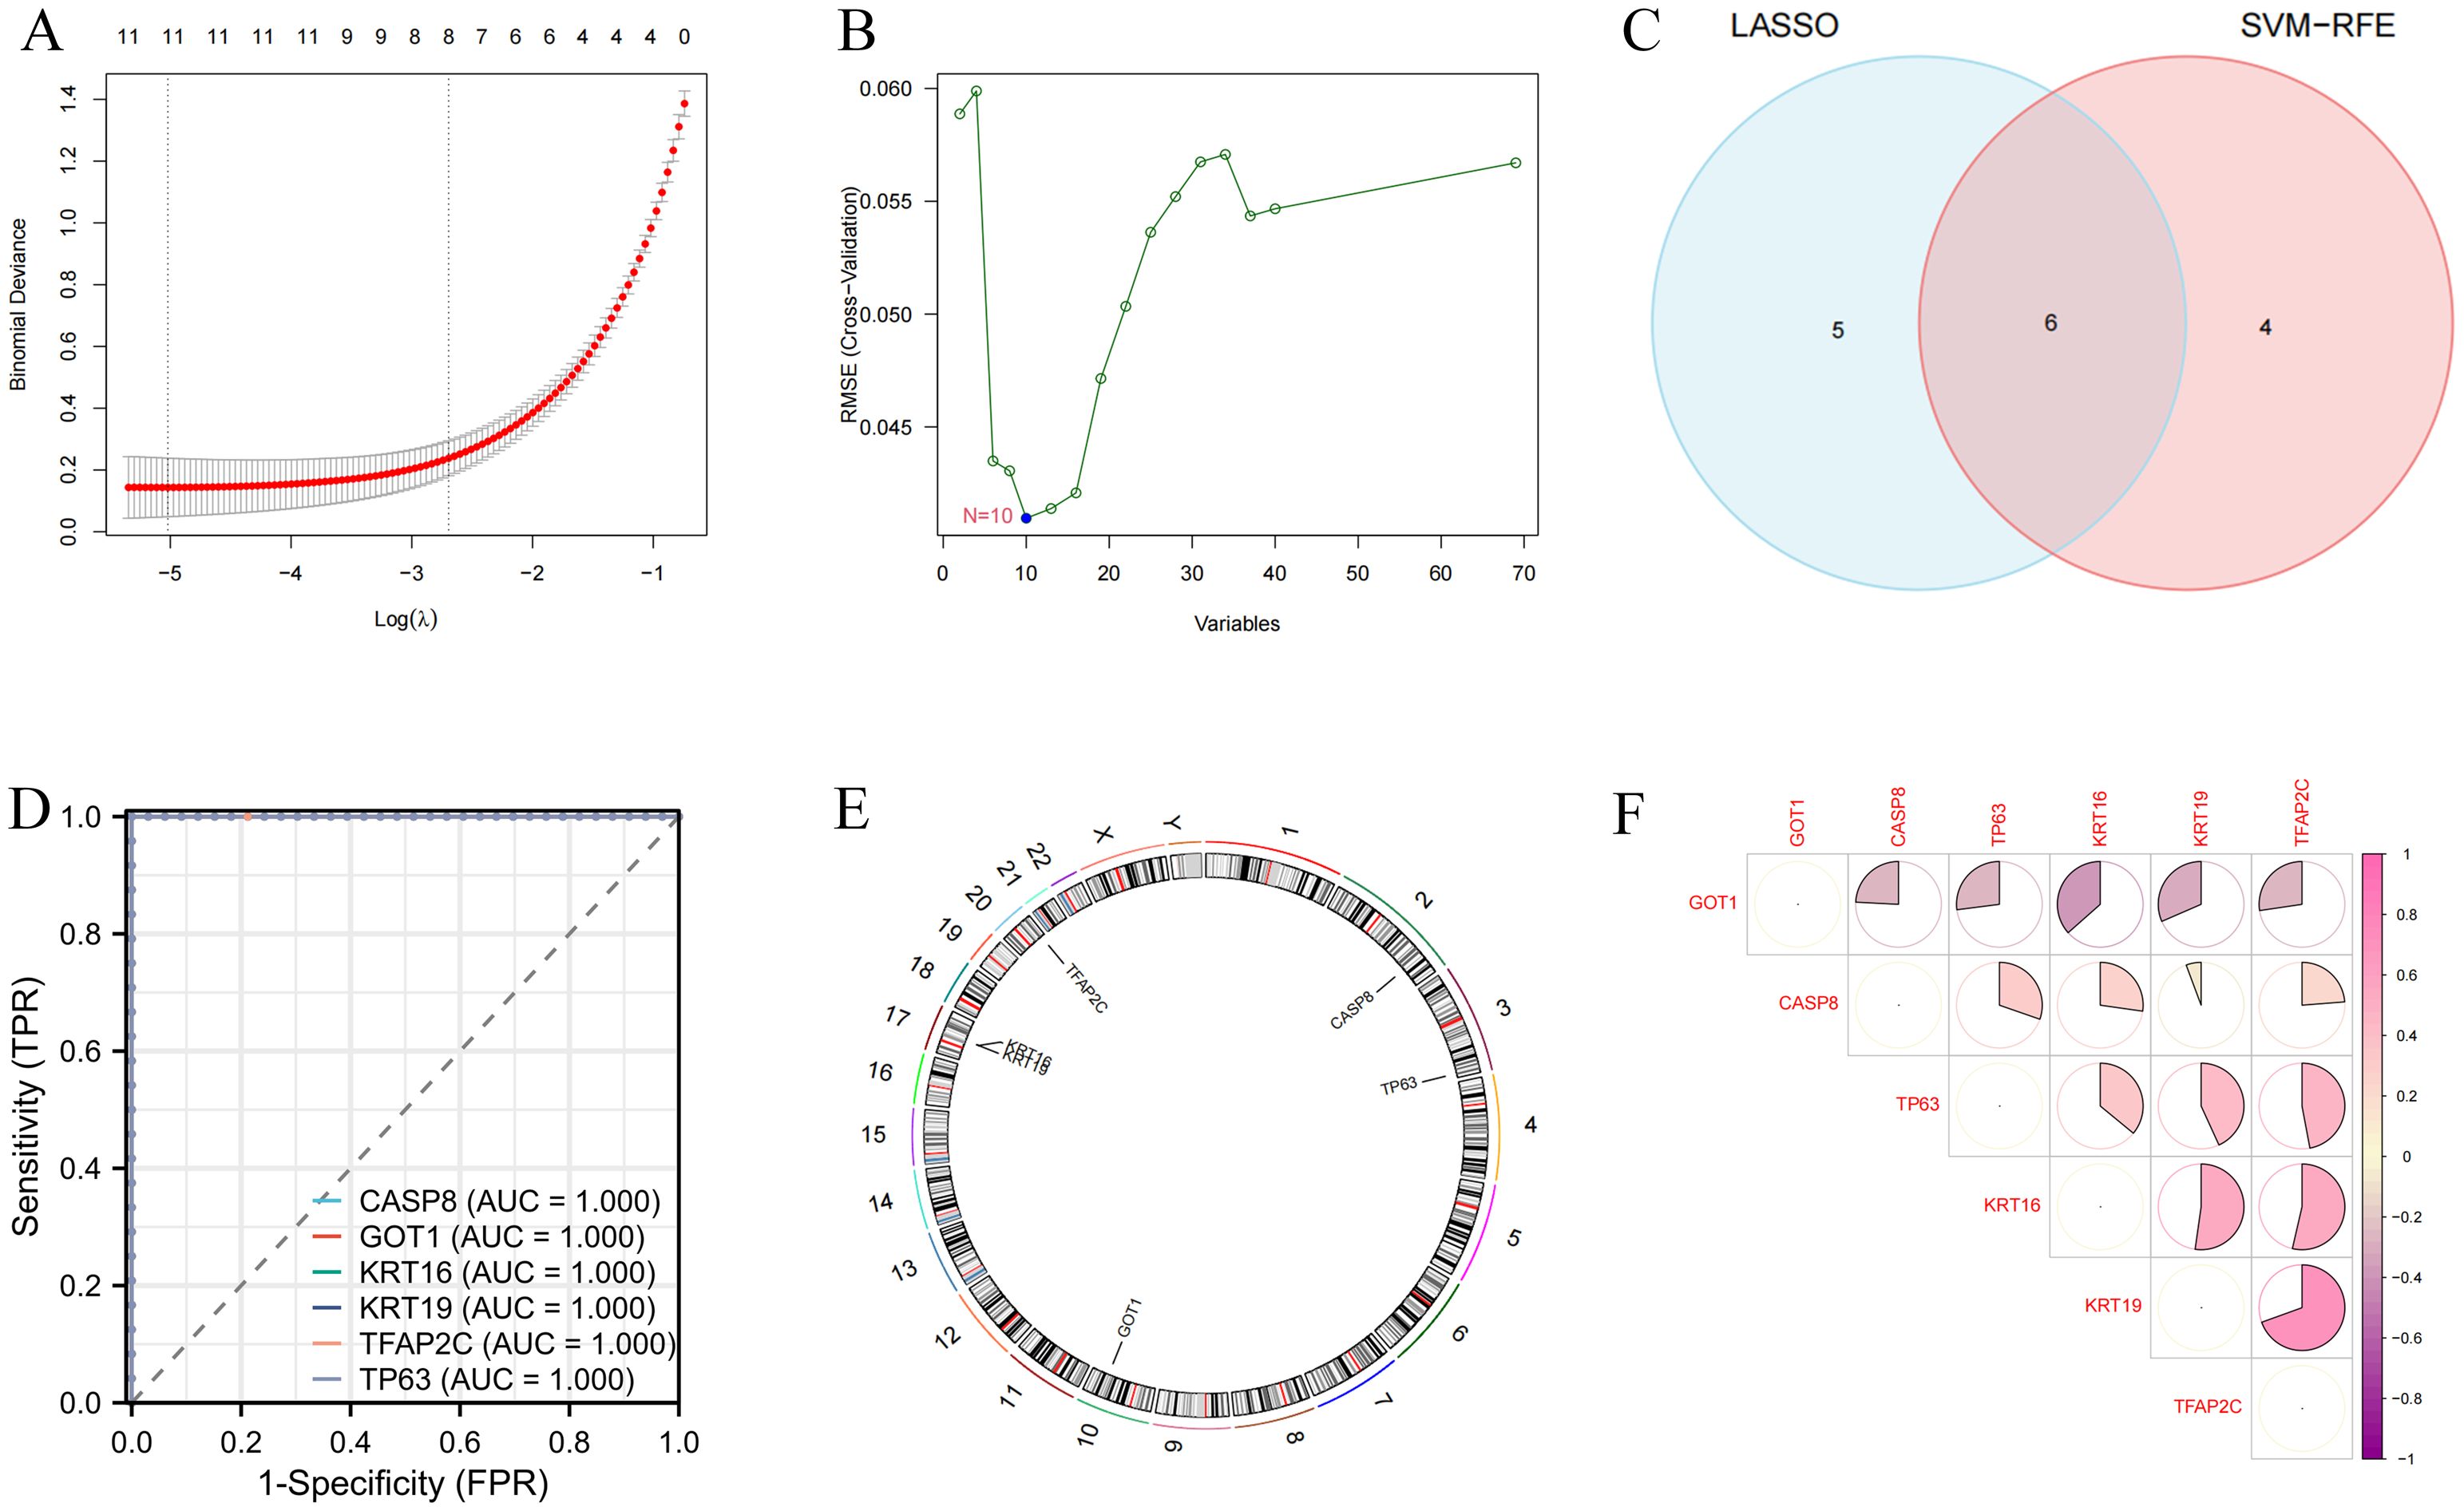
Figure 3. Identification of variable DEFRGs by machine learning techniques. (A) Lasso regression analysis. (B) SVM analysis. (C) Overlapped DEFRGs. (D) The ROC curves of the six diagnostic markers. (E) Location of diagnostic markers in human chromosomes. (F) Correlation of six diagnostic markers. The shades of color had a positive relationship with correlation.
These 6 key DEFRGs were differentially expressed in the normal and ACP disease groups based on GSE68015 and GSE94349 profiles. Figures 4A–F showed that all five markers, including CASP8, KRT16, KRT19, TFAP2C, and TP63, were upregulated in the disease group, while GOT1 was downregulated in the ACP group.
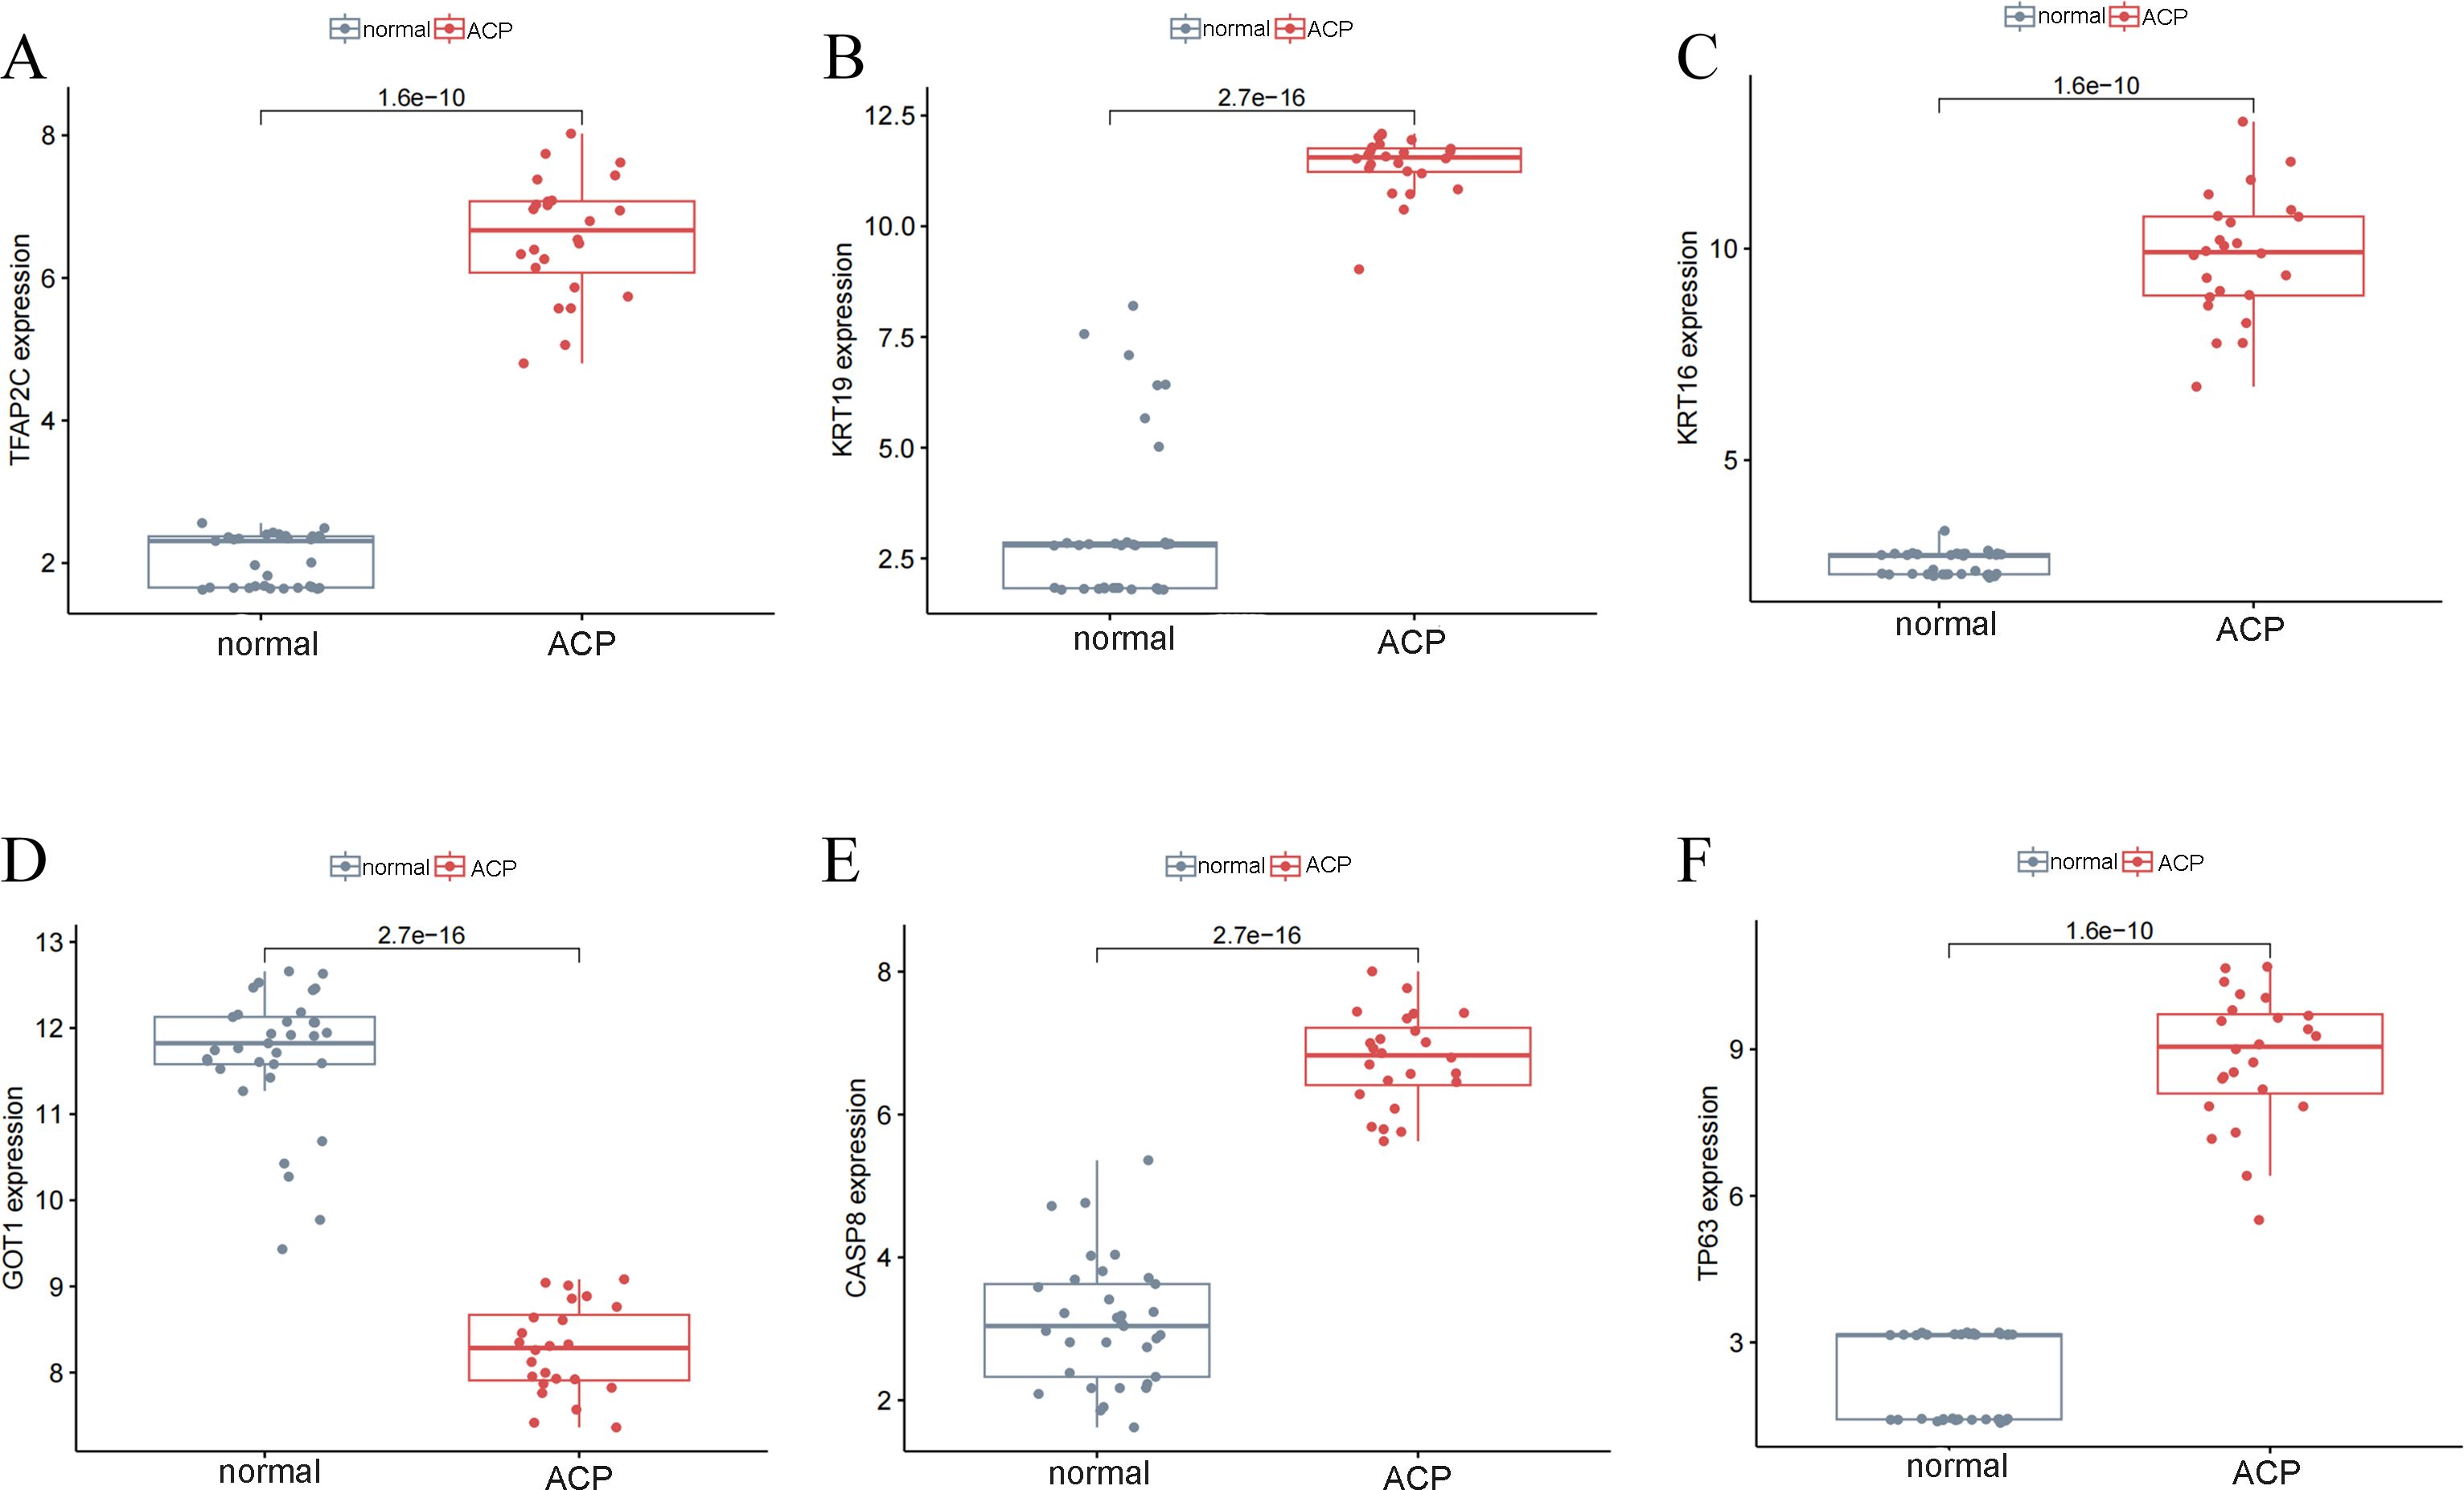
Figure 4. The expression levels of key DERGs in ACP patients based on GSE68015 and GSE94349 profiles. (A–F) The levels of CASP8, KRT16, KRT19, TFAP2C, GOT1 and TP63.
In ACP, total key DEFRGs as diagnostic markers were screened by machine learning. The risk profile of the disease was predicted by the expression levels of these six regulators. Based on the results of the nomogram, CASP8, KRT16, KRT19, and TP63 were the protective factors of the disease, while GOT1 and TFAP2C were the risk factors (Figure 5). Except for TFAP2C, the other 5 DEFGRs were composite clinical expression features. CASP8, KRT16, KRT19, TP63, and GOT1 were potential biomarkers for ACP disease.
The samples in the dataset were clustered according to the screened DEFRGs. When the k value was set to 2, the consensus clustering matrix was the most differentiated, the number of clusters was the most stable, and the consistency scores across subtypes were the highest. The samples could be categorized into 2 isoforms and heat mapped, which showed that C2 expressed higher (Figures 6A–E).
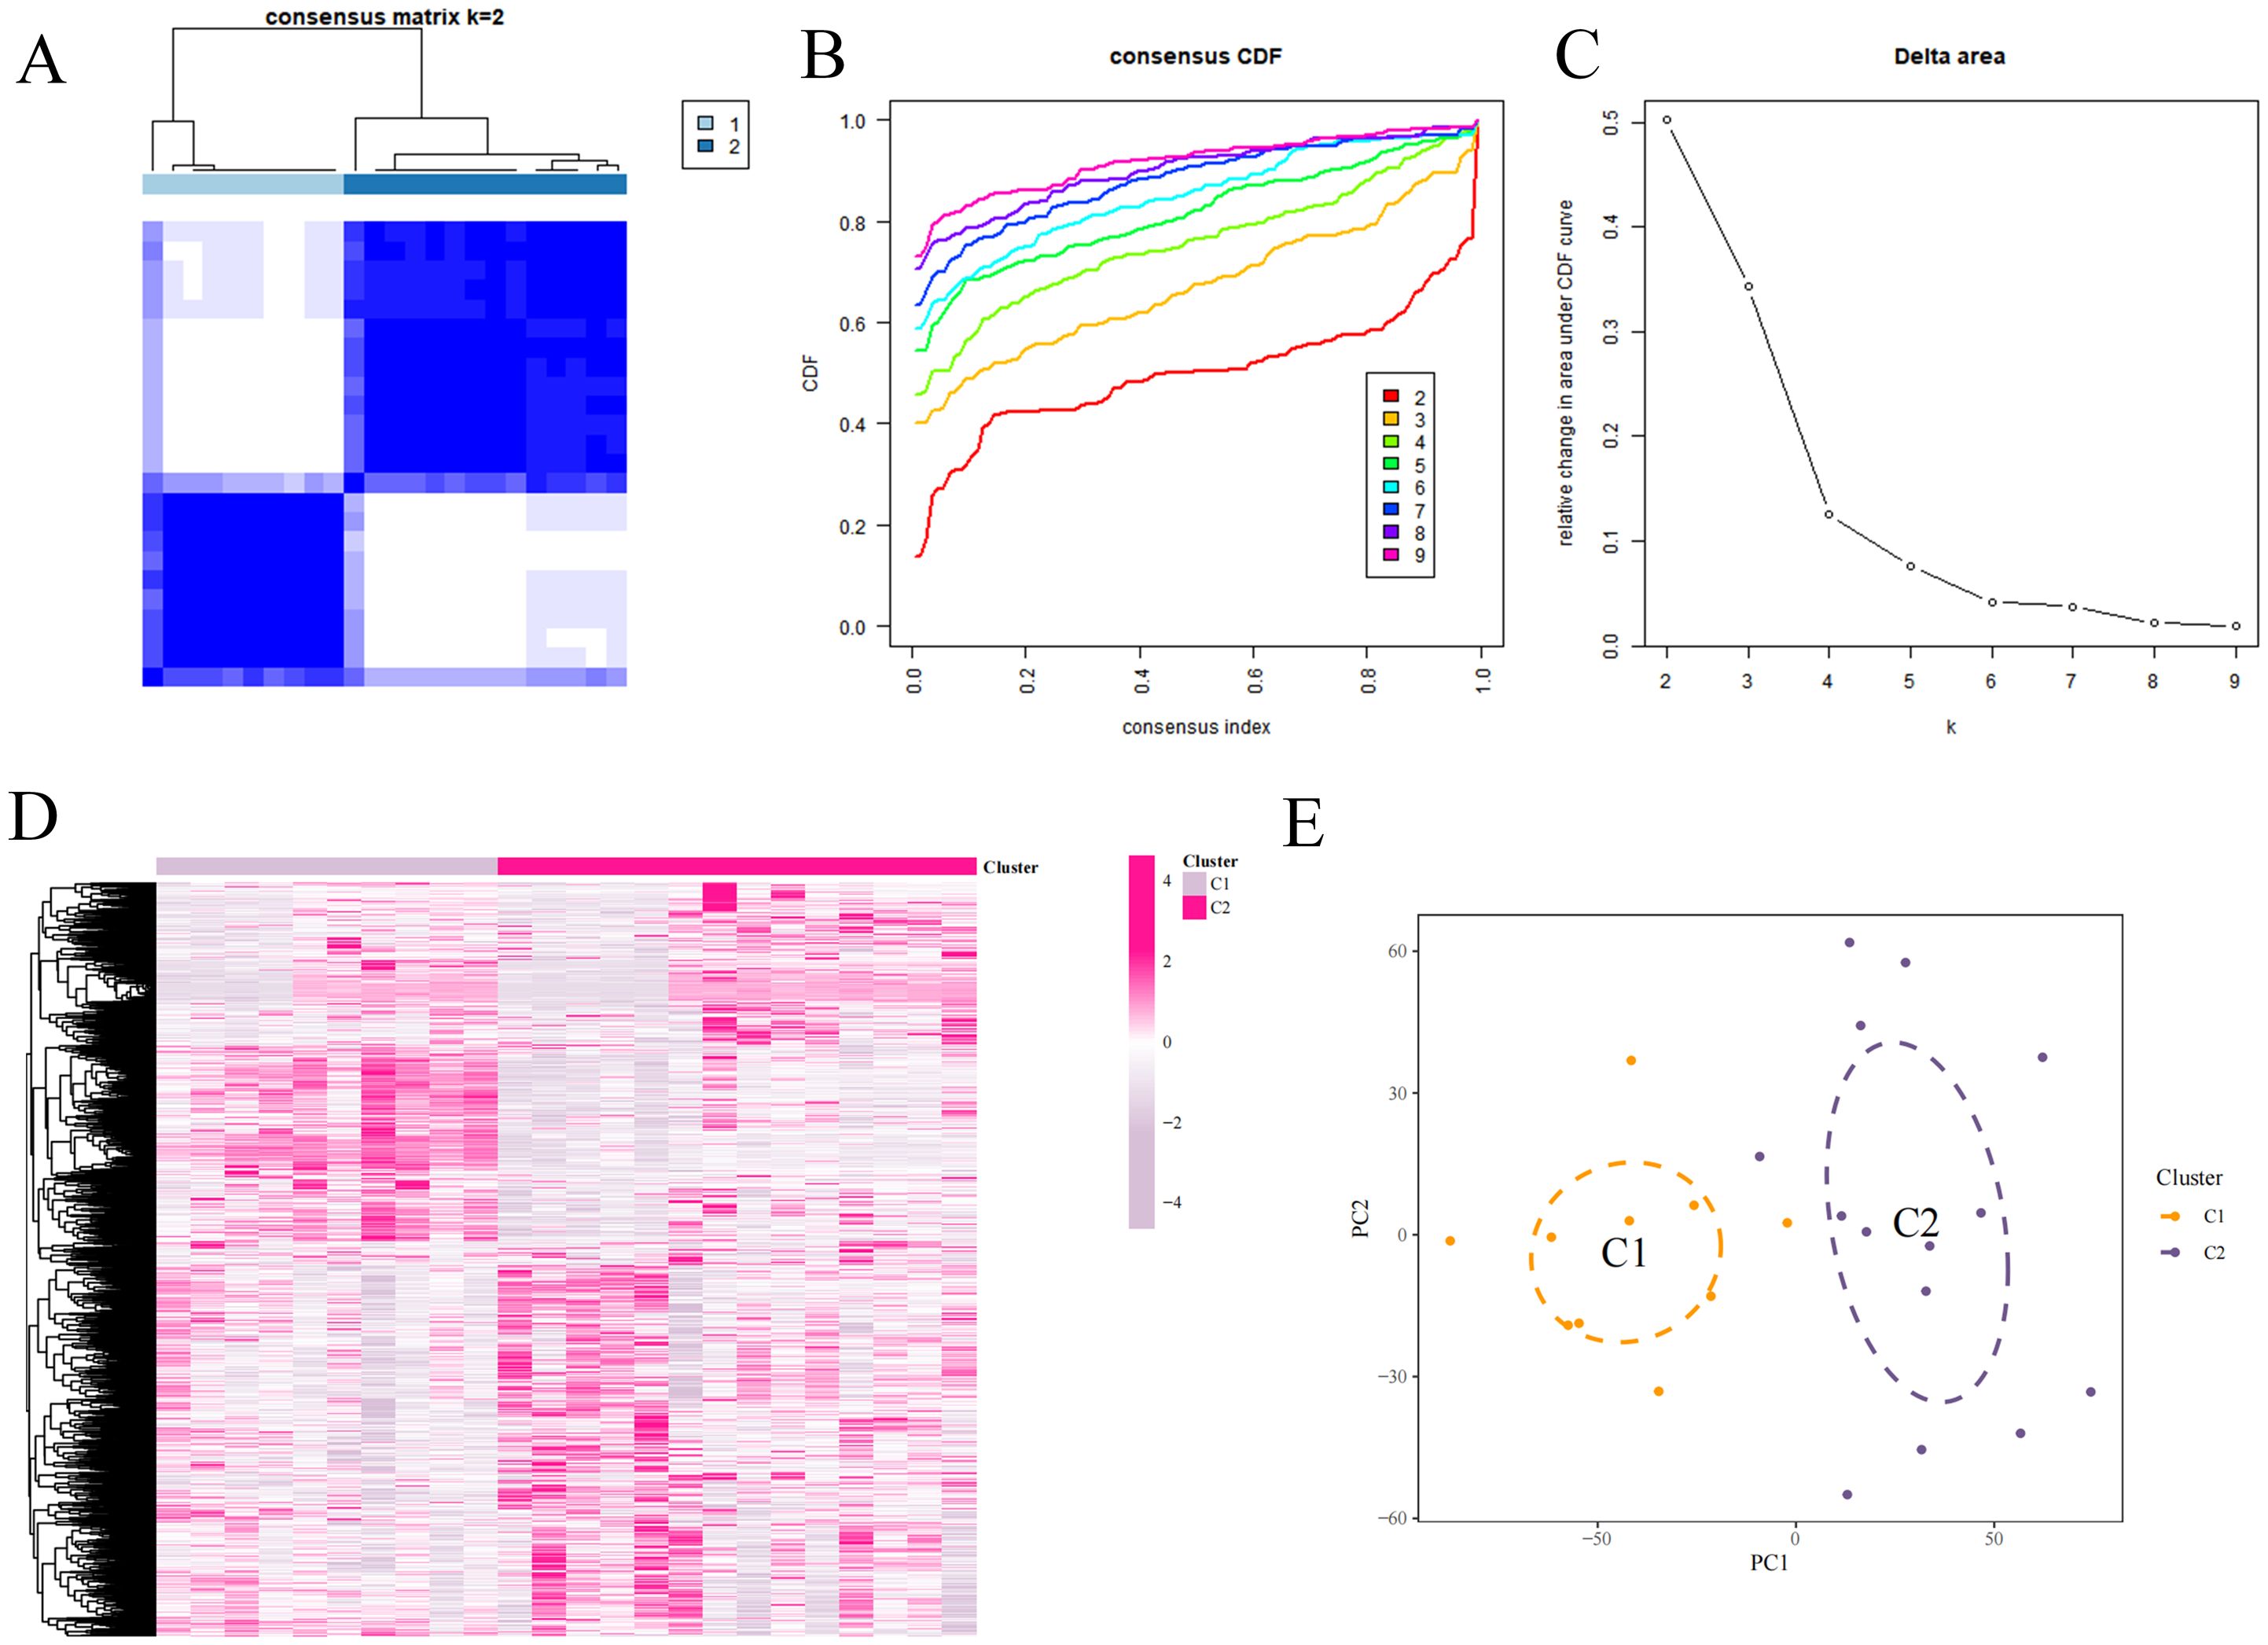
Figure 6. Consensus clustering analysis. (A) Consensus matrix. (B) Cumulative distribution function of consistency. (C) Delta Area Plot. (D) Mixture coefficients. (E) Cluster analysis.
A total of 5 key DEFRGs were differentially expressed in the normal and ACP disease groups. The results of Figures 7A–F showed that CASP8, KRT16, KRT19, and TP63, were upregulated in the disease group, while GOT1 was downregulated in the ACP group. However, TFAP2C was with no significant difference. CASP8, KRT16, KRT19, TP63, and GOT1 might be the biomarker for ACP diagnosis.
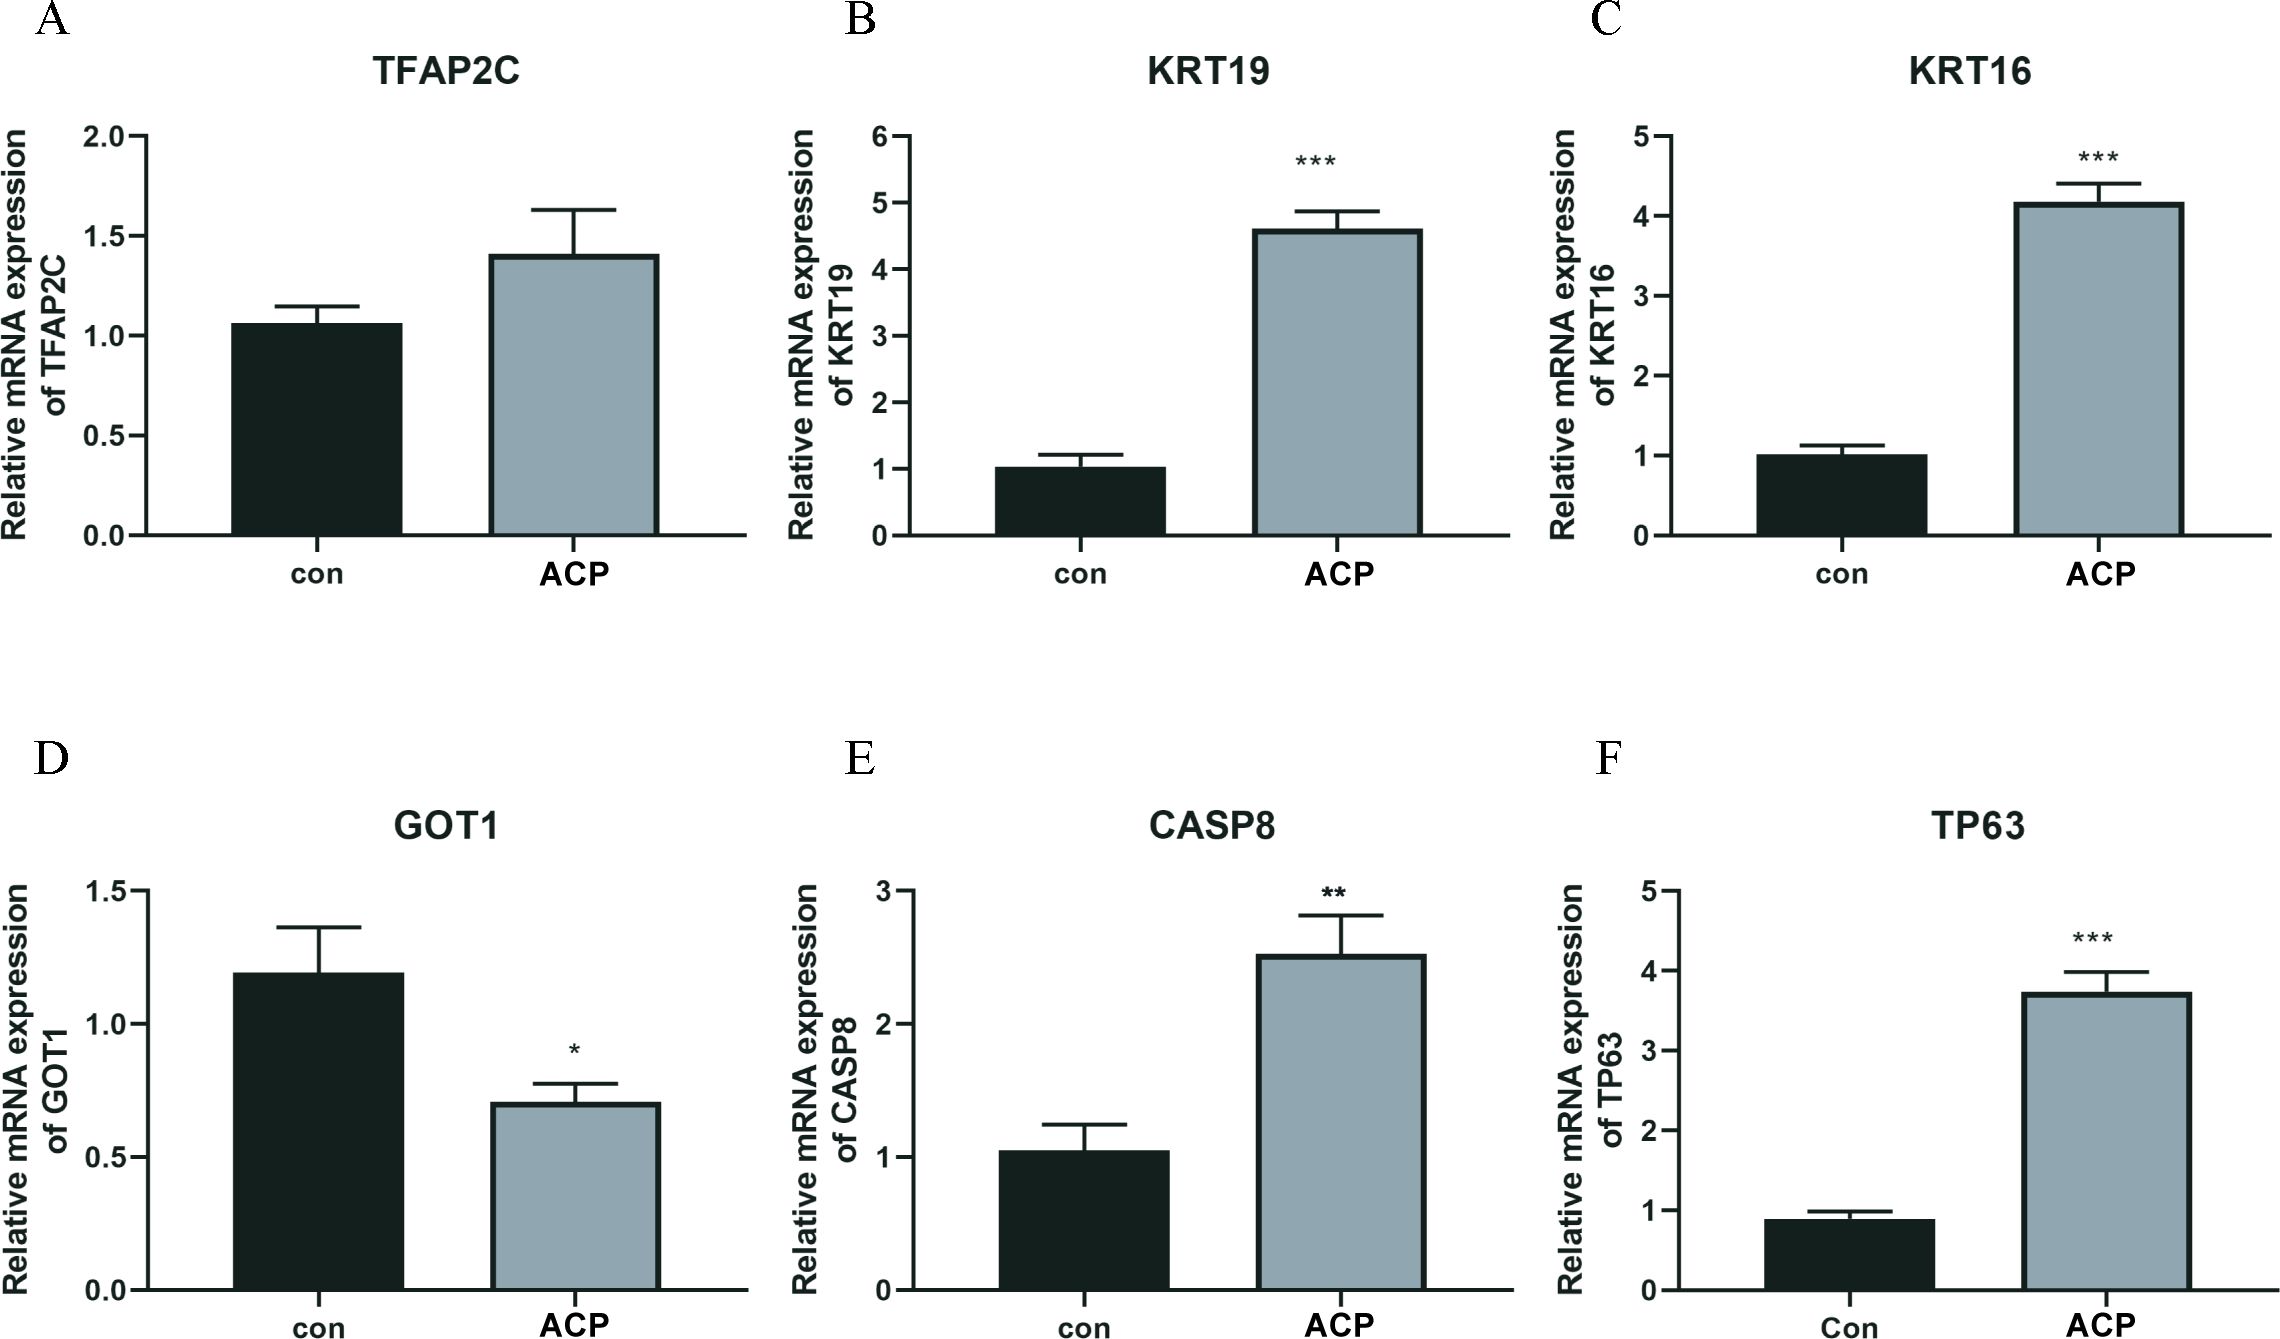
Figure 7. The expression levels of key DERGs in ACP patients (A–F). The expression levels of TFAP2C, KRT19, KRT16, GOT1, CASP8, and TP63 in ACP patients detected by q-PCR. *P < 0.05, **P < 0.01, ***P < 0.001.
The correlation of the six key DEGs with nine ferroptosis marker genes is shown in Figure 8A. GPX4, HSPB1, NFE2L2, SLC40A1, CHAC1, and HSPB1 were significantly related to key DEGs. Elisa assay was used for detecting the expression levels of 6 ferroptosis marker genes. CHAC1 and GPX4 expressed lower in ACP disease group than control, while HSPB1, NFE2L2, SLC40A1, and HSPB1 were up-regulated in the disease group (Figure 8B). A combination of CASP8, KRT16, KRT19, TP63, and CASP8, GOT1 might be the biomarker for ACP diagnosis via participating ferroptosis process.
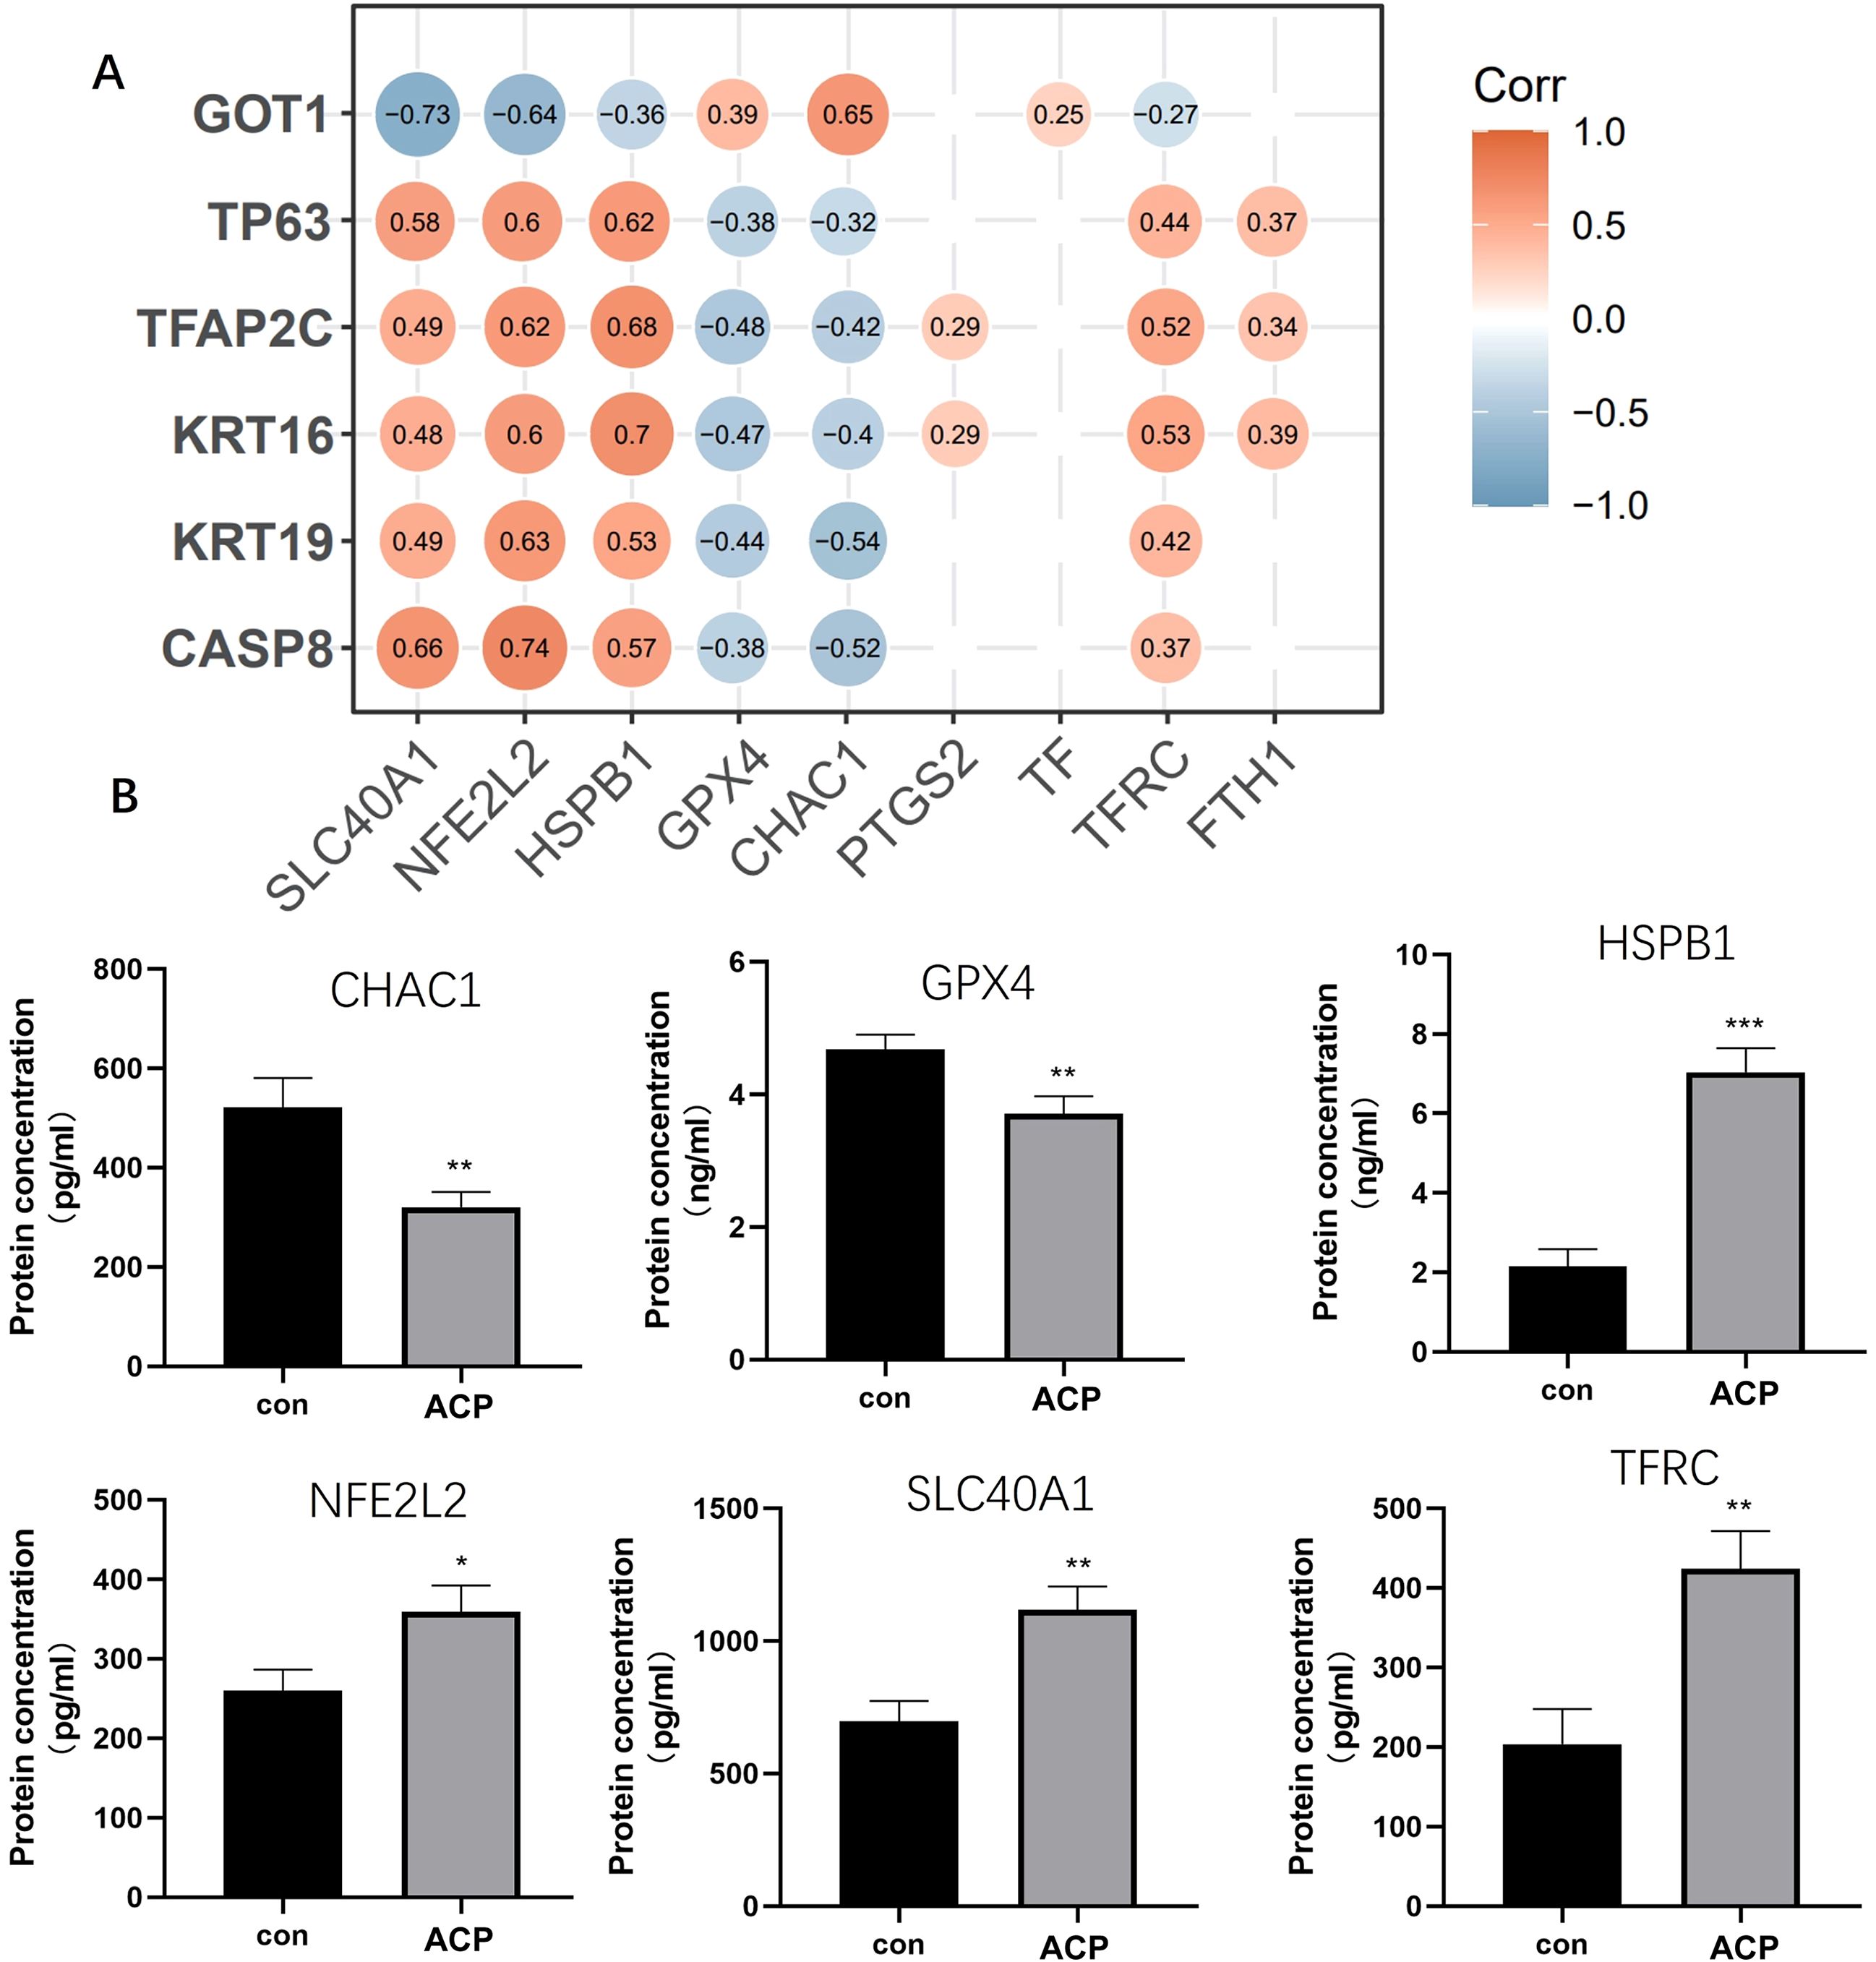
Figure 8. Screened key DEGs were significantly related to ferroptosis. (A) The correlation of the six key DEGs with nine ferroptosis marker genes. (B) ELISA assay was used for detecting the expression of 6 ferroptosis marker genes. CHAC1 and GPX4 expressed lower in the disease group than control, while HSPB1, NFE2L2, SLC40A1, and HSPB1 were up-regulated in the disease group. *P < 0.05, **P < 0.01, ***P < 0.001.
Conventional treatment leads to poor complications and adverse reactions in craniopharyngioma development (26). Bioinformatics is applied to craniopharyngioma many times to screen for possible biomarkers, such as immune-related genes (27, 28). Ferroptosis, a mechanism closely associated with the development of various cancers (29–31), has not been studied in ACP. In this study, candidate biomarkers of ferroptosis and ACP were selected by functional enrichment analysis. Then, selecting node genes from the constructed PPI network, and screening candidate biomarkers with three machine learning algorithms were processed. The expression levels of candidate genes were compared, and ROC curves and nomograms were constructed to screen biomarkers with higher accuracy.
In this study, we explored potential therapeutic targets and molecular mechanisms related to ferroptosis in ACP. GSE68015 and GSE94349 databases were downloaded to analyze the DEGs between the ACP sample and normal. Then, ferroptosis-related genes and DEGs were overlapped, and 69 DEFRGs were screened. Based on the result of the PPI network, hub nodes were obtained, such as TP-53, CDKN2A, myc, and MJC1. GO and KEGG enrichment analysis showed that these genes enriched in various functions and pathways, such as ion channel activity, cell junction assembly, ECM-receptor interaction, and calcium signaling pathway. Ferroptosis is the result of a dysfunctional balance between intracellular lipid reactive oxygen production and degradation (32). Ferroptosis is induced by a variety of compounds, and the upstream pathway affects the activity of glutathione peroxidase (GPXs) (33). It decreased cellular antioxidant capacity, leading to an increase in lipid peroxidation and an increase in lipid reactive oxygen species, causing the onset of ferroptosis (34). As reported in a previous study, cell detachment from the extracellular matrix (ECM) is a stress response to ferroptosis (35). Ferroptosis-related functions and pathways correspond to ACP development.
Based on the machine learning algorithm and in vitro experiment, a total of 6 diagnostic markers, including CASP8, KRT16, KRT19, TP63, and GOT1 were screened. The ROC curves of the six diagnostic markers were calculated, and the AUC value of all biomarkers was 1, indicating the accuracy of machine learning algorithms. CASP8 is a critical enzyme in the apoptotic pathway (36). Polymorphisms in CASP8 have been associated with the risk of developing a variety of diseases, including gastrointestinal, digestive, colorectal, breast, and lung cancers (37, 38). In ACP patients, CASP8 was up-regulated, and the result was consistent with this study. KRT16 and KRT19 belonged to the keratin family. Keratin is an important component of the epithelial cytoskeleton, with the primary function of maintaining the stability of epithelial cells and tissues (39). They are involved in intracellular signaling pathways (40). In this study, KRT family members were involved in the estrogen signaling pathway. Sex hormone signaling inhibited ferroptosis in cancer cells through MBOAT21/2 mediated PL remodeling (41). TP63 has been confirmed to be up-regulated in ACP (42). Cao et al. (43) referred that 89% of ACP patients were with high levels of TP63. Similar results were obtained in this study. GOT1 was down-regulated in ACP patients. GOT1 accelerated ferritinophagy, and mediated SHK-induced ferroptosis (44). In various diseases, GOT1 inhibits cancer development by ferroptosis (44–46). GOT1 participated in ferroptosis and inhibited pancreatic cancer cell death (45). GOT1-related pathway was associated with abnormal ferroptosis in preeclampsia (47). Based on the results of nomogram in this study, CASP8, KRT16, KRT19 and TP63 were the protective factor of the risk of disease, while GOT1 was the risk factors. CASP8, KRT16, KRT19 and TP63 might be potential markers for ACP diagnose and treatment. CASP8, KRT16, KRT19, TP63, CASP8 and GOT1 affect multiple ferroptosis marker genes in this study. Combination of CASP8, KRT16, KRT19, TP63 and CASP8, GOT1 might be the biomarker for ACP diagnosis via participating ferroptosis process.
The ferroptosis and potential biomarkers (CASP8, KRT16, KRT19, and TP63) were critical for ACP diagnosis. Because ACP is a rare disease, there are few available samples and online data. In further study, we will focus on in vivo and in vitro experiments. By regulating the expression levels of these genes and ferroptosis-related genes, the influence and corresponding mechanism will be researched in ACP cells and tissues. The relationship between ferroptosis and papillary craniopharyngioma will be researched in the future.
In conclusion, 69 DEFRGs were narrowed down to 5 targets with high biomarker potential through multiple rounds of assays and statistical evaluations by machine learning methods. CASP8, KRT16, KRT19, TP63, and GOT1 were the potential markers for ACP treatment. Ferroptosis was confirmed to be a critical biological process in ACP development. The targets predicted by the machine learning approach are used in the medical diagnosis of ACP, which helps to make more accurate predictions and treatments for patients.
The datasets presented in this study can be found in online repositories. The names of the repository/repositories and accession number(s) can be found in the article/supplementary material.
The studies involving humans were approved by the 7th Affiliated Hospital of Sun Yat-sen University. The studies were conducted in accordance with the local legislation and institutional requirements. The participants provided their written informed consent to participate in this study.
YF: Conceptualization, Writing – original draft, Writing – review & editing. ZZ: Data curation, Writing – review & editing. JT: Data curation, Writing – review & editing. YC: Data curation, Writing – review & editing. DH: Formal Analysis, Writing – review & editing. XH: Formal Analysis, Writing – review & editing. FL: Conceptualization, Formal Analysis, Writing – review & editing.
The author(s) declare that financial support was received for the research, authorship, and/or publication of this article. This work was supported by the Shenzhen Science and Technology Program (JCYJ20180307151218817).
The authors declare that the research was conducted in the absence of any commercial or financial relationships that could be construed as a potential conflict of interest.
All claims expressed in this article are solely those of the authors and do not necessarily represent those of their affiliated organizations, or those of the publisher, the editors and the reviewers. Any product that may be evaluated in this article, or claim that may be made by its manufacturer, is not guaranteed or endorsed by the publisher.
1. Wang CJ, Sun J, Shu QM, Liu J, Mao GS. Collision tumor of meningioma and craniopharyngioma: A case report. Int J Clin Exp Patho. (2016) 9:2552–7.
2. Janssens E, Verhelst PJ, De Vleeschouwer S, Van Calenbergh F, Hauben E, Politis , et al. Craniopharyngioma with Malignant transformation: A case report. Oral Maxillofac Surg Cases. (2020) 6-13:100171. doi: 10.1016/j.omsc.2020.100171
3. Müller H, Merchant T, Warmuth-Metz M, Martínez-Barbera J, Puget S. Craniopharyngioma. Nat Rev Dis Primers. (2019) 5:1–19. doi: 10.1038/s41572-019-0125-9
4. Zhou Z, Zhang S, Hu F. Endocrine disorder in patients with craniopharyngioma. Front Neurol. (2021) 12:737743. doi: 10.3389/fneur.2021.737743
5. Wang JG, Zhang M, Feng YQ, Ma CS, Wang TD, Zhu ZM, et al. Is the newest angiotensin-receptor blocker azilsartan medoxomil more efficacious in lowering blood pressure than the older ones? A systematic review and network meta-analysis. J Clin Hypertens (Greenwich). (2021) 23:901–14. doi: 10.1111/jch.14227
6. Chiou SM, Lunsford LD, Niranjan A, Kondziolka D, Flickinger JC. Stereotactic radiosurgery of residual or recurrent craniopharyngioma, after surgery, with or without radiation therapy. Neuro Oncol. (2001) 3:159–66. doi: 10.1093/neuonc/3.3.159
7. Muller H, Gebhardt U, Schroder S, Pohl F, Kortmann RD, Faldum A, et al. Growth hormone replacement and high recurrence rates in patients with childhood craniopharyngioma: Results of the German multicenter prospective trial KRANIOPHARYNGEOM 2000. Neuro-Oncology. (2008) 10:403.
8. Apps JR, Martinez-Barbera JPJNF. Molecular pathology of adamantinomatous craniopharyngioma: review and opportunities for practice. Neurosurg Focus. (2016) 41:E4. doi: 10.3171/2016.8.FOCUS16307
9. He J, Zeng Z, Wang Y, Deng J, Tang X, Liu F, et al. Characterization of novel CTNNB1 mutation in Craniopharyngioma by whole-genome sequencing. Mol Cancer. (2021) 20:168–84. doi: 10.1186/s12943-021-01468-7
10. Alexandraki KI, Xekouki P. Medical therapy for craniopharyngiomas. touchREV Endocrinol. (2021) 17:121–32. doi: 10.17925/EE.2021.17.2.121
11. Stockwell BR, Angeli JPF, Cell HBJ. Ferroptosis: A regulated cell death nexus linking metabolism, redox biology, and disease. Cell. (2017) 171:273–85. doi: 10.1016/j.cell.2017.09.021
12. Djulbegovic MB, Uversky VN. Ferroptosis - An iron- and disorder-dependent programmed cell death. Int J Biol Macromol. (2019) 135:1052–69. doi: 10.1016/j.ijbiomac.2019.05.221
13. Lei G, Zhuang Li, Gan B. Targeting ferroptosis as a vulnerability in cancer. Nat Rev Cancer. (2022) 7:381–96. doi: 10.1038/s41568-022-00459-0
14. Sean KR, Matija Z, Yingnan H, Erin T, Luoman C, Mahdiar S, et al. Microglia ferroptosis is regulated by SEC24B and contributes to neurodegeneration. Nat Neurosci. (2023) 26:12–26. doi: 10.1038/s41593-022-01221-3
15. Yan HF, Tuo QZ, Yin QZ, Lei P. The pathological role of ferroptosis in ischemia/reperfusion-related injury. Zool Res. (2020) 41:220–30. doi: 10.24272/j.issn.2095-8137.2020.042
16. Hu L, Guo C. Statistical analysis of quantitative data of the single-factor design with two levels using SAS software. Pharm Care Res. (2011) 11:170–3. doi: 10.5428/pcar20110304
17. Upstill-Goddard R, Eccles D, Fliege J, Collins A. Machine learning approaches for the discovery of gene-gene interactions in disease data. Brief Bioinform. (2012) 14:251–60. doi: 10.1093/bib/bbs024
18. Huynh-Thu VA, Saeys Y, Wehenkel L, Geurts P. Statistical interpretation of machine learning-based feature importance scores for biomarker discovery. Bioinformatics. (2012) 28:1766–74. doi: 10.1093/bioinformatics/bts238
19. Gump JM, Donson AM, Birks DK, Amani VM, Hankinson TC. Identification of targets for rational pharmacological therapy in childhood craniopharyngioma. Acta Neuropathologica Commun. (2015) 3:30–42. doi: 10.1186/s40478-015-0211-5
20. Donson AM, Apps J, Griesinger AM, Amani V, Consortium ATFPC. Molecular analyses reveal inflammatory mediators in the solid component and cyst fluid of human adamantinomatous craniopharyngioma. J Neuropathology Exp Neurology. (2017) 76:779–88. doi: 10.1093/jnen/nlx061
21. Liu Y, Yin Z, Wang Y, Chen H. Exploration and validation of key genes associated with early lymph node metastasis in thyroid carcinoma using weighted gene co-expression network analysis and machine learning. Front Endocrinol (Lausanne). (2023) 14:1247709. doi: 10.3389/fendo.2023.1247709
22. Huang H, Ge C, Dai Y, Wu Y, Zhu J. Exploring ferroptosis-associated gene signatures as diagnostic and therapeutic targets for sepsis-induced cardiomyopathy. Cureus. (2024) 16:e60439. doi: 10.7759/cureus.60439
23. Liu C, Fang J, Kang W, Yang Y, Yu C, Chen H, et al. Identification of novel potential homologous repair deficiency-associated genes in pancreatic adenocarcinoma via WGCNA coexpression network analysis and machine learning. Cell Cycle. (2023) 22:2392–408. doi: 10.1080/15384101.2023.2293594
24. Shi H, Yuan X, Liu G, Fan W. Identifying and validating GSTM5 as an immunogenic gene in diabetic foot ulcer using bioinformatics and machine learning. J Inflammation Res. (2023) 16:6241–56. doi: 10.2147/JIR.S442388
25. Yan L, Han X, Zhang M, Fu Y, Yang F, Li Q, et al. Integrative analysis of TBI data reveals Lgmn as a key player in immune cell-mediated ferroptosis. BMC Genomics. (2023) 24:1–15. doi: 10.1186/s12864-023-09842-z
26. Karavitaki N. Management of craniopharyngiomas. J Endocrinol Invest. (2014) 37:219–28. doi: 10.1007/s40618-013-0050-9
27. Lin D, Zhao W, Yang J, Wang H, Zhang H. Integrative analysis of biomarkers and mechanisms in adamantinomatous craniopharyngioma. Front Genet. (2022) 13:830793. doi: 10.3389/fgene.2022.830793
28. Yang J, Hou Z, Wang C, Wang H, Zhang H. Gene expression profiles reveal key genes for early diagnosis and treatment of adamantinomatous craniopharyngioma. Cancer Gene Ther. (2018) 25:227–39. doi: 10.1038/s41417-018-0015-4
29. Tarangelo A, Magtanong L, Bieging-Rolett KT, Li Y, Ye J, Attardi LD, et al. p53 suppresses metabolic stress-induced ferroptosis in cancer cells. Cell Rep. (2018) 22:569–75. doi: 10.1016/j.celrep.2017.12.077
30. Zhu L, Wang J, Tang X, Zhang C, Wang P, Wu L, et al. Efficient magnetic nanocatalyst-induced chemo- and ferroptosis synergistic cancer therapy in combination with T1-T2 dual-mode magnetic resonance imaging through doxorubicin delivery. ACS Appl Mater Interfaces. (2021) 14:3621–32. doi: 10.1021/acsami.1c17507
31. Lu X, Kang N, Ling X, Pan M, Du W, Gao S. MiR-27a-3p promotes non-small cell lung cancer through SLC7A11-mediated-ferroptosis. Front Oncol. (2021) 11:3861. doi: 10.3389/fonc.2021.759346
32. Li Y, Yan H, Xu X, Liu H, Wu C, Zhao L. Erastin/sorafenib induces cisplatin-resistant non-small cell lung cancer cell ferroptosis through inhibition of the Nrf2/xCT pathway. Oncol Lett. (2020) 19:323–33. doi: 10.3892/ol.2019.11066
33. Song W, Xin S, He M, Pfeiffer S, Cao A, Li H, et al. Evolutionary and functional analyses demonstrate conserved ferroptosis protection by Arabidopsis GPXs in mammalian cells. FASEB J. (2021) 35:e21550. doi: 10.1096/fj.202000856R
34. Lin W, Zhang T, Zheng J, Zhou Y, Lin Z, Fu XJN. Ferroptosis is involved in hypoxic-ischemic brain damage in neonatal rats. Neuroscience. (2022) 487:131–42. doi: 10.1016/j.neuroscience.2022.02.013
35. Brown CW, Amante JJ, Goel HL, Mercurio AM. The α6β4 integrin promotes resistance to ferroptosis. J Cell Biol. (2017) 216:4287–97. doi: 10.1083/jcb.201701136
36. Park YJ, Woo M, Ao Z, Kieffer TJ, Warnock GL, Marzban L. Deletion of caspase-8 protects islet β-cells from cytotoxic effects of human islet amyloid polypeptide aggregates. Can J Diabetes. (2012) 36:S18–S. doi: 10.1016/j.jcjd.2012.07.075
37. Hashemi M, Aftabi S, Moazeni-Roodi A, Sarani H, Ghavami S. Association of CASP8 polymorphisms and cancer susceptibility: A meta-analysis. Eur J Pharmacol. (2020) 881:173201. doi: 10.1016/j.ejphar.2020.173201
38. Cox A, Dunning AM, Garcia-Closas M, Balasubramanian S, Reed MW, Pooley KA, et al. Corrigendum: A common coding variant in CASP8 is associated with breast cancer risk. Nat Genet. (2007) 39:352–8.
39. Ramms L, Fabris G, Windoffer R, Schwarz N, Springer R, Zhou C, et al. Keratins as the main component for the mechanical integrity of keratinocytes. Proc Natl Acad Sci U S A. (2013) 110:18513–8. doi: 10.1073/pnas.1313491110
40. Fortier AM, Cadrin M, Asselin E. Abstract 5160: Claudin1 induces cell motility and invasion through PI3K/Akt/NFkB signaling in keratin-depleted carcinoma cell lines. Cancer Res. (2013) 73:5160. doi: 10.1158/1538-7445.AM2013-5160
41. Jiang X, Kim HE, Shu H, Zhao Y, Zhang H, Kofron J, et al. Distinctive roles of PHAP proteins and prothymosin-α in a death regulatory pathway. Science. (2003) 299:223–6. doi: 10.1126/science.1076807
42. Cao J, Lin JP, Yang LX, Chen K, Huang ZS. Expression of aberrant β-catenin and impaired p63 in craniopharyngiomas. Br J Neurosurg. (2010) 24:249–56. doi: 10.3109/02688690903576237
43. Esheba GE, Hassan AA. Comparative immunohistochemical expression of β-catenin, EGFR, ErbB2, and p63 in adamantinomatous and papillary craniopharyngiomas. J Egypt Natl Canc Inst. (2015) 27(3):139–45. doi: 10.1016/j.jnci.2015.06.003
44. Li W, Fu H, Fang L, Chai H, Gao T, Chen Z, et al. Shikonin induces ferroptosis in multiple myeloma via GOT1-mediated ferritinophagy. Front Oncol. (2022) 12:1025067. doi: 10.3389/fonc.2022.1025067
45. Kremer DM, Nelson BS, Lin L, Yarosz EL, Halbrook CJ, Kerk SA, et al. GOT1 inhibition promotes pancreatic cancer cell death by ferroptosis. Nat Commun. (2021) 11:4860–73. doi: 10.1038/s41467-021-24859-2
46. Wei X-B, Jiang W-Q, Zeng J-H, Huang L-Q, Ding H-G, Jing Y-W, et al. Exosome-Derived lncRNA NEAT1 Exacerbates Sepsis-Associated Encephalopathy by Promoting Ferroptosis Through Regulating miR-9-5p/TFRC and GOT1 Axis. Mol Neurobiol. (2022) 59:1954–69. doi: 10.1007/s12035-022-02738-1
Keywords: Adamantinomatous craniopharyngioma, machine learning, ferroptosis, biomarkers, diagnosis
Citation: Feng Y, Zhang Z, Tang J, Chen Y, Hu D, Huang X and Li F (2024) Ferroptosis-related biomarkers for adamantinomatous craniopharyngioma treatment: conclusions from machine learning techniques. Front. Endocrinol. 15:1362278. doi: 10.3389/fendo.2024.1362278
Received: 28 December 2023; Accepted: 25 October 2024;
Published: 13 November 2024.
Edited by:
Chiara Liverani, Scientific Institute of Romagna for the Study and Treatment of Tumors (IRCCS), ItalyReviewed by:
Nan Zhou, Guangzhou Medical University, ChinaCopyright © 2024 Feng, Zhang, Tang, Chen, Hu, Huang and Li. This is an open-access article distributed under the terms of the Creative Commons Attribution License (CC BY). The use, distribution or reproduction in other forums is permitted, provided the original author(s) and the copyright owner(s) are credited and that the original publication in this journal is cited, in accordance with accepted academic practice. No use, distribution or reproduction is permitted which does not comply with these terms.
*Correspondence: Fangping Li, bGlmYW5ncGluZ0BzeXN1c2guY29t
Disclaimer: All claims expressed in this article are solely those of the authors and do not necessarily represent those of their affiliated organizations, or those of the publisher, the editors and the reviewers. Any product that may be evaluated in this article or claim that may be made by its manufacturer is not guaranteed or endorsed by the publisher.
Research integrity at Frontiers

Learn more about the work of our research integrity team to safeguard the quality of each article we publish.