 Zhentao Gong
 Yanwen Sun3
 Xiaoyong Zhu
 Yingli Shi
- 1Department of Gynecology, Obstetrics and Gynecology Hospital of Fudan University, Shanghai, China
- 2Shanghai Medical College of Fudan University, Shanghai, China
- 3School of Global Public Health, New York University, New York, NY, United States
- 4Laboratory for Reproductive Immunology, Obstetrics and Gynecology Hospital of Fudan University, Shanghai, China
- 5Shanghai Key Laboratory of Female Reproductive Endocrine Related Diseases, Obstetrics and Gynecology Hospital of Fudan University, Shanghai, China
Purpose: To examine the potential association between polycystic ovary syndrome (PCOS) and hyperuricemia and to elucidate the underlying contributory factors.
Methods: Retrospective study on 603 women with PCOS and 604 women without PCOS. Anthropometric features, reproductive hormone profiles, and metabolic parameters were measured and compared between two groups of patients. Examinations of correlations between SUA levels and other parameters were conducted to discern potential correlations.
Results: Both serum uric acid levels and the incidence of hyperuricemia exhibited statistically significant elevations in women with PCOS when compared to their counterparts without PCOS. Nonetheless, this statistical difference was not found between the obese subgroup after stratifying study subjects by body mass index (BMI). Pearson’s correlation analysis underscored the prominence of BMI as a robust factor influencing SUA levels in women, regardless of their PCOS status. Furthermore, multivariable linear regression model demonstrated significant positive associations between SUA levels and several variables, namely dehydroepiandrosterone sulfate (DHEA-S), free androgen index (FAI), total cholesterol (TC), triglycerides (TG), free fatty acids (FFA), fasting insulin (FINS), homeostatic model assessment of insulin resistance (HOMA-IR), area under the curve for insulin (AUC-I), alanine aminotransferase (ALT), and aspartate aminotransferase (AST). Additionally, it is noteworthy that the prevalence of hyperuricemia exhibited a positive association with fasting plasma glucose (FPG) levels, while conversely, it displayed a negative association with estradiol (E2) levels.
Conclusions: PCOS is associated with a significant elevation of SUA level and hyperuricemia prevalence. HA, IR, and dyslipidemia may be the mediators in the pathogenesis of hyperuricemia in women with PCOS.
1 Introduction
Polycystic ovary syndrome (PCOS) is the most common endocrine disorder in reproductive-aged women (1). According to various diagnostic criteria, PCOS is estimated to affect between 4–18% of women of reproductive age (2, 3). PCOS is a multifaceted disorder that encompasses a broad range of clinical manifestations beyond those related to the reproductive system. In particular, PCOS is frequently accompanied by metabolic disturbances, including abnormal lipid and glucose metabolism (4, 5), which contribute to an elevated risk of developing long-term complications such as cardiovascular diseases (6), diabetes (7), and cancer (8). Due to its high morbidity and the prevalence of associated complications, there is an urgent need for effective management and prevention of both short- and long-term sequelae.
Uric acid (UA) is a metabolic product derived from the oxidative degradation of purine compounds (9). Clinical diagnosis of hyperuricemia is typically established when serum uric acid (SUA) levels exceed 7.0 mg/dL (416 μmol/L) in men or 6.0 mg/dL (357 μmol/L) in women (10). Hyperuricemia is widely acknowledged not merely as a biomarker associated with various metabolic disorders, including obesity (11) and type 2 diabetes mellitus (T2DM) (12), but also as a predictor of hypertension, cardiovascular morbidity (13).
During our clinical practice, we observed that women with PCOS often present with elevated SUA levels. This observation raised our curiosity as to whether there is a correlation between elevated SUA levels/prevalence of hyperuricemia and PCOS. And if so, what are the contributing factors to this association? To answer this question, we conducted this retrospective study.
The objectives of this investigation encompass the examination of a plausible association between hyperuricemia and PCOS, with a concurrent effort to elucidate the underlying contributory factors. In undertaking this research, our overarching aim is to augment the existing comprehension of the complications associated with PCOS, thereby underscoring the importance of exploring a more comprehensive strategy for the effective management of this syndrome.
2 Methods
2.1 Study subjects
This retrospective cross-sectional study recruited 603 women with PCOS from the Reproductive Endocrinology Clinic, 604 women without PCOS but underwent surgical treatment for benign ovarian cysts from the Department of Gynecology, 1207 in total from Obstetrics and Gynecology Hospital of Fudan University between May 2021 and March 2023.
PCOS was diagnosed according to the Rotterdam criteria (14), when at least two of the following three criteria are met: 1) Oligo- or anovulation, 2) Presence of clinical and/or biochemical signs of hyperandrogenism (HA), and 3) Evidence of polycystic ovaries after exclusion of other potential etiologies such as congenital adrenal hyperplasia, androgen-secreting tumors, and Cushing’s syndrome. None of the participants in this study had administrated medications known to influence reproductive and metabolic processes during the six months prior to their enrollment.
The ethics committee of Obstetrics and Gynecology Hospital of Fudan University reviewed and approved this study protocol (kyy2023–68). The study protocol conforms rigorously to the ethical guidelines of the 1975 Declaration and its later amendments.
2.2 Assessments and definitions
This retrospective study involved the systematic collection and analysis of data pertaining to several key variables. These variables included body mass index (BMI), menstrual cycle characteristics, including duration and timing of the last three menstrual periods, as well as observable symptoms such as hirsutism, acne, alopecia, etc. Data, such as the levels of reproductive hormones, were collected through a thorough review of medical records from a selected population of patients who had previously sought medical attention for these conditions.
The body weight and height of participants were measured using standard protocol by skilled and experienced nurses. Subsequently, BMI was derived by dividing the measured body weight in kilograms by the square of the measured body height in meters. According to the computed value, BMI categories consisted of underweight (BMI<18.5 kg/m2), normal weight (18.5≤BMI<25kg/m2), overweight (25≤BMI<30kg/m2), and obese (BMI≥30kg/m2).
All participants underwent blood testing in the morning for reproductive hormones, sex hormone binding globulin (SHBG), lipids, alanine aminotransferase (ALT), aspartate aminotransferase (AST), UA and creatinine (Cr) during the follicular phase. The study also employed the oral glucose tolerance test (OGTT) and insulin release test (IRT) on participants who underwent an overnight fast of at least 8 hours prior to the test. Glucose and insulin levels were measured at various time intervals, including the basal sample, as well as at 0.5, 1, 2, and 3-hour intervals following the administration of glucose. Following sample collection, the specimens were stored at a temperature of 4°C and promptly conveyed to the clinical laboratory.
Hyperuricemia is characterized by a SUA level of at least 6mg/dL (357μmol/L) in women (10). The assessment of estimated glomerular filtration rate (eGFR) was based on the Chronic Kidney Disease-Epidemiology Collaboration formula (15) for White/other (except Black) expressed in milliliters per minute per 1.73 m2: Cr≤ 0.7 mg/dL, eGFR = 144 * (Cr/0.7)-0.329 *(0.993)age; Cr> 0.7 mg/dL, eGFR = 144 * (Cr/0.7)-1.209 *(0.993)age. Insulin resistance was assessed utilizing the homeostatic model assessment of insulin resistance (HOMA-IR). HOMA-IR = fast plasma glucose (FPG, mmol/L) * fasting serum insulin (FINS, mIU/mL)/22.5. The area under the insulin release curve (AUC-I) was calculated with the use of the trapezoidal method based on the results of the insulin-releasing test. Free androgen index (FAI%) = testosterone (T, ng/mL) ×100/SHBG (nmol/L).
2.3 Statistical analysis
Continuous variables were reported as medians with interquartile ranges, and categorical variables were presented as proportions (%). To account for skewed distribution, logarithmic transformation was applied to certain variables prior to statistical analysis. The statistical comparison of continuous variables was conducted using Student’s t-tests, while χ2 tests were used to compare categorical variables. Pearson correlation coefficient was employed to examine the potential associations between SUA levels and baseline characteristics index such as age, BMI and eGFR. Furthermore, multivariable linear regression model was utilized to assess the relationships between the variables while controlling pertinent confounding variables.
All statistical analyses were conducted using R version 4.2.1 (R Foundation for Statistical Computing, Vienna, Austria, www.R-project.org). A two-tailed test was utilized to ascertain statistical significance, and a P-value less than 0.05 was regarded as statistically significant. Statistical graphs are plotted using GraphPad Prism version 9.0.0 for Windows (GraphPad Software, Boston, Massachusetts USA, www.graphpad.com).
3 Results
3.1 Baseline characteristics
The baseline characteristics of PCOS and non-PCOS subjects were compared and presented in Table 1. The results showed that women in PCOS group were younger (P < 0.001) and had higher BMI (P < 0.001). The median SUA level was 345.25 μmol/L, and the prevalence of hyperuricemia was 38.97% in the PCOS group, which were significantly higher than those in the non-PCOS group with median SUA level of 280.49 μmol/L (P < 0.001) and prevalence of hyperuricemia of 9.77% (P < 0.001). We also found that the levels of hormones including T (P < 0.001), dehydroepiandrosterone sulfate (DHEA-S) (P < 0.001), luteinizing hormone (LH) (P < 0.001), LH/FSH (P < 0.001) and anti-Müllerian hormone (AMH) (P < 0.001) were significantly higher while estradiol (E2) (P < 0.001) and progesterone (P) (P < 0.001) were lower in PCOS group. No significant difference in the follicle stimulating hormone (FSH) (P > 0.05) and prolactin (PRL) (P > 0.05) levels were observed between the two groups.
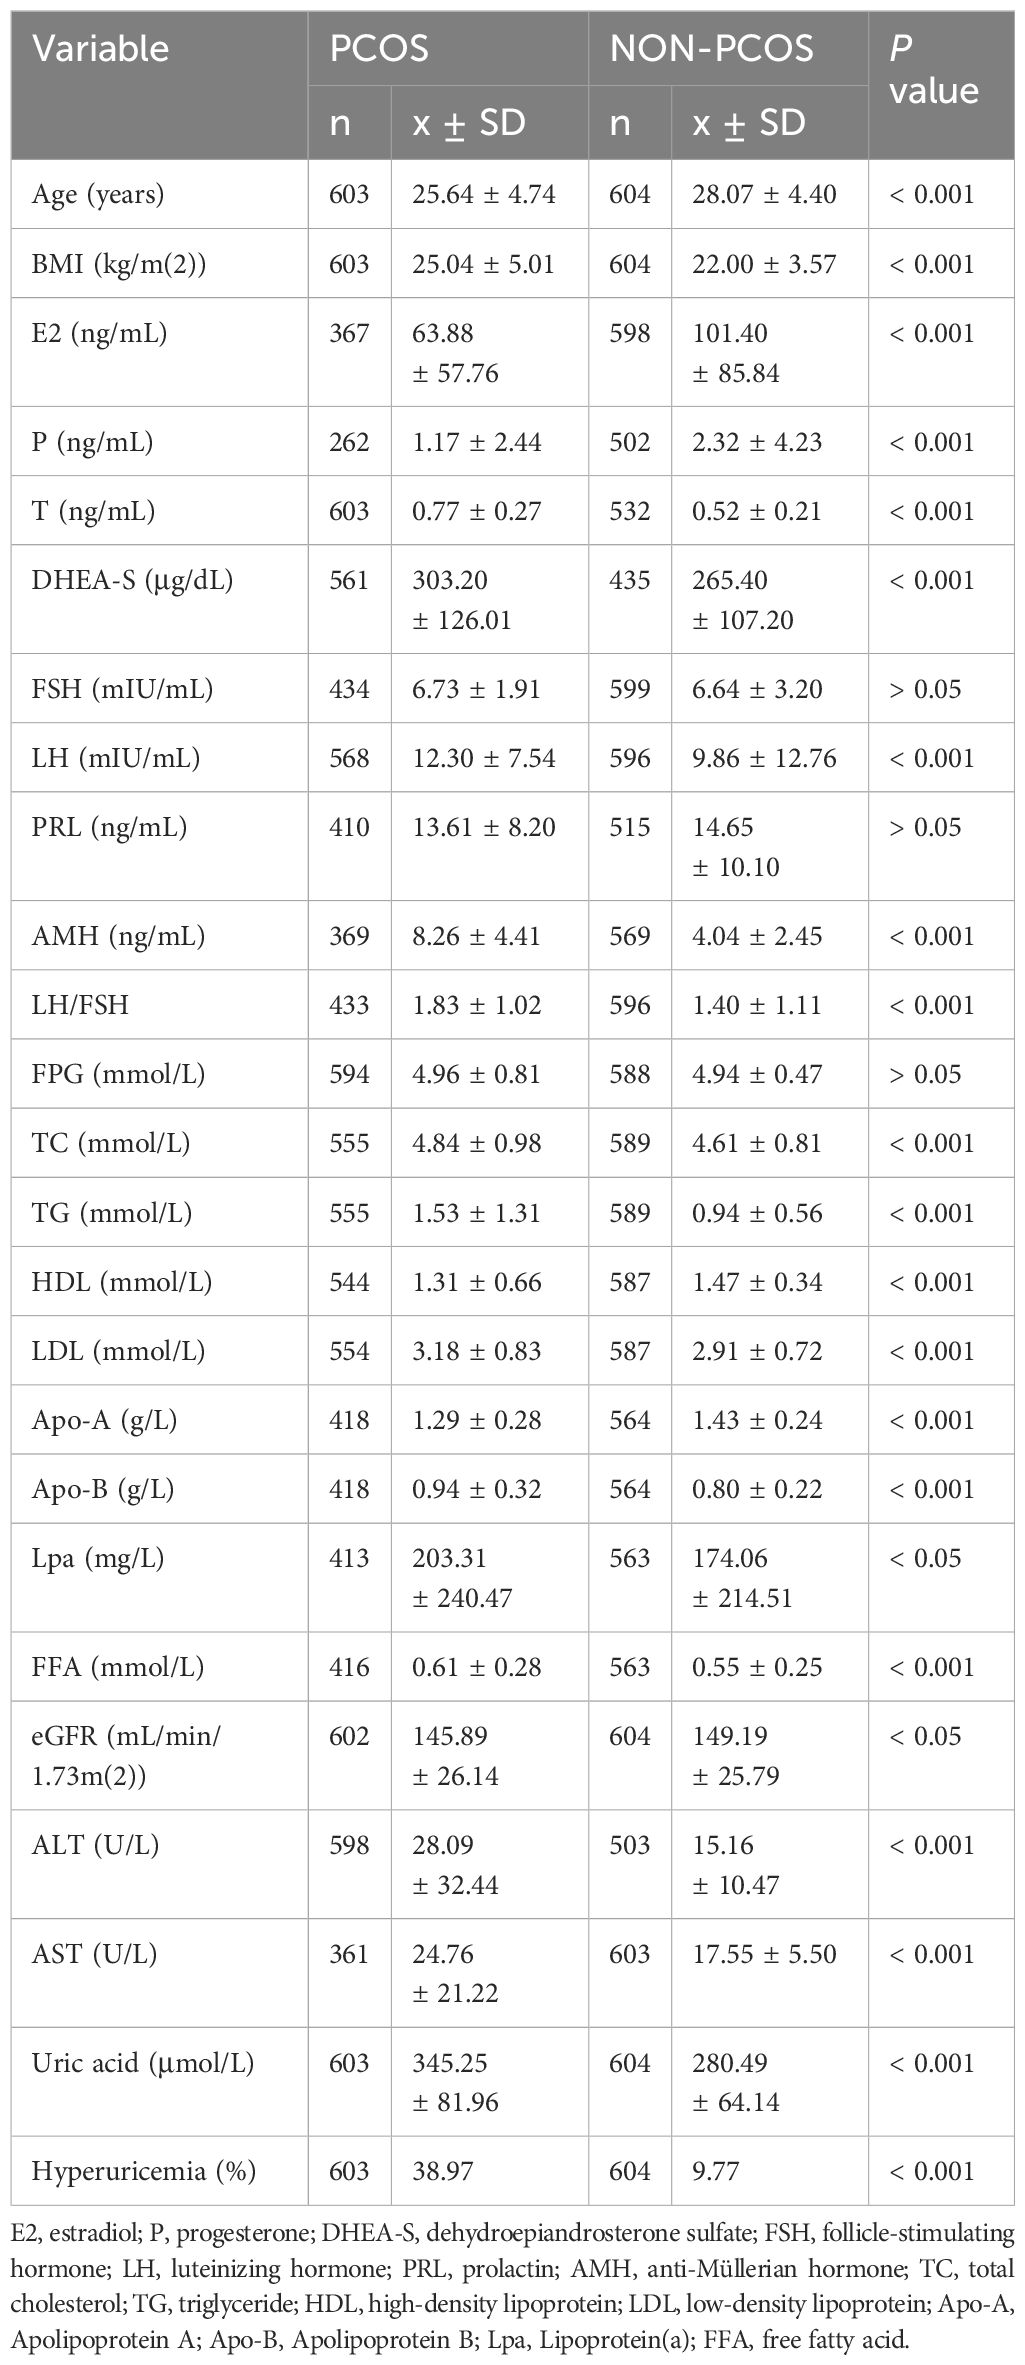
Table 1 Baseline characteristics of the study subjects.
In addition, women in PCOS group had higher levels of total cholesterol (TC) (P < 0.001), triglyceride (TG) (P < 0.001), free fatty acids (FFA) (P < 0.001), low-density lipoprotein (LDL) (P < 0.001), apolipoprotein-B (Apo-B) (P < 0.001), Lpa (P < 0.05), ALT (P < 0.001), AST (P < 0.001), and lower apolipoprotein-A (Apo-A) (P < 0.001), high-density lipoprotein (HDL) (P < 0.001) and eGFR (P < 0.01) compared to non-PCOS group. No significant difference in the level of FPG was observed. After stratifying the study subjects based on BMI categories, the SUA levels and the prevalence of hyperuricemia were compared and presented in Figure 1, and the baseline characteristics of all four subgroups of PCOS were also compared and presented in Table 2.
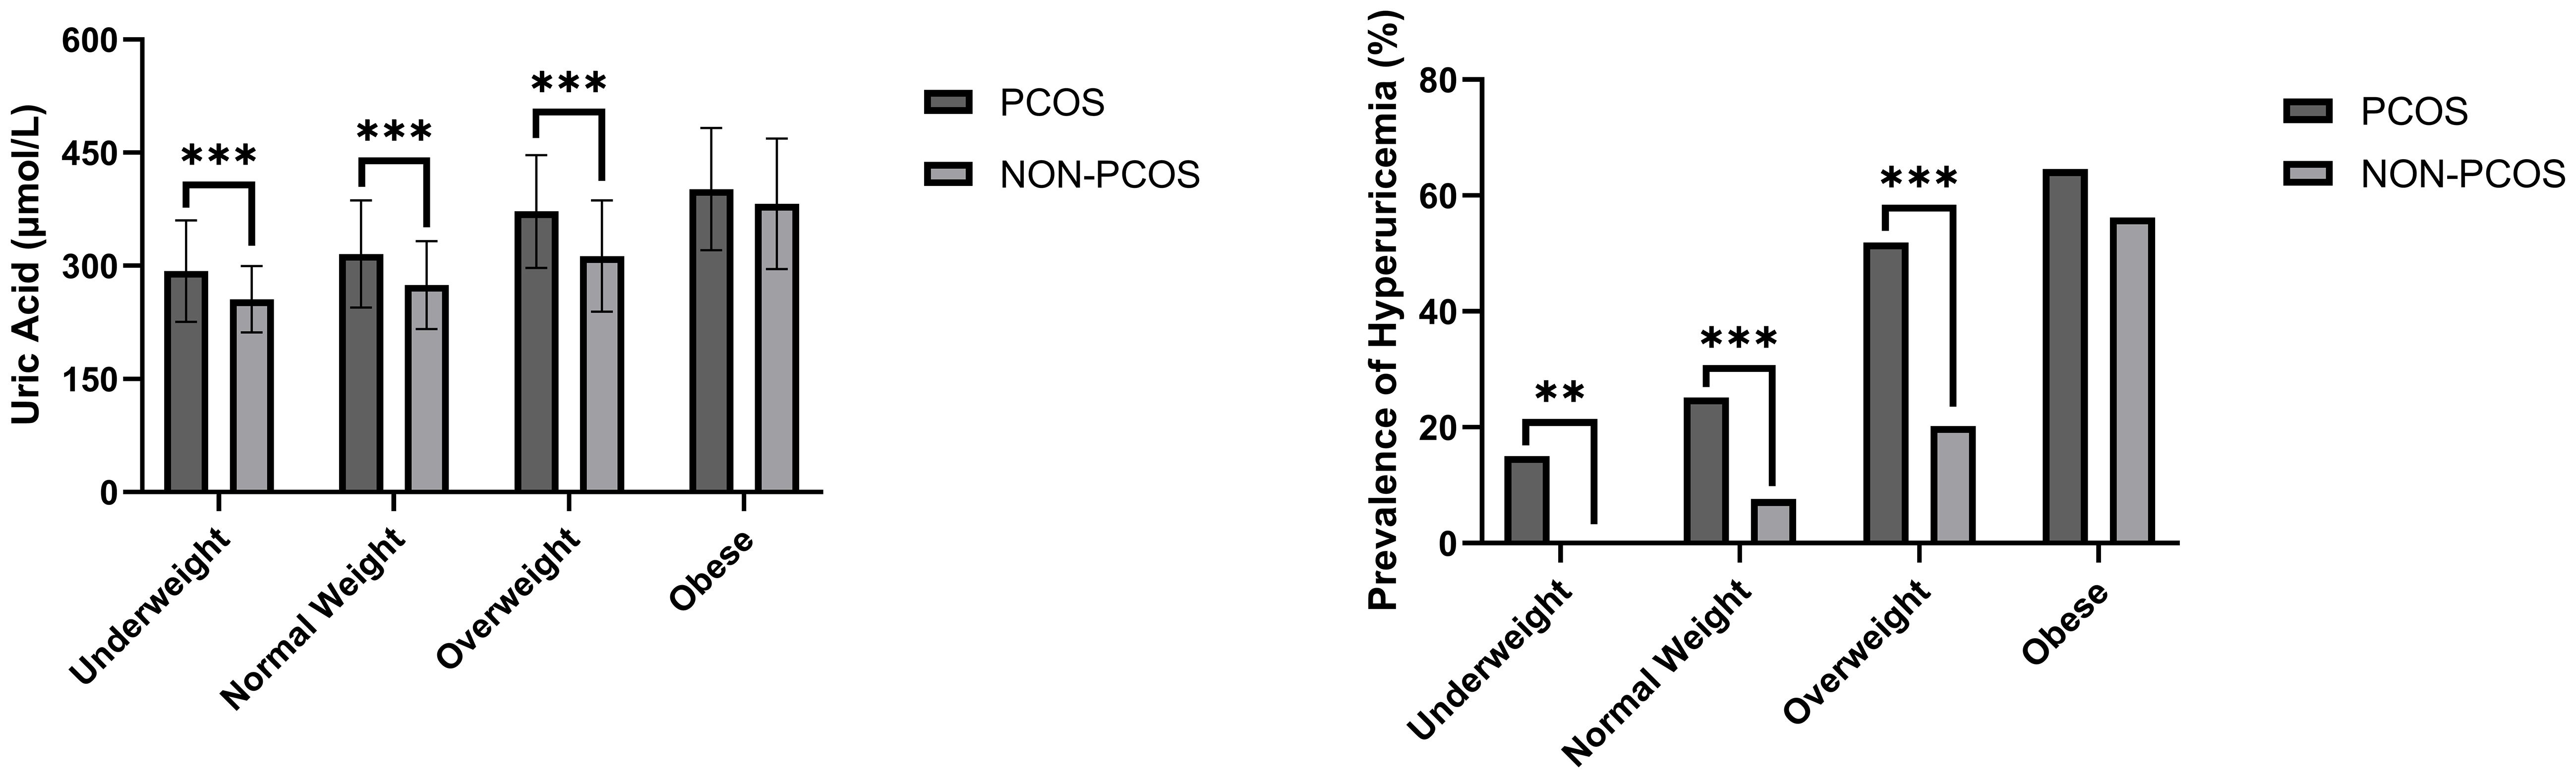
Figure 1 SUA level and prevalence of hyperuricemia comparisons between women with/without PCOS stratified based on BMI. **P < 0.01; ***P < 0.001.
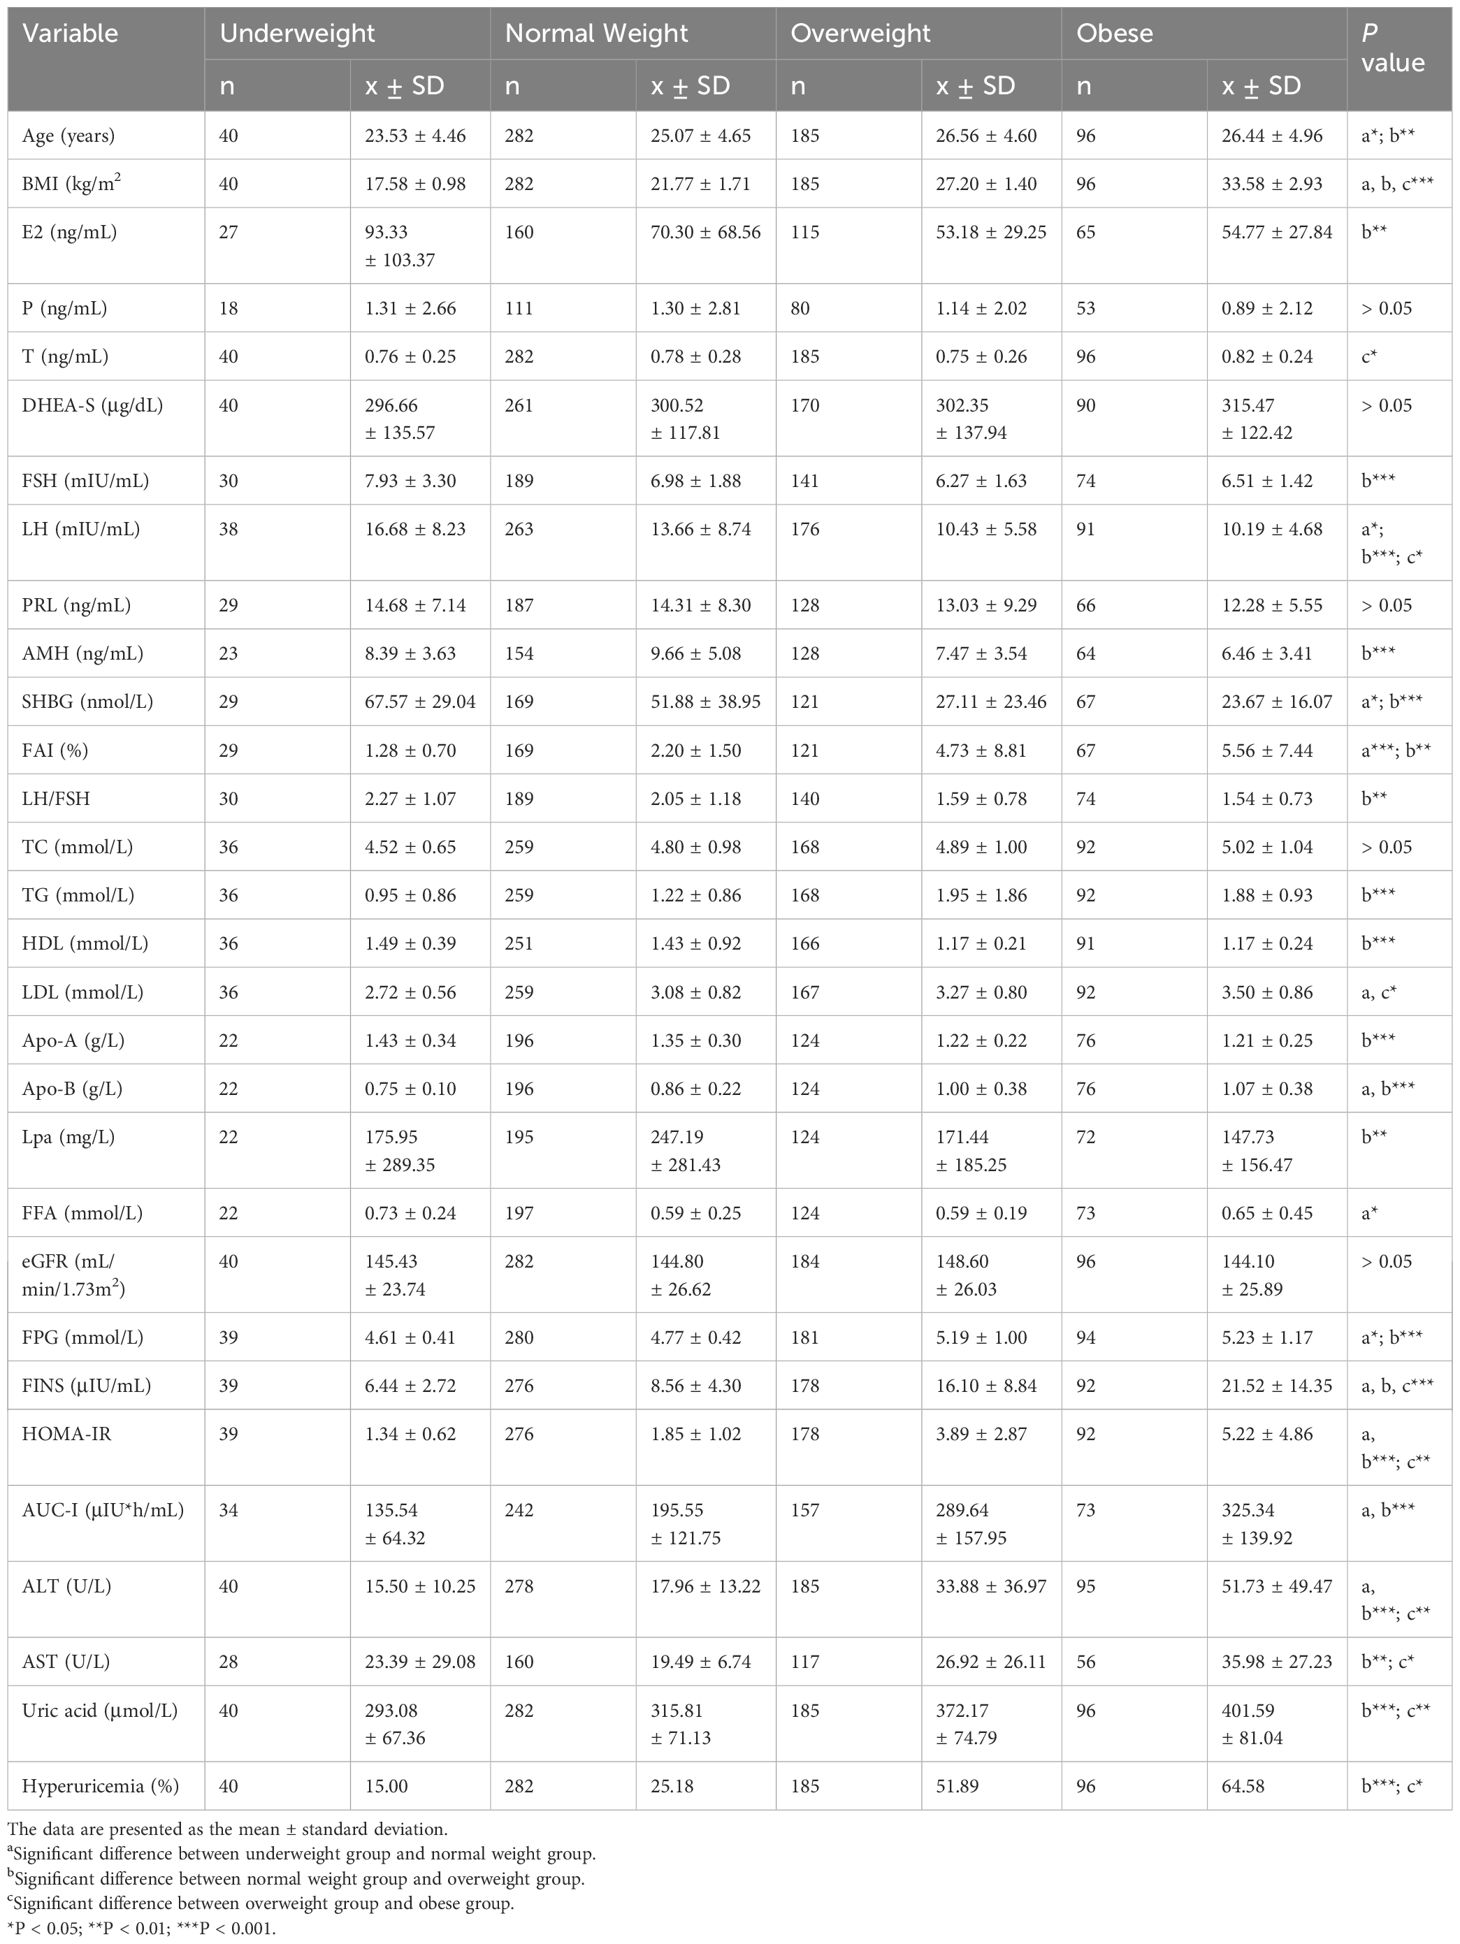
Table 2 Baseline characteristics of all four subgroups of PCOS subjects stratified based on BMI.
*, P < 0.05; **, P < 0.01; ***, P < 0.001
3.2 Associations between age, BMI, eGFR and SUA levels in PCOS populations
We discovered significant differences in the mean levels of SUA and the prevalence of hyperuricemia among underweight (P < 0.001), normal weight (P < 0.001) and overweight subgroups (P < 0.001) after stratifying the study population based on BMI. In other words, there were no statistically significant differences between SUA levels and the occurrence of hyperuricemia in the obese subgroup (Table 3).Additionally, the levels of SUA were found to be correlated with BMI in Pearson’s correlation analysis (r = 0.460, p < 0.001), however, its correlations with age and eGFR were not statistically significant.
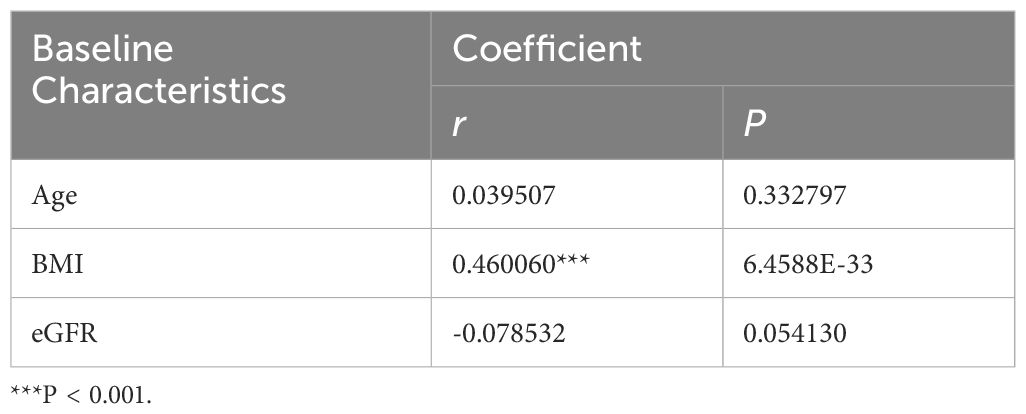
Table 3 Correlations between the levels of age, BMI, eGFR and serum uric acid.
3.3 Associations between the levels of reproductive hormones and SUA in PCOS populations
Multivariable linear regression model revealed that both SUA level and the prevalence of hyperuricemia were positively associated with the levels of DHEA-S (b = 0.082, P < 0.001; b = 0.002, P < 0.05) and FAI (b = 9.209, P < 0.001; b = 0.245, P < 0.001). And the prevalence of hyperuricemia was negatively associated with the E2 level (b = -0.007, P < 0.05).
SUA levels were also observed to have a positive association with the levels of LH, FSH, LH/FSH, PRL and T, and a negative association with the levels of E2, P and AMH. However, these associations did not reach statistical significance (Figure 2).
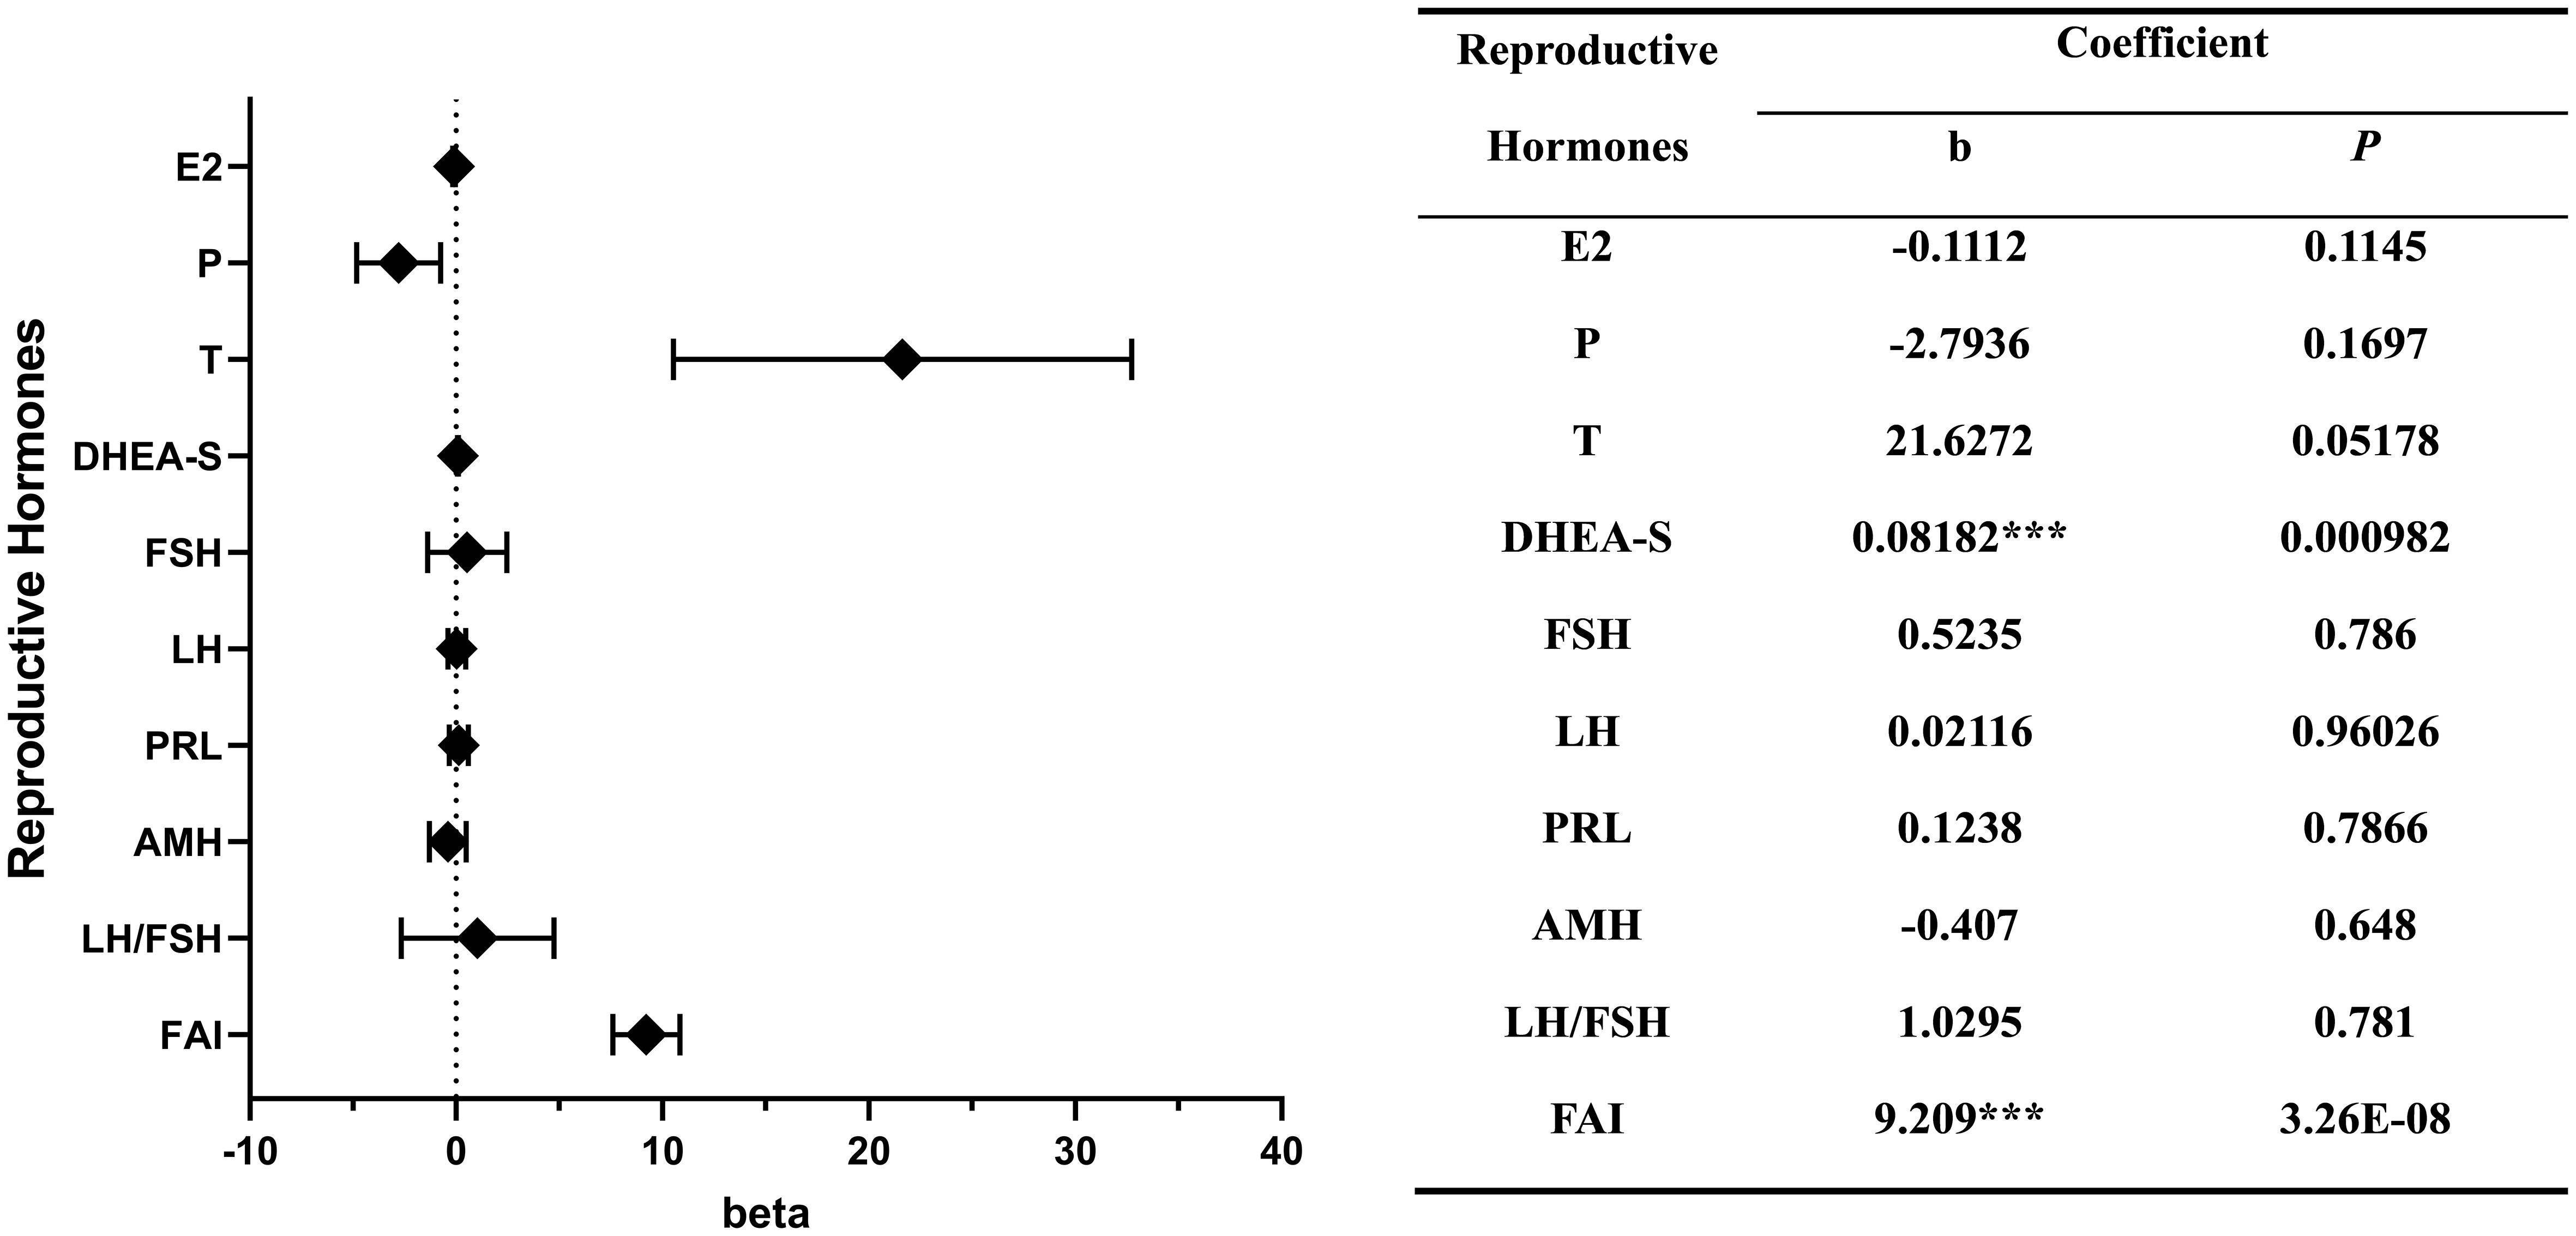
Figure 2 Correlations between the levels of reproductive hormones and serum uric acid. ***P < 0.001.
*, P < 0.05; **, P < 0.01; ***, P < 0.001
3.4 Associations between the levels of metabolic indexes and SUA in PCOS populations
Multivariable linear regression model also demonstrated a significant positive association between SUA levels and levels of TC (b = 6.378, P < 0.05), TG (b = 11.467, P < 0.001), LDL (b = 8.250, P < 0.05), FFA (b = 43.922, P < 0.001), Apo-A (b = 28.388, P < 0.05), Apo-B (b = 30.851, P < 0.01), FINS (b = 1.206, P < 0.01), HOMA-IR (b = 2.633, P < 0.05), AUC-I (b = 0.099, P < 0.001), ALT (b = 0.532, P < 0.001) and AST (b = 1.045, P < 0.001).
In the context of examining the relationship between the prevalence of hyperuricemia and various metabolic parameters, we observed that TC exhibited a statistically significant positive correlation (b = 0.194, P < 0.05), as did TG (b = 0.356, P < 0.001), FFA (b = 1.373, P < 0.01), FINS (b = 0.042, P < 0.01), HOMA-IR (b = 0.102, P < 0.05), AUC-I (b = 0.003, P < 0.001), ALT (b = 0.015, P < 0.001) and AST (b = 0.051, P < 0.001) also displayed a positive correlation.
The associations between the levels of FPG (b = 0.297, P < 0.05) and the prevalence of hyperuricemia is statistically significant, while their association with the level of SUA did not reach statistical significance. SUA level also had a positive association with the level of HDL and a negative association with the level of Lpa. However, these associations did not reach statistical significance (Figure 3).
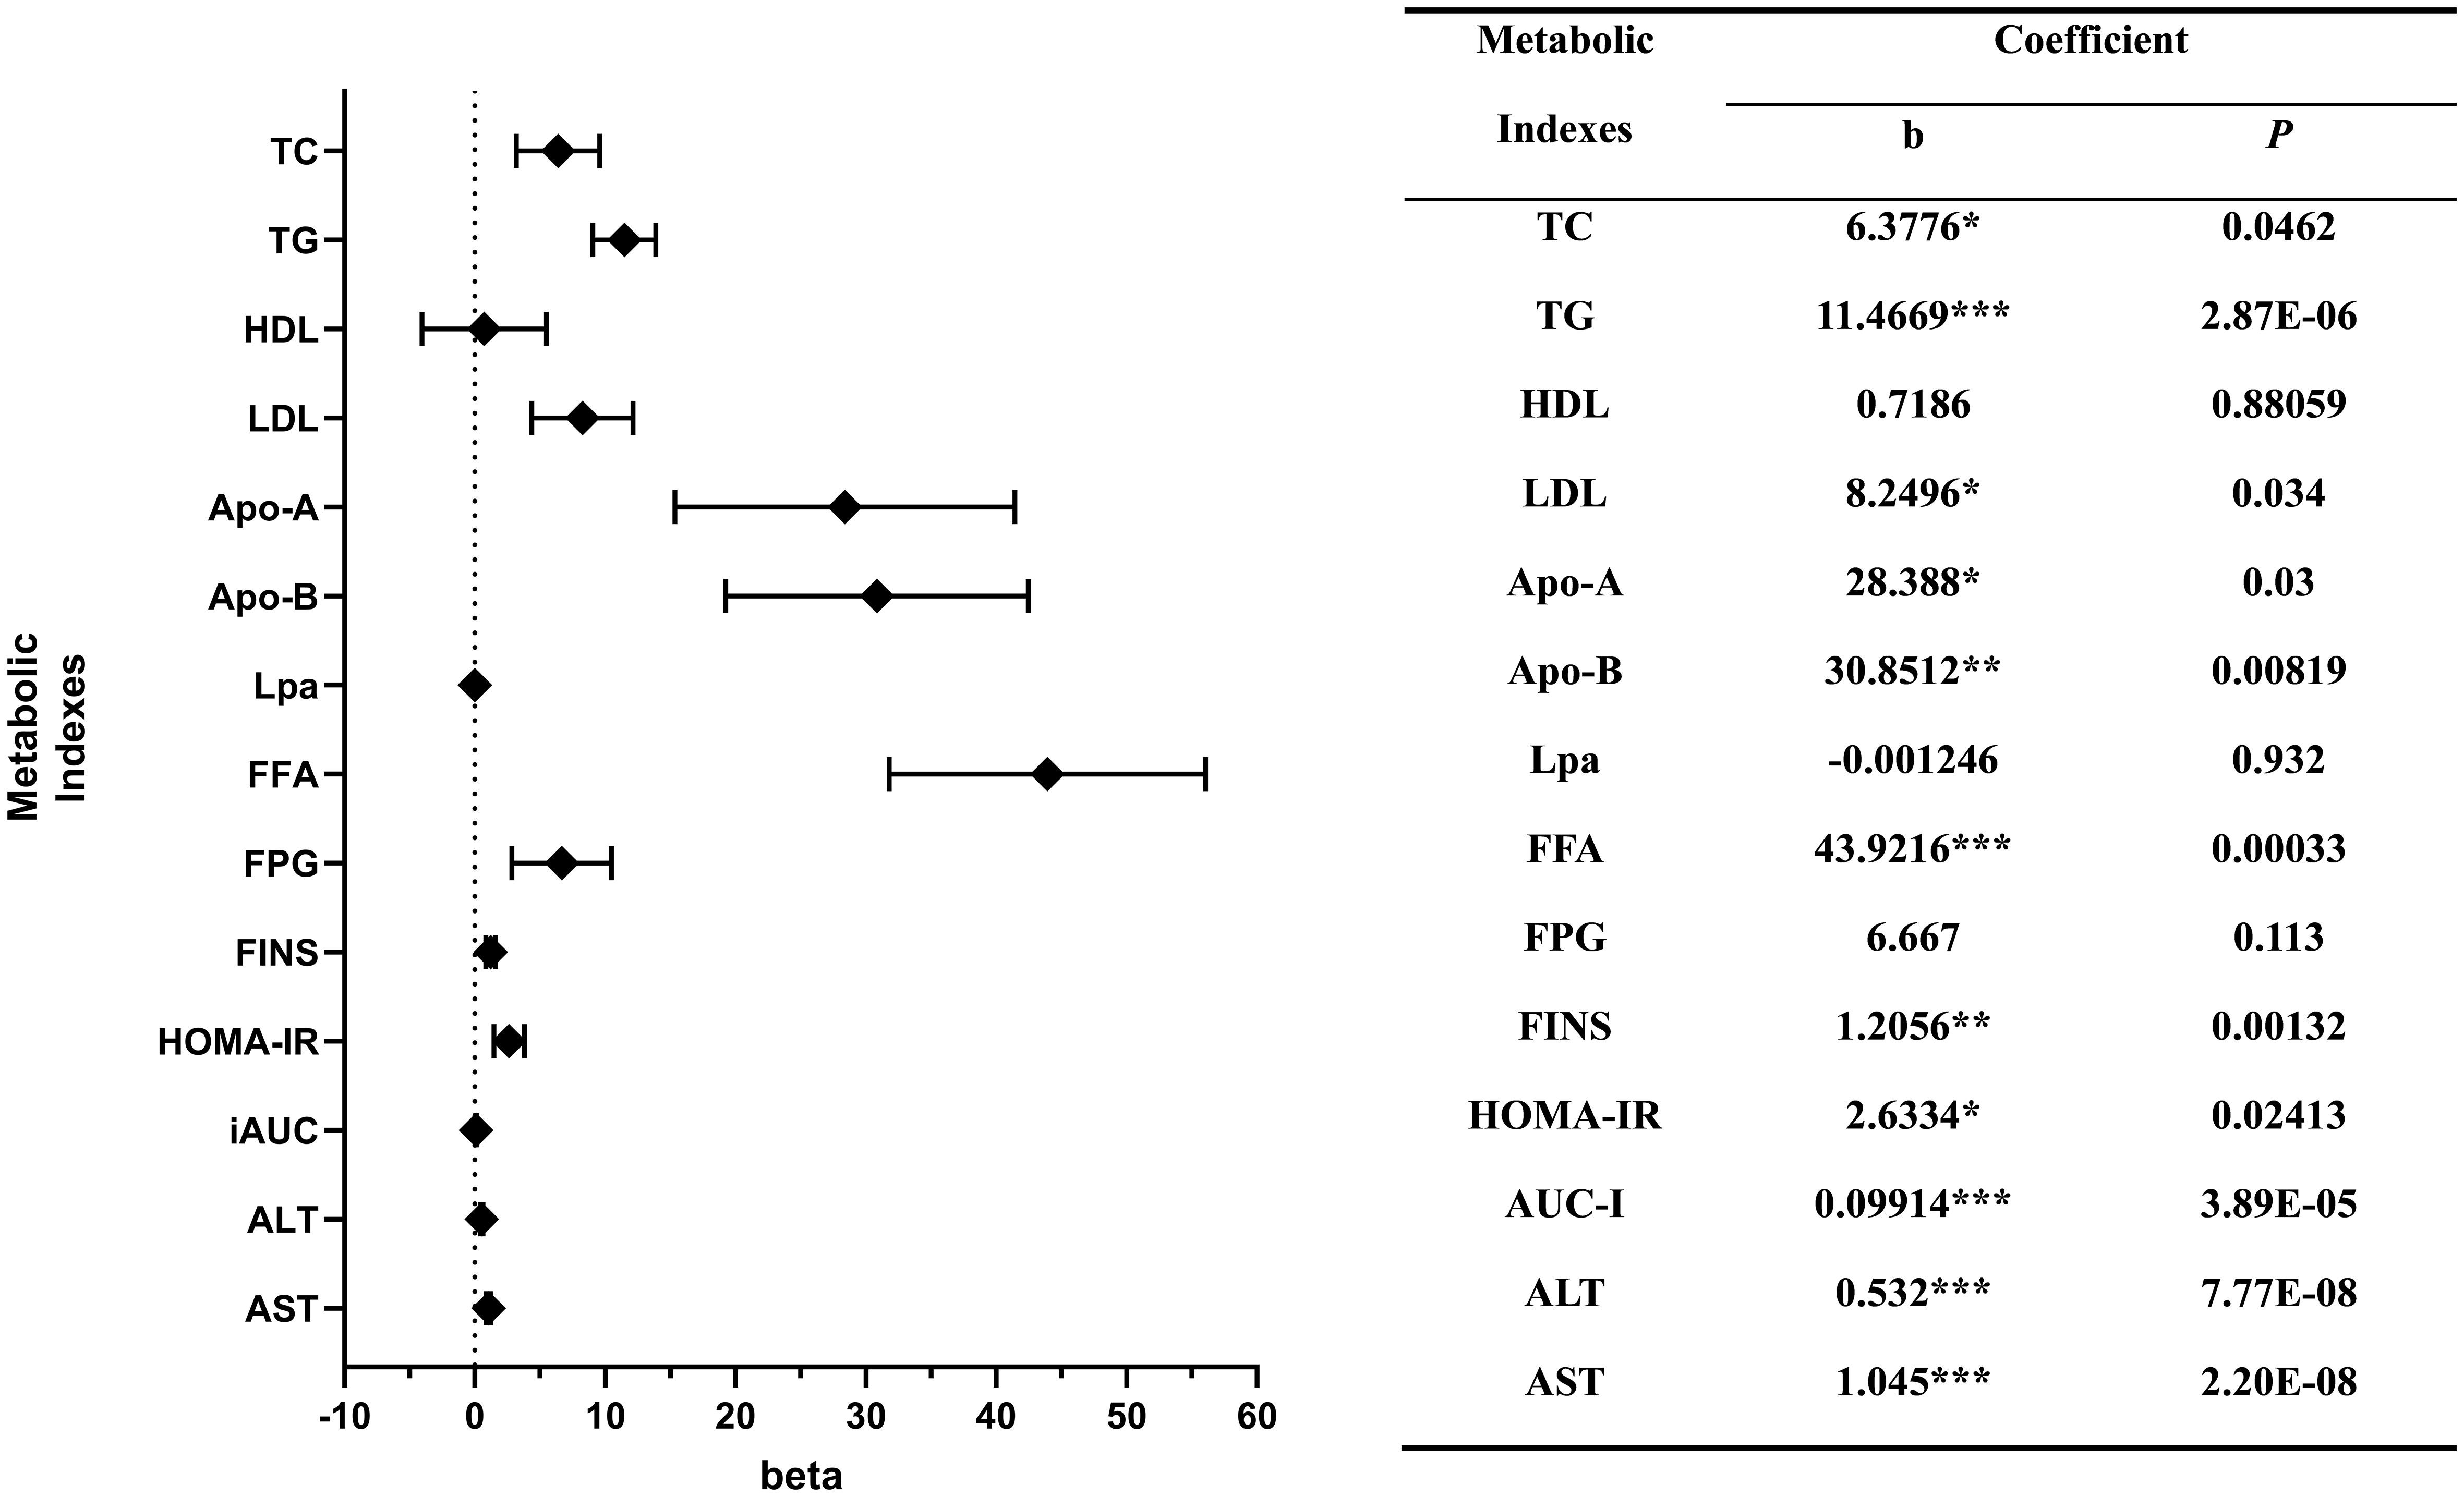
Figure 3 Correlations between the levels of metabolic indexes and serum uric acid. *P < 0.05; **P < 0.01; ***P < 0.001.
*, P < 0.05; **, P < 0.01; ***, P < 0.001
4 Discussion
To the best of our knowledge, this is the first study in women with PCOS demonstrating a significant association between HA, IR, dyslipidemia, and hyperuricemia. Through our investigation into the interplay of these pathologies, we have unveiled the association of PCOS, hyperuricemia and its long-term complexities. These findings underscore the imperative for a more comprehensive therapeutic strategy in addressing the multifaceted challenges posed by this condition. The discerned associations and their underlying mechanisms not only enhance our theoretical grasp of PCOS but also provide promising avenues for the potential development of supplementary therapeutic interventions.
Inspired by observation from clinical practice that women with PCOS tended to be combined with higher level of SUA and cognizant of the consequential health risks entailed by hyperuricemia, we conducted this retrospective study. The primary objective of this study was to examine the potential existence of a correlation between hyperuricemia and PCOS, with a concomitant focus on delineating the specific contributing factors that underpin this relationship.
This study revealed that there exist statistically significant differences between the SUA level and the prevalence of hyperuricemia between PCOS group and non-PCOS group. However, after stratifying the study population based on BMI, this difference become insignificant among obese group. Pearson’s correlation analysis also suggests a positive correlation between the level of BMI and SUA. This result further stresses the strong correlation between high BMI and elevated level of SUA. Considering it, we include it in the multiple linear regression model as a confounder to the SUA level. Although no statistical significance was found between age, eGFR and SUA levels in this research, numerous retrospective studies (16–19) had established solid correlations between age, eGFR and SUA levels. As such, we conducted the subsequent analysis with stratification based on these two factors along with BMI.
Correlation analyses based on multivariable linear regression model showed that, in PCOS group, both SUA level and prevalence of hyperuricemia are positively correlated to the level of DHEA-S, FAI, TC, TG, FFA, FINS, HOMA-IR, AUC-I, ALT and AST. Meanwhile, SUA level is also positively correlated to the levels of LDL, Apo-A and Apo-B; the prevalence of hyperuricemia is negatively correlated to the level of E2 and positively correlated to the level of FPG. These discoveries indicate that higher levels of SUA and prevalence of hyperuricemia are highly associated with HA, IR, dyslipidemia and potential hypohepatia in women with PCOS, and E2 may serve as a protective factor.
A plasma metabolomics analysis demonstrated that among several sub-classifications of PCOS, the HA subtype exhibited significantly elevated levels of SUA when compared to the oligo-/anovulation and PCOM subtypes (20), which indicates that there might exist a positive correlation between the levels of androgen and SUA in women with PCOS. Numerous studies have indicated positive correlations between either T or DHEA-S and SUA, though not completely identical (21–25). The outcomes of our study support this proposed correlation as we have identified a statistically significant association between DHEA-S, FAI levels and SUA levels. It is noteworthy that the correlation between T and SUA levels, while not achieving statistical significance (p = 0.052), exhibits a notable degree of proximity to significance in our findings. The presence of a robust correlation between the levels of androgens and UA remains ambiguous, however, existed researches suggest that androgens could elevate SUA levels through the stimulation of hepatic purine nucleotide metabolism (26) and enhance the reabsorption of UA in the kidney (27). In addition to this, we also observed a negative association between the levels of E2 and SUA, we suggest that it may be attributed to the capacity of E2 to lower SUA levels by stimulating UA excretion in the renal system (28).
Mu et al. undertook a retrospective inquiry aiming to explore the relationship between hyperuricemia prevalence and reproductive hormones in PCOS (23). The findings of the study suggested a strong association between T levels and the levels of SUA. Beyond the purview of sex hormones, PCOS encompasses series of metabolic disorders such as IR and dyslipidemia. However, these were not considered in the study by Mu et al. In addition to this, as an important aspect of PCOS, although HA exerts a substantial influence across various pathogenic mechanisms inherent to the syndrome, whether it is significantly related to hyperuricemia is conflict (22, 24, 27, 29). This controversy also raised our interest, prompting a systematic exploration into the potential presence of confounding variables that might influence SUA levels among individuals with PCOS. Consequently, our research endeavors to address this void by examining not only the relationship between SUA and reproductive hormones, but also the role of lipids, insulin, etc. By doing so, we aim to provide a more comprehensive and convincing analysis of the association between hyperuricemia and PCOS.
It has been extensively reported that SUA levels are strongly associated with the degree of IR (30–32). Given that IR is a hallmark feature of PCOS, it was anticipated that there would exist a significant positive correlation between SUA levels and either HOMA-IR or AUC-I in PCOS patients. Our study findings supported this hypothesis, as we identified significant positive associations between SUA levels and FPG, FINS, HOMA-IR, and AUC-I. One plausible mechanism underlying this relationship could be the insulin’s potential role in promoting renal urate reabsorption by activating URAT1 and the sodium-dependent anion co-transporter located in the brush border membranes of the renal proximal tubule (33).
Moreover, a prospective study conducted on a large population also discovered a bell-shaped curve relationship between SUA and glucose levels (34). Specifically, when glucose levels surpass a certain threshold, which was determined to be eight mmol/L in that study, SUA levels decline as glucose levels increase. Conversely, when glucose levels are below this threshold, SUA levels tend to increase as glucose levels increase. However, we did not observe this bell-shaped relationship in our study. A potential explanation for this disparity could be the participants included in this investigation were of a relatively youthful age and tended to display less pronounced severity in their glucose metabolism disorders.
In addition to insulin, lipids also play a significant role in the pathogenesis of hyperuricemia. Rats that were fed a high-fat diet and subsequently developed obesity exhibited increased activity of XOR in their subcutaneous adipose tissue (35). Furthermore, the accumulation of UA in the body triggers de novo lipogenesis, thereby facilitating the synthesis of fatty acids within the liver (36). This process establishes a positive feedback loop between dyslipidemia and hyperuricemia. Our findings suggest that the aforementioned self-sustaining vicious cycle predominantly contributes to the metabolic derangement of lipids, particularly free fatty acids, which emerges as the most notably associated factor. This finding also provides valuable insight, indicating that interventions aimed at reducing lipid levels could be greatly beneficial for PCOS patients with coexisting hyperuricemia.However, this study inevitably has its limits. The research design is fundamentally retrospective, thereby limiting our ability to gather blood samples and data at varying intervals over an extended period. To maintain stability in the plasma levels of reproductive hormones, we collected blood samples exclusively during the follicular phase, when basal levels of reproductive hormones were assessed, without dynamic monitoring. Due to these constraints, we were unable to conduct a cohort study similar to the one conducted by Mumford et al. (37) This limitation might have constrained the demonstration of the correlation between E2 and UA levels. Our comparison of baseline characteristics between the PCOS and control groups revealed that E2 and P levels were significantly lower in the PCOS group compared to the control group, while this trend was opposite to the differences observed in SUA levels between the two groups. However, in the correlation analysis conducted using a multivariable linear regression model, no significant association was found between E2 or P levels and SUA levels. In fact, one study suggests that uric acid levels in follicular fluid may influence follicle development by promoting oxidative stress (38). The discrepancies between our study and the aforementioned research warrant further investigation through subsequent cohort studies and additional animal experiments. Moreover, in this study, we included women aged 18 to 35 years, which is a relatively narrow age range. Therefore, it is important to recognize that the correlations we have identified might have limitations due to the restricted age group we focused on.
Conducting subgroup analyses comparing PCOS and non-PCOS populations would undoubtedly enhance the statistical robustness of our study. However, upon stratification, we observed a significantly uneven distribution among the four groups, particularly within the obese subgroup (96/19), indicating pronounced disparities. Furthermore, we detected instances of heteroscedasticity. These issues, compounded by substantial discrepancies in sample sizes, led us to abstain from incorporating these results into the study. Nevertheless, this decision may render the results contentious and potentially preclude the derivation of more nuanced conclusions.
To obtain a compelling conclusion from a cross-sectional study, it is imperative to have a sufficiently large sample size. Unfortunately, the present study was unable to collect a dataset of adequate magnitude. For example, the reported bell-shaped curve relationship between FPG and SUA levels was not found in this study because of the limited sample size. Furthermore, conducting studies in a single center may lead to selection bias, which can further compromise the validity and generalizability of the results. The imperative for further research necessitates a multicenter study, characterized by a larger sample size to enhance the robustness and generalizability of our findings.
5 Conclusions
To conclude, this study demonstrated that PCOS is associated with a significant elevation of SUA level and hyperuricemia prevalence. A higher level of DHEA-S, FAI, TC, TG, FFA, FINS, HOMA-IR, AUC-I, ALT, and AST were strongly correlated with both elevated SUA level and hyperuricemia prevalence, suggesting that HA, IR, and dyslipidemia may be the mediators in the pathogenesis of hyperuricemia in women with PCOS. Through the elucidation of these associations, we gained a deeper understanding of the complexity of PCOS and its long-term effects on multiple organ systems, which provides us with an important and sufficient foundation for its early diagnosis and early management.
Data availability statement
The raw data supporting the conclusions of this article will be made available by the authors, without undue reservation.
Ethics statement
The studies involving humans were approved by the Ethics Committee of the Obstetrics and Gynecology Hospital of Fudan University. The studies were conducted in accordance with the local legislation and institutional requirements. Written informed consent for participation was not required from the participants or the participants’ legal guardians/next of kin in accordance with the national legislation and institutional requirements.
Author contributions
ZG: Investigation, Methodology, Visualization, Writing – original draft, Writing – review & editing. YWS: Methodology, Visualization, Writing – review & editing. LZ: Writing – review & editing. XZ: Funding acquisition, Supervision, Writing – review & editing. YLS: Conceptualization, Funding acquisition, Supervision, Writing – review & editing.
Funding
The author(s) declare financial support was received for the research, authorship, and/or publication of this article. This research was sponsored by Natural Science Foundation of Shanghai (No. 19ZR1406700 to YLS) and National Natural Science Foundation of China (No. 82071624 and 81871143 to XZ).
Acknowledgments
We are deeply grateful to the nurses of our hospital for their valuable support.
Conflict of interest
The authors declare that the research was conducted in the absence of any commercial or financial relationships that could be construed as a potential conflict of interest.
Publisher’s note
All claims expressed in this article are solely those of the authors and do not necessarily represent those of their affiliated organizations, or those of the publisher, the editors and the reviewers. Any product that may be evaluated in this article, or claim that may be made by its manufacturer, is not guaranteed or endorsed by the publisher.
References
1. Stephen F. Polycystic ovary syndrome. N Engl J Med. (1995) 333:9. doi: 10.1056/NEJM199511233332123
2. March WA, Moore VM, Willson KJ, Phillips DIW, Norman RJ, Davies MJ. The prevalence of polycystic ovary syndrome in a community sample assessed under contrasting diagnostic criteria. Hum Reprod. (2010) 25:544–51. doi: 10.1093/humrep/dep399
3. Bozdag G, Mumusoglu S, Zengin D, Karabulut E, Yildiz BO. The prevalence and phenotypic features of polycystic ovary syndrome: a systematic review and meta-analysis. Hum Reprod. (2016) 31:2841–55. doi: 10.1093/humrep/dew218
4. Legro RS, Kunselman AR, Dunaif A. Prevalence and predictors of dyslipidemia in women with polycystic ovary syndrome. Am J Med. (2001) 111:607–13. doi: 10.1016/S0002-9343(01)00948-2x
5. Lim SS, Kakoly NS, Tan JWJ, Fitzgerald G, Bahri Khomami M, Joham AE, et al. Metabolic syndrome in polycystic ovary syndrome: a systematic review, meta-analysis and meta-regression: Metabolic syndrome in PCOS. Obes Rev. (2019) 20:339–52. doi: 10.1111/obr.12762
6. Osibogun O, Ogunmoroti O, Michos ED. Polycystic ovary syndrome and cardiometabolic risk: Opportunities for cardiovascular disease prevention. Trends Cardiovasc Med. (2020) 30:399–404. doi: 10.1016/j.tcm.2019.08.010
7. Legro RS, Kunselman AR, Dodson WC, Dunaif A. Prevalence and predictors of risk for type 2 diabetes mellitus and impaired glucose tolerance in polycystic ovary syndrome: a prospective, controlled study in 254 affected women. J Clin Endocrinol Metab. (1999) 84:165–9. doi: 10.1210/jcem.84.1.5393
8. Barry JA, Azizia MM, Hardiman PJ. Risk of endometrial, ovarian and breast cancer in women with polycystic ovary syndrome: a systematic review and meta-analysis. Hum Reprod Update. (2014) 20:748–58. doi: 10.1093/humupd/dmu012
9. Johnson RJ, Lanaspa MA, Gaucher EA. Uric acid: A danger signal from the RNA world that may have a role in the epidemic of obesity, metabolic syndrome, and cardiorenal disease: evolutionary considerations. Semin Nephrology. (2011) 31:394–9. doi: 10.1016/j.semnephrol.2011.08.002
10. Messerli FH, Frohlich ED, Dreslinski GR, Suarez DH, Aristimuno GG. Serum uric acid in essential hypertension: an indicator of renal vascular involvement. Ann Internal Med. (1980) 93(6):817–21. doi: 10.7326/0003-4819-93-6-817
11. Luque-Ramirez M, Alvarez-Blasco F, Uriol Rivera MG, Escobar-Morreale HF. Serum uric acid concentration as non-classic cardiovascular risk factor in women with polycystic ovary syndrome: effect of treatment with ethinyl-estradiol plus cyproterone acetate versus metformin. Hum Reproduction. (2008) 23:1594–601. doi: 10.1093/humrep/den095
12. Dehghan A, van Hoek M, Sijbrands EJG, Hofman A, Witteman JCM. High serum uric acid as a novel risk factor for type 2 diabetes. Diabetes Care. (2008) 31:361–2. doi: 10.2337/dc07-1276
13. Bonora E, Targher G, Zenere MB, Saggiani F, Cacciatori V, Tosi F, et al. Relationship of uric acid concentration to cardiovascular risk factors in young men. Role of obesity and central fat distribution. The Verona Young Men Atherosclerosis Risk Factors Study. Int J Obes Relat Metab Disord. (1996) 20:975–80.
14. Rotterdam ESHRE/ASRM-Sponsored PCOS Consensus Workshop Group. Revised 2003 consensus on diagnostic criteria and long-term health risks related to polycystic ovary syndrome. Fertil Steril. (2004) 81:19–25. doi: 10.1016/j.fertnstert.2003.10.004
15. Levey AS, Stevens LA, Schmid CH, Zhang YL, Castro AF 3rd, Feldman HI, et al. A new equation to estimate glomerular filtration rate. Ann Intern Med. (2009) 150:604–12. doi: 10.7326/0003-4819-150-9-200905050-00006
16. Kramer HM, Curhan G. The association between gout and nephrolithiasis: The National Health and Nutrition Examination Survey III, 1988-1994. Am J Kidney Diseases. (2002) 40:37–42. doi: 10.1053/ajkd.2002.33911
17. Dalbeth N, Merriman TR, Stamp LK. Gout. Lancet. (2016) 388:2039–52. doi: 10.1016/S0140-6736(16)00346-9
18. Chiou WK, Wang MH, Huang DH, Chiu HT, Lee YJ, Lin JD. The relationship between serum uric acid level and metabolic syndrome: differences by sex and age in Taiwanese. J Epidemiol. (2010) 20:219–24. doi: 10.2188/jea.JE20090078
19. Avram Z, Krishnan E. Hyperuricaemia–where nephrology meets rheumatology. Rheumatology. (2008) 47:960–4. doi: 10.1093/rheumatology/ken070
20. Zhao Y, Fu L, Li R, Wang LN, Yang Y, Liu NN, et al. Metabolic profiles characterizing different phenotypes of polycystic ovary syndrome: plasma metabolomics analysis. BMC Med. (2012) 10:153. doi: 10.1186/1741-7015-10-153
21. Adamopoulos D, Vlassopoulos C, Seitanides B, Contoyiannis P, Vassilopoulos P. The relationship of sex steroids to uric acid levels in plasma and urine. Acta Endocrinol (Copenh). (1977) 85:198–208. doi: 10.1530/acta.0.0850198
22. Fukai S, Akishita M, Miyao M, Ishida K, Toba K, Ouchi Y. Age-related changes in plasma androgen levels and their association with cardiovascular risk factors in male Japanese office workers. Geriatr Gerontol Int. (2010) 10:32–9. doi: 10.1111/j.1447-0594.2009.00552.x
23. Mu L, Pan J, Yang L, Chen Q, Chen Y, Teng Y, et al. Association between the prevalence of hyperuricemia and reproductive hormones in polycystic ovary syndrome. Reprod Biol Endocrinol. (2018) 16:104. doi: 10.1186/s12958-018-0419-x
24. Wan H, Zhang K, Wang Y, Chen Y, Zhang W, Xia F, et al. The associations between gonadal hormones and serum uric acid levels in men and postmenopausal women with diabetes. Front Endocrinol. (2020) 11:55. doi: 10.3389/fendo.2020.00055
25. De Sousa G, Brodoswki C, Kleber M, Wunsch R, Reinehr T. Association between androgens, intima-media thickness and the metabolic syndrome in obese adolescent girls: Androgens and metabolic syndrome. Clin Endocrinology. (2009) 72:770–4. doi: 10.1111/j.1365-2265.2009.03710.x
26. Marinello E, Leoncini R, Terzuoli L, Vannoni D, Porcelli B, Resconi G. Effect of testosterone on purine nucleotide metabolism in rat liver. Horm Metab Res. (2004) 36:614–9. doi: 10.1055/s-2004-825923
27. Hosoyamada M, Takiue Y, Shibasaki T, Saito H. The effect of testosterone upon the urate reabsorptive transport system in mouse kidney. Nucleosides Nucleotides Nucleic Acids. (2010) 29:574–9. doi: 10.1080/15257770.2010.494651
28. Halperin Kuhns VL, Woodward OM. Sex differences in urate handling. IJMS. (2020) 21:4269. doi: 10.3390/ijms21124269
29. Pizzichini M, Di Stefano A, Resconi G, Pompucci G, Marinello E. Influence of testosterone on purine nucleotide turnover in rat kidney. Horm Metab Res. (1990) 22:334–8. doi: 10.1055/s-2007-1004914
30. Modan M, Halkin H, Karasik A, Lusky A. Elevated serum uric acid ? a facet of hyperinsulinaemia. Diabetologia. (1987) 30:713–8. doi: 10.1007/BF00296994
31. Facchini F, Chen YD, Hollenbeck CB, Reaven GM. Relationship between resistance to insulin-mediated glucose uptake, urinary uric acid clearance, and plasma uric acid concentration. JAMA. (1991) 266:3008–11. doi: 10.1001/jama.266.21.3008
32. Choi HK, Ford ES. Haemoglobin A1c, fasting glucose, serum C-peptide and insulin resistance in relation to serum uric acid levels–the Third National Health and Nutrition Examination Survey. Rheumatology. (2008) 47:713–7. doi: 10.1093/rheumatology/ken066
33. Enomoto A, Kimura H, Chairoungdua A, Shigeta Y, Jutabha P, Cha SH, et al. Molecular identification of a renal urate–anion exchanger that regulates blood urate levels. Nature. (2002) 417:447–52. doi: 10.1038/nature742
34. Herman JB, Goldbourt U. Uric acid and diabetes: observations in a population study. Lancet. (1982) 2:240–3. doi: 10.1016/s0140-6736(82)90324-5
35. Oberbach A, Neuhaus J, Schlichting N, Kugler J, Baumann S, Till H. Sleeve gastrectomy reduces xanthine oxidase and uric acid in a rat model of morbid obesity. Surg Obes Related Diseases. (2014) 10:684–90. doi: 10.1016/j.soard.2013.12.010
36. Lanaspa MA, Sanchez-Lozada LG, Choi YJ, Cicerchi C, Kanbay M, Roncal-Jimenez CA, et al. Uric acid induces hepatic steatosis by generation of mitochondrial oxidative stress. J Biol Chem. (2012) 287:40732–44. doi: 10.1074/jbc.M112.399899
37. Mumford SL, Dasharathy SS, Pollack AZ, Perkins NJ, Mattison DR, Cole SR, et al. Serum uric acid in relation to endogenous reproductive hormones during the menstrual cycle: findings from the BioCycle study. Hum Reproduction. (2013) 28:1853–62. doi: 10.1093/humrep/det085
Keywords: polycystic ovary syndrome, hyperuricemia, hyperandrogenism, dyslipidemia, insulin resistance
Citation: Gong Z, Sun Y, Zhang L, Zhu X and Shi Y (2024) The positive association between hyperuricemia and polycystic ovary syndrome and analysis of related factors. Front. Endocrinol. 15:1356859. doi: 10.3389/fendo.2024.1356859
Received: 16 December 2023; Accepted: 22 May 2024;
Published: 12 June 2024.
Edited by:
Naguib Bin Salleh, University of Malaya, MalaysiaReviewed by:
Leandro Martin Velez, University of California, Irvine, United StatesLang Qin, Sichuan University, China
Copyright © 2024 Gong, Sun, Zhang, Zhu and Shi. This is an open-access article distributed under the terms of the Creative Commons Attribution License (CC BY). The use, distribution or reproduction in other forums is permitted, provided the original author(s) and the copyright owner(s) are credited and that the original publication in this journal is cited, in accordance with accepted academic practice. No use, distribution or reproduction is permitted which does not comply with these terms.
*Correspondence: Yingli Shi, shiyingli@fudan.edu.cn; Xiaoyong Zhu, zhuxiaoyong@fudan.edu.cn
†ORCID: Xiaoyong Zhu, orcid.org/0000-0002-2512-9703
Yingli Shi, orcid.org/0000-0002-7595-6678
Zhentao Gong, orcid.org/0000-0002-1664-3612