
95% of researchers rate our articles as excellent or good
Learn more about the work of our research integrity team to safeguard the quality of each article we publish.
Find out more
ORIGINAL RESEARCH article
Front. Endocrinol. , 02 February 2024
Sec. Cancer Endocrinology
Volume 15 - 2024 | https://doi.org/10.3389/fendo.2024.1333284
This article is part of the Research Topic New Insights Into Prostate Cancer: New Biomarkers, Molecular Mechanisms, and Therapeutic Approaches View all 12 articles
 Cecilia Rico-Fuentes1,2Edgar Iván López-Pulido1
 Edsaúl Emilio Pérez-Guerrero2
 Marisol Godínez-Rubí3,4
 Julio César Villegas-Pineda2,5Martha Arisbeth Villanueva-Pérez6Erick Sierra-Díaz7
 José Sergio Zepeda-Nuño3
 Ana Laura Pereira-Suárez2,3
 Adrián Ramírez-de-Arellano2*
Prostate cancer (PCa) is the most prevalent cause of death in the male population worldwide. The G Protein-Coupled Estrogen Receptor (GPER) has been gaining relevance in the development of PCa. Hedgehog (Hh) pathway activation is associated with aggressiveness, metastasis, and relapse in PCa patients. To date, no studies have evaluated the crosstalk between the GPER and the Hh pathway along different group grades in PCa. We conducted an analysis of paraffin-embedded tissues derived from patients with different prognostic grade of PCa using immunohistochemistry. Expression and correlation between GPER and glioma associated oncogene homologue (GLI) transcriptional factors in the parenchyma and stroma of PCa tumors were evaluated. Our results indicate that GPER is highly expressed in the nucleus and increases with higher grade groups. Additionally, GPER’s expression correlates with pGLI3 nuclear expression across different grade groups in PCa tissues; however, whether the receptor induces the activation of GLI transcriptional factors, or the latter modulate the expression of GPER is yet to be discovered, as well as the functional consequence of this correlation.
Prostate cancer (PCa) is the most common non-skin malignancy in men and the fifth leading cause of cancer-related mortality worldwide (1). Even though the current treatments are effective, the molecular mechanisms related to metastasis, relapse, and treatment resistance are not fully understood. Elucidating these mechanisms would improve treatments and increase the therapeutic successes among PCa patients. For this reason, it is essential to focus on the molecules associated with this disease and the signaling pathways activated by them. Estrogens are critical hormones that regulate the development of hormone-sensitive tumors and growth disorders (2).
One of the hormonal receptors involved in PCa progression is the G protein-coupled estrogen receptor (GPER), an estradiol-activated receptor which has recently gained relevance in carcinogenesis because it promotes cell migration and invasion (3). Its role in cancer is still controversial; according to some authors GPER is protumoral (4), while others propose it as antitumoral (5), this suggests that the microenvironment might determine the effects and outcome of GPER functions. Indeed, this receptor acts through non-genomic signaling pathways related to cancer, such as mitogen-activated protein kinase (MAPK) (6), phosphoinositide 3-kinase (PI3K)/AKT (7), and hedgehog (Hh) pathway (8) in a cell-dependent manner.
Hh pathway is involved in wound healing, tissue regeneration and cell homeostasis maintenance in adults, its dysregulation is associated with cancer (9–11). Recently, a possible correlation has been suggested between high GPER expression and its overactivation of Hh signals increasing invasiveness and metastatic potential in triple-negative breast cancer (12); however, in PCa disease it has not been elucidated yet. These alterations are mainly mediated by glioma-associated oncogene homologue (GLI) transcriptional factors, which can be activated in a canonical (10) or non-canonical manner (9). GLI1 is a strong activator, whereas GLI3 has an activator/repressor domain, allowing it to act depending on the cellular context (13). Crosstalk with other pathways such as MAPK and PI3K can also activate GLI factors in a non-canonical manner (14). Therefore, GPER and activation of GLI factors probably contribute to the progression of PCa.
Amongst the GLI factors family, GLI1 and GLI3 are essential in various malignancies because they modulate cell self-renewal (15). GLI1 is involved metastatic and hormone refractory PCa (16) whilst GLI3 can either directly activate or repress target genes, including Ptch, Cyclin D, and GLI1 (17) and its hyperactivation promotes growth and migration under depletion of androgens (18). Because the regulated expression of GLI1 and GLI3 is such a fundamental process and since dysregulation of such factors by GPER can contribute to the development and progression of PCa, it is necessary to focus on the underlying carcinogenic processes.
GLI factors are susceptible to posttranslational modifications such as phosphorylation, a phenomenon that modulates many intracellular pathways usually through crosstalk between GPER and EGFR (19). This variation between total and phosphorylated molecules leads to the upregulation of transcription genes involved in cancer invasiveness (20). However, this regulation has yet to be fully understood in PCa disease. The latter highlights the relevance to understand the phosphorylation status of GLI factors in the context of PCa.
Currently, there is a lack of information regarding the regulation that GPER exerts over GLI transcriptional factors in the context of cancer. A report suggests that an increase expression of GPER correlates with decreased nuclear GLI1 expression and unfavorable prognosis in breast cancer (21). To date, there is no evidence for a possible regulation of GLI3 by GPER. Thus, further research on the interaction between GPER and GLI transcriptional factors is needed to fully understand the mechanism involved.
Therefore, this work aimed to evaluate whether the expression of GPER in parenchyma and stromal tumor cells of PCa samples is associated with the expression and phosphorylation of GLI transcriptional factors; as well as to analyze if the expression of such factors changes according to the prognostic categories (grade groups).
We studied paraffin-embedded tissues derived from patients with different prognostic grade of PCa and that had been examined and archived at the Pathology and Nephropathology, Diagnosis and Research Center. Upon verification of the diagnosis and prognostics categories (group grades), the samples were transported to our laboratory and classified in four grade groups labelled 2,3,4, and 5 as follows: GS 7 (3 + 4) (N=9), GS 7 (4 + 3) (N=18), GS 8 (4 + 4) (N=11) and GS 9 (4 + 5) (N=15). Immunohistochemistry was performed at the Diagnostic Pathology and Immunohistochemistry laboratory at the University of Guadalajara, Mexico.
Formalin-fixed paraffin-embedded blocks of tissue samples were cut into 5µm sections, which were then immunostained with an automated BOND equipment (Leica Biosystems). A rabbit polyclonal primary antibody against GPER from Abcam (Cat. ab41565, Cambridge, UK) was used at a 1:200 dilution, followed by 15 minutes of incubation with EDTA buffer. GLI1 and pGLI1 from Santa Cruz (Cat.sc515781) and Biorbyt (Cat.orb503729), respectively, were used at a 1:100 dilution, followed by an incubation step with EDTA buffer for 15 minutes for GLI and 30 minutes for pGLI1. Finally, GLI3 from Santa Cruz (Cat.sc74478) and pGLI3 from Affinity Biosciences (Cat. AF7449) were used at a 1:100 dilution with 30 minutes of incubation with EDTA buffer and 30 minutes of incubation with citrate buffer, respectively. Diamond diluent from Cell Marque™ Tissue Diagnostics (Cat. 938B-05) and a DAB kit from Leica Biosystems, (Cat. DS9800) were used as antibody buffer and for detection, respectively.
The immunohistochemical analysis was performed with and Axioskop 2 plus light microscope (Carl Zeiss, Germany) coupled to a digital camera Coolsnap (Photometrics, Tucson, USA). Images were documented with Aperio LV1 scanner by Leica Biosystems and the percentage of cell positive analysis was made using Qupath version 0.2.3 software with an image type of brightfield (H-DAB). The analyses focused onto the nuclear and cytoplasmic staining and were performed using cell analysis and positive cell detection with 40x magnification. Measurements were made in parenchyma and stroma of tumor tissues.
The images were analyzed in brightfield (H-DAB) using the Qupath version 0.2.3 software. Initially, the image was adjusted to a scale bar of 80μm or 40X magnification, then the tissue grid was displayed and the area of interest was selected. After that, measure is proceeded by the next sequence: analyze/cell detection/positive cell detection. At this point, intensity threshold parameters are showed and allows you to evaluate different cell compartment with +1, +2 and +3 intensities. The data is provided by the program and recorded in an excel file for analyzed it in a statistical package.
We used the R version 4.1.2. software (22). Comparison of percentage of positive cells between prognostic categories and nuclear or cytoplasmatic expression were performed with two-way ANOVA followed by Bonferroni correction as a post hoc. Differences were considered significant at p-value < 0.05.
The expression of GPER was observed in tumoral and stromal prostate tissues, and its location in both cases predominated in the nucleus; however, it was also evidenced to a lesser extent in the cytoplasm (Figures 1A, C). In PCa tissues, the nuclear expression increased from grade groups 2 to 3 (p<0.05) and remained high in grade groups 4 and 5 samples. Likewise, GPER´s cytoplasmic expression increased significantly from grade groups 2 to 5 (p<0.001) and from grade groups 4 to 5 (p<0.01) in tumoral tissue (Figure 1B). In the stromal tissue, the nuclear expression in all our groups was observed and it did not change significantly throughout the different grade groups (Figure 1C); however, the cytoplasmic expression decreased considerable from grade groups 3 to 4 (p<0.001) while it increased from grade groups 4 to 5 (p<0.01) (Figure 1D).
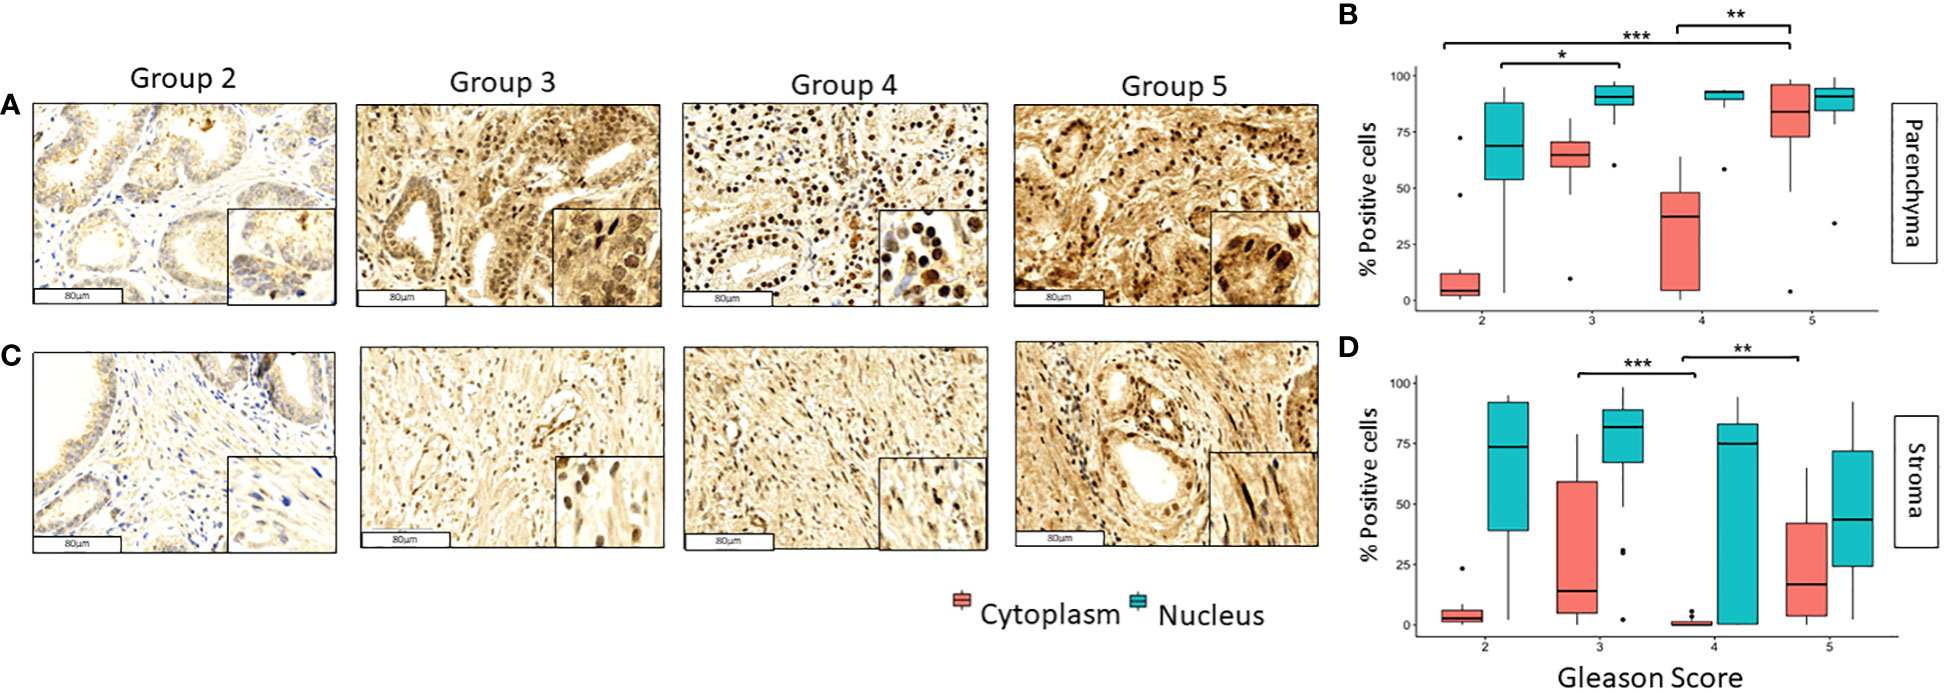
Figure 1 Expression of GPER in tumoral and stromal prostate tissue in different grade groups. Representative images of GPER in the parenchyma (A, B) and stromal (C, D) PCa tumor tissues by immunohistochemistry with HE staining (x200). Scale bar 80 µm. *=p<0.05, **=p<0.01, ***=p<0.001.
GLI1 and pGLI1 were expressed in the nucleus and cytoplasm in both prostate tumor and stromal tissue (Figure 2). GLI1 was mainly expressed in the cytoplasm of tumoral cells, significant differences were found between grade 2 vs 5 in nuclei and cytoplasm of (p<0.05) and p<0.01) respectively (Figures 2A, B). In stromal tissue, GLI1 was expressed in both cellular compartments with no significant changes along the different groups (Figures 2C, D).
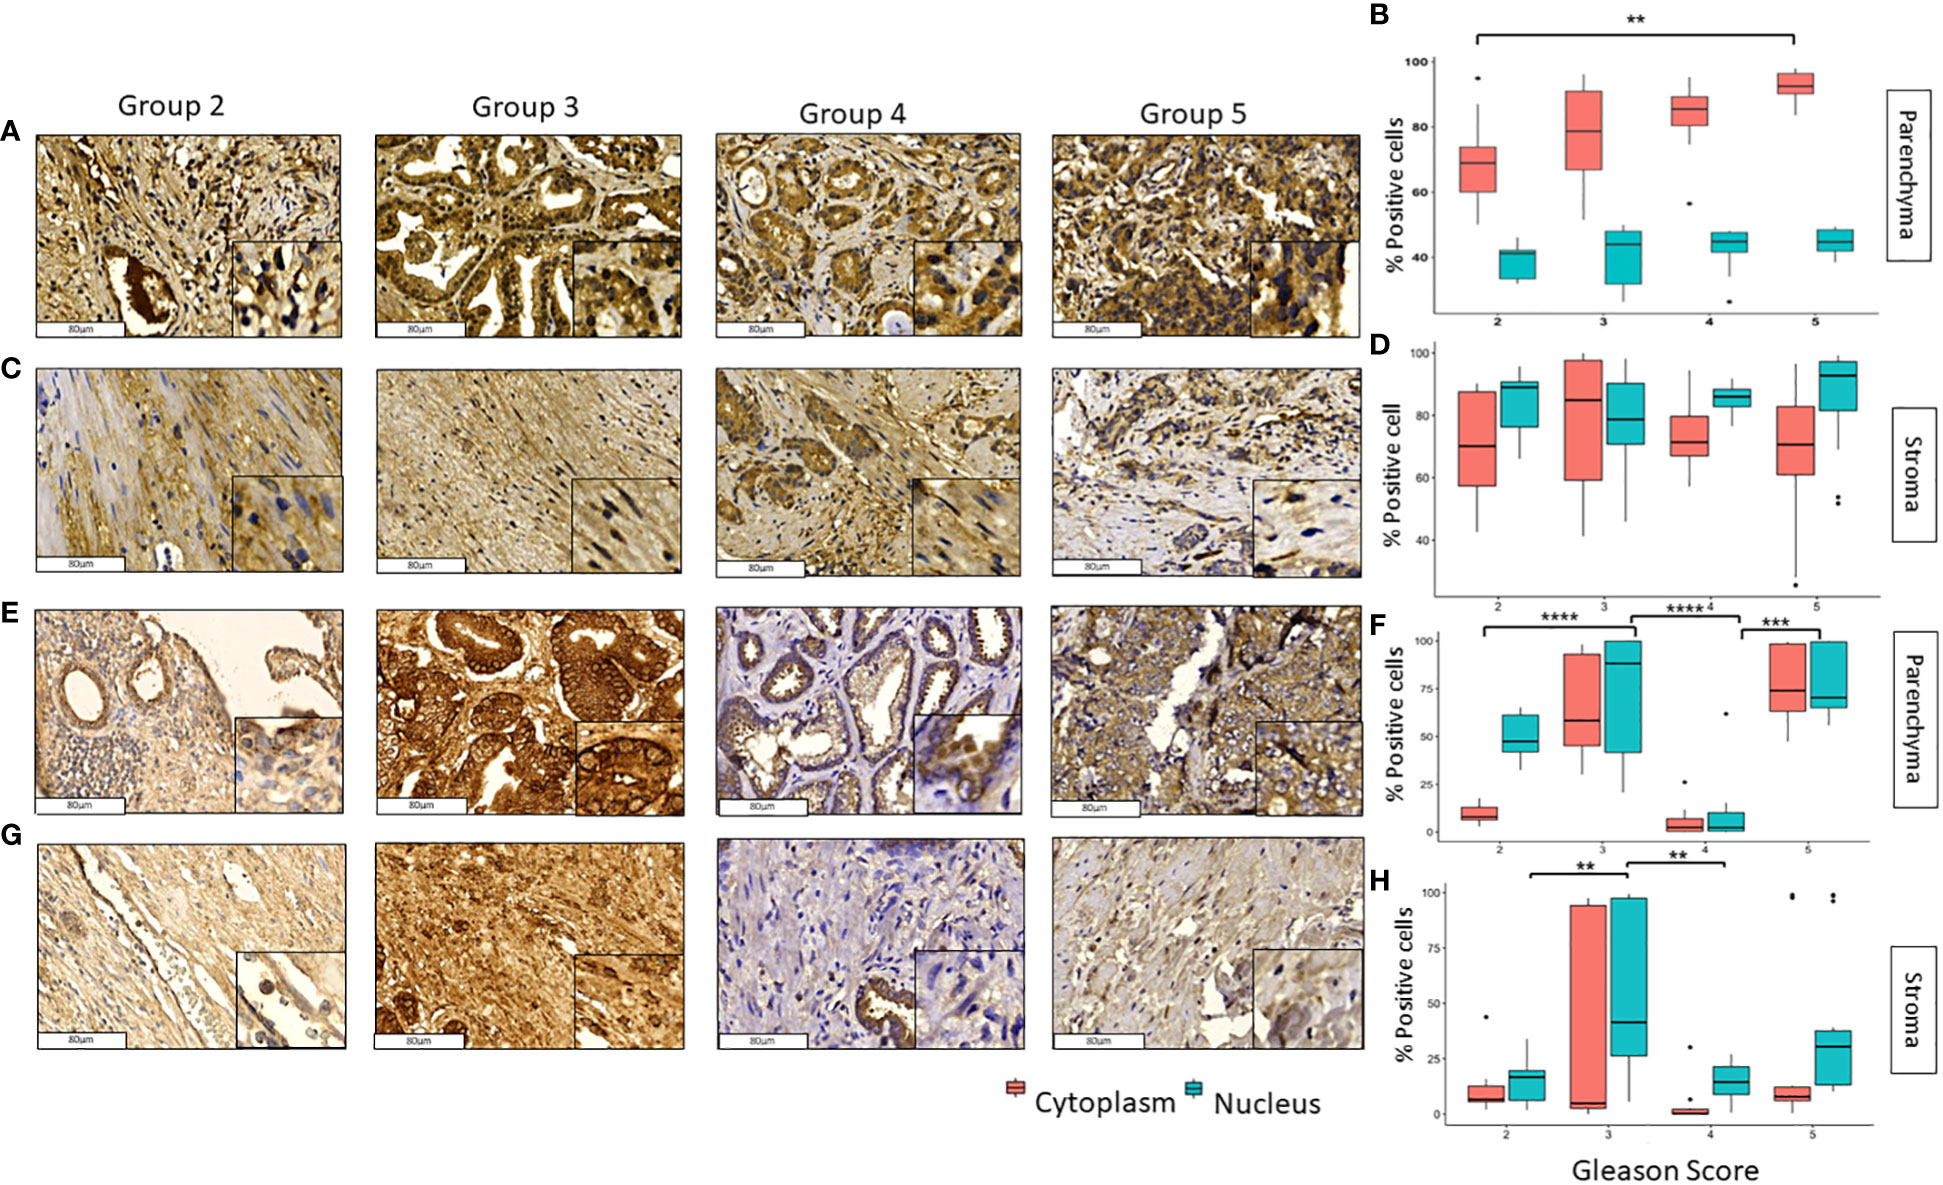
Figure 2 Expression of GLI1 and pGLI1 in tumoral and stromal prostate tissue in different grade groups. Representative images of GLI1 in the parenchyma (A, B) and stromal (C, D) tissues and pGLI1 in the parenchyma (E, F) and stromal (G, H) PCa tumor tissues by immunohistochemistry with HE staining (x200). Scale bar 80 µm. *=p<0.05, **=p<0.01, ***=p<0.001, ****=p<0.0001.
In the case of pGLI1 expression did not follow a pattern either across the grade groups or across tissue type or cellular localization. In tumoral tissues, pGLI1 was mainly expressed in grade groups 3 and 5 in both nucleus and cytoplasm; however, in grade groups 4 its expression was almost null and differed significantly when compared with grade groups 3 and 5 (p<0.0001 and p<0.001) respectively (Figures 2E, F). In stromal tissue, pGLI1 was mainly expressed in the nucleus of Gleason score 3 patients. Significant differences were found between grade groups 2 vs 3 (p<0.01) and 3 vs 4 (p<0.01) in the nuclear expression of pGLI1. No significative changes were observed in the pGLI1´s cytoplasmic expression in the tumoral tissue (Figures 2G, H).
In contrast to the other transcription factors, GLI3 and pGLI3 were lightly observed in the tumoral and stromal tissues (Figure 3). In tumoral tissue, the cytoplasmic expression of GLI3 decreases considerably from grade groups 2 to 5 and 3 to 5 (p<0.0001). The nuclear expression of GLI3 in these samples was low, and no significant changes were observed in the different groups (Figures 3A, B). As for the stromal tissue, GLI3 was absent in practically all group grades with non-significant p values among them (Figures 3C, D). Interestingly, nuclear pGLI3 increased significantly from grade groups 2 vs 3 (p<0.001) and 2 vs 4,5 (p<0.0001) in addition the cytoplasmic expression also increases from grades 2 vs 4 and 3 vs 4 (p<0.0001) (Figures 3E, F). Finally, the expression of pGLI3 decreases significantly from grade groups 3 to 5 (p<0.05) in stromal tissue (Figures 3G, H).
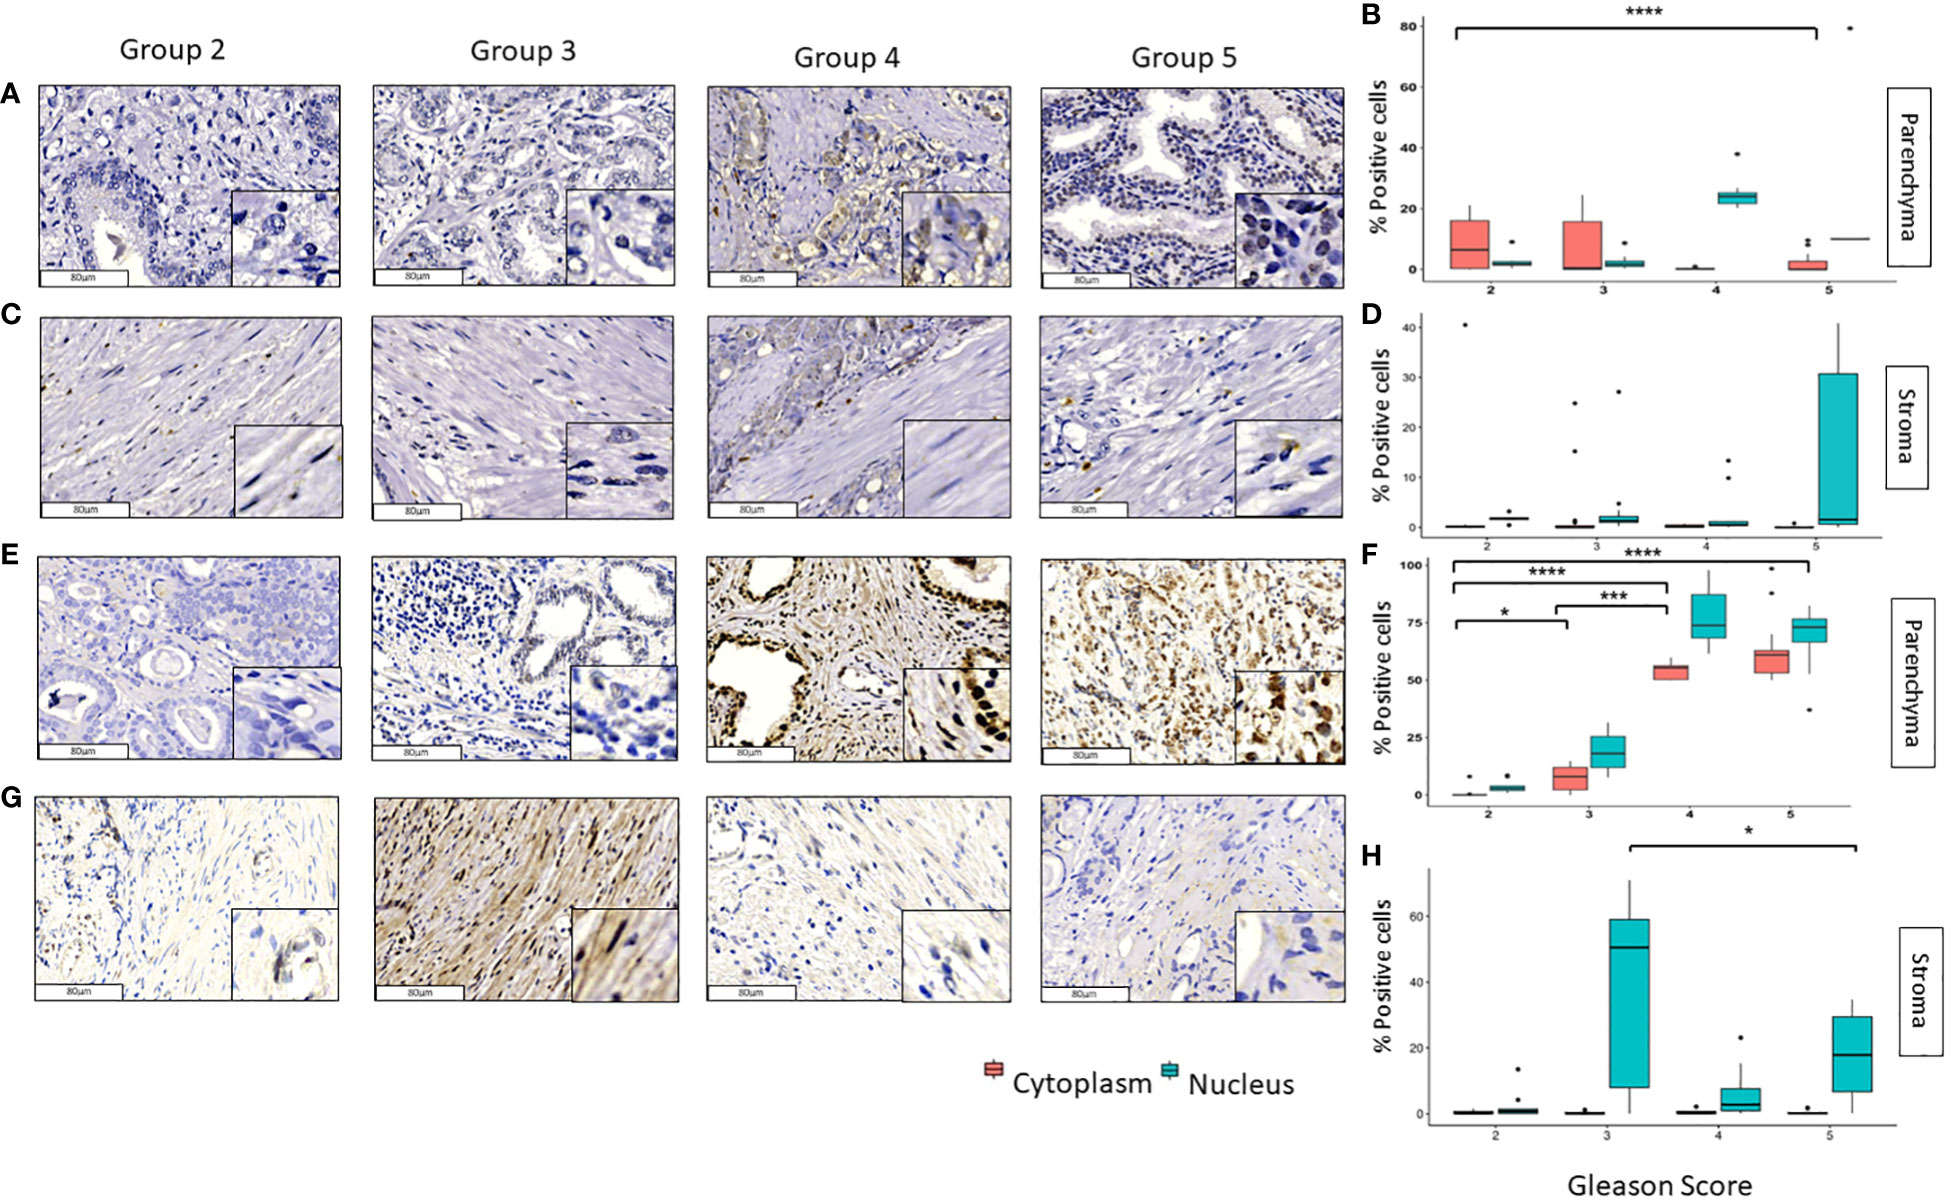
Figure 3 Expression of GLI3 and pGLI3 in tumoral and stromal prostate tissue in different grade groups. Representative images of GLI3 in the parenchyma (A, B) and stromal (C, D) PCa tumor tissues and pGLI3 in the tumoral (E, F) and stromal (G, H) PCa tumor tissues by immunohistochemistry with HE staining (x200). Scale bar 80 µm. *=p<0.05, **=p< 0.01, ***=p<0.001, ****=p<0.0001.
A Pearson correlation revealed that in the tumoral tissue nuclear GPER positively correlates with nuclear pGLI3 (p<0.01) and negatively correlated with nuclear GLI3 (p<0.01). While cytoplasmic GPER positively correlates with cytoplasmic GLI1 and pGLI1 (p<0.01). Furthermore, there was a positive correlation in the expression of GPER vs pGLI1 and pGLI3 in the nuclear localization with a p<0.01 and p<0.001 respectively. Of note, these GLI transcriptional factors (pGLI1 and pGLI3) also correlated with each other (p<0.05). As for the cytoplasmic expression, we found that GLI1 was negatively correlated with GLI3 (p<0.01) whereas nuclear pGLI3 had a positive correlation with pGLI1 (p<0.001) (Figure 4A).
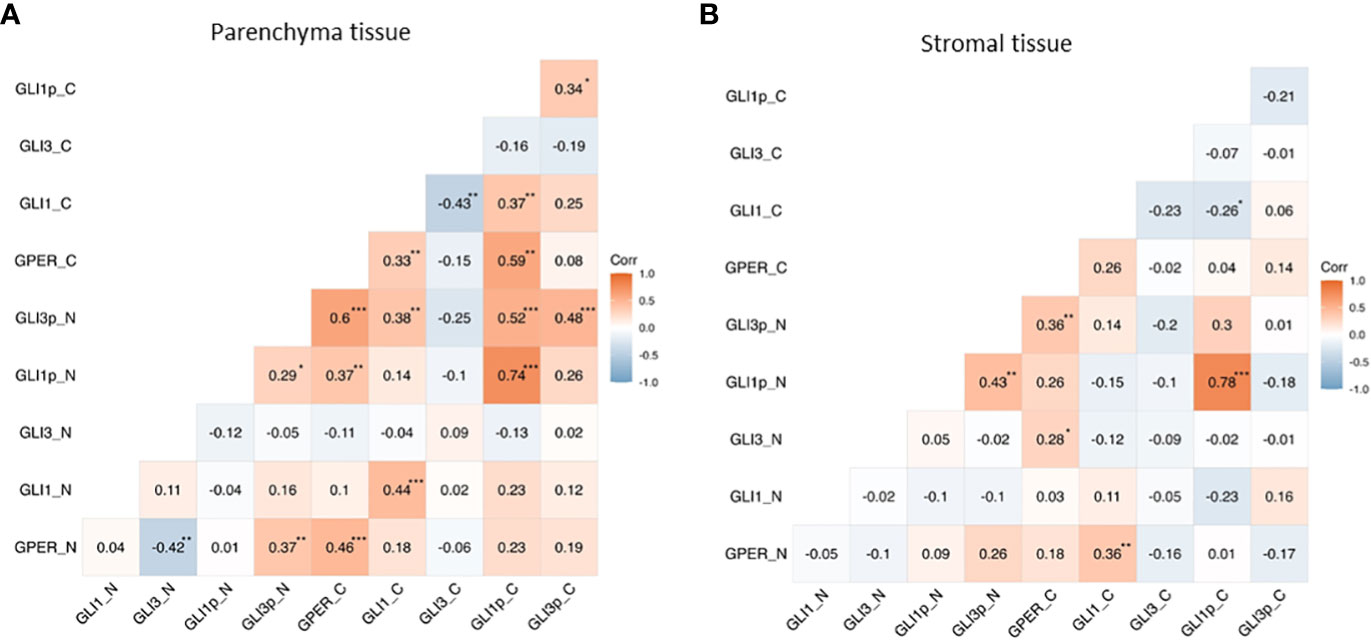
Figure 4 Correlation of GPER and GLI transcriptional factors in nuclear (N) and cytoplasmic (C) expression in the parenchyma and stromal PCa tissues. Heatmaps showing the correlation between the expression of GPER and GLI1, pGLI1, GLI3, and pGLI3 in parenchyma (A) and stromal (B) tissue. *p<0.05, **p<0.01, ***p<0.001.
In stromal tissue, there was a positive correlation between nuclear GPER´s expression and GLI1´s in the cytoplasm (p<0.01). Also, the cytoplasmic expression of GPER was positively correlated with the nuclear pGLI3 (p<0.01). Moreover, nuclear pGLI1 and pGLI3 were positively correlated (p<0.01) (Figure 4B).
PCa is the most common malignancy that impacts men’s health, generating a pathological and molecular challenge in the understanding of the disease. GPER has been identified in parenchymal and stromal cells showing a dual role in proliferation depending on specific site of expression in reproductive tissues and regulates protumorigenic events by the activation of several signaling pathways (23). Hh pathway is a key signaling pathway involved in stemness and associated to relapse and bad prognosis (11) Not much is known about GPER and its regulation of Hh transcriptional factors, nevertheless, this receptor can trigger signaling cascades initiated in plasma membrane (24) leading to a pro-tumorigenic environment that promote angiogenesis (25); however, there is a limited information about biological significance of GPER and relation with Hh pathways in PCa tissue. In this study, we evaluated the expression of GPER and its correlation of GLI factor involved in PCa tissues with different prognostic groups.
Our first result indicates that GPER´s expression remains in nuclear and increase in cytoplasmic compartments as grade groups proceed in tumor parenchyma, this phenomenon is discordant with Rago et al. studies where cytoplasmic GPER expression was highly observed in benign and decreases in prostate intraepithelial neoplasia lesions from Italian patients (26). A possible explanation might be the antibody used in both studies. Different epitopes are recognized by the antibodies, the antibody used in Rago´s research recognized extracellular domain (26) while the one we used can detect a protein ubiquitously expressed 27). Nuclear GPER was also reported by Marco Pupo et al. in breast cancer-associated fibroblasts, they suggest that GPER translocate through an importin-dependent mechanism and upregulated target genes like c-fos and CTGF induce by estrogens (28). Our results can lead to generate future perspectives performing cell fractions, to determine gene expression that GPER is activated in PCa tissues.
GPER may modulate the expression of genes (23) associated to the progression and development of PCa; however, further studies are needed to prove this hypothesis. Thus, targeting this receptor will provide a way to progress to a more precise approach to hormone-related disease detection and management.
Another fact was the presence of GPER expression in cytoplasm in tumoral and stroma PCa tissues, this remains as grade group proceed which agrees with Rago (26) and T Yu (29) studies. Several reports evidence GPER’s modulation on clinical outcome, for instance Rago mentions that low expression of GPER is associated with high expression of pAKT and pCREB involved in cancer relapses (26); on the other hand, Yu et al. published that GPER confers multidrug resistance in CAFs through a cAMP/PKA/CREB dependent manner (29), therefore the expression of GPER is crucial to determine the level of aggressiveness in PCa tissues. Further analyses are required to demonstrate this fact in PCa.
In our results GLI1 full length (GLI1) was expressed mainly in cytoplasmic location in stroma and tumor tissue regardless of the grade group. This agrees with the observations made by Xing Liu et al., research which suggest that suppressor of fused protein (SUFU) has a negative regulation of Hh/GLI signaling activity, which arrests GLI1 proteins in cytoplasm and prevents their translocation to the nucleus (30). Therefore, SUFU protein affects transcription activity in cytoplasmic location (31). To date, still no evidence about correlation or interaction among GPER/SUFU/GLI1 in participation of diseases.
On the other hand, we found GLI1 phosphorylated (pGLI1) in tumor and stroma tissues where the expression was observed mainly in Gleason 7 (4 + 3) and 9 (4 + 5) (grade groups 3 and 5 respectively). Currently there are no reports about the behavior regarding presence and absence of pGLI1 along the different grade groups in prostate cancer tissues; however, pGLI1 is known to activate MAPK-ERK1/2 signaling in a SMO-independent manner that can be induced by stimulation of VEGFA secreted by cancer stromal cells in a paracrine manner in lung adenocarcinoma (13). Therefore, more studies are required to elucidate the importance of GPER/pGLI1 in tumor and stroma tissues.
Finally, we evaluated the expression of GLI3 full length (GLI3) in our samples. Slight expression was found in both compartments throughout grade groups. This was also observed by Diana Trnski et al., concluding that the processing of GLI3 into repressor transcriptional form is due to downregulation of GSK3β therefore cell proliferation decreases in colon cancer (30). Also GLI3 is degraded by proteasome induction of speckle-type POZ protein (SPO) (32) during CRCP androgen deprivation (18). Therefore, SPO and GSK3β are probably involved in downregulation or degradation of GLI3 and promotes tumor aggressiveness in PCa tissues.
Nevertheless, pGLI3 was observed in the nucleus of tumor parenchyma cells and, interestingly, its expression increased as the prognostic grade progresses. A few reports mention that phosphorylation of this transcriptional factor regulates positively (10) and negatively (33) in cancer, due to transactivation domain and the presence of PKA, GSK3β, and βTrCP. Also, it has been reported to directly interact with androgen receptor (AR), leading to its nuclear translocation (9) and consequently activate target genes, such as cyclinD1 and Fgf15 (34).
Due to the latter observations, we decided to evaluate if there was a correlation between the expression of the evaluated molecules. We observed a positive correlation among nuclear and cytoplasmic GPER with pGLI3 in the nuclear localization. Currently, there is no evidence on the regulation that GPER exerts in these compartments, and it needs to be elucidated in PCa disease. GPER is known to modulate several signaling pathways, PI3K/Akt among them, and the crosstalk between this pathway and GLI activation has previously been reported (14). This could stimulate importin-dependent mechanisms and modulate GSK3β, enabling GPER and pGLI3 translocate into the nucleus. Therefore, it would be an important perspective to evaluate the genes activated by GPER and pGLI3 in the PCa disease.
As complementary data, GLI1 and GLI3 had a negative correlation in their cytoplasmic expression in tumoral tissue. Both factors can interact and modulate each other’s activity in cancer cells (9). In PCa it is known that GLI factors are upregulated in presence or absence of androgen, western blots showed that in the presence of AR, GLI3 expression increased in LNCaP cells; however, in the absence of AR GLI1 is predominated. This suggests that hormonal factors and crosstalk from oncogenic signaling pathways affects GLI transcriptional activity in PCa disease (9, 13). This fact has been linked to several non-canonical oncogenic growth signals and demonstrates the contribution of GLI1in differentiation during cancer development (35).
GPER has been involved in the regulatory mechanisms in prostate cancer cells; however, the mechanisms underlying these effects are still not fully understood. In this work, the presence of GPER in the nucleus was observed, and a positive correlation with pGLI3 transcriptional factor was established. Interestingly this correlation is maintained in the different prognostic groups. Whether GPER regulates pGLI3 or vice versa is still yet to be discovered, and further analysis should be conducted to solve this question. In a future direction, it would be interesting to describe the genes these molecules activate; this would light up the path in understanding the antitumoral GPER actions.
The raw data supporting the conclusions of this article will be made available by the authors, without undue reservation.
The studies involving humans were approved by Ethics Committee of the University Center for Health Sciences. The studies were conducted in accordance with the local legislation and institutional requirements. The present investigation was approved by the Ethics Committee of the University Center for Health Sciences (Opinion No. CI-01719), where exemption from informed consent was considered, based on the guidelines stipulated in CIOMS Guideline 10. The following points were taken into consideration: the research could not be conducted without the exemption from informed consent, considering that our retrospective study was based on the collection of remaining samples from pathological diagnosis; there is no risk to the participants in the study, as personal data information was dissociated, and patient identification is not possible. In addition, this research holds significant social and scientific value for the Mexican population under study.
CR-F: Investigation, Writing – original draft. EL-P: Investigation, Writing – review & editing. EP: Formal analysis, Methodology, Writing – review & editing. MG: Formal analysis, Investigation, Methodology, Resources, Supervision, Writing – review & editing. JV-P: Investigation, Methodology, Visualization, Writing – review & editing. MV-P: Methodology, Resources, Writing – review & editing. ES: Resources, Supervision, Visualization, Writing – review & editing. SZ: Methodology, Supervision, Writing – review & editing. AP-S: Conceptualization, Investigation, Resources, Supervision, Visualization, Writing – review & editing. AR-d-A: Conceptualization, Funding acquisition, Investigation, Project administration, Resources, Supervision, Visualization, Writing – review & editing.
The author(s) declare that no financial support was received for the research, authorship, and/or publication of this article.
The authors declare that the research was conducted in the absence of any commercial or financial relationships that could be construed as a potential conflict of interest.
All claims expressed in this article are solely those of the authors and do not necessarily represent those of their affiliated organizations, or those of the publisher, the editors and the reviewers. Any product that may be evaluated in this article, or claim that may be made by its manufacturer, is not guaranteed or endorsed by the publisher.
1. Wang LE, Lu B, He M, Wang Y, Wang Z, Du L. Prostate cancer incidence and mortality: global status and temporal trends in 89 countries from 2000 to 2019. Front Public Health (2022) 10:811044/BIBTEX(February). doi: 10.3389/FPUBH.2022.811044/BIBTEX
2. Bonkhoff H. Estrogen receptor signaling in prostate cancer: implications for carcinogenesis and tumor progression. Prostate (2018) 78:2–10. doi: 10.1002/pros.23446
3. Yang K. Mechanism of GPER Promoting Proliferation, Migration and Invasion of Triple-Negative Breast Cancer Cells through CAF - PubMed (2019). Available at: https://pubmed.ncbi.nlm.nih.gov/31632554/.
4. Lam HM, Ouyang B, Chen J, Ying J, Wang J, Wu CL, et al. Targeting GPR30 with G-1: A new therapeutic target for castration-resistant prostate cancer. Endocrine-Related Cancer (2014) 21(6):903–145. doi: 10.1530/ERC-14-0402
5. Chan Q, Lam H-M, Ng C-F, Lee A, Chan E, Ng H-K, et al. Activation of GPR30 Inhibits the Growth of Prostate Cancer Cells through Sustained Activation of Erk1/2, c-Jun/c-Fos-Dependent Upregulation of P21, and Induction of G2 Cell-Cycle Arrest. Cell Death Differ (2010) 17:1511–23. doi: 10.1038/cdd.2010.20
6. Lau KM, Ma FMT, Xia JT, Chan QKYI, Ng CF, To KAF. Activation of GPR30 stimulates GTP-binding of Gαi1 protein to sustain activation of erk1/2 in inhibition of prostate cancer cell growth and modulates metastatic properties. Exp Cell Res (2017) 350(1):199–2095. doi: 10.1016/j.yexcr.2016.11.022
7. Xie BY, Lv QY, Ning Cc, Yang BY, Shan Ww, Cheng YA, et al. TET1-GPER-PI3K/AKT pathway is involved in insulin-driven endometrial cancer cell proliferation. Biochem Biophys Res Commun (2017) 482(4):857–62. doi: 10.1016/j.bbrc.2016.11.124
8. Luchetti G, Sircar R, Kong JH, Nachtergaele S, Sagner A, Byrne EFX, et al. Cholesterol activates the G-protein coupled receptor smoothened to promote hedgehog signaling. ELife (2016) 5(OCTOBER2016):1–22. doi: 10.7554/ELIFE.20304
9. Li NA, Truong S, Nouri M, Moore J, Nakouzi NA, Lubik AA, et al. Non-canonical activation of hedgehog in prostate cancer cells mediated by the interaction of transcriptionally active androgen receptor proteins with gli3. Oncogene (2018) 37(17):2313–255. doi: 10.1038/S41388-017-0098-7
10. Matissek SJ, Elsawa. SF. GLI3: A mediator of genetic diseases, development and cancer. Cell Communication Signaling (2020) 18(1):1–205. doi: 10.1186/S12964-020-00540-X
11. Niewiadomski P, Niedziółka SM, Markiewicz Ł, Uśpieński T, Baran B, Chojnowska K. Gli proteins: regulation in development and cancer. Cells (2019) 8(2):1475. doi: 10.3390/CELLS8020147
12. Xu T, Ma D, Chen S, Tang R, Yang J, Meng C, et al. High GPER expression in triple-negative breast cancer is linked to pro-metastatic pathways and predicts poor patient outcomes. NPJ Breast Cancer (2022) 8(1):1–11. doi: 10.1038/s41523-022-00472-4
13. Pietrobono S, Gagliardi S, Stecca B. Non-canonical hedgehog signaling pathway in cancer: activation of GLI transcription factors beyond smoothened. Front Genet (2019) 10:556/BIBTEX(JUN). doi: 10.3389/FGENE.2019.00556/BIBTEX
14. Schnidar H, Eberl M, Klingler S, Mangelberger D, Kasper M, Hauser-Kronberger C, et al. Epidermal growth factor receptor signaling synergizes with hedgehog/GLI in oncogenic transformation via activation of the MEK/ERK/JUN pathway. Cancer Res (2009) 69(4):1284–92. doi: 10.1158/0008-5472.CAN-08-2331/654471/P/EPIDERMAL-GROWTH-FACTOR-RECEPTOR-SIGNALING
15. Peng Y-C, Levine CM, Zahid S, Lynette Wilson E, Joyner AL. Sonic hedgehog signals to multiple prostate stromal stem cells that replenish distinct stromal subtypes during regeneration. Proc Natl Acad Sci (2013) 110(51):20611–165. doi: 10.1073/PNAS.1315729110
16. Bushman W. Hedgehog signaling in prostate development, regeneration and cancer. J Dev Biol (2016) 4(4):2–8. doi: 10.3390/JDB4040030
17. Zhou H, Kim S, Ishii S, Boyer TG. Mediator modulates gli3-dependent sonic hedgehog signaling. Mol Cell Biol (2006) 26(23):8667–825. doi: 10.1128/MCB.00443-06/ASSET/476208B7-99C7-43E4-8262-479C5CB99D91/ASSETS/GRAPHIC/ZMB0230664020010.JPEG
18. Burleson M, Deng JJ, Qin T, Duong TM, Yan Y, Gu X, et al. GLI3 is stabilized by SPOP mutations and promotes castration resistance via functional cooperation with androgen receptor in prostate cancer. Mol Cancer Research : MCR (2022) 20(1):62–76. doi: 10.1158/1541-7786.MCR-21-0108
19. Lappano R, De Marco P, De Francesco EM, Chimento A, Pezzi V, Maggiolini M. Cross-talk between GPER and growth factor signaling. J Steroid Biochem Mol Biol (2013) 137(September):50–6. doi: 10.1016/j.jsbmb.2013.03.005
20. Wang Y, Ding Q, Yen CJ, Xia W, Izzo JG, Lang JY, et al. The crosstalk of MTOR/S6K1 and hedgehog pathways. Cancer Cell (2012) 21(3):374–87. doi: 10.1016/J.CCR.2011.12.028
21. Villegas VE, Rondón-Lagos M, Annaratone L, Castellano I, Grismaldo A, Sapino A, et al. Tamoxifen treatment of breast cancer cells: impact on hedgehog/GLI1 signaling. Int J Mol Sci (2016) 17(3):3085. doi: 10.3390/IJMS17030308
22. R Core Team. Language and environment for statistical computing. R Foundation for Statistical Computing Vienna, Austria. (2022). Available at: http://www.Rproject.org/, (Accessed January 13 2022).
23. Arang N, Silvio Gutkind. J. G protein-coupled receptors and heterotrimeric G proteins as cancer drivers. FEBS Lett (2020) 594(24):4201–325. doi: 10.1002/1873-3468.14017
24. Fuentes N, Silveyra P. Estrogen receptor signaling mechanisms. Adv Protein Chem Struct Biol (2019) 116(January):135–70. doi: 10.1016/BS.APCSB.2019.01.001
25. Lappano R, Rigiracciolo D, De Marco P, Avino S, Cappello AR, Rosano C, et al. Recent advances on the role of G protein-coupled receptors in hypoxia-mediated signaling. AAPS J (2016) 18(2):305–105. doi: 10.1208/s12248-016-9881-6
26. Rago V, Romeo F, Giordano F, Ferraro A, Carpino A. Identification of the G protein-coupled estrogen receptor (GPER) in human prostate: expression site of the estrogen receptor in the benign and neoplastic gland. Andrology (2016) 4(1):121–27. doi: 10.1111/andr.12131
27. Anti-G-Protein Coupled Receptor 30 Antibody (Ab39742) | Abcam (n.). Available at: https://www.abcam.com/g-protein-coupled-receptor-30-antibody-ab39742.html (Accessed February 15, 2023).
28. Pupo M, Vivacqua A, Perrotta I, Pisano A, Aquila S, Abonante S, et al. The nuclear localization signal is required for nuclear GPER translocation and function in breast cancer-associated fibroblasts (CAFs). Mol Cell Endocrinol (2013) 376(1–2):23–32. doi: 10.1016/J.MCE.2013.05.023
29. Yu T, Yang G, Hou Y, Tang X, Wu C, Wu XA, et al. Cytoplasmic GPER translocation in cancer-associated fibroblasts mediates CAMP/PKA/CREB/glycolytic axis to confer tumor cells with multidrug resistance. Oncogene (2017) 36(15):2131–45. doi: 10.1038/ONC.2016.370
30. Trnski D, Sabol M, Gojević A, Martinić M, Ozretić P, Musani V, et al. GSK3β and gli3 play a role in activation of hedgehog-gli pathway in human colon cancer — Targeting GSK3β Downregulates the signaling pathway and reduces cell proliferation. Biochim Biophys Acta (BBA) - Mol Basis Dis (2015) 12):2574–84. doi: 10.1016/J.BBADIS.2015.09.005
31. Ramaswamy B, Lu Y, Teng KY, Nuovo G, Li X, Shapiro CL, et al. Hedgehog signaling is a novel therapeutic target in tamoxifen-resistant breast cancer aberrantly activated by PI3K/AKT pathway. Cancer Res (2012) 72(19):5048–595. doi: 10.1158/0008-5472.CAN-12-1248
32. Wang C, Pan Y, Wang B. Suppressor of fused and spop regulate the stability, processing and function of gli2 and gli3 full-length activators but not their repressors. Dev (Cambridge England) (2010) 137(12):2001–95. doi: 10.1242/DEV.052126
33. Rodrigues MFS, Miguita L, De Andrade NP, Heguedusch D, Rodini CO, Moyses RA, et al. GLI3 knockdown decreases stemness, cell proliferation and invasion in oral squamous cell carcinoma. Int J Oncol (2018) 53(6):2458–725. doi: 10.3892/IJO.2018.4572/HTML
34. Wilson SL, Wilson JP, Wang C, Wang B, Mcconnell SK. Primary cilia and gli3 activity regulate cerebral cortical size. Dev Neurobiol (2012) 72(9):1196–12125. doi: 10.1002/DNEU.20985
Keywords: prostate cancer, GPER, GLI1, GLI3, hedgehog, prognostic categories
Citation: Rico-Fuentes C, López-Pulido EI, Pérez-Guerrero EE, Godínez-Rubí M, Villegas-Pineda JC, Villanueva-Pérez MA, Sierra-Díaz E, Zepeda-Nuño JS, Pereira-Suárez AL and Ramírez-de-Arellano A (2024) Positive correlation between the nuclear expression of GPER and pGLI3 in prostate cancer tissues from patients with different Gleason scores. Front. Endocrinol. 15:1333284. doi: 10.3389/fendo.2024.1333284
Received: 05 November 2023; Accepted: 11 January 2024;
Published: 02 February 2024.
Edited by:
Anna Perri, Magna Græcia University of Catanzaro, ItalyReviewed by:
Anna Kotulak-Chrząszcz, Medical University of Gdansk, PolandCopyright © 2024 Rico-Fuentes, López-Pulido, Pérez-Guerrero, Godínez-Rubí, Villegas-Pineda, Villanueva-Pérez, Sierra-Díaz, Zepeda-Nuño, Pereira-Suárez and Ramírez-de-Arellano. This is an open-access article distributed under the terms of the Creative Commons Attribution License (CC BY). The use, distribution or reproduction in other forums is permitted, provided the original author(s) and the copyright owner(s) are credited and that the original publication in this journal is cited, in accordance with accepted academic practice. No use, distribution or reproduction is permitted which does not comply with these terms.
*Correspondence: Adrián Ramírez-de-Arellano, YWRyaWFuLnJhbWlyZXpAYWNhZGVtaWNvcy51ZGcubXg=
Disclaimer: All claims expressed in this article are solely those of the authors and do not necessarily represent those of their affiliated organizations, or those of the publisher, the editors and the reviewers. Any product that may be evaluated in this article or claim that may be made by its manufacturer is not guaranteed or endorsed by the publisher.
Research integrity at Frontiers
Learn more about the work of our research integrity team to safeguard the quality of each article we publish.