 Haoshuang Liu
 Jingfeng Chen
 Qian Qin
 Su Yan
 Youxiang Wang
 Jiaoyan Li
 Suying Ding
95% of researchers rate our articles as excellent or good
Learn more about the work of our research integrity team to safeguard the quality of each article we publish.
Find out more
ORIGINAL RESEARCH article
Front. Endocrinol. , 27 February 2024
Sec. Translational and Clinical Endocrinology
Volume 15 - 2024 | https://doi.org/10.3389/fendo.2024.1321922
Objective: The purpose of this manuscript is to identify longitudinal trajectories of changes in triglyceride glucose (TyG) index and investigate the association of TyG index trajectories with risk of lean nonalcoholic fatty liver disease (NAFLD).
Methods: Using data from 1,109 participants in the Health Management Cohort longitudinal study, we used Latent Class Growth Modeling (LCGM) to develop TyG index trajectories. Using a Cox proportional hazard model, the relationship between TyG index trajectories and incident lean NAFLD was analyzed. Restricted cubic splines (RCS) were used to visually display the dose-response association between TyG index and lean NAFLD. We also deployed machine learning (ML) via Light Gradient Boosting Machine (LightGBM) to predict lean NAFLD, validated by receiver operating characteristic curves (ROCs). The LightGBM model was used to create an online tool for medical use. In addition, NAFLD was assessed by abdominal ultrasound after excluding other liver fat causes.
Results: The median age of the population was 46.6 years, and 440 (39.68%) of the participants were men. Three distinct TyG index trajectories were identified: “low stable” (TyG index ranged from 7.66 to 7.71, n=206, 18.5%), “moderate stable” (TyG index ranged from 8.11 to 8.15, n=542, 48.8%), and “high stable” (TyG index ranged from 8.61 to 8.67, n=363, 32.7%). Using a “low stable” trajectory as a reference, a “high stable” trajectory was associated with an increased risk of lean-NAFLD (HR: 2.668, 95% CI: 1.098-6.484). After adjusting for baseline age, WC, SBP, BMI, and ALT, HR increased slightly in “moderate stable” and “high stable” trajectories to 1.767 (95% CI:0.730-4.275) and 2.668 (95% CI:1.098-6.484), respectively. RCS analysis showed a significant nonlinear dose-response relationship between TyG index and lean NAFLD risk (χ2 = 11.5, P=0.003). The LightGBM model demonstrated high accuracy (Train AUC 0.870, Test AUC 0.766). An online tool based on our model was developed to assist clinicians in assessing lean NAFLD risk.
Conclusion: The TyG index serves as a promising noninvasive marker for lean NAFLD, with significant implications for clinical practice and public health policy.
● NAFLD can occur in lean individuals and is often associated with low awareness in the general population.
● Patients with lean NAFLD have worse outcomes than the general NAFLD population.
● Development of newer marker targets for lean NAFLD patients for use in future trials.
Nonalcoholic fatty liver disease (NAFLD) is the most prevalent chronic liver disease worldwide and increases the risk of atherosclerosis, cardiovascular disease (CVD), liver cirrhosis, and liver cancer (1). Obesity is a key factor in NAFLD (2). Most mathematical prediction models for NAFLD/NASH are based on obesity and diabetes prevalence (3). 10–20% (4)of NAFLD patients who are neither overweight nor obese (BMI< 25 kg/m2 or< 23 kg/m2 in Asians) have “lean NAFLD”. Lean NAFLD is a primary source of cryptogenic liver disease (5), and lean people with NAFLD are more likely to have impaired glucose tolerance, hypertension, metabolic syndrome, and cardiovascular mortality (6). Therefore, early detection of patients at risk for lean NAFLD in a simple and effective manner is critical. However, the pathogenesis of lean NAFLD remains uncertain.
As the gold standard for diagnosing lean NAFLD, histopathological examination of liver biopsy has various limitations, such as invasiveness, poor acceptability, and a higher cost (7). Therefore, a non-invasive diagnostic approach for lean NAFLD is urgently needed. The combination of serum markers and other indicators is valuable for screening diseases due to their convenience, low cost and accurate diagnosis. Insulin resistance (IR) is involved in the pathogenesis and progression of lean NAFLD (8). Homeostatic model assessment for IR (HOMA-IR) is widely utilized in IR-related disorders and is the gold standard for diagnosing lean NAFLD (9). The triglyceride glucose (TyG) index has been described as a reliable and simple surrogate for measuring IR and as having substantial relevance in metabolic disorders such as NAFLD (10). However, most of these studies use a single TyG index measure to predict lean NAFLD risk, which omits a possible variability in TyG index trajectories over time.
Machine learning (ML), an emerging component of artificial intelligence, is gradually being implemented in the analysis of healthcare data. It serves as an influential tool for assisting the clinical decision-making process (11, 12). A statistical and comprehensive review of ML in medical diagnosis by Swanson et al. shows that ML technologies help medical professionals reduce diagnostic errors, improve health care delivery, and reduce treatment costs (13). Therefore, we conducted a lean NAFLD cohort study to capture longitudinal TyG index change trajectories from 2017 to 2019 and analyze the association between TyG index change trajectories and lean NAFLD risk through 2020.
We use an ML model to combine TyG index with common clinical features and predict the probability of patients with lean NAFLD. Subsequently, we developed a web-based calculator using the LightGBM model. This predictive tool can help physicians assess the risk of lean NAFLD patients and devise personalized medical strategies while optimizing the allocation of medical resources. In addition, we assessed the dose-response relationship between TyG index change trajectories and lean NAFLD risk. This study would suggest that TyG index trajectories over time may provide important clues to the development of lean NAFLD and a basis for health management and risk communication in primary care practices.
At the Health Management Center of the First Affiliated Hospital of Zhengzhou University, 7,818 individuals aged between 18 and 98 underwent health checks between 2017 and 2019. If a participant had liver ultrasound at baseline and at follow-up, they were recruited into the trial, and information about their medical history and medication use was collected. The following were the criteria for exclusion (1): aged< 18 years (n=24); (2) NAFLD diagnosis in 2017–2019 (n=2,346); (3) BMI ≥ 23 kg/m2 (n=2,541); (4) men and women who drink more than 10 and 20 grammes of alcohol daily, respectively (n=839); (5) history of fatty liver disease (n=138); (6) history of cancer or autoimmune disease (n=19); (7) usage of medications to reduce cholesterol, blood pressure (BP), blood sugar, or uric acid levels (n=516); and (8) less than three medical examinations or missing information in relevant variables (n=286). A total of 1,109 participants (441 males and 668 females) met the inclusion and exclusion criteria and were enrolled (Figure 1).
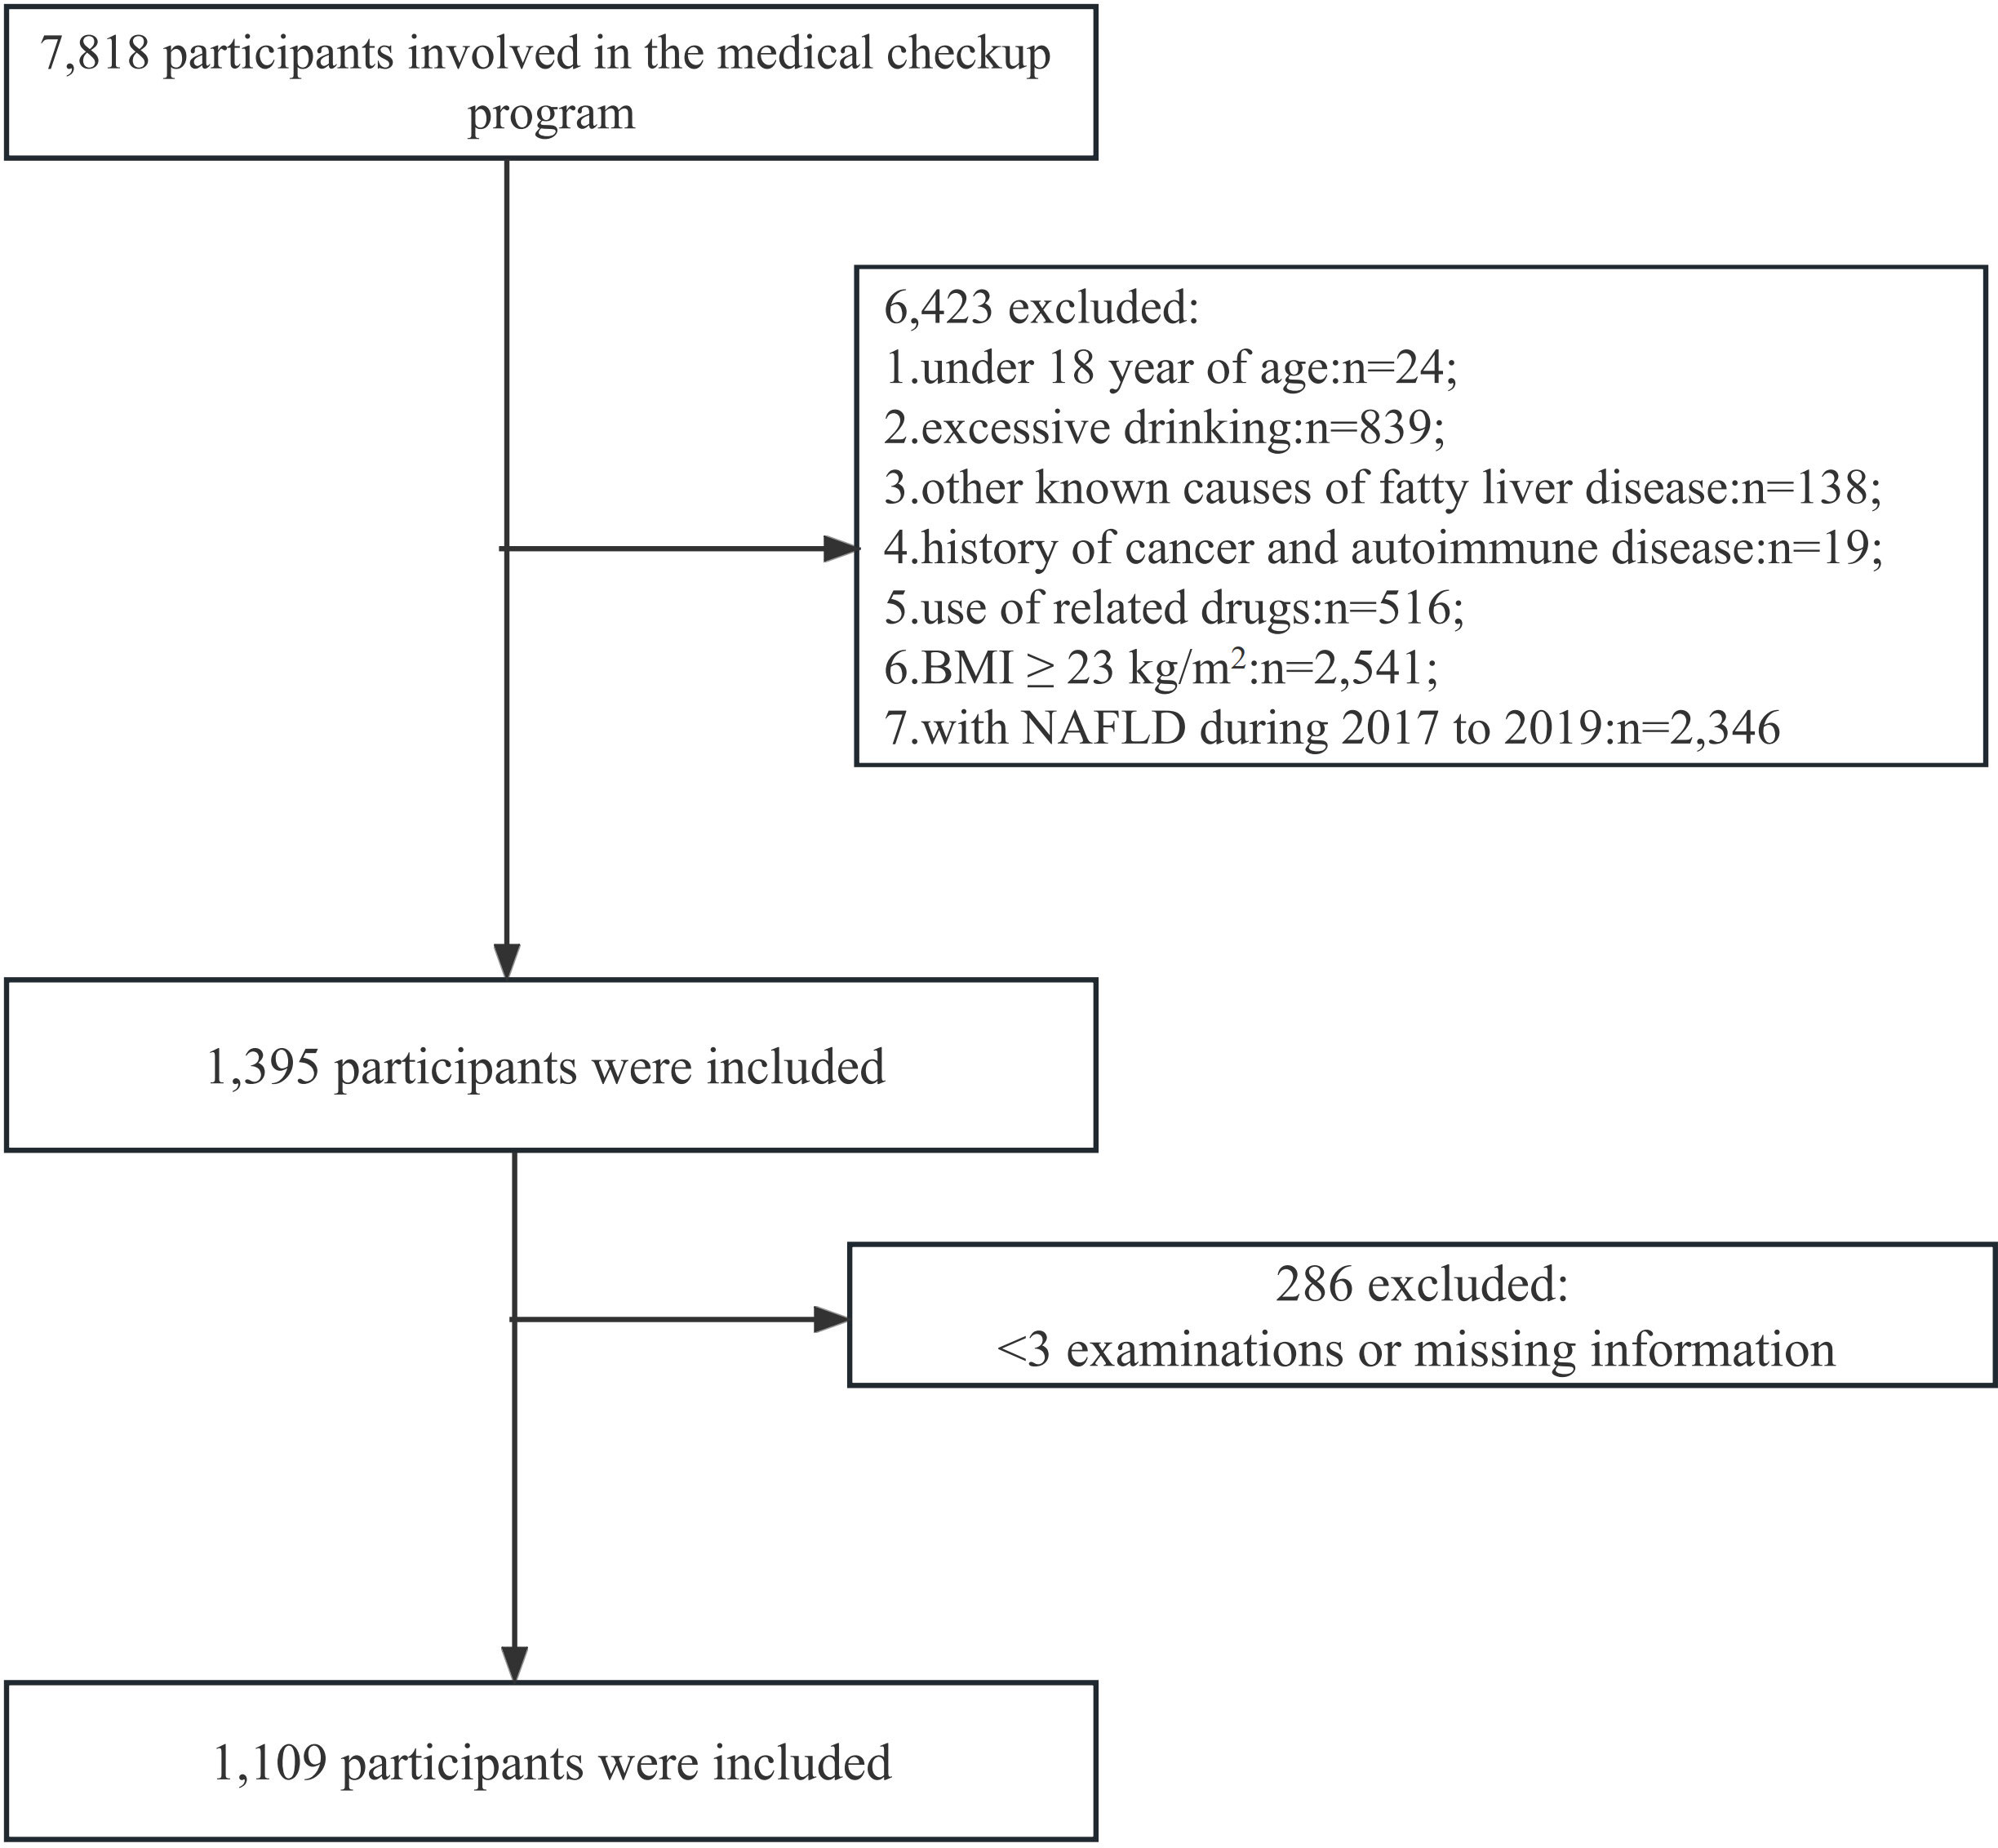
Figure 1 Flow chart of number of participants.
Following the Helsinki Declaration, this study was carried out. The study protocol was approved by the ethics committee of the First Affiliated Hospital of Zhengzhou University, Zhengzhou, China (approval No. 2018−KY−56). Written informed consent was obtained from all participants.
We used two clinical ultrasound systems, ACUSON Oxana2 ultrasonic diagnostic device (Siemens Medical Solutions USA, CA 94043, USA) and 5-12 MHz probe (APLI0500TUS-A500, TOSHIBA, Tokyo, Japan), for direct post-beamform radio frequency (RF) data acquisition provided under research agreements. Three registered diagnostic medical sonographers (each with > 10 years of overall experience) were trained and had several months to 2 years of experience performing the research protocol. Each participant was scanned by one of the three selected sonographers based on scheduling availability and underwent two 15-20-minute exams on the same day. Each exam was performed using a different platform in random order. Between exams, participants took a 5-10-minute break and were repositioned on the gurney. An average of 50 patients are screened per day.
NAFLD was identified using Chinese criteria (14)-(1) enhanced echogenicity in the near field and attenuated echogenicity in the far field of the liver parenchyma; (2) hepatomegaly is characterized by relatively opaque intrahepatic ducts and rounded liver margins; (3) alcohol consumption of ≤ 140 g/week for men and ≤ 70 g/week for women; and (4) lack of other illnesses or disorders, such as viral hepatitis, total parenteral nutrition, hepatomegaly, and drug-related liver disease, which may lead to fatty liver disease. AGA clinical practice recommends the diagnosis of lean NAFLD in individuals with NAFLD and a BMI< 25 kg/m2 (non-Asian race) or< 23 kg/m2 (Asian race) (15). The BMI and TyG indices were calculated using the following formulas (16):
During the physical examination, the patient’s height, weight, waist circumference (WC), systolic blood pressure (SBP), and diastolic blood pressure (DBP) were all measured. Height, weight, and WC were measured with participants dressed in light, thin clothing without shoes. BP was measured on the right arm of seated individuals using electronic sphygmomanometers.
Individuals were sampled following a 12-hour overnight fast. Fasting laboratory analysis included measurements of triglyceride (TG), total cholesterol (TC), low-density lipoprotein (LDL-C), high-density lipoprotein (HDL-C), fasting plasma glucose (FPG), glycated hemoglobin (HbA1c), aspartate aminotransferase (AST), alamine aminotransferase (ALT), γ-glutamyl transpeptidase (GGT), serum uric acid (SUA), hemoglobin (Hb) and white blood cell (WBC). The samples were analyzed using a chemical analyzer (cobas8000, Switzerland) based on enzymatic method at the hospital’s central laboratory. FIB-4 was calculated as age (year) x AST (U/L)/[platelet count (109/L) x √ALT (U/L)] (17). The Fibrotic NASH Index (FNI) can be calculated online (18).
Information on smoking status (current vs. never smokers) and drinking status (current drinkers vs. never drinkers vs. drinking amount) was obtained from self-reported data.
First, descriptive analysis findings are reported as mean ± standard deviation for normally distributed continuous variables, medians (interquartile range) for non-normally distributed continuous variables, and number with percentage frequency for categorical variables. Comparisons of participants’ general characteristics at baseline were assessed using the Student’s t test for normally distributed continuous variables, Mann-Whitney U test for non-normally distributed continuous variables, and Chi-square test for categorical variables. Second, variables with a P value of < 0.05 in univariate time-dependent analysis were included in the Cox multivariate time-dependent regression model. Multivariate Cox time-dependent regression models were calculated using hazard ratios (HR) and 95% confidence intervals (95% CI) for incident lean NAFLD (19). The Schoenfeld scale residuals test is an accurate tool for confirming proportional hazards (PH).
Third, TyG index trajectory patterns from 2017 to 2019 in the research population were characterized using semiparametric Latent Class Growth Modeling (LCGM). Briefly, the “LCTM Tools” process fitted a semiparametric mixed model using the maximum likelihood method (20). We empirically compared one, two, three, four and five group solutions and then optimized the number of subgroups by Bayesian Information Criterion (BIC) values (close to zero indicating a good fit), where the shape of trajectories was determined according to the order of the polynomial (linear, quadratic, cubic, etc.). The following parameters established the appropriate trajectory number and shape (21): (1) improvement in BIC; (2) no less than 5% membership in each trajectory group; and (3) high average group posterior probabilities (> 0.7). Four, using the multivariate Cox proportional hazard model, we created lean NAFLD prediction models to explore whether temporal patterns in these characteristics over time may enhance the model’s ability to make predictions. Based on a multivariate Cox time-dependent regression analysis, the clinical predictive model contained lean NAFLD risk variables, and the merged model incorporated metabolic factor trajectories associated with new-onset lean NAFLD. In addition, a multivariate Cox time-dependent regression model was used to adjust for potential risk factors for lean NAFLD as follows: Model 1 was univariate; Model 2 was adjusted for demographics (i.e., age, WC, and BMI); and Model 3 was adjusted for age, WC, BMI, SBP, and ALT. A spline regression model with three knots (10th, 50th, and 90th percentile) was employed to provide more accurate estimates and investigate the nature of the relationship between the TyG index and lean NAFLD.
Finally, we employed LightGBM algorithm for classification to predict the risk of lean NAFLD patients. LightGBM is a gradient-boosting framework using a tree-based learning algorithm that has been successfully applied to the construction of medical models in recent years (22, 23). Patients at the Health Management Center were randomly divided into a training set and an internal test set using R with a ratio of 7:3. To improve the effectiveness of the model while ensuring the authenticity of the data, we use a synthetic minority oversampling technique (SMOTE) for the database to solve the problem of data imbalance (24, 25). The training set was used to build the model, and the internal test set was used for model validation and evaluation. In the training set, k-fold cross-validation (k =5) is performed, and a grid search is used to find the best combination of parameters. Subsequently, the model performance is initially evaluated in the internal test set. Model performance is assessed by area under the curve (AUC), predictive accuracy, sensitivity, specificity, and F1-score. Our primary evaluation metric for ML models is AUC, calculated from ROC curves, which are graphical plots showing the diagnostic power of binary classifiers as their discriminative thresholds change (26). It is also combined with other metrics for a comprehensive assessment to determine the best model. Meanwhile, a web-based calculator was able to estimate the probability of lean NAFLD in individuals.
For all analyses, a two-tailed P value of < 0.05 is considered statistically significant. A general descriptive analysis was conducted on SPSS software (version 26.0; IBM, Chicago, USA). R statistical software (version 4.0.2; R Foundation for Statistical Computing, Vienna, Austria) was used to construct univariate and multivariate Cox time-dependent regression models using LCTM tools. In this study, a newly developed gradient boosting model (GBM), known as LightGBM, was implemented using “LightGBM,” packages, and “pROC,” packages to generate ROC curves, respectively. The authors make all the R and code for these tools available at www.github.com/hlennon/LCTMtools.
Supplementary Table 1 displays the LCGM fitting results. We modeled linear, quadratic, and cubic curves from 1 to 5 classes. This table excludes five classes due to low group membership (<1%). Due to the small size of group 4 (0.27%), the quadratic curve model of group 5 was ruled out. Based on the above criteria, a cubic parametric model with 3 groups with a low BIC, relatively high posterior probability, and a high percentage of group membership was selected. The LCTM model was used to fit TyG index change trajectories to normal BMI. When divided into 4 groups, the results of the LMR-LRT likelihood ratio test had no statistical significance (P=0.389), and there was one group whose sample size was only 38 (< 5% of the total sample size), so it was rejected. The results showed that the optimal fitting results were divided into three groups (BIC:P<0.001; Entrop:P<0.001; LMR-LRT:P<0.001; Group: 206/541/363). Detailed information for calculating TyG index trajectories is provided in Supplementary Table 1.
We classified the study population based on TyG index trajectories from 2017 to 2019, labeled as low stable (TyG index ranged from 7.66 to 7.71, n=206, 18.5%), moderate stable (TyG index ranged from 8.11 to 8.15, n=542, 48.8%) and high stable (TyG index ranged from 8.61 to 8.67, n=363, 32.7%). Study participants were divided into three categories based on the trajectory of their TyG index over time. According to the initial value, all change trajectories are upward trends and are divided into low stable, moderate stable and high stable (Figure 2).
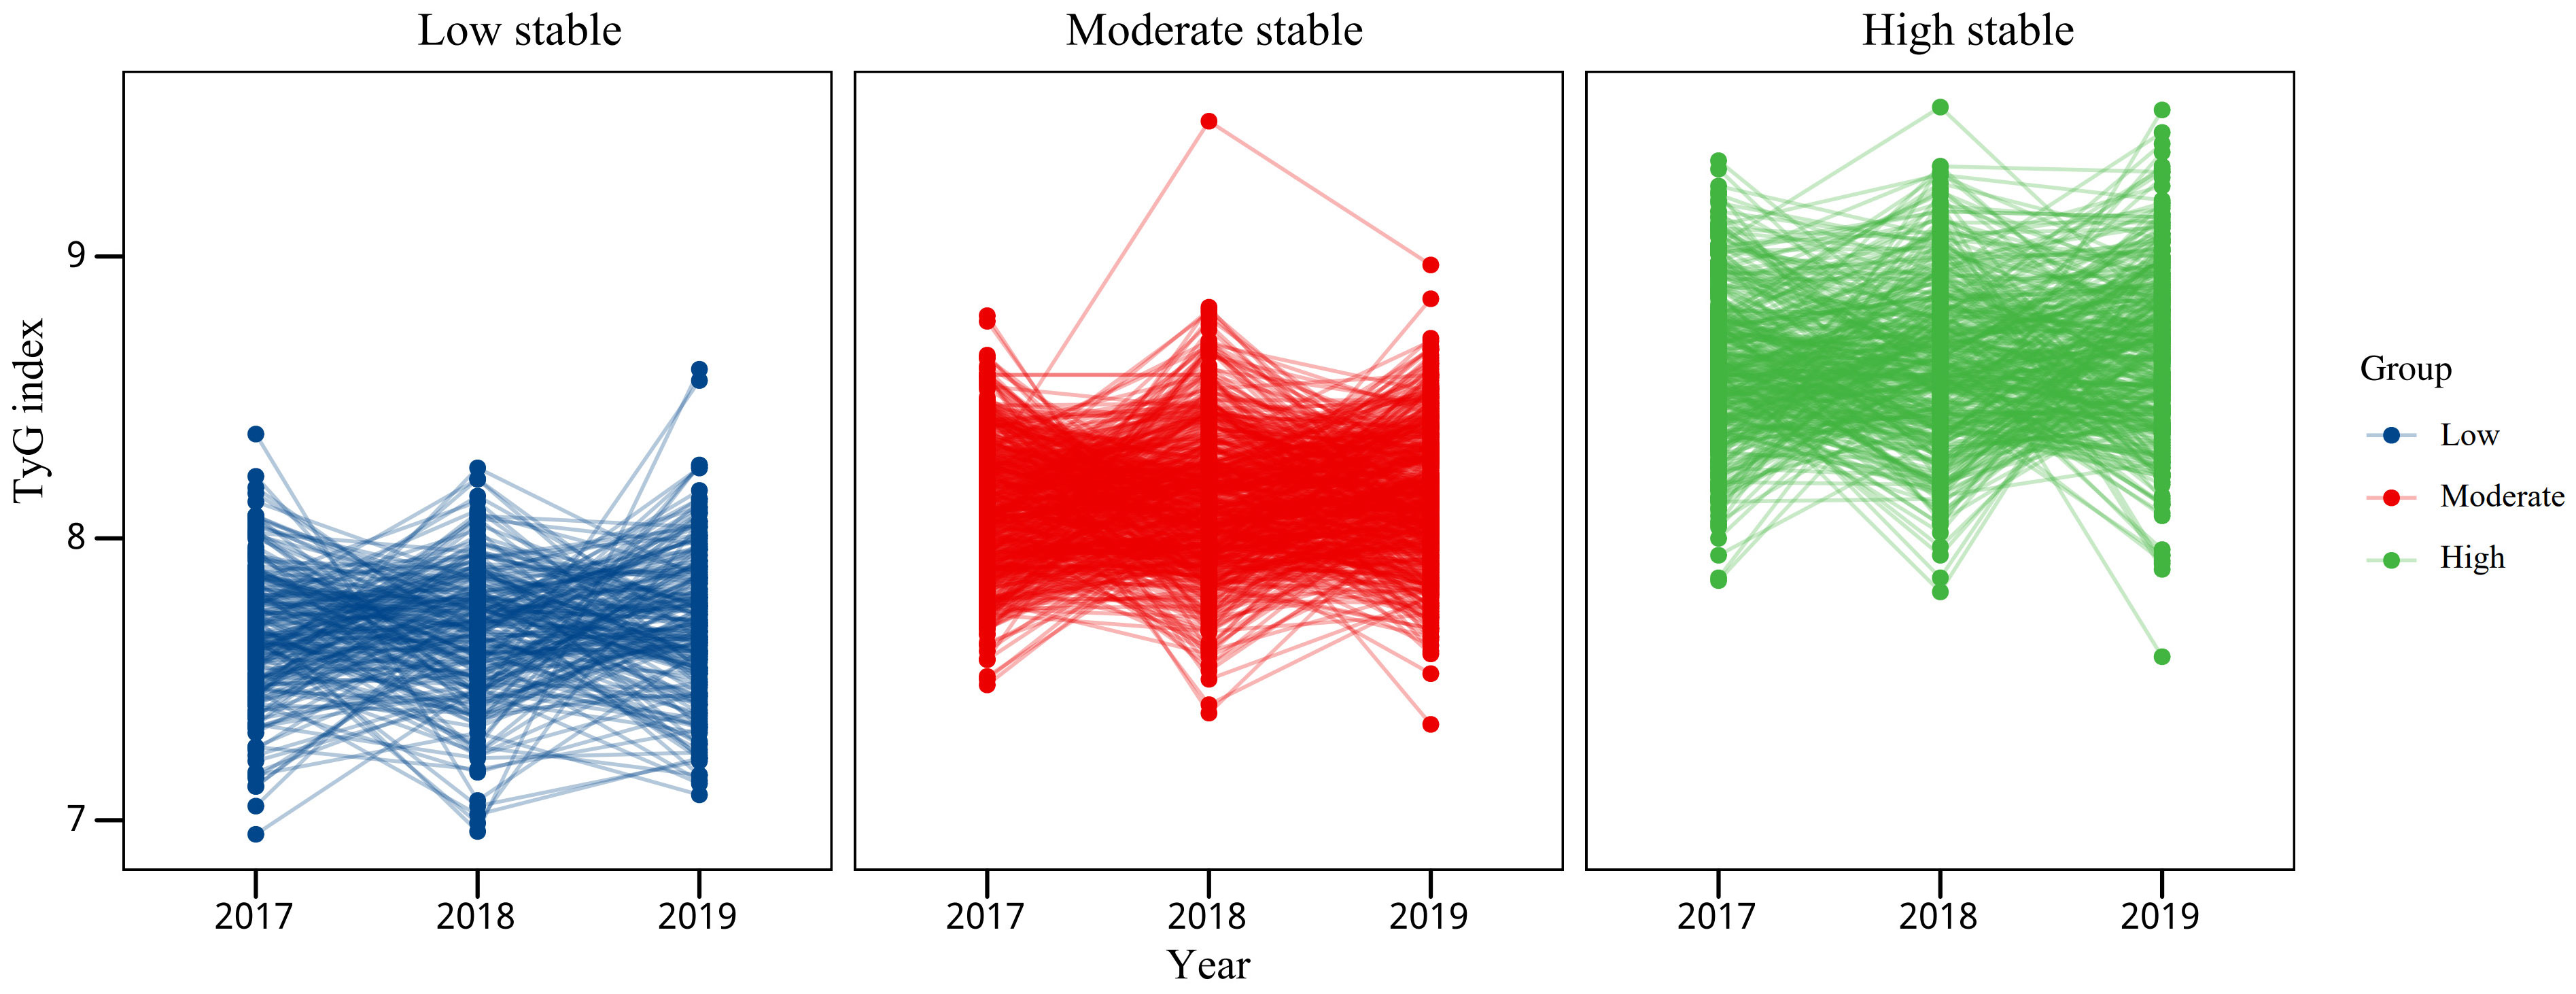
Figure 2 TyG index trajectories of lean NAFLD patients from the Health Management Center.
Table 1 shows the demographics of the 1,109 individuals whose risk factors for developing lean NAFLD were analyzed. Over a median follow-up of 389.22 days (329.59–448.85 days), 81 (7.3%) participants developed lean NAFLD. The incidence rates of lean NAFLD were 3.8%, 8.6%, and 11.7% from low to high in men, 2.5%, 4.5%, and 11.4% in women, respectively (P<0.05). There were significant differences in the incidence of lean NAFLD between the three latent classes. Not only the baseline TyG index, but more importantly, TyG index trajectories in later life account for the incidence of lean NAFLD.
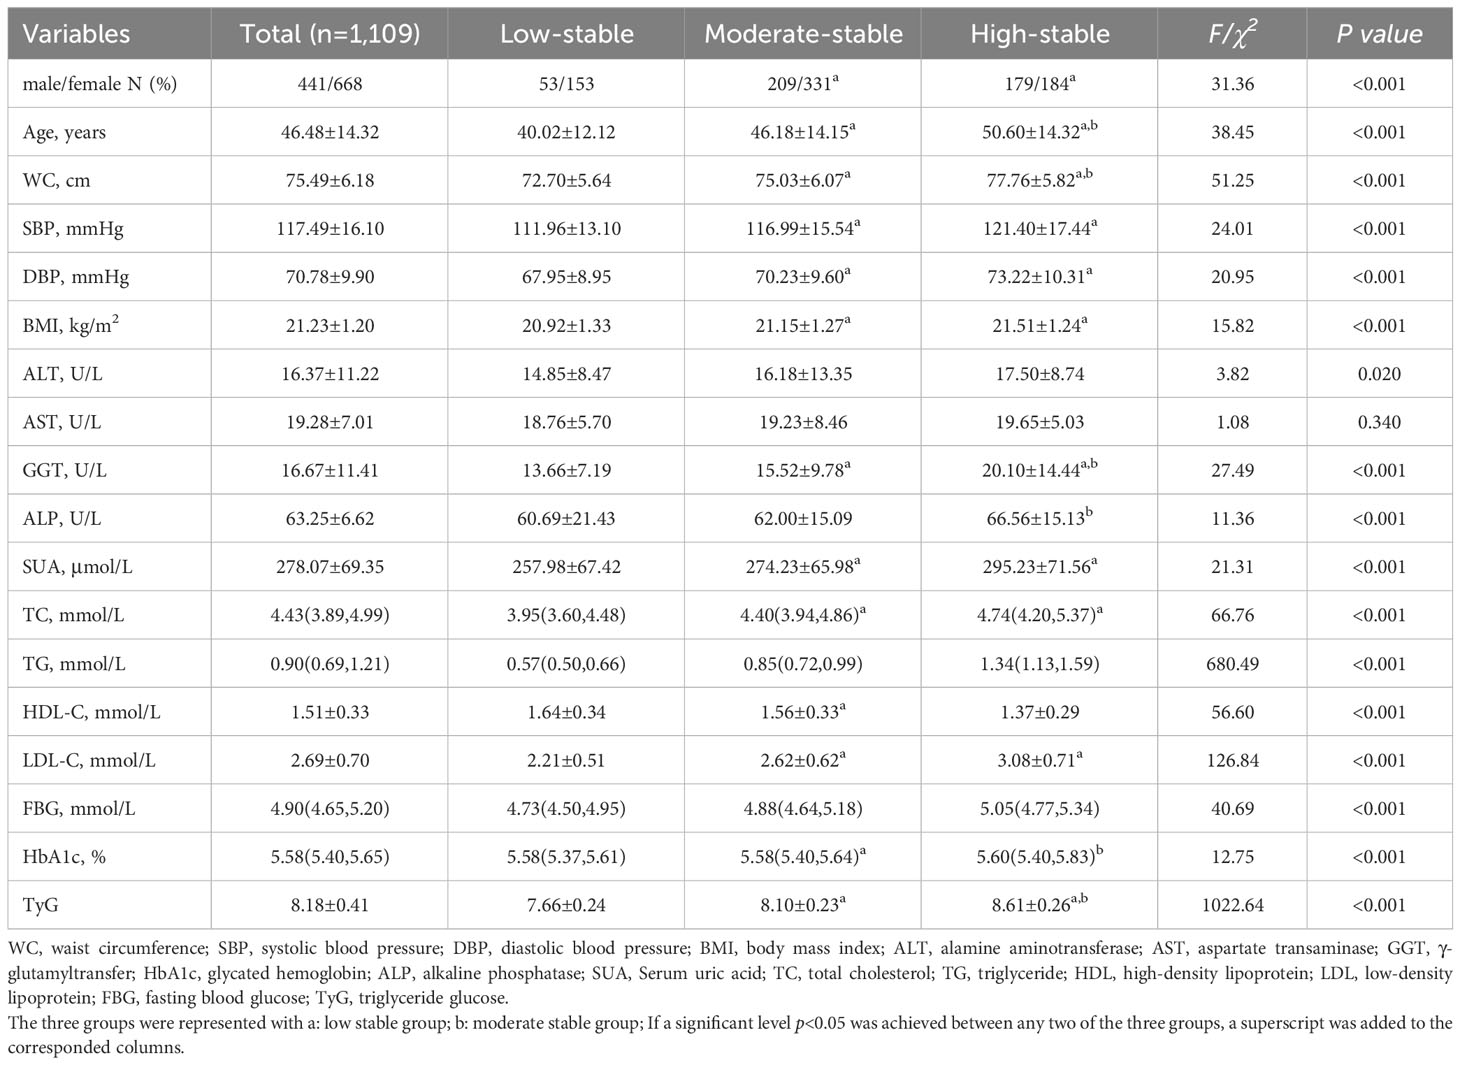
Table 1 Baseline demographic clinical characteristic according to TyG index trajectories.
In this study, data from the first physical exam in 2017 were used as baseline data. There were 53 males (25.7%) and 153 females (74.3%) in the low stable TyG index group, and 209 males (38.7%) and 331 females (61.3%) in the moderate stable TyG index group. There were 179 males (49.3%) and 184 females (50.7%) in the high stable TyG index group. Compared with the low stable TyG index group, age, WC, SBP, DBP, BMI, ALT, GGT, SUA, TC, TG, FPG and TyG, the stable and high stable TyG index groups significantly increased, and LDL-C significantly decreased, with statistical significance (P<0.001).
Table 2 displays univariate time-dependent Cox regression findings. Except for sex, all variables were significantly associated with new-onset lean NAFLD (HR>1, P<0.05). Table 3 shows the multivariate time-dependent Cox regression estimates under the PH assumption. In multivariate Cox analysis, age, WC, SBP, BMI, and ALT were correlated and independent risk factors for lean NAFLD development. Subjects in the moderate stable and high stable groups showed 1.767 (95% CI: 0.730-4.275) and 2.668 (95% CI: 1.098-6.484) fold higher risk of developing lean NAFLD, respectively, than those in the low stable group.
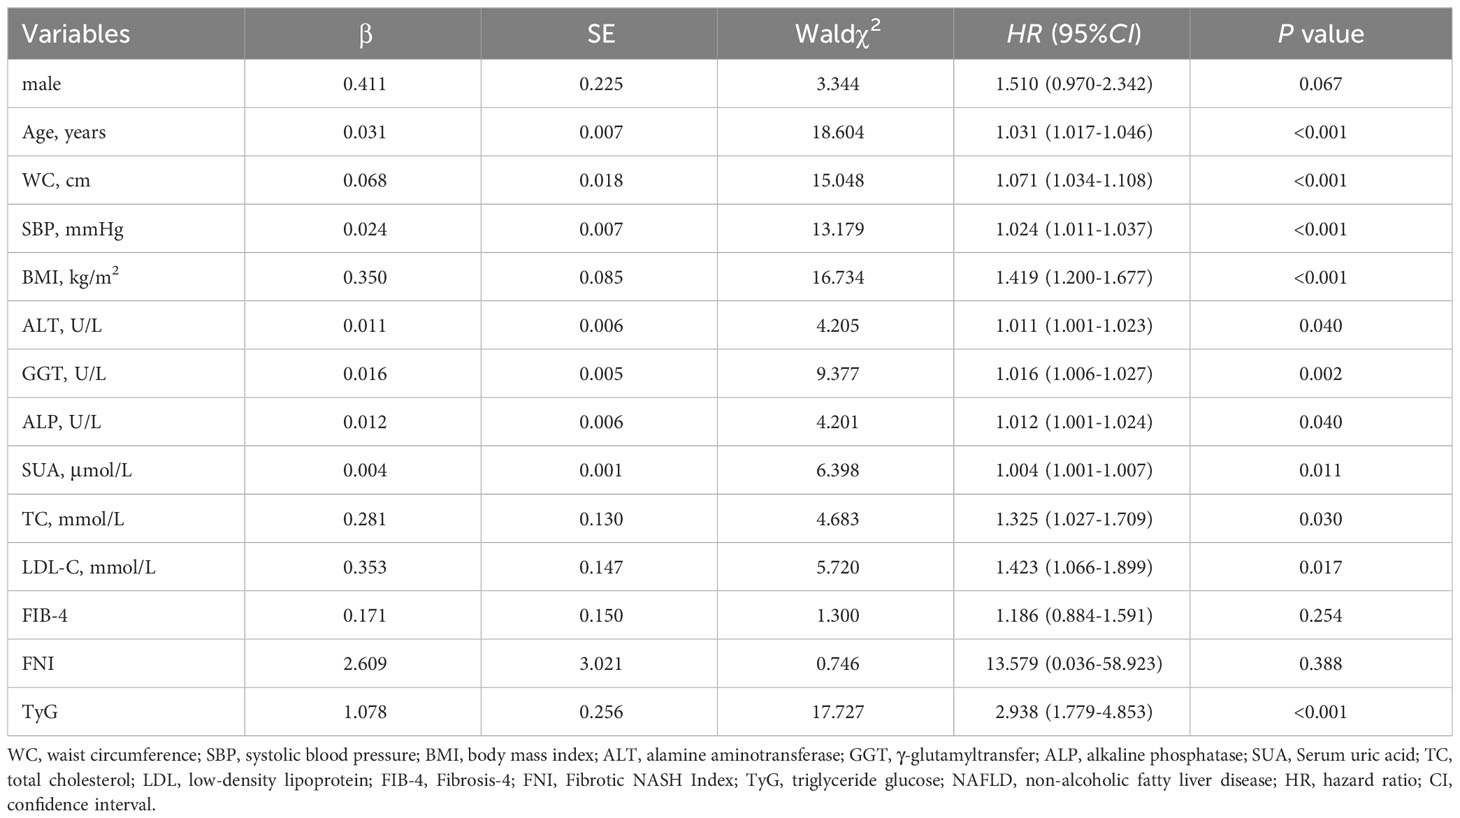
Table 2 Univariate time-dependent Cox regression analysis of new-onset lean NAFLD.
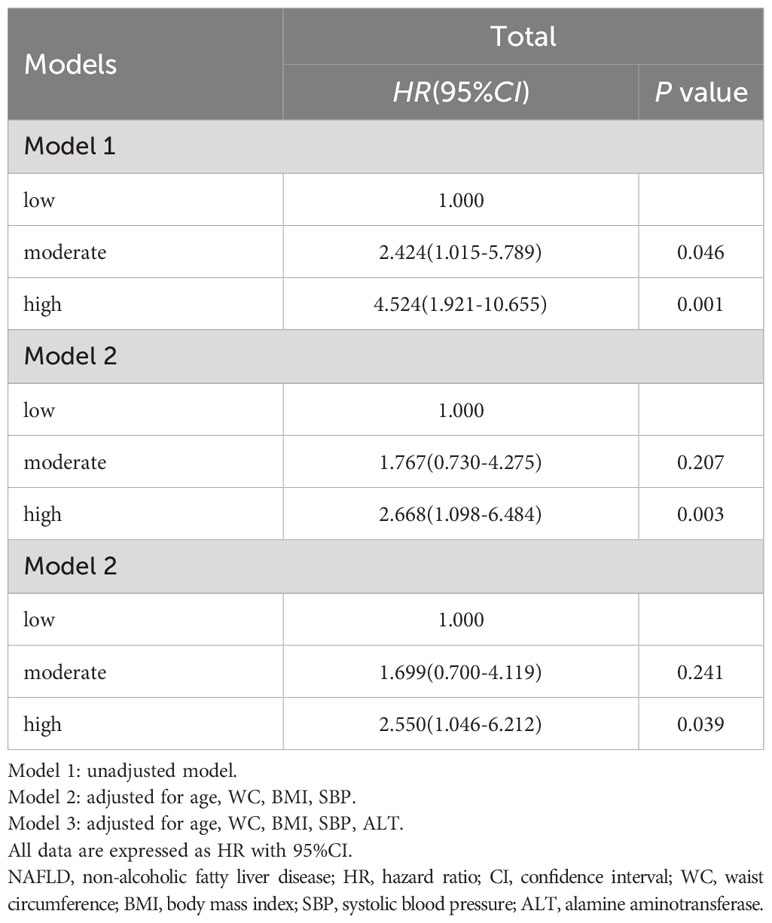
Table 3 Association between TyG index trajectories and lean NAFLD risk during follow-up.
The RCS model with four knots (25th, 50th, 75th, and 95th percentile) at various time periods simulated the longitudinal change in TyG index and lean NAFLD. A significant nonlinear dose-response association was found between TyG index change and lean NAFLD. After adjusting for age, WC, BMI, SBP, and ALT, these associations remained significant (χ2 = 11.5, P=0.003). Figure 3 shows a positive linear dose-response relationship for TyG index and lean NAFLD. As TyG index levels increased, the detected risk of lean NAFLD showed a clear upward trend. When the TyG index exceeds 8.2, the risk of disease increases rapidly (all p for non-linearity > 0.1).
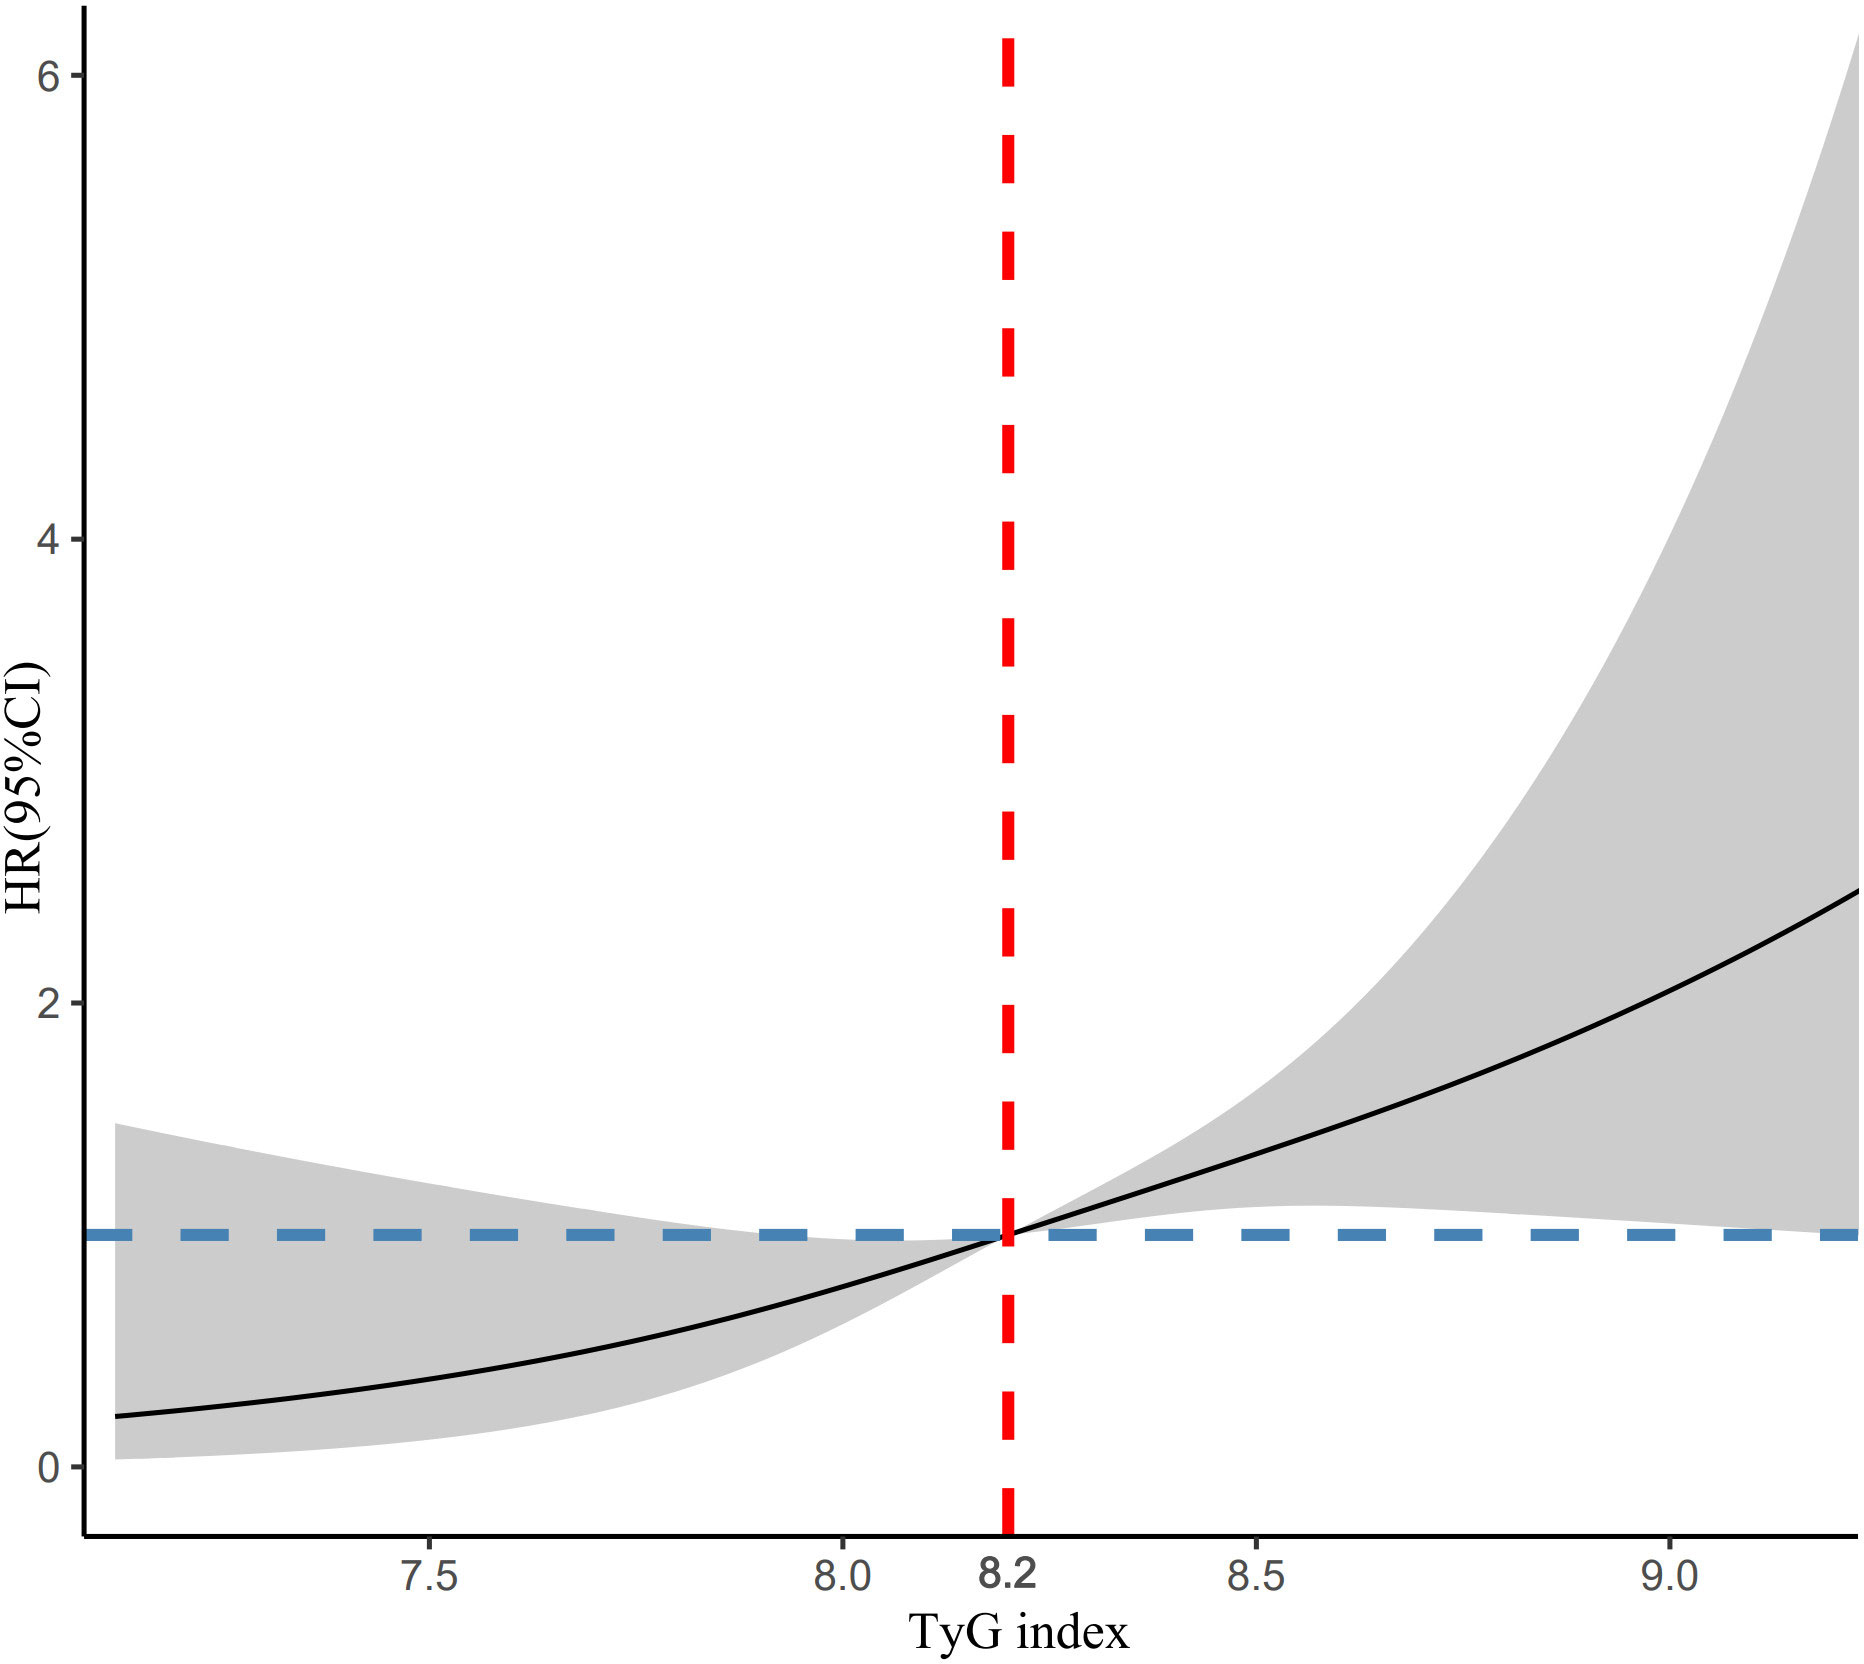
Figure 3 RCS plots of the association between TyG index and lean NAFLD.
The performance evaluation of the model uses the Receiver Operating Characteristic (ROC) curve and calculates the Area under the ROC (AUC) as descriptors in Figure 4. A higher AUC value indicates a stronger generalization capability of the model, as seen by the ROC curve approaching the top left corner of the graph. The LightGBM performs well, with AUC values all above 70% (Train AUC 0.870, Test AUC 0.766). Based on the information from the confusion matrix showing prediction results, we calculated accuracy, precision, recall, and F1 score in Supplementary Table 2.
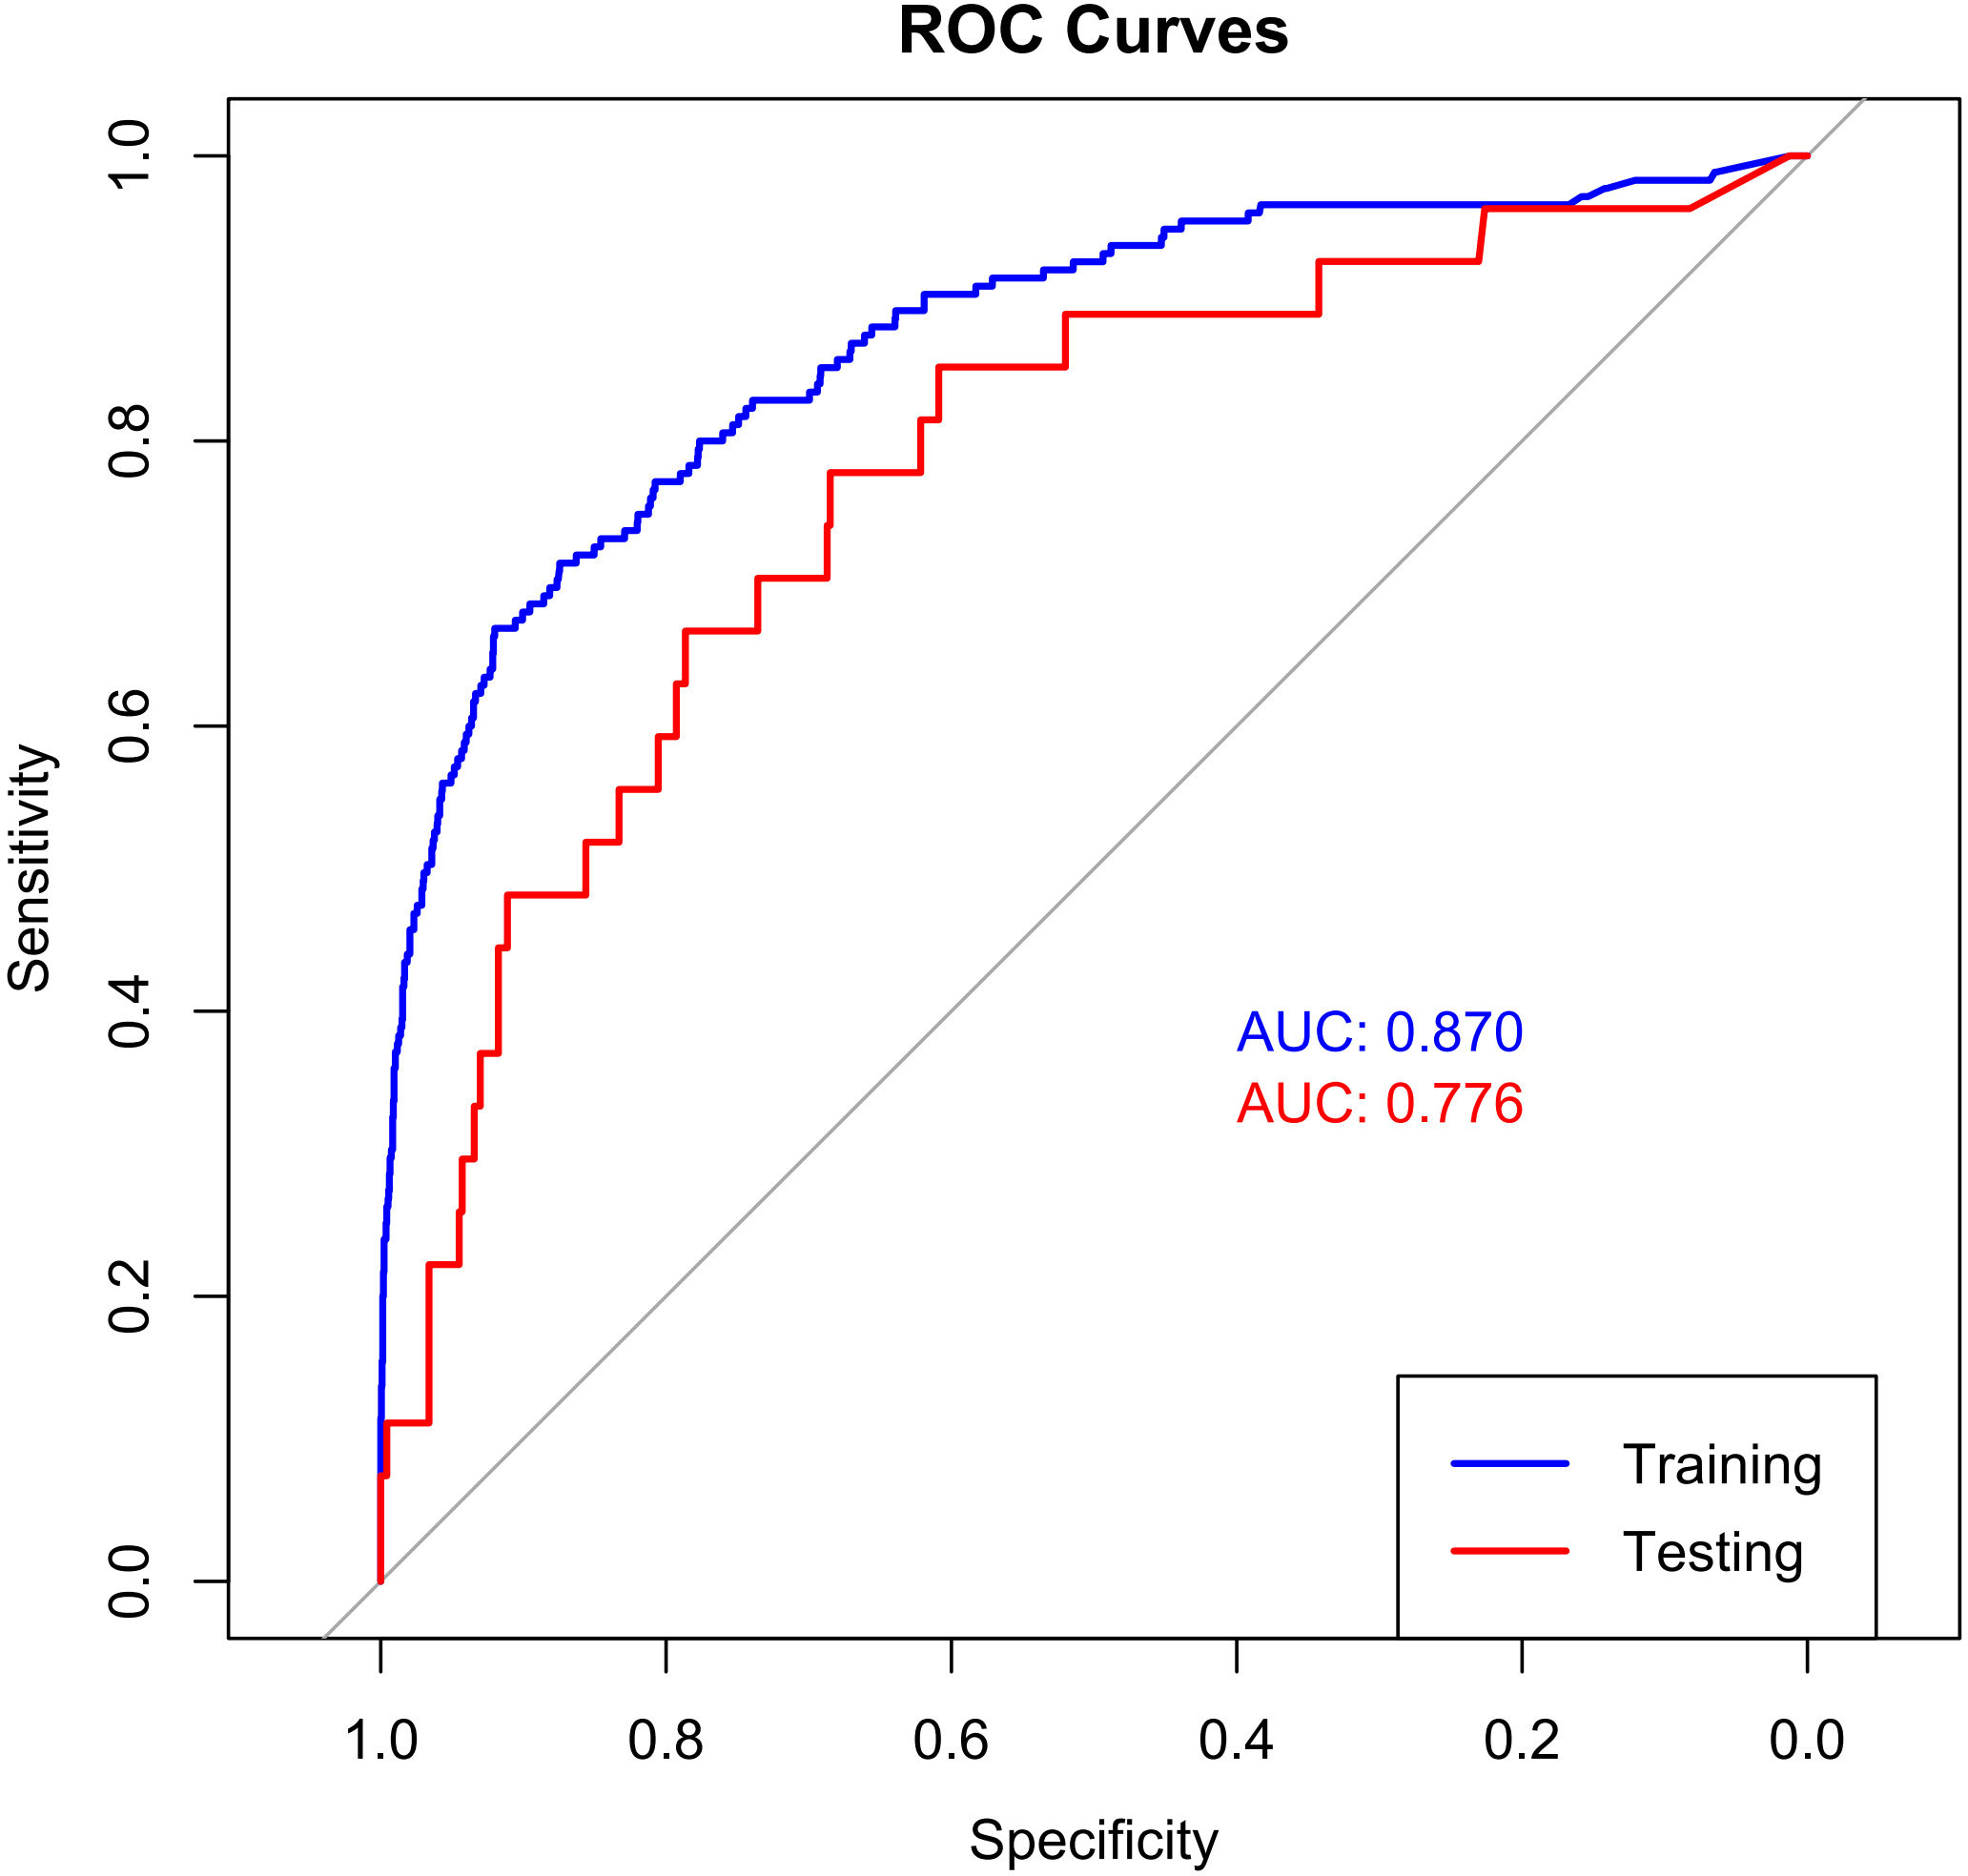
Figure 4 The ROC curve of LightGBM LightGBM, light gradient boosting.
Although LightGBM has shown excellent predictive ability in lean NAFLD patients, it is intricate and complex, which is not conducive to clinical dissemination. Therefore, this study developed an online web calculator for predicting lean NAFLD patients. The calculator can be easily extended clinically and requires only the input of patient clinicopathological information to derive the probability of lean NAFLD while stratifying patients into high and low risk. (https://liuhaoshuang.shinyapps.io/lightgbm_shiny/) (Figure 5).
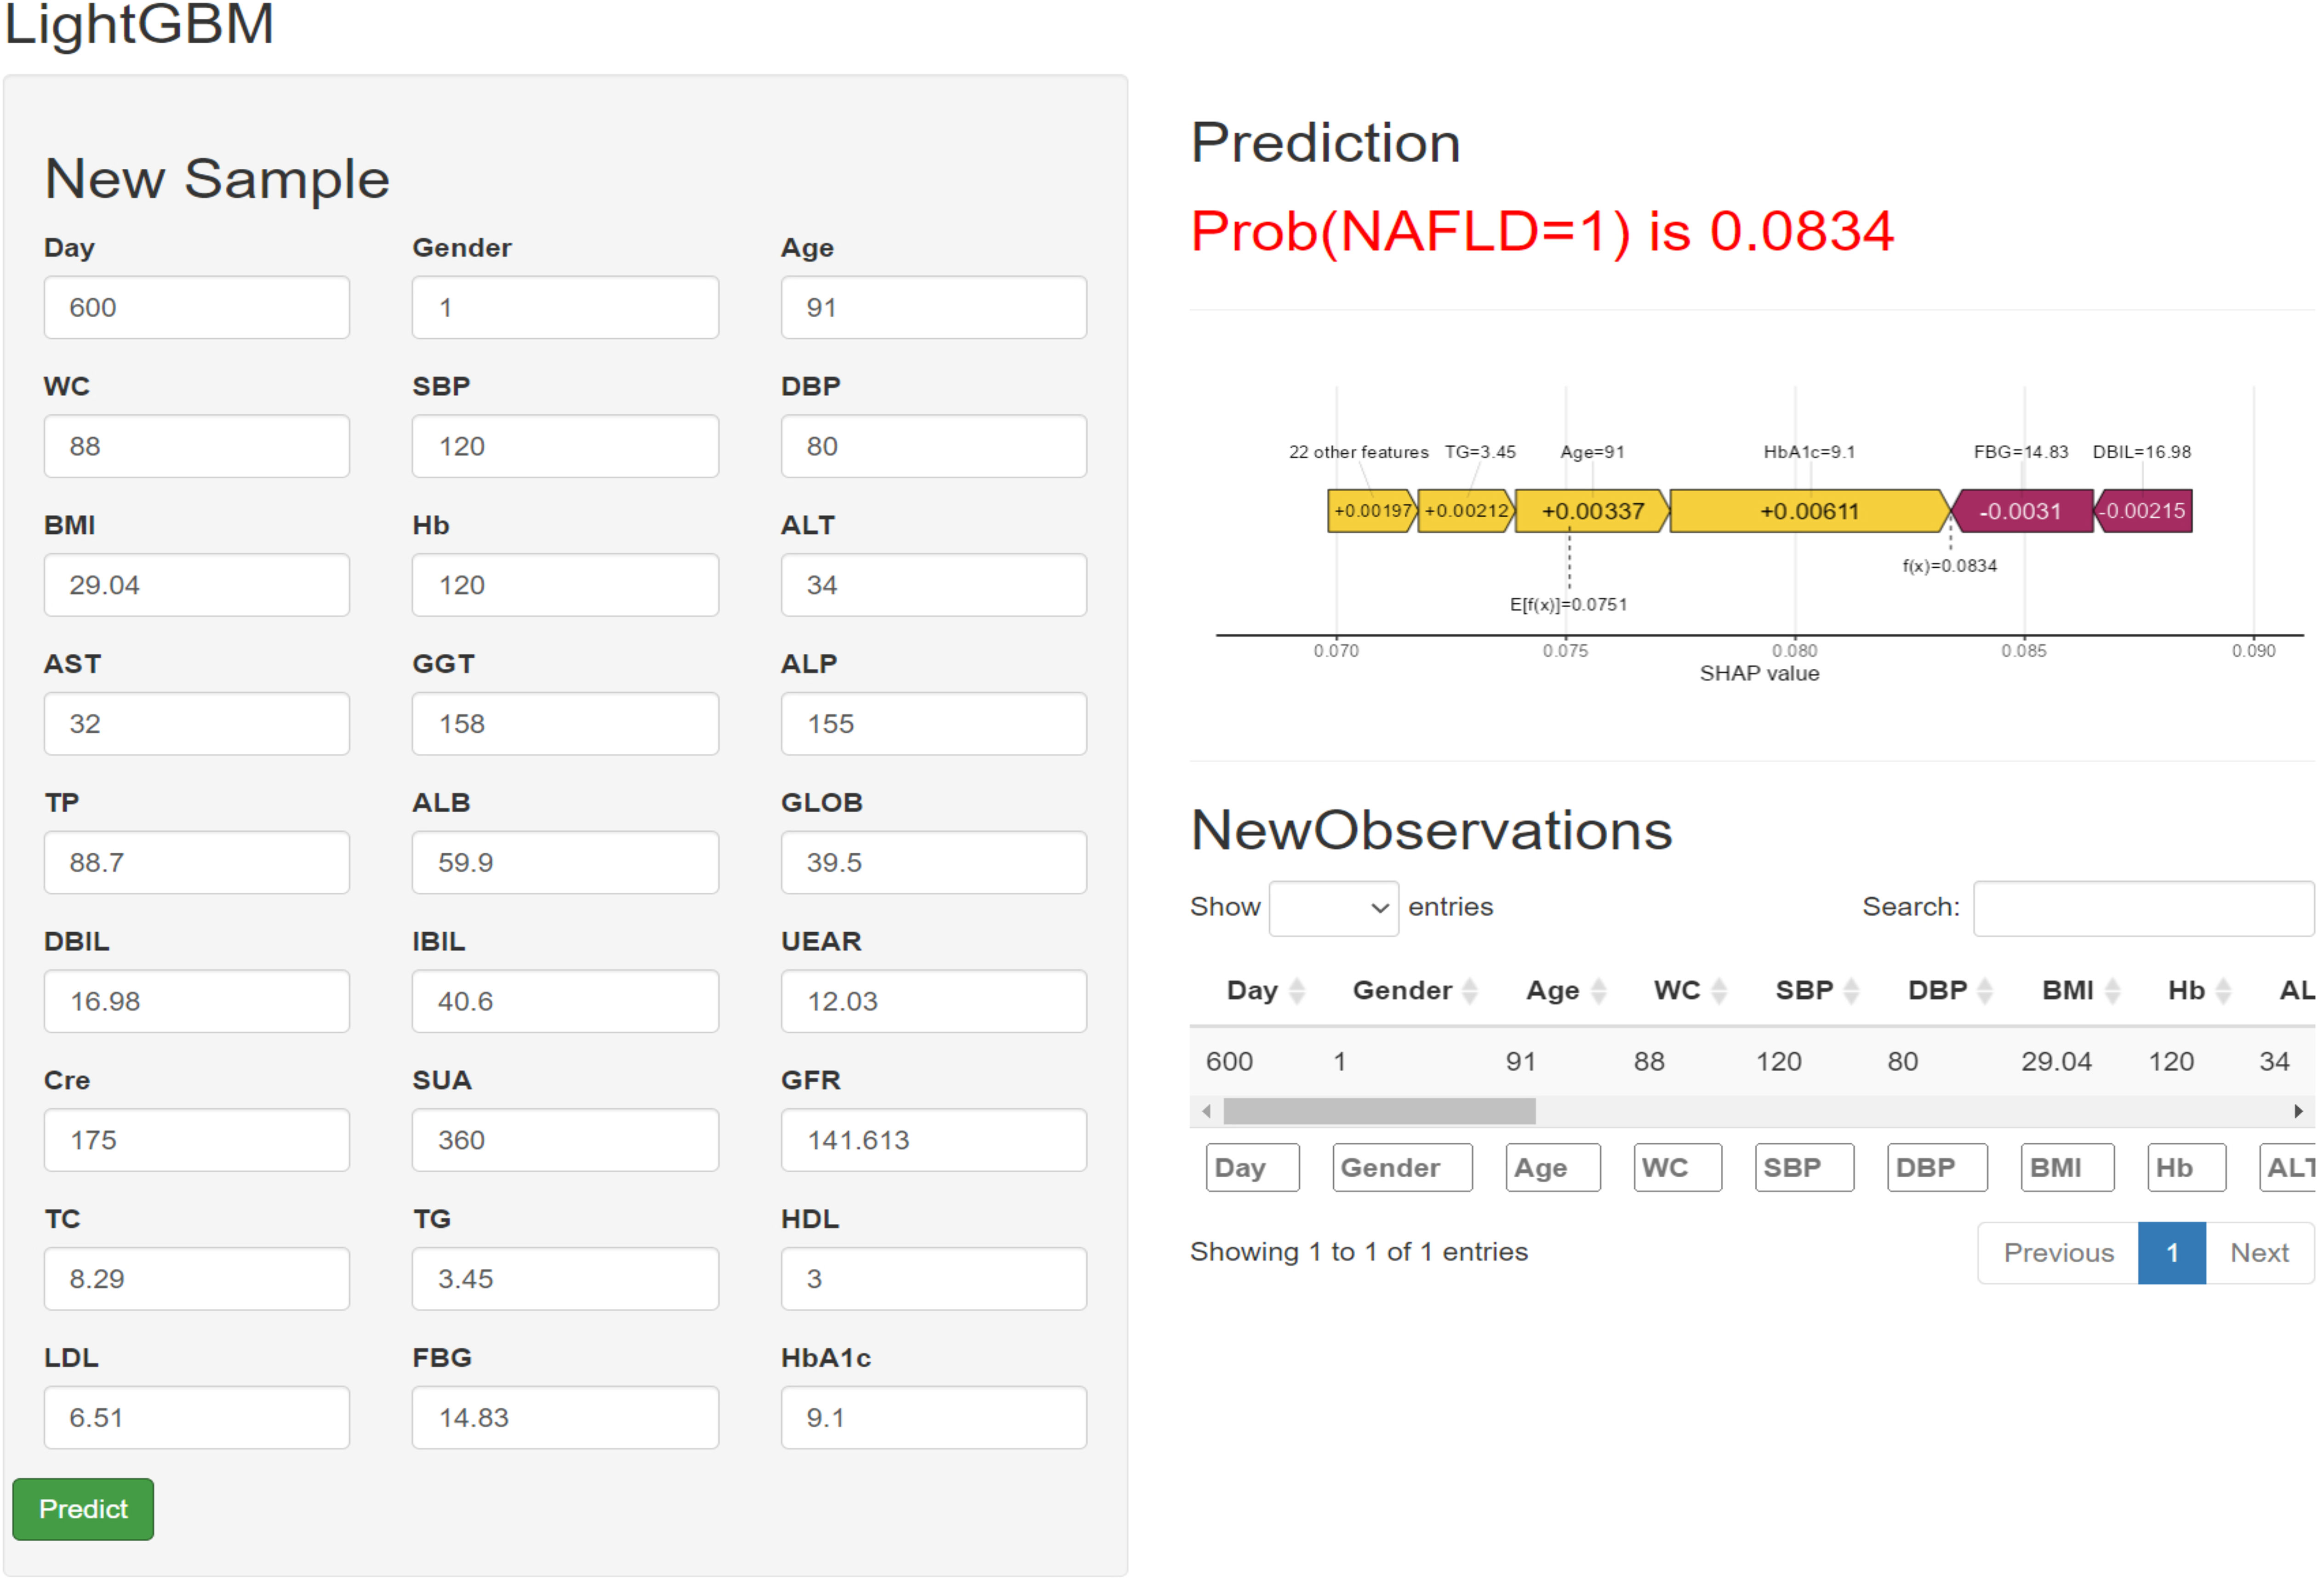
Figure 5 Machine learning model-based web predictor for predicting Iean NAFLD patients.
This study assessed longitudinal TyG index trajectories from 2017 to 2019 in a Chinese cohort using LCGM analysis. TyG index change trajectories were classified into three trajectories. In addition, higher TyG index change trajectories were positively associated with lean NAFLD risk. Age, WC, SBP, BMI, and ALT were correlated and independent risk factors for lean NAFLD in Cox multivariate studies. In routine clinical practice, the TyG index may be a valuable measure for evaluating lean NAFLD. Prior studies have established a link between TyG index and NAFLD incidence (27, 28). However, the LCGM analysis used in this study differs from previous cross-sectional and longitudinal analyses. To our knowledge, this is the first study to explore the association between TyG index trajectories and the incidence of lean NAFLD. LCGM is able to distinguish between different latent TyG indicator groups, highlighting individual differences in development. This approach differs significantly from traditional TyG index studies. In traditional studies, TyG trends in subjects are assumed to follow the same pattern, ignoring individual development. Therefore, traditional studies may not adequately reflect the association of the TyG index with incident lean NAFLD. Given these limitations, this study used machine learning techniques based on clinical indicators to develop a predictive model to identify high-risk patients. This model could help clinicians develop personalized treatment plans for lean NAFLD patients, including asymptomatic NAFLD patients. Thus, the individual TyG analysis provides a novel perspective for understanding TyG’s effect on lean NAFLD.
An important metabolic organ, the liver, controls the metabolism of lipids and glucose. The etiology and evolution of lean NAFLD are influenced by the interaction of IR and glucose/lipid dysmetabolism, which are also important variables in lean NAFLD (29). Under physiological conditions, insulin regulates glucose metabolism by processing glucose in insulin-sensitive tissues, while IR involves reduced tissue sensitivity to insulin and impaired regulation of glucose metabolism, resulting in impaired function of multiple organs, including the liver. IR causes excessive intrahepatic triglycerides by stimulating hepatic de novo lipogenesis (DNL) and hepatic gluconeogenesis, etc. Activated hepatic gluconeogenesis also increases glucose levels (30).
The TyG index, which is produced from fasting triglyceride and glucose levels, has been widely used as a key marker of IR, particularly peripheral and hepatic IR. Several epidemiological studies have reported a significant association of higher TyG scores with the risk of type 2 diabetes mellitus (T2DM) (31, 32), prediabetes (33), hypertension (34), cardiovascular disease (CVD) (35), coronary artery calcification (36), and polycystic ovary syndrome (PCOS) (37), which can be explained by IR. Mechanically, IR may explain the link between the TyG index and lean NAFLD. The liver functions as an endocrine organ by secreting hepatokines, metabolites, and noncoding RNA, which influence various aspects of metabolism, including glucose and lipid metabolism and insulin action. Lean NAFLD may impair its function, resulting in IR.
Our results were in line with Xue’s findings, which demonstrated that the TyG index is a valid diagnostic for detecting NAFLD in those who are neither overweight nor obese (38). In a retrospective observational study of 24,825 healthy Japanese people, Naoya et al. found similar results. They found a significant positive link between TyG-BMI and NAFLD in non-obese subjects (39). In addition, a Chinese study with a 5-year follow-up that included 841 individuals who had ultrasound revealed favorable relationships between TyG-BMI and NAFLD in the non-obese (40).
Consistent with the conventional view, this study found that BMI was associated with an increased risk of NAFLD in patients. Abdominal obesity is a significant risk factor for NAFLD (41). Waist circumference (WC) and trunk fat have been shown to significantly predict the risk of NAFLD (42). Although BMI is one of the risk factors for NAFLD, it has been argued that BMI is limited compared to other anthropometric measures (e.g., body fat distribution) in identifying lean NAFLD individuals (43).
The presence of liver fibrosis in NAFLD patients is considered the strongest predictor of long-term outcomes (44). The NAFLD Fibrosis Score (NFS), Fibrotic NASH Index (FNI) and Fibrosis-4 (FIB-4) have been recommended as appropriate methods for the initial assessment of fibrosis in NAFLD patients (17). Both methods use a combination of variables, including age, BMI, and biochemical measures (i.e., aspartate aminotransferase (AST), alanine aminotransferase (ALT), platelets, etc.). Graupera et al. concluded that NFS and FIB-4 are not optimal for screening because they do not correlate well with liver stiffness (45). In their study, WC was found to be the ideal measure for screening for fibrosis in high-risk individuals in the general population. However, other studies have found that FNI and FIB-4 have the potential to detect advanced fibrosis and fibrosis progression in people with NAFLD (46, 47). NFS and FIB-4 appear to be more useful in the diagnosis of fibrosis in NAFLD but not for screening for fibrosis in the general population. Further studies could explore a combination of these methods, including anthropometric, body composition, and biochemical variables altogether.
Recently, a Delphi multisociety conference proposed a new nomenclature for metabolic dysfunction-associated steatotic liver disease (MASLD) (48, 49). However, the shift from NAFLD to an inclusion-based definition of MASLD has yet to be extensively studied. An analysis by the LITMUS consortium showed 98% overlap between patients with conventional NAFLD and those with the newly suggested MASLD (50). However, further research is needed to adapt this new nomenclature to a specific group with lean NAFLD or SLD without any metabolic risk factors. As for prevalence, a recent meta-analysis involving 17 studies found that MAFLD has a higher prevalence than NAFLD (33.0% vs. 29.1%), and future studies should compare MASLD prevalence with NAFLD (51).
There are several limitations to this study. First, ultrasonography is used to identify lean NAFLD, but it cannot assess the degree of steatosis. Ultrasound, on the other hand, is commonly used for population-based research with acceptable accuracy. But due to the low sensitivity of ultrasound in diagnosing mild fatty liver disease, there may be a proportion of individuals in the early stages of lean NAFLD during the 2017-2019 period. And the mild lean NAFLD may have an impact on TyG’s changing trajectories from 2017 to 2019. Therefore, we cannot rule out the possibility of reverse causality between lean NAFLD and TyG index changes. Further research, including on individuals diagnosed with liver biopsies, is needed to answer this question. Second, the data came from routine health checks. The findings of this cohort may not be generalizable to the general public. Finally, our study did not consider some potential effects of unmeasured confounders on primary outcomes, including dietary changes or comorbidities. Therefore, our results should be interpreted with caution.
Even with these problems, our findings have therapeutic implications for the prevention of lean NAFLD, specifically in terms of alerting patients to TyG index levels and their shifting trajectories, and give valuable insights into the occurrence of lean NAFLD and its association with TyG index trajectories. Moreover, LCGM does not presuppose the existence of specific morphological trajectories, while it allows for distinct latent developmental trajectories that can be learned from data (52). As a result, the focus of this LCGM investigation may be to alter TyG index trajectories to isolate different, mutually exclusive groups.
This research reveals that changes in the TyG index over time are associated with an increased risk of new-onset lean NAFLD. Overall, the TyG index may be a practical and straightforward way to predict lean NAFLD, and individuals with high TyG indices should be screened for lean NAFLD and undergo extra screening and preventative measures.
The raw data supporting the conclusions of this article will be made available by the authors, without undue reservation.
The studies involving humans were approved by the First Affiliated Hospital of Zhengzhou University. The studies were conducted in accordance with the local legislation and institutional requirements. Written informed consent for participation in this study was provided by the participants’ legal guardians/next of kin. Written informed consent was obtained from the individual(s) for the publication of any potentially identifiable images or data included in this article.
HL: Writing – original draft. JC: Conceptualization, Funding acquisition, Writing – review & editing. QQ: Supervision, Writing – review & editing. SY: Data curation, Writing – review & editing. YW: Methodology, Writing – review & editing. JL: Investigation, Writing – review & editing. SD: Funding acquisition, Writing – review & editing.
The author(s) declare financial support was received for the research, authorship, and/or publication of this article. This study was supported by National Natural Science Foundation of China (72101236); China Postdoctoral Science Foundation (2022M722900); Collaborative Innovation Project of Zhengzhou City (XTCX2023006); Nursing Team Project of the First Affiliated Hospital of Zhengzhou University (HLKY2023005).
We thank the medical staff who participated in this study. Besides, we are grateful for the cooperation of all study participants.
The authors declare that the research was conducted in the absence of any commercial or financial relationships that could be construed as a potential conflict of interest.
All claims expressed in this article are solely those of the authors and do not necessarily represent those of their affiliated organizations, or those of the publisher, the editors and the reviewers. Any product that may be evaluated in this article, or claim that may be made by its manufacturer, is not guaranteed or endorsed by the publisher.
The Supplementary Material for this article can be found online at: https://www.frontiersin.org/articles/10.3389/fendo.2024.1321922/full#supplementary-material
1. Powell EE, Wong VW, Rinella M. Non-alcoholic fatty liver disease. Lancet. (2021) 397:2212–24. doi: 10.1016/S0140-6736(20)32511-3
2. Ferguson D, Finck BN. Emerging therapeutic approaches for the treatment of NAFLD and type 2 diabetes mellitus. Nat Rev Endocrinol. (2021) 17:484–95. doi: 10.1038/s41574-021-00507-z
3. Estes C, Anstee QM, Arias-Loste MT, Bantel H, Bellentani S, Caballeria J, et al. Modeling NAFLD disease burden in China, France, Germany, Italy, Japan, Spain, United Kingdom, and United States for the period 2016-2030. J Hepatol. (2018) 69:896–904. doi: 10.1016/j.jhep.2018.05.036
4. Vilarinho S, Ajmera V, Zheng M, Loomba R. Emerging role of genomic analysis in clinical evaluation of lean individuals with NAFLD. Hepatology. (2021) 74:2241–50. doi: 10.1002/hep.32047
5. Vos B, Moreno C, Nagy N, Féry F, Cnop M, Vereerstraeten P, et al. Lean non-alcoholic fatty liver disease (Lean-NAFLD): a major cause of cryptogenic liver disease. Acta Gastroenterol Belg. (2011) 74:389–94. doi: 10.1007/s00384-010-1110-7
6. Xu R, Pan J, Zhou W, Ji G, Dang Y. Recent advances in lean NAFLD. BioMed Pharmacother. (2022) 153:113331. doi: 10.1016/j.biopha.2022.113331
7. Ajmera V, Loomba R. Imaging biomarkers of NAFLD, NASH, and fibrosis. Mol Metab. (2021) 50:101167. doi: 10.1016/j.molmet.2021.101167
8. Lu CW, Lee YC, Chiang CH, Chang HH, Yang WS, Huang KC. Independent dose-response associations between fetuin-A and lean nonalcoholic fatty liver disease. Nutrients. (2021) 13:2928. doi: 10.3390/nu13092928
9. Isokuortti E, Zhou Y, Peltonen M, Bugianesi E, Clement K, Bonnefont-Rousselot D, et al. Use of HOMA-IR to diagnose non-alcoholic fatty liver disease: a population-based and inter-laboratory study. Diabetologia. (2017) 60:1873–82. doi: 10.1007/s00125-017-4340-1
10. Tao LC, Xu JN, Wang TT, Hua F, Li JJ. Triglyceride-glucose index as a marker in cardiovascular diseases: landscape and limitations. Cardiovasc Diabetol. (2022) 21:68. doi: 10.1186/s12933-022-01511-x
11. Peiffer-Smadja N, Rawson TM, Ahmad R, Buchard A, Georgiou P, Lescure FX, et al. Machine learning for clinical decision support in infectious diseases: a narrative review of current applications. Clin Microbiol Infect. (2020) 26:584–95. doi: 10.1016/j.cmi.2019.09.009
12. Bhat M, Rabindranath M, Chara BS, Simonetto DA. Artificial intelligence, machine learning, and deep learning in liver transplantation. J Hepatol. (2023) 78:1216–33. doi: 10.1016/j.jhep.2023.01.006
13. Swanson K, Wu E, Zhang A, Alizadeh AA, Zou J. From patterns to patients: Advances in clinical machine learning for cancer diagnosis, prognosis, and treatment. Cell. (2023) 186:1772–91. doi: 10.1016/j.cell.2023.01.035
14. National Workshop on Fatty Liver and Alcoholic Liver Disease, Chinese Society of Hepatology, Chinese Medical Association, Fatty Liver Expert Committee, Chinese Medical Doctor Association. Guidelines of prevention and treatment for alcoholic liver disease: a 2018 update. Zhonghua Gan Zang Bing Za Zhi. (2018) 26:188–94. doi: 10.3760/cma.j.issn.1007-3418
15. Long MT, Noureddin M, Lim JK. AGA clinical practice update: Diagnosis and management of nonalcoholic fatty liver disease in lean individuals: Expert review. Gastroenterology. (2022) 163:764–74. doi: 10.1053/j.gastro.2022.06.023
16. Simental-Mendía LE, Gamboa-Gómez CI, Aradillas-García C, Rodríguez-Morán M, Guerrero-Romero F. The triglyceride and glucose index is a useful biomarker to recognize glucose disorders in apparently healthy children and adolescents. Eur J Pediatr. (2020) 179:953–8. doi: 10.1007/s00431-020-03570-2
17. Ciardullo S, Muraca E, Perra S, Bianconi E, Zerbini F, Oltolini A, et al. Screening for non-alcoholic fatty liver disease in type 2 diabetes using non-invasive scores and association with diabetic complications. BMJ Open Diabetes Res Care. (2020) 8:e000904. doi: 10.1136/bmjdrc-2019-000904
18. Fibrotic Nash Index (FNI) calculator, Fibrotic NASH Index (FNI) Calculator . Available online at: https://fniscore.github.io/.
19. Zhang Z, Zhang Z, Reinikainen J, Adeleke KA, Pieterse ME, Groothuis- Oudshoorn CGM. Time-varying covariates and coefficients in Cox regression models. Ann Transl Med. (2018) 6:121. doi: 10.21037/atm.2018.02.12
20. Lennon H, Kelly S, Sperrin M, Buchan I, Cross AJ, Leitzmann M, et al. Framework to construct and interpret latent class trajectory modelling. BMJ Open. (2018) 8:e020683. doi: 10.1136/bmjopen-2017-020683
21. Sharp K, Tillery R, Long A, Wang F, Pan H, Phipps S. Trajectories of resilience and posttraumatic stress in childhood cancer: Consistency of child and parent outcomes. Health Psychol. (2022) 41:256–67. doi: 10.1037/hea0001132
22. Ke G, Meng Q, Finley T, Wang T, Chen W, Ma W. Lightgbm: A highly efficient gradient boosting decision tree. Adv Neural Inf Process Syst. (2017) 30.
23. Friedman J. Greedy function approximation: A gradient boosting machine. Ann Stat. (2001) 29:1189–1232. doi: 10.1214/aos/1013203451
24. Chawla NV, Bowyer KW, Hall LO, Kegelmeyer WP. SMOTE: synthetic minority over- sampling technique. J Artif Intell Res. (2002) 16:321–57. doi: 10.1613/jair.953
25. Liang D, Yi B, Cao W, Zheng Q. Exploring ensemble oversampling method for imbal- anced keyword extraction learning in policy text based on three-way decisions and SMOTE. Expert Syst Appl. (2022), 188. doi: 10.1016/j.eswa.2021.116051
26. Mandrekar JN. Receiver operating characteristic curve in diagnostic test assessm- ent. J Thorac Oncol. (2010) 5:1315–6. doi: 10.1097/ITO
27. Kim KS, Hong S, Ahn HY, Park CY. Triglyceride and glucose index is a simple and easy-to-calculate marker associated with nonalcoholic fatty liver disease. Obesity. (2022) 30:1279–88. doi: 10.1002/oby.23438
28. Ling Q, Chen J, Liu X, Xu Y, Ma J, Yu P, et al. The triglyceride and glucose index and risk of nonalcoholic fatty liver disease: A dose-response meta-analysis. Front Endocrinol. (2023) 13:1043169. doi: 10.3389/fendo.2022.1043169
29. Kuchay MS, Martínez-Montoro JI, Choudhary NS, Fernández-García JC, Ramos-Molina B. Non-alcoholic fatty liver disease in lean and non-obese individuals: Current and future challenges. Biomedicines. (2021) 9:1346. doi: 10.3390/biomedicines9101346
30. Smith GI, Shankaran M, Yoshino M, Schweitzer GG, Chondronikola M, Beals JW, et al. Insulin resistance drives hepatic de novo lipogenesis in nonalcoholic fatty liver disease. J Clin Invest. (2020) 130:1453–60. doi: 10.1172/JCI134165
31. Park B, Lee HS, Lee YJ. Triglyceride glucose (TyG) index as a predictor of incident type 2 diabetes among nonobese adults: a 12-year longitudinal study of the Korean Genome and Epidemiology Study cohort. Transl Res. (2021) 228:42–51. doi: 10.1016/j.trsl.2020.08.003
32. Wang S, Shi J, Peng Y, Fang Q, Mu Q, Gu W, et al. Stronger association of triglyceride glucose index than the HOMA-IR with arterial stiffness in patients with type 2 diabetes: a real-world single-centre study. Cardiovasc Diabetol. (2021) 20:82. doi: 10.1186/s12933-021-01274-x
33. Jiang ZZ, Zhu JB, Shen HL, Zhao SS, Tang YY, Tang SQ, et al. A high triglyceride-glucose index value is associated with an increased risk of carotid plaque burden in subjects with prediabetes and new-onset type 2 diabetes: A real-world study. Front Cardiovasc Med. (2022) 9:832491. doi: 10.3389/fcvm.2022.832491
34. Shan S, Li S, Lu K, Cao J, Sun W, Zhou J, et al. Associations of the triglyceride and glucose index with hypertension stages, phenotypes, and their progressions among middle-aged and older chinese. Int J Public Health. (2023) 68:1605648. doi: 10.3389/ijph.2023.1605648
35. Che B, Zhong C, Zhang R, Pu L, Zhao T, Zhang Y, et al. Triglyceride-glucose index and triglyceride to high-density lipoprotein cholesterol ratio as potential cardiovascular disease risk factors: an analysis of UK biobank data. Cardiovasc Diabetol. (2023) 22:34. doi: 10.1186/s12933-023-01762-2
36. Park K, Ahn CW, Lee SB, Kang S, Nam JS, Lee BK, et al. Elevated tyG index predicts progression of coronary artery calcification. Diabetes Care. (2019) 42:1569–73. doi: 10.2337/dc18-1920
37. Zheng Y, Yin G, Chen F, Lin L, Chen Y. Evaluation of triglyceride glucose index and homeostasis model of insulin resistance in patients with polycystic ovary syndrome. Int J Womens Health. (2022) 14:1821–9. doi: 10.2147/IJWH.S387942
38. Xue Y, Xu J, Li M, Gao Y. Potential screening indicators for early diagnosis of NAFLD/MAFLD and liver fibrosis: Triglyceride glucose index-related parameters. Front Endocrinol. (2022) 13:951689. doi: 10.3389/fendo.2022.951689
39. Otsubo N, Fukuda T, Cho G, Ishibashi F, Yamada T, Monzen K. Utility of indices obtained during medical checkups for predicting fatty liver disease in non-obese people. Intern Med. (2023) 62:2307–19. doi: 10.2169/internalmedicine.1097-22
40. Li Y, Zheng R, Li J, Feng S, Wang L, Huang Z. Association between triglyceride glucose-body mass index and non-alcoholic fatty liver disease in the non-obese Chinese population with normal blood lipid levels: a secondary analysis based on a prospective cohort study. Lipids Health Dis. (2020) 19:229. doi: 10.1186/s12944-020-01409-1
41. Song K, Park G, Lee HS, Lee M, Lee HI, Ahn J, et al. Trends in prediabetes and non-alcoholic fatty liver disease associated with abdominal obesity among korean children and adolescents: Based on the korea national health and nutrition examination survey between 2009 and 2018. Biomedicines. (2022) 10:584. doi: 10.3390/biomedicines10030584
42. Balakrishnan M, El-Serag HB, Nguyen T, Hilal J, Kanwal F, Thrift AP. Obesity and risk of nonalcoholic fatty liver disease: A comparison of bioelectrical impedance analysis and conventionally-derived anthropometric measures. Clin Gastroenterol Hepatol. (2017) 15:1965–7. doi: 10.1016/j.cgh.2017.06.030
43. Ciardullo S, Oltolini A, Cannistraci R, Muraca E, Perseghin G. Sex-related association of nonalcoholic fatty liver disease and liver fibrosis with body fat distribution in the general US population. Am J Clin Nutr. (2022) 115:1528–34. doi: 10.1093/ajcn/nqac059
44. Angulo P, Kleiner DE, Dam-Larsen S, Adams LA, Bjornsson ES, Charatcharoen- witthaya P, et al. Liver fibrosis, but no other histologic features, is associated with long-term outcomes of patients with nonalcoholic fatty liver disease. Gastroenter- ology. (2015) 149:389–97. doi: 10.1053/j.gastro.2015.04.043
45. Graupera I, Thiele M, Serra-Burriel M, Caballeria L, Roulot D, Wong GL, et al. Low accuracy of FIB-4 and NAFLD fibrosis scores for screening for liver fibrosis in the population. Clin Gastroenterol Hepatol. (2022) 20:2567–2576.e6. doi: 10.1016/j.cgh.2021.12.034
46. Ciardullo S, Carbone M, Invernizzi P, Perseghin G. Noninvasive identification of probable fibrotic nonalcoholic steatohepatitis across the spectrum of glucose tolerance in the United States. Diabetes Res Clin Pract. (2023) 199:110679. doi: 10.1016/j.diabr-es.2023.110679
47. Song K, Lee HW, Choi HS, Park G, Lee HS, Kim SJ, et al. Comparison of the modified tyG indices and other parameters to predict non-alcoholic fatty liver disease in youth. Biology. (2022) 11:685. doi: 10.3390/biology11050685
48. Ciardullo S, Carbone M, Invernizzi P, Perseghin G. Exploring the landscape of steatotic liver disease in the general US population. Liver Int. (2023) 43:2425–2433. doi: 10.1111/liv.15695
49. Rinella ME, Lazarus JV, Ratziu V, Francque SM, Sanyal AJ, Kanwal F, et al. A multisociety Delphi consensus statement on new fatty liver disease nomenclature. Hepatology. (2023) 78:1966–86. doi: 10.1097/HEP.0000000000000520
50. Hardy T, Wonders K, Younes R, Aithal GP, Aller R, Allison M, et al. The European NAFLD Registry: A real-world longitudinal cohort study of nonalcoholic fatty liver disease. Contemp Clin Trials. (2020) 98:106175. doi: 10.1016/j.cct.2020.106175
51. Ayada I, van Kleef LA, Alferink LJM, Li P, de Knegt RJ, Pan Q. Systematically comparing epidemiological and clinical features of MAFLD and NAFLD by meta- analysis: Focusing on the non-overlap groups. Liver Int. (2022) 42:277–87. doi: 10.1111/liv.15139
Keywords: triglyceride-glucose index, latent class growth model, lean nonalcoholic fatty liver disease, health management, trajectory
Citation: Liu H, Chen J, Qin Q, Yan S, Wang Y, Li J and Ding S (2024) Association between TyG index trajectory and new-onset lean NAFLD: a longitudinal study. Front. Endocrinol. 15:1321922. doi: 10.3389/fendo.2024.1321922
Received: 15 October 2023; Accepted: 07 February 2024;
Published: 27 February 2024.
Edited by:
James M. Olcese, Florida State University, United StatesReviewed by:
Zesheng Li, Tianjin Neurological Institute, ChinaCopyright © 2024 Liu, Chen, Qin, Yan, Wang, Li and Ding. This is an open-access article distributed under the terms of the Creative Commons Attribution License (CC BY). The use, distribution or reproduction in other forums is permitted, provided the original author(s) and the copyright owner(s) are credited and that the original publication in this journal is cited, in accordance with accepted academic practice. No use, distribution or reproduction is permitted which does not comply with these terms.
*Correspondence: Suying Ding, ZmNjZGluZ3N5QHp6dS5lZHUuY24=
†Present address: Su Yan, Institute for Prevention and Control of Infectious Diseases, Henan Provincial Center for Disease Control and Prevention, Zhengzhou, China
Disclaimer: All claims expressed in this article are solely those of the authors and do not necessarily represent those of their affiliated organizations, or those of the publisher, the editors and the reviewers. Any product that may be evaluated in this article or claim that may be made by its manufacturer is not guaranteed or endorsed by the publisher.
Research integrity at Frontiers
Learn more about the work of our research integrity team to safeguard the quality of each article we publish.