 Naama Mizrahi
 Lian Hollander-Cohen
 Ishwar Atre
 Miriam Shulman1
 Berta Levavi-Sivan
- 1Department of Animal Sciences, The Robert H. Smith Faculty of Agriculture, Food, and Environment, Hebrew University of Jerusalem, Rehovot, Israel
- 2Department of Poultry and Aquaculture, Institute of Animal Sciences, Agricultural Research Organization, Rishon LeZion, Israel
Somatostatin (SST) plays diverse physiological roles in vertebrates, particularly in regulating growth hormone secretion from the pituitary. While the function of SST as a neuromodulator has been studied extensively, its role in fish and mammalian reproduction remains poorly understood. To address this gap, we investigated the involvement of the somatostatin system in the regulation of growth and reproductive hormones in tilapia. RNA sequencing of mature tilapia brain tissue revealed the presence of three SST peptides: SST6, SST3, and low levels of SST1. Four different isoforms of the somatostatin receptor (SSTR) subfamily were also identified in the tilapia genome. Phylogenetic and synteny analysis identified tiSSTR2-like as the root of the tree, forming two mega clades, with SSTR1 and SSTR4 in one and SSTR2a, SSTR3a, and SSTR5b in the other. Interestingly, the tiSSTR-5 isoforms 5x1, 5x2, and 5x3 were encoded in the sstr3b gene and were an artifact of misperception in the nomenclature in the database. RNA-seq of separated pituitary cell populations showed that SSTRs were expressed in gonadotrophs, with sstr3a enriched in luteinizing hormone (LH) cells and sstr3b significantly enriched in follicle-stimulating hormone (FSH) cells. Notably, cyclosomatostatin, an SSTR antagonist, induced cAMP activity in all SSTRs, with SSTR3a displaying the highest response, whereas octreotide, an SSTR agonist, showed a binding profile like that observed in human receptors. Binding site analysis of tiSSTRs from tilapia pituitary cells revealed the presence of canonical binding sites characteristic of peptide-binding class A G-protein-coupled receptors. Based on these findings, we explored the effect of somatostatin on gonadotropin release from the pituitary in vivo. Whereas cyclosomatostatin increased LH and FSH plasma levels at 2 h post-injection, octreotide decreased FSH levels after 2 h, but the LH levels remained unaffected. Overall, our findings provide important insights into the somatostatin system and its mechanisms of action, indicating a potential role in regulating growth and reproductive hormones. Further studies of the complex interplay between SST, its receptors, and reproductive hormones may advance reproductive control and management in cultured populations.
1 Introduction
The two fundamental biological processes of energy homeostasis and reproduction are intimately related. As reproduction is an energy-intensive process, the activities of the regulators of these processes must be tightly coordinated (1). Both energy balance and reproduction are regulated by somatostatin, a critical 14 amino acid peptide hormone first isolated in 1973 from the sheep hypothalamus (2). In addition to the hypothalamus, somatostatin is produced in the gastrointestinal tract, liver, pancreas, and other tissues in all vertebrates, including fish. Somatostatin has many physiological effects, including inhibition of the secretion of growth hormone (GH), prolactin, and gonadotropins from the pituitary gland (3). Negative control of GH by somatostatin has been shown in vivo and in vitro in several fish species, including salmon, goldfish, rainbow trout, and tilapia (4–7). In the mammal brain, somatostatin also acts as a neuromodulator, regulating motor activity (8, 9), probably by affecting dopaminergic systems (10), and recent evidence suggests it also has significant brain neuroprotective effects (11). Somatostatin also influences the reproductive axis by inhibiting the secretion of luteinizing hormone (LH) from the pituitary (12) and reducing gonadotropin hormone-releasing hormone (GnRH) activity in goldfish, common carp, and grass carp [reviewed in (13)].
The diverse functions of somatostatin are reflected in the complexity of the somatostatin receptor (SSTR) family and their peptide ligands. The development of SSTs and their receptors, like many other neuropeptides and their corresponding receptors, was influenced by various rounds of whole-genome duplication (14). In vertebrates, six paralogous genes of SSTR have been identified (SSTR1–6) (15); five of them also exist in medaka, stickleback, and takifugu (16) and even in cartilaginous fishes (14). SST initiates the inhibition of pituitary hormone secretion by activating G protein-coupled receptors (GPCRs), which trigger a cascade of adenyl cyclase inhibition as well as reductions in intracellular cAMP, protein kinase A (PKA) activity, and Ca2+ channel function, while K+ channels are activated (17, 18). Some SSTRs reported in trout and goldfish show ligand selectivity (18), while activation of SSTR2a in goldfish has been linked to inhibition of GH release (19).
Vertebrate somatostatin genes group into six distinct clades when subjected to phylogenetic analysis. The somatostatin 1 (SST1) gene is ubiquitous across all vertebrate classes, spanning from agnathans to mammals, and it has served as the progenitor for SST2 and SST5 through two rounds of genome duplications (2R). SST4, an SST1 paralog, emerged from a third genome duplication (3R) observed in most teleost fish. SST3 and SST6 arose from tandem duplications of SST1 and SST2 (16, 20).
The involvement of the SST/SSTR system in GH production and release has been well studied; however, little is known about its effect on reproduction, especially in gonadotropin-producing cells. We have recently used transgenic tilapia with fluorescent-labeled gonadotrophs to perform RNA-seq on specific populations of LH and FSH cells. Our analysis revealed new candidates, including somatostatin receptors, that may directly regulate these hormones (21). In the present study, we investigated the influence of somatostatin on the regulation of gonadotropins in tilapia. RNA-seq of mature tilapia brain tissue revealed three SST peptides and nine SSTR subtypes, including receptors that were enriched specifically in either LH or FSH cells. We then explored the effect of an SSTR agonist and antagonist on SSTRs to analyze the binding sites. We also analyzed the in vivo effects of SST on LH and FSH release. Our findings provide valuable insights into the role of somatostatin in the mechanisms governing fish reproduction and may guide the development of novel approaches for reproductive control in fish populations.
2 Materials and methods
2.1 Animals
Sexually mature Nile tilapia (Oreochromis niloticus; body weight, 89.29 ± 32.93 g) were kept and bred in the fish facility unit at the Hebrew University of Jerusalem in 500 L tanks at 26°C, with 14L:10D photoperiod. Fish were fed daily with commercial fish pellets (Raanan Fish Feed, Miluot, Israel). The Gonadosomatic Index (GSI), which was calculated as gonad weight/body weight × 100, was 0.24 ± 0.40%. All experimental procedures were approved by the Hebrew University administrative panel for laboratory animal care.
2.2 RNA-seq for SST receptors and ligands
The RNA-seq library and gene expression were previously published (21, 22). To conduct the LH and FSH cell RNA-seq, pituitaries from 20 mature male and 20 mature female transgenic-O. niloticus (tg(FSH: GFP; LH: RFP) were harvested and validated using fluorescence microscopy for GFP (FSH)- and RFP (LH)-labeled cells (23, 24). The pituitaries were digested with trypsin into single-cell suspensions according to Biran et al. (25) and Levavi-Sivan and Yaron (26). The cell suspensions were sorted using a FACS Aria III sorter and 488 nm and 561 nm lasers to excite the GFP- and RFP-labeled cells, respectively. Three fractions were collected: a GFP-positive fraction enriched in FSH cells, an RFP-positive fraction enriched in LH cells, and a negative fraction consisting of all the pituitary cells except LH and FSH cells. After sorting, the cells were immediately centrifuged, and total RNA was extracted using TRizol reagent (Thermo Fisher), according to the manufacturer’s instructions. The total RNA samples were sent for RNA-seq library preparation and sequencing.
Due to the low amount of RNA extracted from the sorted cells, RNA libraries were prepared using the SMARTer® Stranded Total RNA-seq Kit v2- Pico Input Mammalian (Takara Bio, Mountain View, CA, USA), which is adaptable for low-quality RNA samples. The libraries were subjected to next-generation sequencing using Illumina® NextSeq® 500 system (Illumina, Inc., San Diego, CA, USA). In the FACS-sorted cells, each library contained at least 24 M reads. Of the total identified genes in the RNA-seq libraries, an average of 45% were uniquely mapped reads to the O. niloticus genome (assembly O._niloticus_UMD_NMBU GCA_001858045.3). The average number of reads that were assigned to known genes in the O. niloticus genome were 12.3 M reads for LH cells, 2.85 M reads for FSH cells, and 3.5 M reads for negative cells. The FASTQ files and the results of DESeq analysis discussed in this study are available on the National Center for Biotechnology Information (NCBI) Gene Expression Omnibus (GEO) through accession number GSE159470. Cell-specific expression was identified by analyzing each LH or FSH library against the negative library. More than 3K genes with normalized read counts greater than 100 were identified.
For RNA-seq of the brain, complete brain tissues were collected from six mature tilapia. The tissues were transferred directly into TRIzol reagent (Thermo Fisher), and total RNA isolation was immediately performed using miRNeasy Mini Kit (QIAGEN) according to the manufacturer’s instructions. RNA quality and quantity were verified using the 2100 Bioanalyzer instrument (Agilent Technologies), and only samples with RIN. 8 were processed. Total RNA samples were sent to the Technion Genome Center (Haifa, Israel), where they were prepared for sequencing using the TruSeq RNA Sample Preparation Kit v2 (Illumina, San Diego, CA, USA) and subjected to next-generation sequencing using an Illumina Genome Analyzer (HighSeq 2500; Illumina, San Diego, CA, USA), which performed 100 bp single-end read sequencing. The brain RNA-seq samples contained between 18 and 32 million aligned reads (to the O. niloticus genome) in each sample; of those, more than 82% were assigned to a known gene. An average of 24.95 M reads were assigned to known genes. FASTQ files and the results of the DESeq analysis discussed in this study are available on the National Center for Biotechnology Information (NCBI) Gene Expression Omnibus (GEO) through accession number GSE169272.
2.3 Genome mining and synteny analysis
Genomic and synteny analyses were performed on the studied receptors of Nile tilapia and their duplicates using Genomics v. 110 and the ENSEMBL genome annotations. The analyses were performed on the syntenic regions of the actinopterigyan genes sstr2, sstr3 (named sstr5a in spotted gar), and sstr5 found in the holostean spotted gar (Lepisosteus oculatus). In the analysis, we included the genes encoding the proteins of interest in this study, as described in Table 1. The analysis used the neighboring genes of the spotted gar as a reference for the whole genome duplication event, also known as 3R, in teleosts. The genes of the duplicated paralogons, paralogons A and B, have been studied in the Asian bonytongue (Sclreopages formosus), European seabass (Dicentrarchus labrax), Zebrafish (Danio rerio), Fugu (Takifugu rubripes), and Nile tilapia (Oreochromis niloticus).
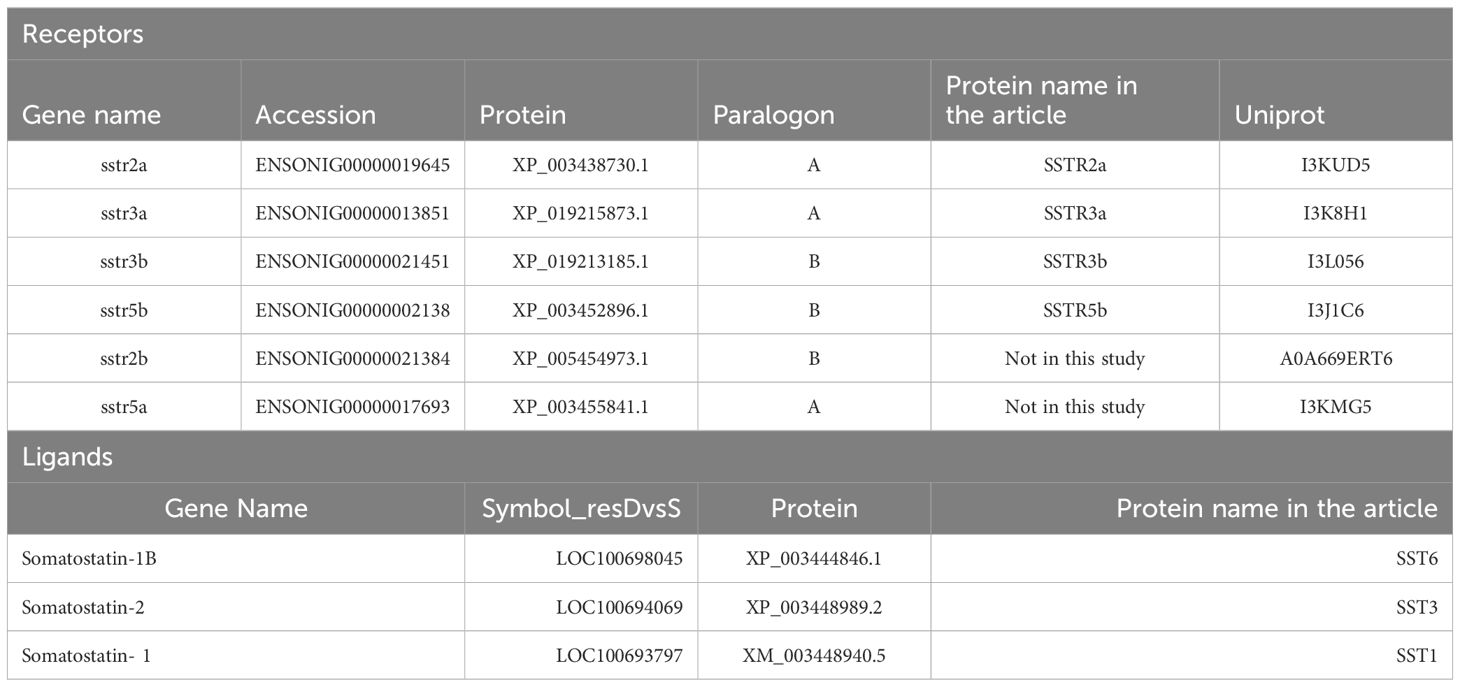
Table 1 Somatostatin receptors of Nile tilapia and the corresponding ligands addressed in this article.
2.4 Phylogenetic tree
The phylogenetic tree was inferred using the maximum likelihood method and JTT matrix-based model (27). The analysis involved 153 amino acid sequences and 780 distinct alignment patterns. The tree with the Final ML Optimization Likelihood (-44204.62) is shown. Initial trees for the heuristic search were obtained automatically by applying the Neighbor-Join and BioNJ algorithms to a matrix of pairwise distances estimated using the JTT model with 1000 bootstrap replicates and then selecting the topology with a superior log likelihood value (28).
2.5 Homology modeling and binding site prediction
Three-dimensional in silico models for tilapia SSTRs (tiSSTR2a, tiSSTR3a, tiSSTR5b, and tiSSTR3b) and SSTs (tiSST6 and tiSST3) were prepared using the I-TASSER server (29, 30) and human (hu)SSTR2-huSST-14 (PDB:7T10) (31) as a template. The 3D models were selAll receptors in teleosts exhibit a monophyletected based on structural stability, C-score, and structural similarity with the known huSSTR2 structure (PDB: 7T10). Further structure processing, binding site prediction, docking, and mutation analysis were performed using Schrödinger (BioLuminate, Schrödinger, LLC, New York, NY, 2021). These structures were further refined and used for binding-site predictions.
2.6 In situ hybridization chain reaction and immunofluorescence on double-labeled pituitary tissues
Transgenic tilapia [FSH:GFP and LH:RFP (23, 24)] were employed for the HCR and immunofluorescence assays. Fish were anesthetized with MS-222 (Sigma) and decapitated. The pituitary glands were removed and fixed with 4% (wt/vol) paraformaldehyde in PBS for 6 h at 4°C, and then immersed in phosphate-buffered saline (PBS) containing 20% (wt/vol) sucrose and 30% (vol/vol) optimal cutting temperature (OCT) (Sakura) for about 24 h. The pituitaries were then embedded in OCT, frozen in liquid nitrogen, sectioned frontally at 12 μm on a cryostat at -18°C, and mounted onto Superfrost™ Plus glass slides (Thermo Scientific). All samples were kept at -80°C.
The HCR protocol was adapted from Molecular Instruments HCR v3.0 for fresh frozen or fixed frozen tissue sections, as described by Choi et al. (32), with slight modifications. Briefly, frozen sections were thawed to room temperature and then fixed in ice-cold 4% (wt/vol) paraformaldehyde in PBS for 15 min at 4°C. The pituitaries were then immersed in different ethanol concentrations (50, 70, and 100%) for 5 min each at room temperature. Each section was then incubated with 200 µl of 10 µg/ml proteinase K solution for 10 min in a humid chamber at 37°C and prehybridized in the probe hybridization buffer for 10 min at 37°C. The slides were incubated overnight at 37°C in a humid chamber in the same solution containing 0.4–0.8 pmol of denaturation probes (designed specifically for each tilapia SST receptor by Molecular Instruments; lot numbers SSTR2a-B1, PRJ208; SSTR5b-B1, PRJ209; SSTR3a-B1, PRJ210; SSTR3b-B1, and PRJ211). After hybridization, the sections were washed in 75% probe wash buffer/25% 5xSSCT for 15 min at 37°C, followed by a second wash in 50%, a third wash in 25% probe wash buffer, and a final wash with only 5×SSCT solution. The slides were preamplified with an amplification buffer for 30 min at room temperature. The pituitary slides were incubated overnight in a dark chamber in the same buffer containing snap-cooled h1 and h2 hairpins. To remove excess hairpins, the slides were washed in 5×SSCT twice for 30 min and then for 5 min.
After the HCR, the sections were subjected to immunofluorescence labeling. Sections were blocked in 5% (v/v) normal goat serum with 0.3% (v/v) Triton X-100 for 1 h at room temperature and incubated with specific antibodies raised in rabbits against recombinant tilapia rtGH (7, 33), diluted 1:500 in antibody dilution buffer (1% w/v BSA; 0.3% Triton X-100 in PBS) overnight at 4°C. The samples were stained using secondary antirabbit antibodies conjugated to Alexa fluorescent dyes (Invitrogen) diluted 1:300 and incubated for 2 h at room temperature. Following staining, the slides were stained with 4′,6-diamidino-2-phenylindole (DAPI), washed, and mounted using an antifade solution (2% w/v propyl-gallate, 75% v/v glycerol in PBS). The pituitaries were imaged using a confocal fluorescence microscope (Leica microsystems) using ×20 and ×60 objectives, and images were processed using the Fiji program (34).
2.7 Somatostatin peptide synthesis and purification
Tilapia (ti) somatostatin 6 (tiSST6; (N) APCKNFFWKTFTSC (C); accession no. XP_003444846.1) and somatostatin 3 (tiSST3; (N) AGCKNFYWKGLTSC (C) accession no. XP_003448989.2) were synthesized by GL Biochem (cysteines are indicated in bold) using an automated solid-phase method and applying Fmoc active-ester chemistry. The crude peptides were purified by HPLC to >95% purity. The pure peptides had a single peak in analytical RP-HPLC, with the expected mass determined by MS analysis. For signal transduction reporter assays, the peptides were dissolved to the desired concentration in double-distilled water.
2.8 Receptor signal transduction reporter assays
The signaling pathways of SSTRs were studied by inserting the entire coding sequence of the four receptors expressed in the pituitary (SSTR2a, SSTR3a, SSTR5b, and SSTR3b; accession nos. XP_003438730.1, XP_019215873.1, XP_003452896.1, and XP_019213185.1, respectively; Table 1) into pcDNA3.1 (Invitrogen) and verified by cloning and sequencing. The sequences were obtained from GenScript Biotech based on sequence information retrieved from GenBank. The procedures for transient transfection of the different cell lines and receptor stimulation have been described previously (35, 36). In brief, COS-7 cells were cotransfected with a luciferase reporter plasmid (Cre-luc; 3 µg) and one of the SSTRs (3 µg). As a control treatment, the receptors were transfected without reporter plasmid (data not shown). After 48 h, the transfected cells were exposed to increasing concentrations of the tilapia native peptides SST6 and SST3 in the presence of forskolin (FSK; 20 μM; Sigma-Aldrich), an activator of protein kinase A that increases cAMP production. Six hours after stimulation, the cells were analyzed using the GloMax multidetection system (Promega).
In another set of assays, the SST receptors were exposed to increasing concentrations of cyclosomatostatin, an SSTR antagonist (0–1000 nM; each in triplicate), in combination with octreotide, an SSTR agonist (10 nM), and FSK (20 μM), or increasing concentrations of octreotide (0–1000 nM; each in triplicate) in combination with cyclosomatostatin (10 nM) and FSK (20 μM). Three individual experiments were conducted using distinct batches of COS-7 cells for each experiment and including three replicates for every concentration.
2.9 In vivo experiment
Adult female tilapia (body weight 89.29 ± 32.93 g) were injected IP with saline, cyclosomatostatin, or octreotide (100 µg/kg; n = 8 fish per group). The fish were bled from the caudal blood vessels into heparinized syringes at 0, 2, 4, 6, and 24 h after injection. Blood was centrifuged at 3,200 rpm for 30 min at 4°C to obtain plasma samples, which were stored at −20°C until assayed. This standard protocol was used previously to test the effect of GnRH and other hypothalamic neuropeptides on circulating levels of LH, FSH, and GH in tilapia (33, 37, 38). Three independent experiments were performed for each treatment.
2.10 ELISA for the measurement of tilapia FSH, LH, and GH
Plasma levels of LH, FSH, and GH were measured by specific competitive ELISAs developed for tilapia (39, 40) based on recombinant (r)tiGTHs or rtiGH. The isera were produced against rtLHβ (41), rtFSHβ (40), or rtGH (39), and rtLHβα (41), rtFSHβα (37) or rtGH (39) was used to generate a standard curve. The sensitivity of plasma measurements was 15.84 pg/ml for LH, 0.24 pg/ml for FSH, and 35.0 pg/ml for GH. The inter-assay coefficients of variation (CV) were 14.8, 12.5, and 13%, whereas intra-assay CVs were 7.2, 8, and 8% for LH, FSH, and GH, respectively.
2.11 Statistical analysis
The results are presented as mean ± SEM. Two-way ANOVA was used to compare mean LH, FSH, and GH values from the in vivo experiments. One-way ANOVA was used to compare the signal transduction results. In cases of statistically significant differences between the groups, the analysis was followed by an a posteriori Tukey multiple comparison test using JMP software version 9 (SAS Institute, Inc., Cary, NC, USA).
3 Results
3.1 Phylogenetic and synteny analyses of SSTRs and their differential expression in tilapia pituitary
In order to comprehend the involvement of somatostatin in the reproductive processes of fish, we initially undertook a thorough investigation of the tilapia genome, conducting analyses of phylogenetics and synteny related to their receptors. Genome mining revealed that the studied receptors in teleost fish were encoded in three groups of preserved sstr genes: sstr2, sstr3, and sstr5. The syntenic analysis showed that the sstr2, sstr3, and sstr5 genes in spotted gar were duplicated in teleosts due to a whole genome duplication event. Two paralogons, A and B, containing an asymmetric conservation of the genes, were identified in each species (Figure 1). The duplicated genes in teleosts were differentiated after the paralogon as sstr2a, sstr2b, sstr3a, sstr3b, sstr5a, and sstr5b. The paralogon A of the gene sstr2 contains the genes fam20, amz2, arsg, slc39a1, sstr2-like, and sgsh. Paralogon A had also undergone a transposition to a different chromosome in all the studied teleosts between the genes slc26a11 and rnf213a (Figure 1A; Supplementary Table 1A). Paralogon B was characterized by containing the genes goc1 and zgc:86896. The protein SSTR2 was encoded in the gene sstr2a of the Nile tilapia found in paralogon A (Table 1).
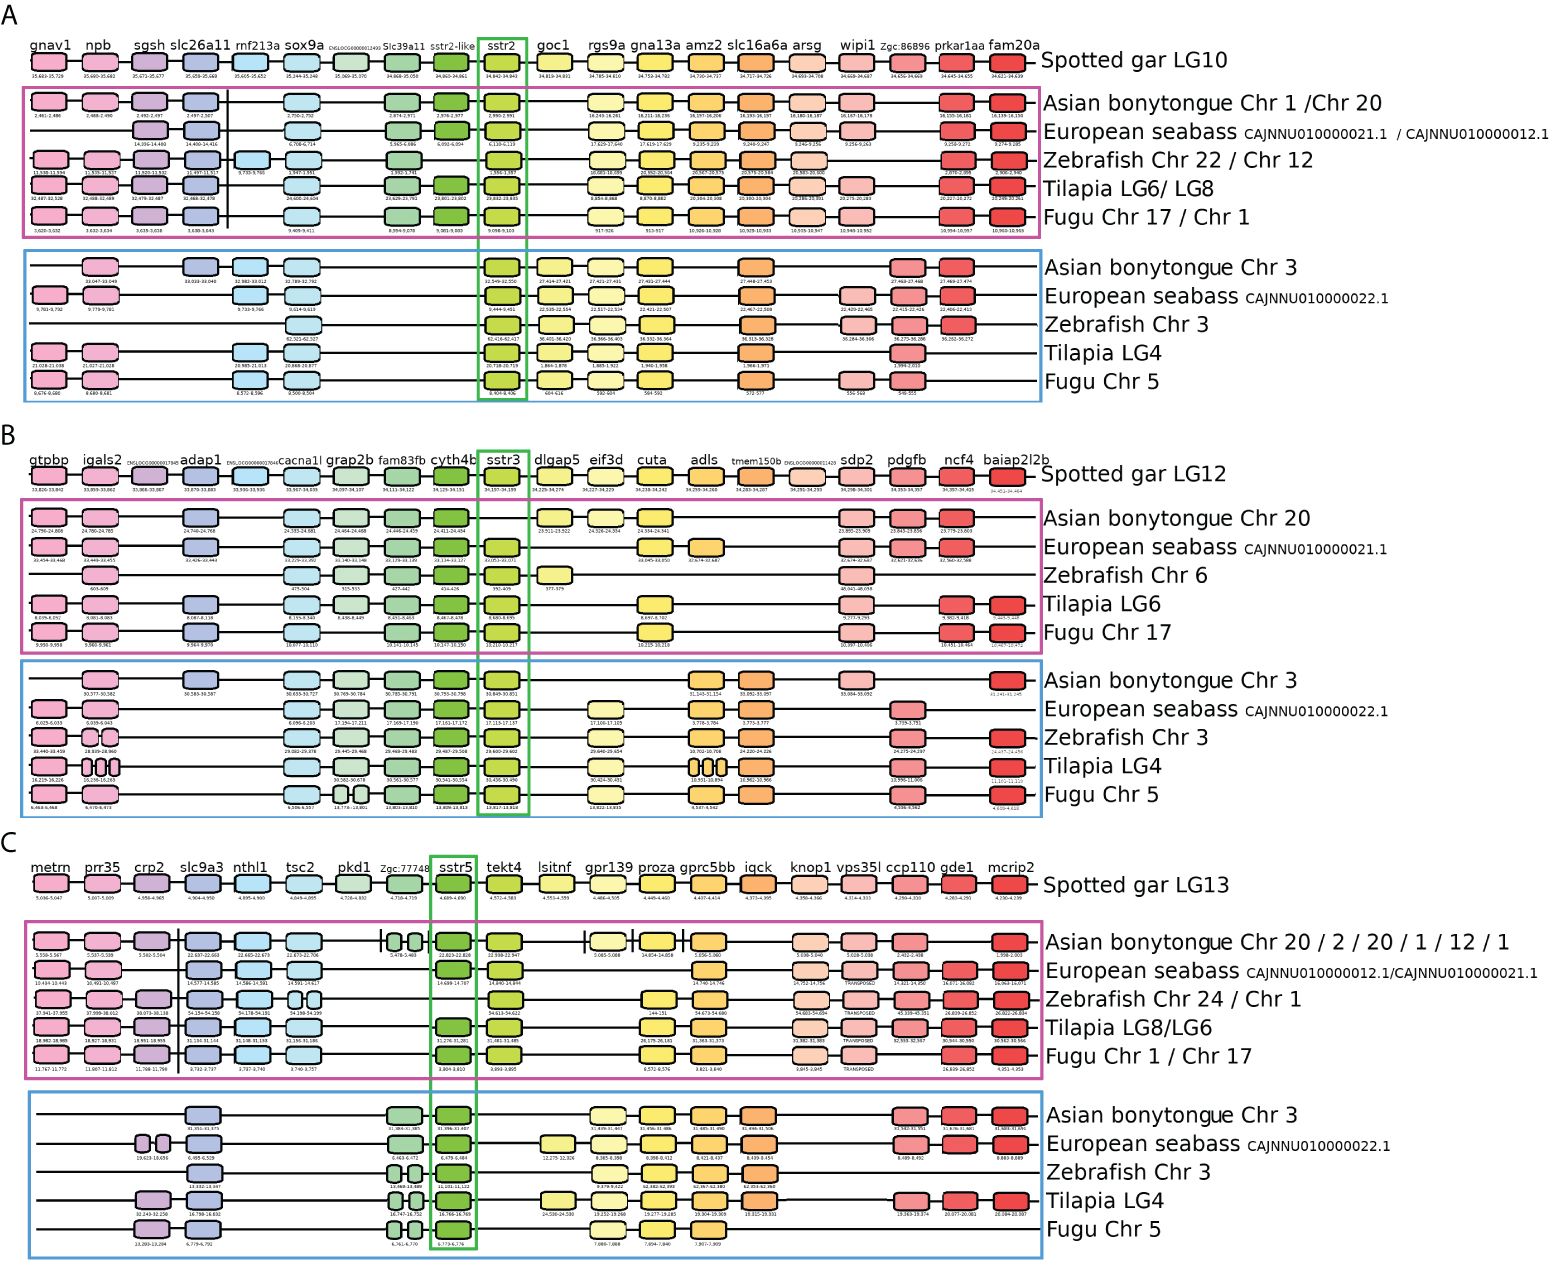
Figure 1 Synteny analysis of sstr genes. Representation of the genomic regions of the studied genes. Gene positions are expressed in 103. (A) Synteny analysis of the sstr2 gene. The spotted gar (Lepisosteus occulatus) has been used as a reference to identify two duplicated paralogons in teleosts. Paralogon A is enclosed in the purple square and paralogon B is enclosed in the blue square. The gene of interest, sstr2, is marked in green. (B) Synteny analysis of the sstr3 gene. The spotted gar (Lepisosteus occulatus) has been used as a reference to identify two duplicated paralogons in teleosts. Paralogon A is enclosed in the purple square and paralogon B is enclosed in the blue square. The gene of interest, sstr3, is marked in green. (C) Synteny analysis of the sstr5 gene. The spotted gar (Lepisosteus occulatus) has been used as a reference to identify two duplicated paralogons in teleosts. Paralogon A is enclosed in the purple square, and paralogon B is enclosed in the blue square. The gene of interest, sstr5, is marked in green.
The gene related to sstr2, named sstr2-like, was found in the spotted gar as the closest gene to sstr2. In Nile tilapia, the gene sstr2-like consists of one exon 1963 nucleotides in length that encodes a protein of 339 amino acids. The protein encoded by the sstr2-like gene has prints for a somatostatin receptor. However, unlike the other SST receptors, the protein encoded by the sstr2-like gene contains only 6 transmembrane domains; it is missing one domain. This gene was also affected by the whole genome duplication effect and has been preserved in paralogon A in the teleosts.
The gene encoding the SSTR6 receptor exists in medaka (Oryzias latipes) and likely emerged after loss of a duplicate during the 3R event (42). Although not reported previously, medaka lacks copies of the sstr6, sstr1, and sstr4 genes. By contrast, tilapia lacks the sstr6, sstr1, and sstr4 genes altogether. These discrepancies in gene conservation between Nile tilapia and medaka may result from extensive genomic rearrangements that have affected the distribution of somatostatin receptor genes in teleosts. Chromosome missegregation and subsequent genomic rearrangements may also have contributed to these differences due to the short generation time in Nile tilapia and medaka species.
The analysis of the genomic region of sstr3 revealed that paralogon A contains the gene cuta and paralogon B contains the gene tmemb150b (Figure 1B; Supplementary Table 1B). The protein SSTR3a was encoded by the gene sstr3a of the Nile tilapia found in paralogon A, and the protein SSTR3b was encoded by the gene sstr3b of the Nile tilapia found in paralogon B (Table 1). Further analysis of the receptors encoded by the gene sstr3b showed that SSTR5X1-X2 and -X3 are apparently three splicing variants of this gene and are misnamed as artifacts of possibly different naming processes.
Paralogon A of the gene sstr5 contains the genes metrn, prr35, nthl1, tsc2, text4, knop1, and vps35l. Paralogon B contains the genes iqck and litaf. An entire transposition of paralogon A in teleosts occurred between the genes crp and slc9a3 (Figure 1C; Supplementary Table 1C). The Asian bonytongue also experienced the transposition of some of the genes into different chromosomes. The protein SSTR5b was encoded by the gene sstr5b of the Nile tilapia found in paralogon B (Table 1).
The results of the phylogeny analysis showed a major group of monophyletic origin formed by SSTR5, SSTR3, and SSTR2. Within this branch, SSTR3 and SSTR5 exhibit a shared monophyletic origin, and SSTR2 is basal to them. The SSTR4, SSTR1, and SSTR6 sequences are basal to the previous list. Within this grouping, the SSTR4 sequences appear to be basal to SSTR1 and SSTR6 (Figure 2; Supplementary File 1, Supplementary Table 2). Generally, each group of SSTR receptors was further split into two clades, one for tetrapods and the other containing piscine SSTRs. In the piscine group, the spotted gar is basal to the teleosts. In SSTR1 and SSTR6, the coelacanth is basal to the actinopterygians and teleosts, while the coelacanth is absent from the other groups. No actinopterygian or teleost SSTR4 has been found thus far, but it is still present in the sarcopterygians, including the coelacanth.
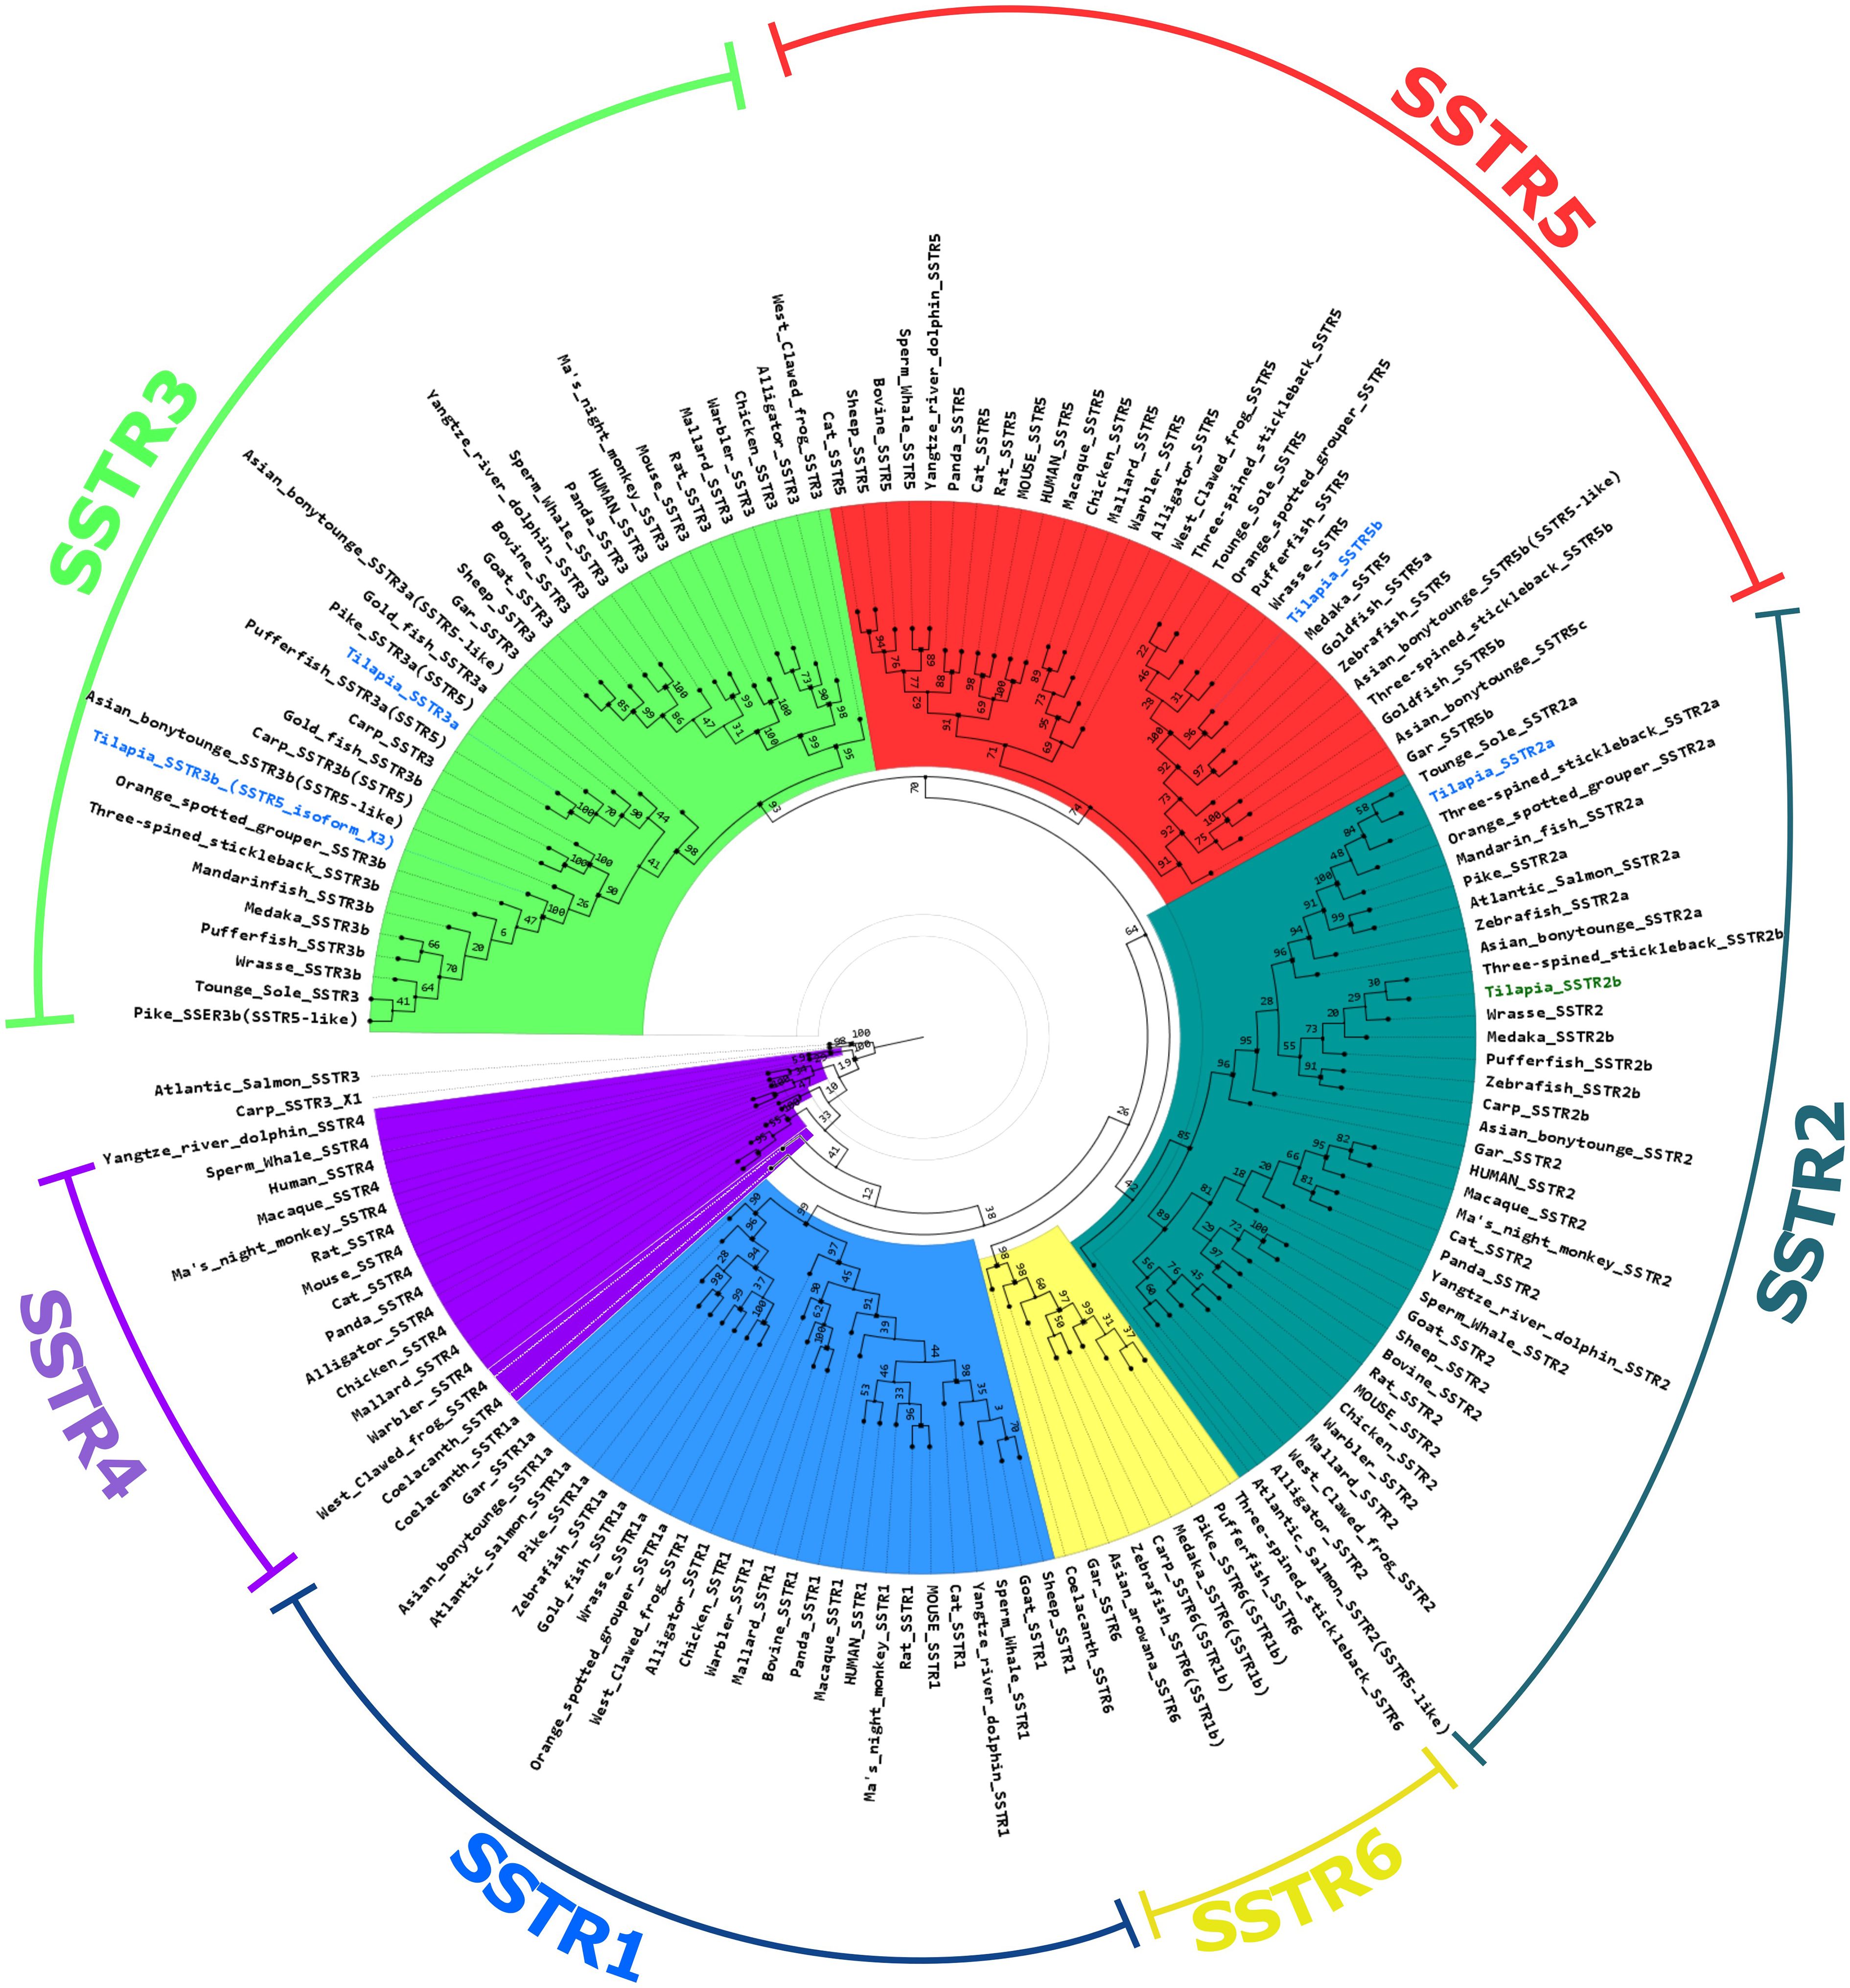
Figure 2 Phylogenetic tree of somatostatin receptors. A maximum likelihood method-based phylogenetic tree of the different SSTR types. Tilapia SSTRs relevant to this study [SSTR2a; SSTR3a; SSTR5b, and SSTR3b(5_isoform_X3)] are marked in blue. The tilapia SSTR2b is marked in green. The scale is marked on the right bottom corner.
We also performed RNA-seq analysis on pituitaries of transgenic tilapia that express GFP in FSH cells and RFP in LH cells (23, 24). Of the nine paralogs of SSTR identified in the tilapia genome, only four were expressed in the pituitary (SSTR3b, SSTR5b, SSTR2a, and SSTR3a; marked in blue in Figure 2) (21). Comparison of each receptor expression in LH and FSH cells to their expression in the negative fraction (Figure 3) identified two main SSTRs that had significantly high expression in each gonadotroph: sstr3b was highly expressed in FSH cells, whereas sstr3a and sstr5b were highly expressed in LH cells. The sstr2a and sstr5b genes were expressed in the negative fraction, probably because this fraction included GH cells (Figure 3, Table 2).
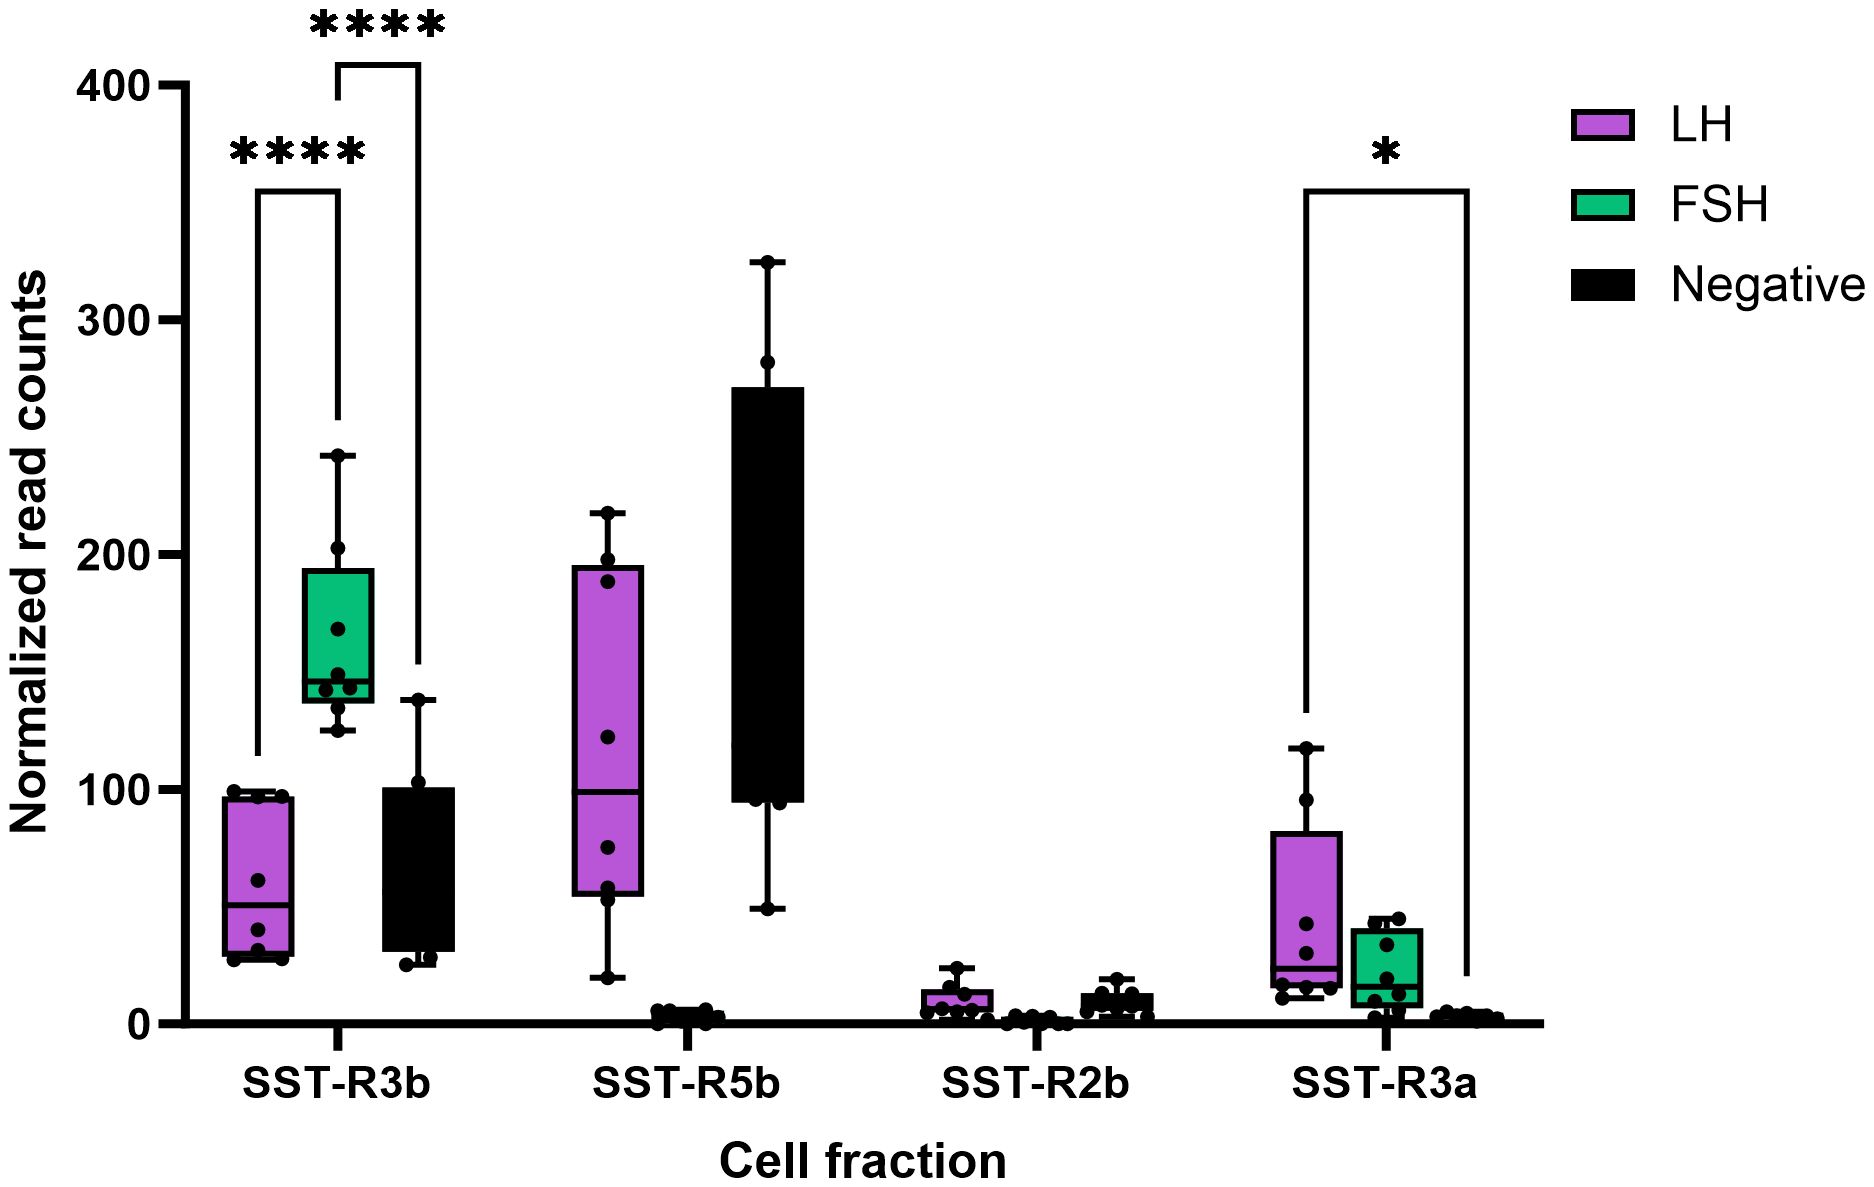
Figure 3 Expression of somatostatin receptors in LH and FSH cells isolated from tilapia pituitaries. RNA-seq of FACS-isolated cells identified the different types of SSTRs from pituitaries of transgenic tilapia expressing RFP in LH cells and GFP in FSH cells. Isolated LH cells, FSH cells, and negative pituitary cells were subjected to RNA-seq as described previously (21). The complete transcriptome information is available in GEO through accession number GSE159470. Asterisk represents significantly different expression values as compared to the negative cells (*p < 0.05; ****p < 0.00001).
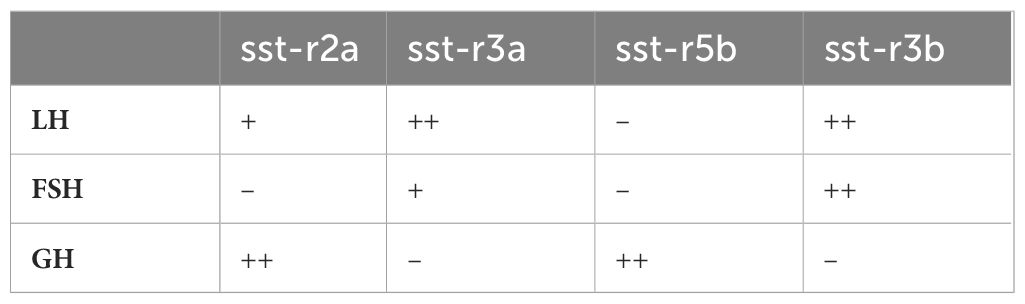
Table 2 The relative number of LH, FSH, and GH cells expressing each SSTR subtype according to hybridization chain reaction (HCR)/immunofluorescence assays, as presented in Figure 4.
3.2 Colocalization of somatostatin receptors in tilapia pituitary
Cell-specific SSTR expression was revealed by RNA-seq and in situ hybridization using specific probes for each receptor in the double-labeled transgenic fish (23, 24). The use of immunofluorescence with specific antibodies for GH showed that the somatotropes almost exclusively expressed sstr2a (Figures 4A–D) and sstr5b (Figures 4I–L) mRNA, whereas sstr3a (Figures 4E–H) and sstr3b (Figures 4M–P) mRNA were expressed mainly by FSH and LH cells. These results are summarized in Table 2.
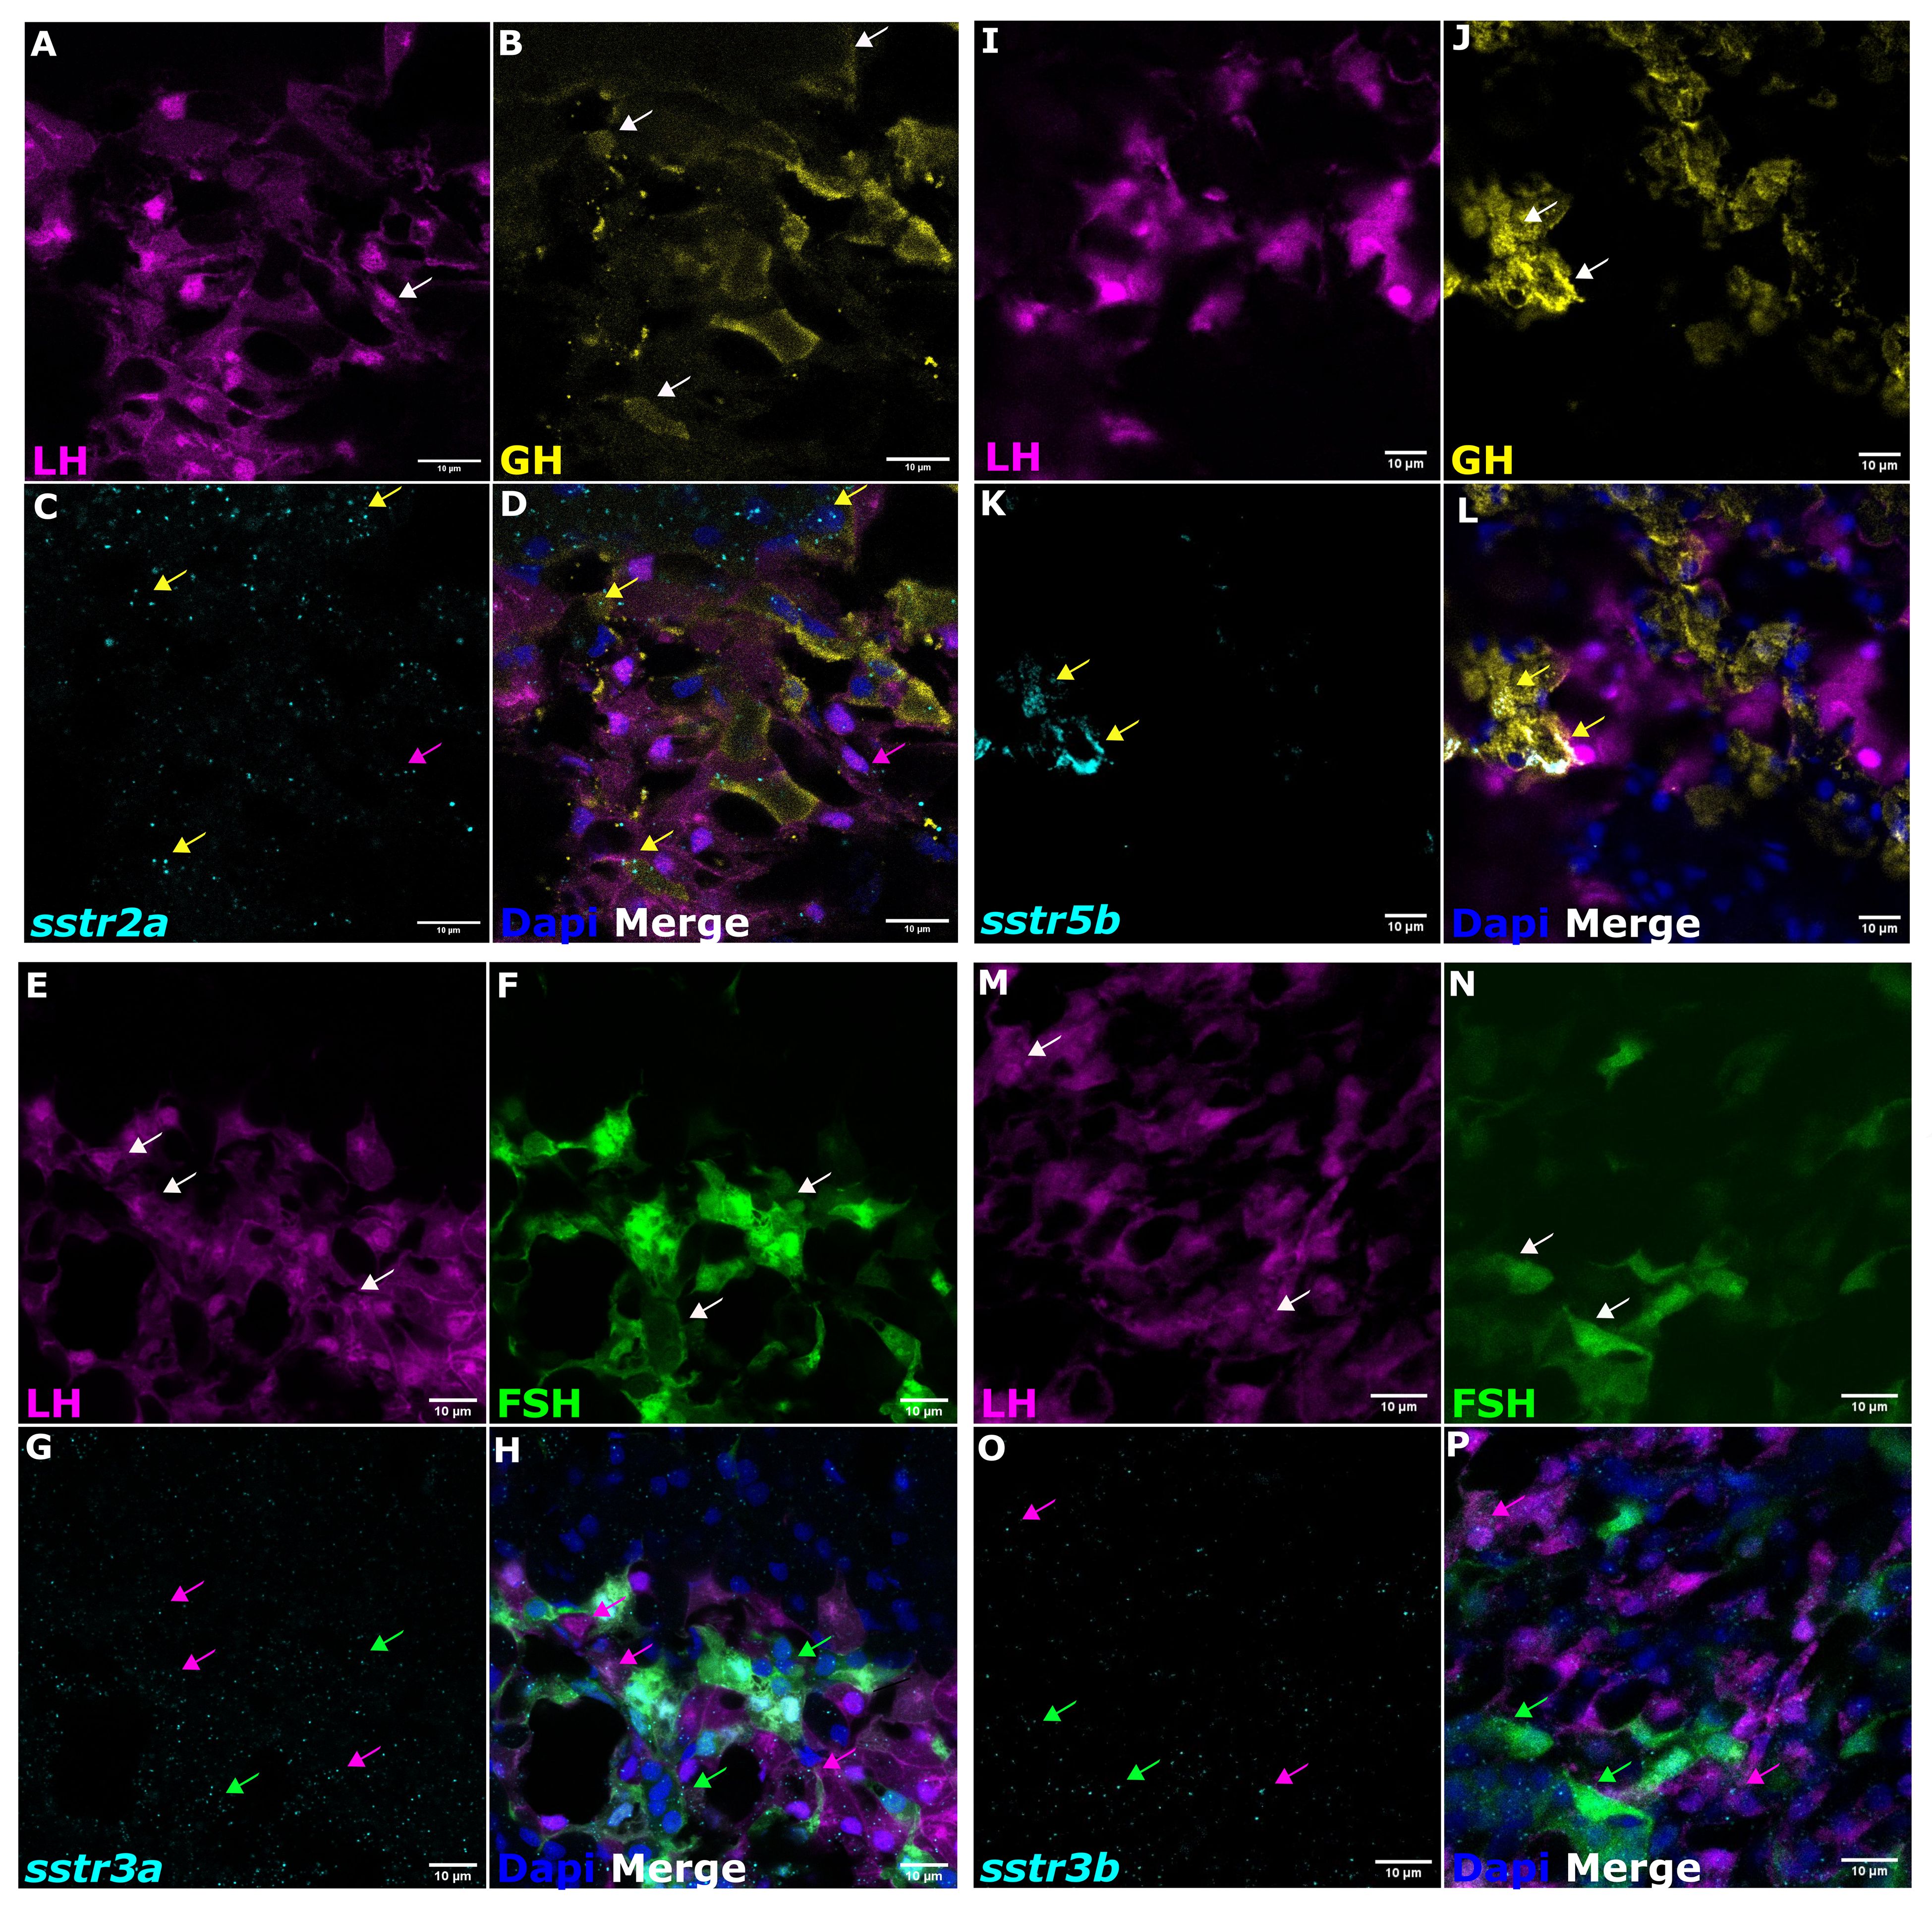
Figure 4 The mRNA expression analysis of sstr in tilapia pituitary cells. Double-labeled pituitaries from transgenic tilapia with labeled LH [(A, I, E, M) magenta] and FSH cells [(F, N) green] and immunofluorescence-stained for GH [(B, J) yellow] were used for in situ hybridization chain reaction (HCR) (v3.0) to determine co-localization of mRNA expression of different sstr genes [(C) sstr2a; (K) sstr5b; (G) sstr3a; (O) sstr3b; cyan). Nuclei are stained with DAPI [(D, L, H, P) blue]. In the merged box, magenta arrows show LH cells, green arrows show FSH, and yellow arrows show GH cells. Scale bar, 10 µm.
3.3 Homology modeling and binding site prediction
RNA-seq conducted on whole brain samples from mature reproductive tilapia fish (22) indicated that tiSST3 and tiSST6 were more highly expressed than SST1 in mature reproductive males (Figure 5A, Table 1), implying potential pivotal roles for these two subtypes in reproduction. Because we focused on brain SST and its interactions with pituitary-expressed SSTRs during the reproductive season, we conducted further analyses only on tiSST6 and tiSST3.
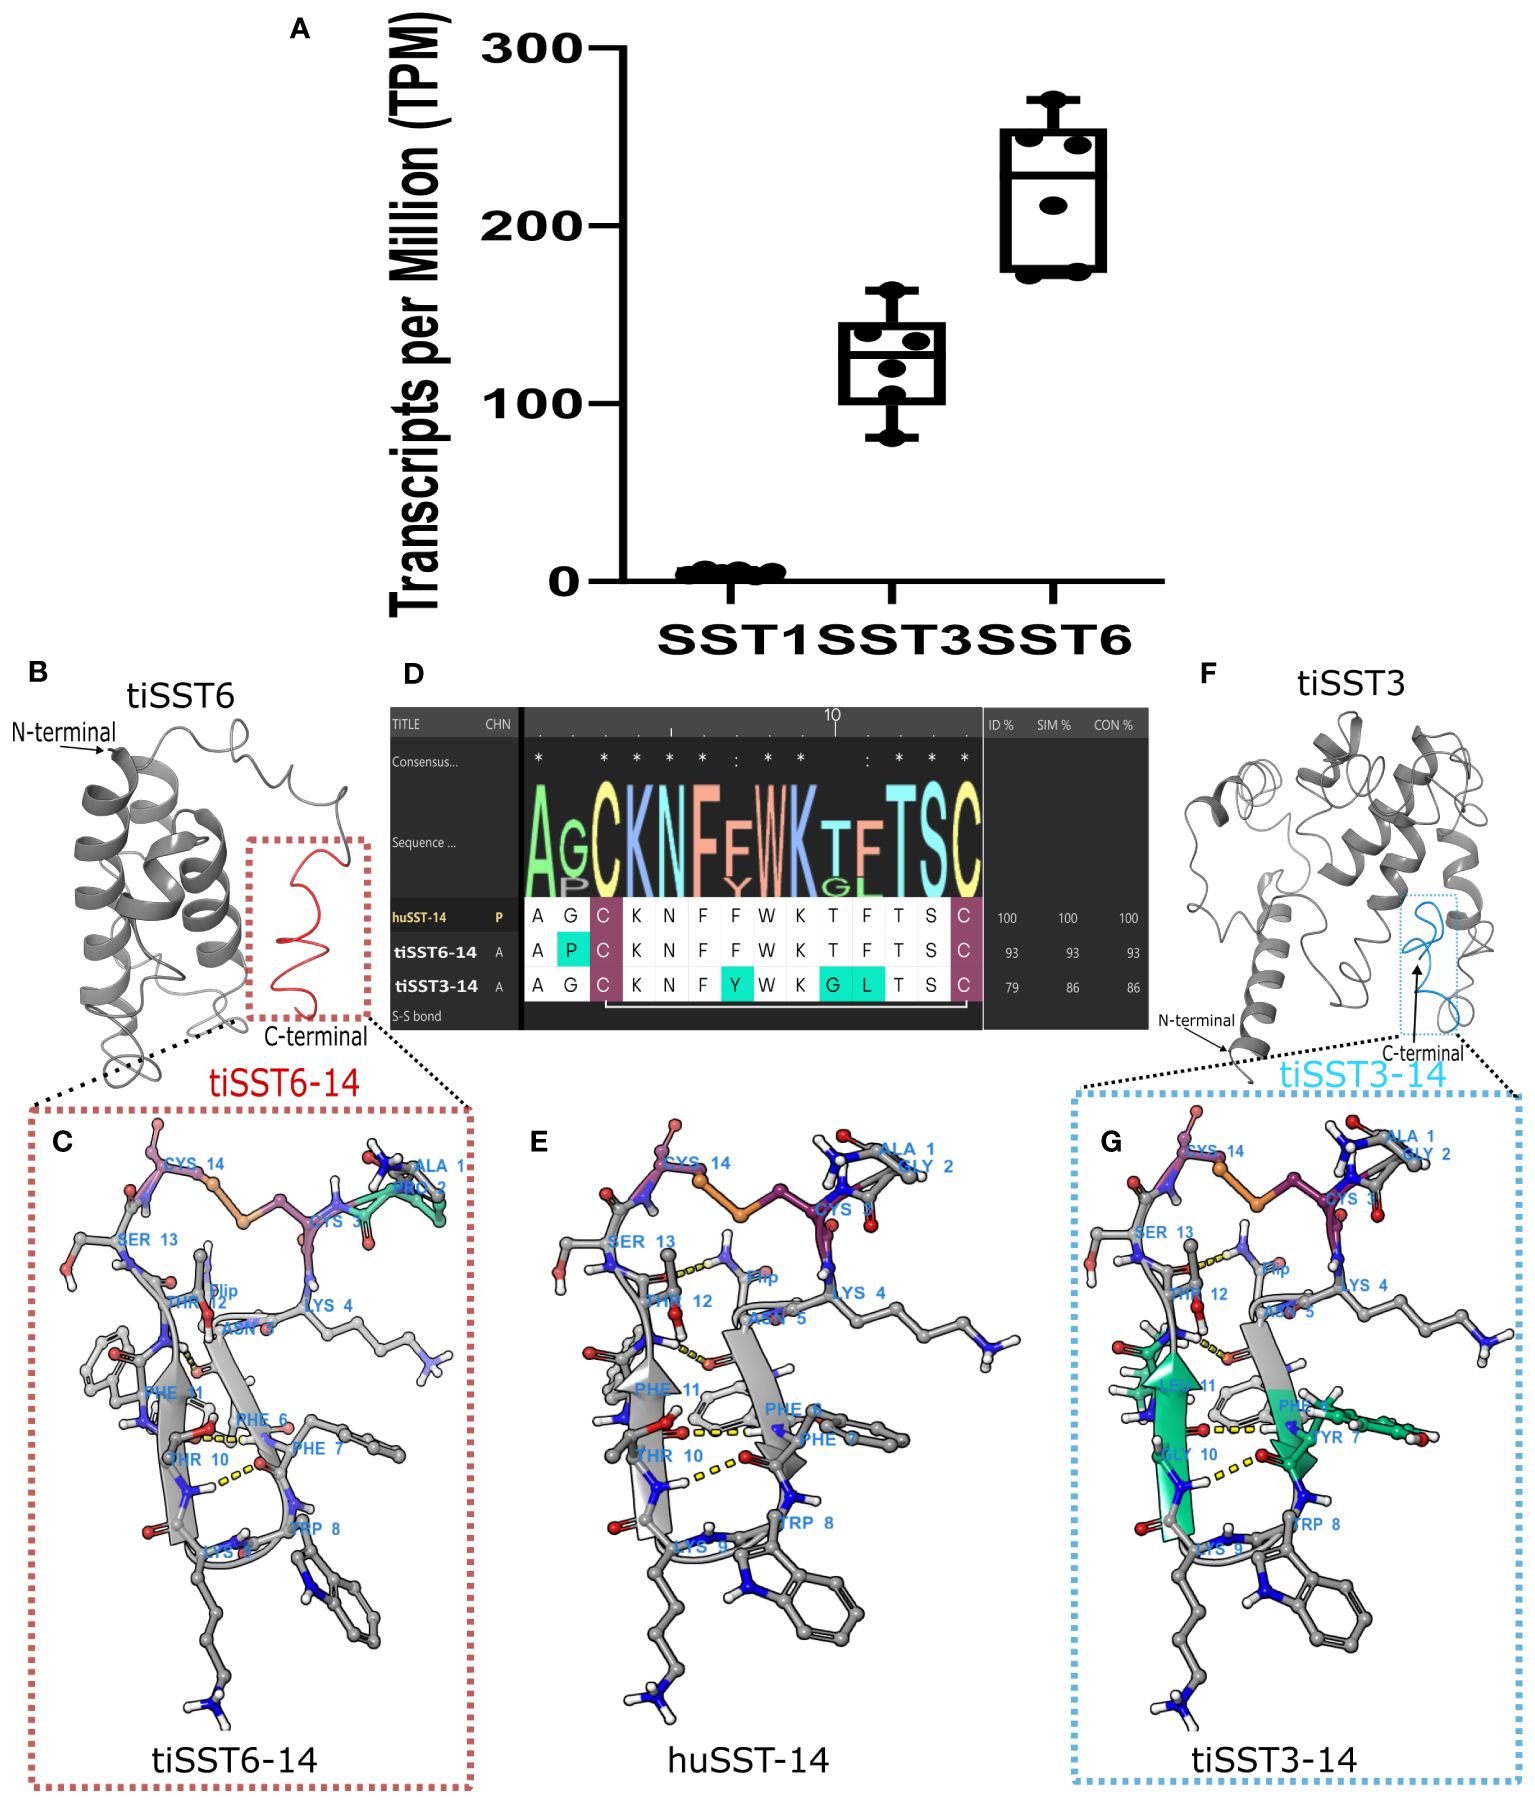
Figure 5 Structure of active peptide SST14 in tilapia brain. The 14-aa peptide SST14 is marked in red in tiSST6 (A) and in aqua in tiSST3 (E). Multiple sequence alignment and homology models of SST6–14 [(B) APCKNFFWKTFTSC], tiSST3–14; [(F) AGCKNFYWKGLTSC]; and huSST14 [(D), AGCKNFFWKTFTSC]. Cystine (Cys) is marked in maroon, sulfide bonds are marked in orange and red, and variations from huSST14 are marked in cyan. (C) The weblogo depicts the sequence alignment of the tilapia and human SST1–14. (G) The different types of somatostatin that are expressed by RNA-seq of tilapia brain.
Somatostatin precursors are large proteins (e.g., SST6, 110 aa; SST3, 191 aa), whereas the known biologically active component SST-14 is only a 14-aa-long peptide at the C-terminus of the protein (Figures 5B, F). SST-14 acquired a circular post-cleavage conformation by the formation of a sulfide bond between the cysteines at the 3rd and 14th positions of the peptide, resulting in the creation of a ring structure in the peptide chain (Figure 5). tiSST6–14 showed a higher identity to huSST-14, with only a proline substitution for glycine at the 2nd position of the peptide. In tiSST3–14, tyrosine replaced phenylalanine at 7th position, glycine replaced threonine at 10th position, and leucine replaced phenylalanine at the 11th position relative to huSST-14.
The models for tiSSTRs generated using huSSTR2 as a template (PDB:7T10) are shown in Figures 6A, B. The SST receptors are class A (rhodopsin-like) GPCRs (31). As with other peptide-binding receptors, they exhibit an extracellular domain (ECD), a seven-transmembrane domain (7TM) connected by intracellular and extracellular loops (ECLs), and an intracellular domain (ICD). Our models showed a large ECD and ICD in all tiSSTRs; however, tiSSTR3a (482aa) and tiSSTR3b (483aa) had larger sequences and contained structurally similar N-terminal and C-terminal regions, which were longer than in the other homologs.
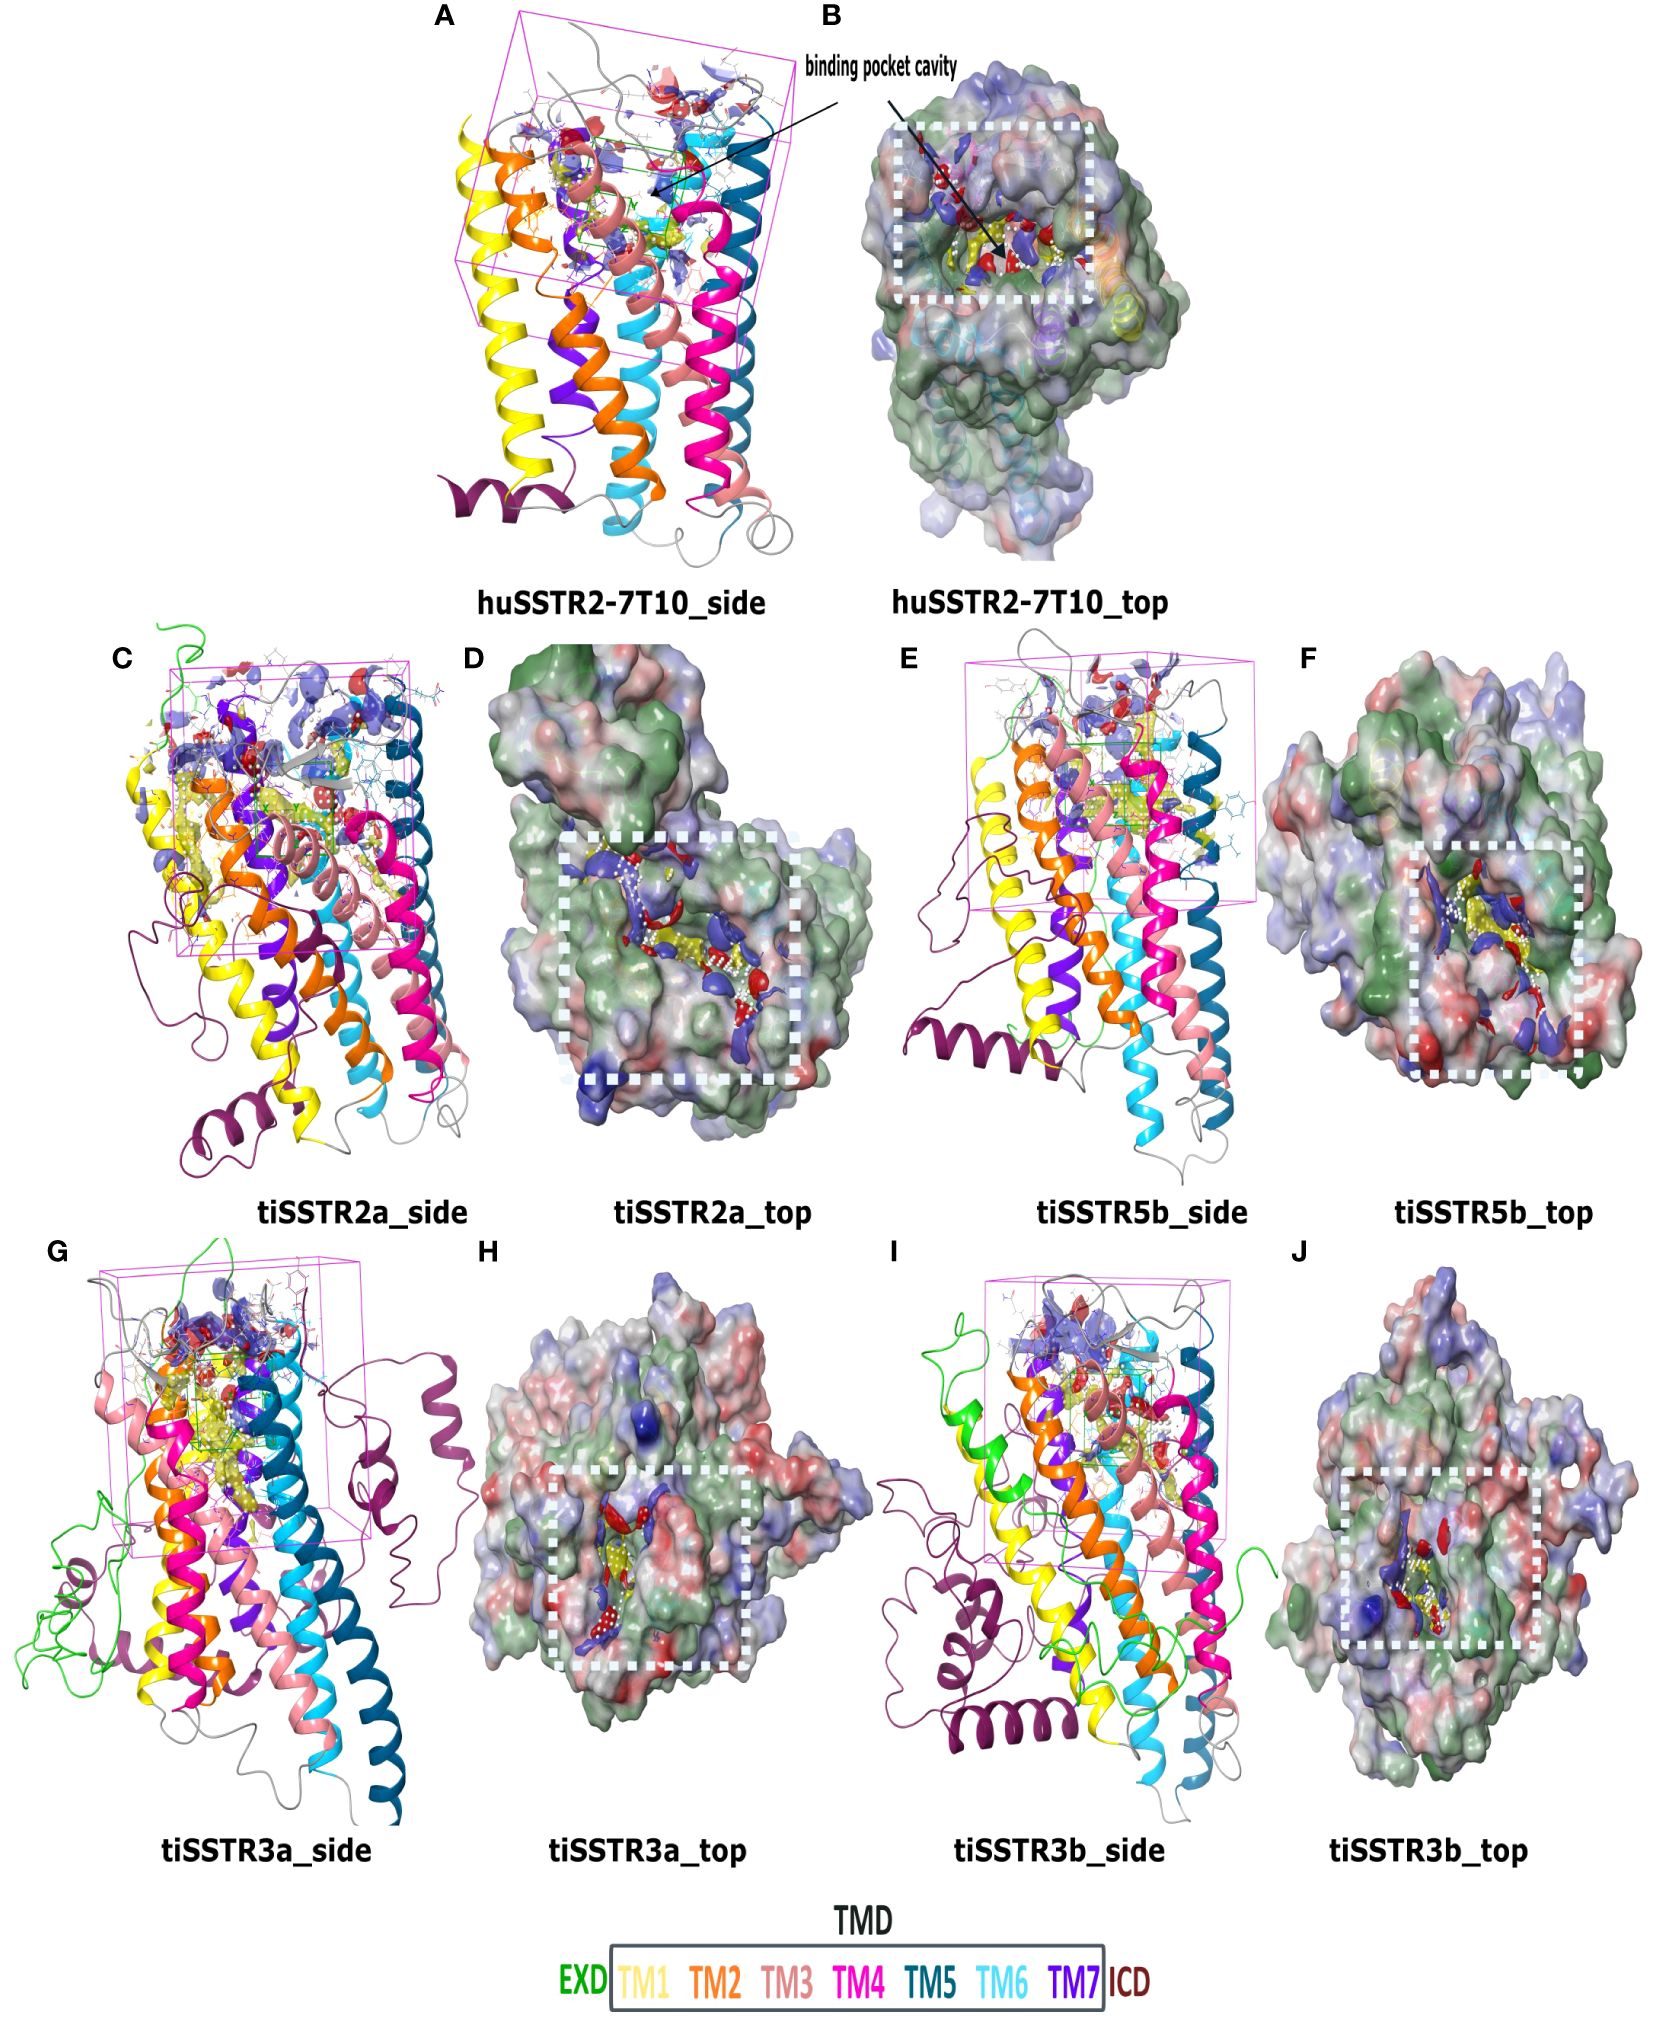
Figure 6 SSTR homology models and binding pockets. Homology models and predicted binding sites for huSSTR2 (PDB:7T10) (A, B); tiSSTR2a (C, D); tiSSTR5b (E, F); tiSSTR3a (G, H); and tiSSTR3b (I, J) showing ECD (green), TM1 (yellow), TM2 (orange), TM3 (peach), TM4 (pink), TM5 (teal), TM6 (cyan), TM7 (violet), and ICD (maroon). The site map within the white box (D, F, H, J) shows the hydrophobic region (yellow), the hydrogen-bond donor (blue), and acceptor maps (red).
tiSSTR2a (Figures 6C, D), tiSSTR5b (Figures 6E, F), tiSSTR3a (Figures 6G, H) and tiSSTR3b (Figures 6I, J) each possessed a putative orthosteric binding pocket, a common feature in most class A GPCRs (43). This binding pocket was located in the transmembrane cavity, which implies the potential involvement of the ECD and ECL. Unlike the case in other specific GPCRs, such as GnRHRs, the ECD did not obstruct the binding pocket in tiSSTRs (Figure 6). The binding sites of tiSSTR3a and tiSSTR3b were quite similar and were primarily composed of the hydrophobic cleft in the TMD. The binding site located on tiSSTR2a was apparently larger than in other SSTRs.
3.4 Signal transduction analysis of SSTRs in the presence of a somatostatin agonist and native peptides
Comparison of the activation of the different SST receptor types by the native SST6 and SST3 ligands versus octreotide, a commercial SSTR agonist, in COS-7 cells revealed differences in the potency, selectivity, and signal transduction pathways. Like dopamine and melatonin receptors, SSTRs are inhibitory receptors that inhibit adenylate cyclase activity upon coupling to Gαi/o and reduce cAMP production (17, 36); thus, the ligand effect was analyzed in the presence of forskolin (20 µM), which increased cAMP levels, as reflected by an elevation in luciferase activity. Treatment with octreotide, tiSST6, and tiSST3 at subnanomolar concentrations inhibited tiSSTR2a Cre-luc activity (Figure 7A, Table 3). Highly potent inhibition of SSTR5b Cre-luc activity was also observed (Figure 7C; IC50 = 906.1, 720.2, and 157.0 nM, for octreotide, tiSST6, and tiSST3, respectively; Table 3). Octreotide was the most efficient activator of SSTR3a (IC50 = 0.004 nM; Figure 7B, Table 3), and SST6 was more efficient than SST3 (Figure 7B; IC50 = 3.75 and 572.9 nM, respectively). When exposed to SSTR-3b, both ligands inefficiently inhibited Cre-luc activity (Figure 7D).
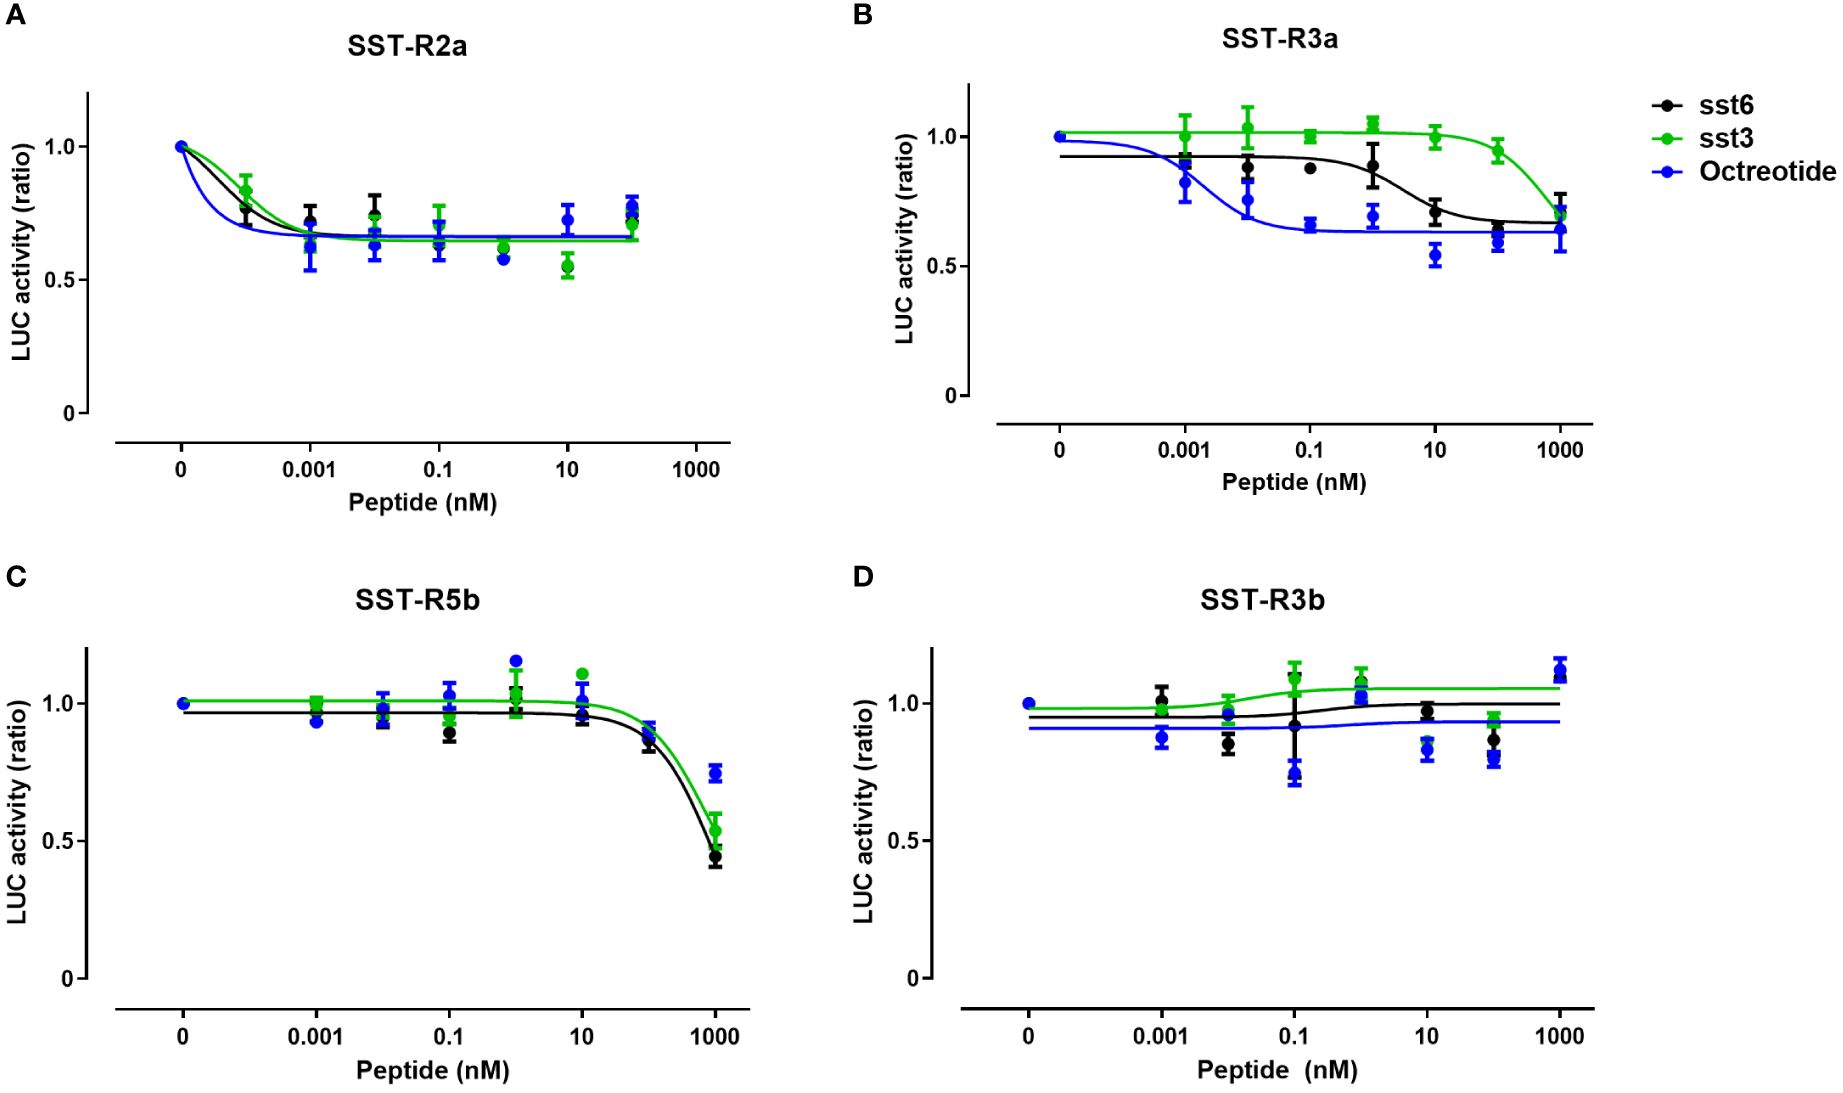
Figure 7 Signal transduction activity of somatostatin receptors induced by an SSTR agonist and native SST peptides. COS‐7 cells were co‐transfected with Cre‐luc plasmid and either SSTR2a (A), SSTR3a (B), SSTR5b (C), or SSTR3b (D). Transfected cells were exposed to increasing concentrations of octreotide (an SST agonist) or somatostatin peptides SST6 or SST3 (0–1000 nM) in combination with FSK (20 μM). Graphs show fold changes in luciferase activity relative to the basal level. Averaged data from three experiments are shown and are presented as mean ± SEM. Asterisk-marked points significantly differ from basal levels: *p < 0.05; **p < 0.01, (one-way ANOVA followed by Dunnett’s test).
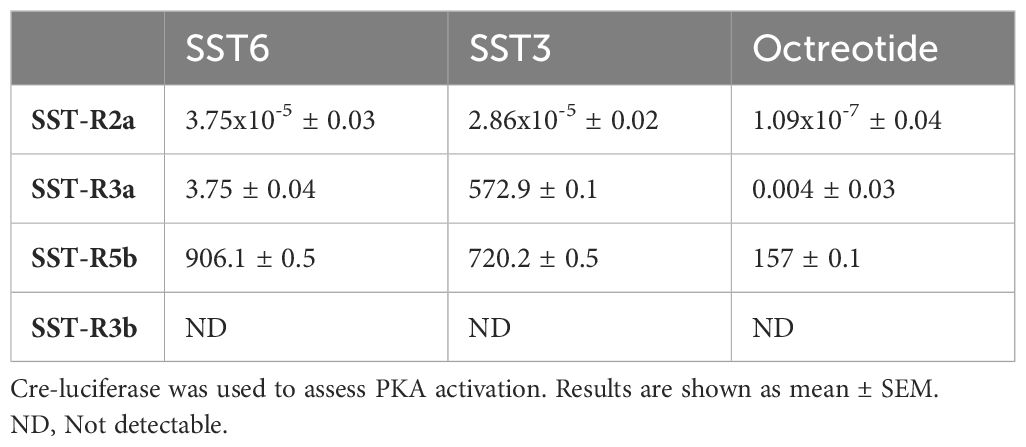
Table 3 IC50 values (nM) of SSTR agonist octreotide and native peptides SST6 and SST3 on tilapia SST receptors.
3.5 Signal transduction activity of a somatostatin agonist (octreotide) and antagonist (cyclosomatostatin)
Agonists and antagonists are commonly used to study receptor activation and to develop drugs with specific targets and activities. We, therefore, activated tiSSTRs by cyclosomatostatin, an SSTR antagonist, dose-dependently in the presence of a constant concentration of SSTR agonist (10 nM; Figures 8A–D). Conversely, the effect of different doses of octreotide, an SSTR agonist, was tested in the presence of a constant concentration of SSTR antagonist (10 nM; Figures 8E–H). Although both octreotide and cyclosomatostatin were developed for mammalian receptors (44), both were very effective in fish SSTRs (45). SSTR3a and SSTR5b were most effectively stimulated by the SSTR antagonist (EC50 = 0.1 and 2.15 nM, respectively; Figures 8B, C, Table 4). By contrast, SSTR2a displayed the lowest stimulation by different doses of SSTR antagonist (EC50 = 188.4 nM, Figure 8A, Table 4) and the highest inhibition by SSTR agonist together with SSTR3a and SSTR3b (IC50 = 0.81, 8.6x10⁻⁴ and 0.35 nM, Figures 8F, H, Table 4). SSTR3a was the most effective when stimulated with octreotide (Figure 8F, Table 4). Overall, SSTR5b was the most efficient receptor in terms of maximal response to the SST antagonist.
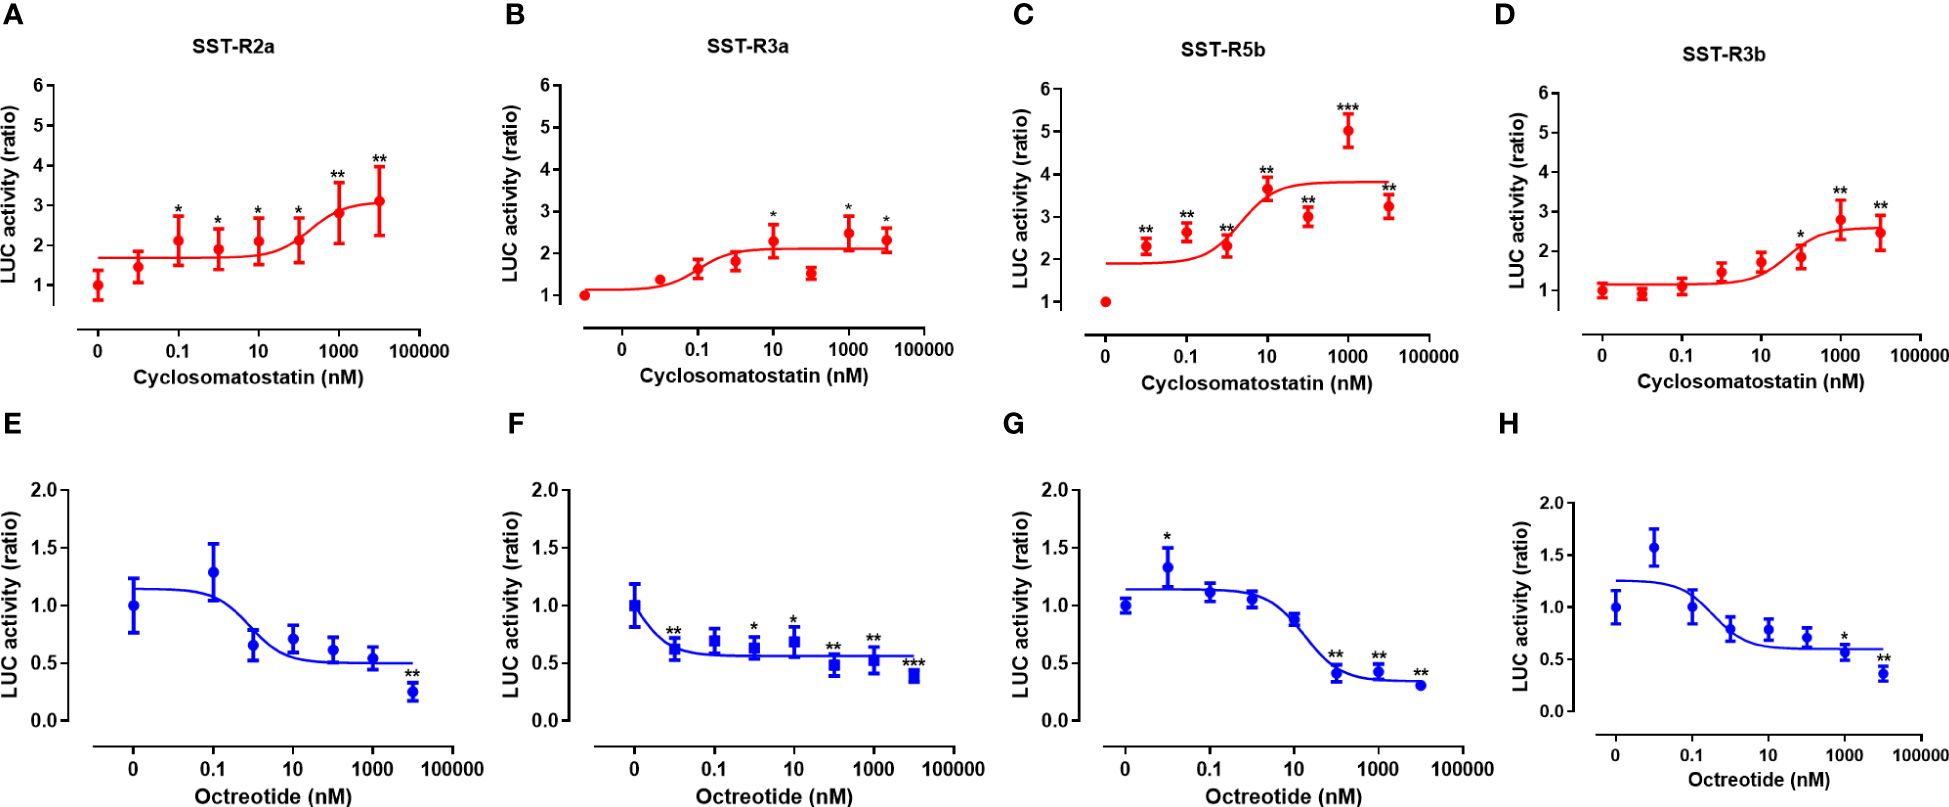
Figure 8 Signal transduction activity of somatostatin receptors induced by an SSTR agonist (octreotide) and antagonist (cyclosomatostatin). COS‐7 cells were co‐transfected with Cre‐luc plasmid and either SSTR2a (A, E), SSTR3a (B, F), SSTR5b (C, G), or SSTR3b (D, H). Transfected cells were exposed to increasing concentrations of cyclosomatostatin (0–1000nM) in the presence of octreotide (10 nM) and FSK (20 μM; (A–D), red lines) and increasing concentrations of octreotide (0–1000nM) in the presence of cyclosomatostatin (10 nM) and FSK (20 μM; (E–H), blue lines). Graphs show fold changes in luciferase activity relative to the basal level. Averaged data from three experiments are shown and are presented as mean ± SEM. Asterisk-marked points significantly differ from basal levels: *p < 0.05; **p < 0.01, ***p< 0.0001 (one-way ANOVA followed by Dunnett’s test).
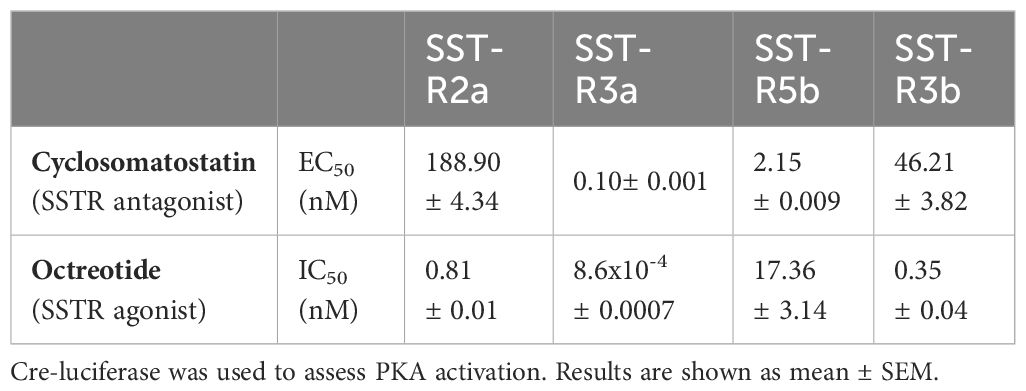
Table 4 The effect of cyclosomatostatin and octreotide on tilapia SST receptors.
3.6 In vivo effect of SSTR antagonist and agonist on FSH, LH, and GH plasma levels
We investigated the physiological impact of the SSTR antagonist and agonist on the release of gonadotropins and growth hormone by assessing their plasma concentrations after administering intraperitoneal injections of these compounds to sexually mature female tilapia. Administration of SSTR antagonist cyclosomatostatin increased FSH and LH levels, compared to the control, as early as 2 h post-injection (Figures 9A, B). However, GH levels were the same as in the control fish. As expected, administration of the SSTR agonist octreotide significantly decreased GH plasma levels at 2 h post-injection, and this reduction persisted even after 4 and 6 h (Figure 9C). Octreotide also resulted in decreased FSH plasma levels at 2 h postinjection and thereafter (Figure 9A), whereas LH plasma levels remained similar to the control (Figure 9B).

Figure 9 In vivo effect of an SSTR agonist (octreotide) and antagonist (cyclosomatostatin) on gonadotropins and GH plasma levels. Female tilapia were injected with the SSTR antagonist cyclosomatostatin or the SSTR agonist octreotide (100 μg/kg BW) at time point 0; saline-injected fish served as controls. Blood was sampled at 2, 4, 6, and 24 h after injection. Plasma FSH (A), LH (B), and GH (C) levels were analyzed by specific ELISAs (mean ± SEM; n = 8 fish per group). Letters denote statistically significant differences among groups (P < 0.05), as determined by two‐way ANOVA followed by Tukey’s multiple comparison test.
4 Discussion
Somatostatin has diverse physiological functions in all vertebrates, including an essential role in inhibiting GH secretion from the pituitary (2). Its inhibitory action was later shown for a wide range of hypophyseal hormones, including prolactin, thyrotropin, and ACTH (46–48), as well as in the gastrointestinal hormones gastrin (49), cholecystokinin (CCK) (50), gastric inhibitory peptide (GIP) (51), neurotensin (52), and pancreatic glucagon (53, 54) and insulin (51, 53, 54). SST is also a neuromodulator that regulates motor activity (55) and aggressive behavior in cichlid fish (45). However, little is known about the effect of SST on reproduction in either fish or mammals. Therefore, we studied the regulation of growth and reproduction hormones by the somatostatin system in tilapia.
In jawed vertebrates, SST1–6 are the products of at least six paralogous sst1–6 genes (16, 56). Following the second whole genome duplication, the vertebrate SST ancestor was deduced to have possessed three sst paralogs, SST1, SST2, and SST5. SST3 and SST6 then arose by duplication of the SST1 and SST2 genes, respectively (16, 56). Our characterization of the somatostatin peptides in the tilapia brain by RNA-seq of mature fish revealed only three SST peptide forms: SST6, SST3, and low levels of SST1. The SSTR subfamily encompasses SSTR1–5, which has several different isoforms in the tilapia genome (tiSSTR2a, tiSSTR3a, tiSSTR5b, and tiSSTR3b). Our syntenic analysis revealed that the studied proteins were affected by the whole genome duplication of the teleosts (57), thus producing several genes encoding different proteins, including the studied receptors (Table 1, Figure 1). Whole genome duplications described in other receptors and their ligands in teleosts (20, 58–61) increase their functional complexity.
Our results are consistent with previous analyses by Tostivint (62), who found preserved copies of the genes studied in this syntenic analysis. Furthermore, Tostivint and colleagues (62) suggested that the genes sstr2 and sstr3 were on the same chromosome in the ancestor of the teleosts. Contrary to the situation observed in the spotted gar, all the genes within paralogons A and B in teleosts were situated on the same chromosome. Therefore, the synteny analysis agrees with the hypothesis of Tostivint and O’Campo-Daza that the ancestral genes were arranged together and gave rise to the different receptors placed on the same chromosome in teleosts (63). The presence of three receptors on the same chromosome in both paralogon A and its duplicate, paralogon B, suggests a unique gene arrangement in teleosts, likely originating from a specific rearrangement involving the genes sstr2, sstr3, and sstr5. This rearrangement led to all three receptors being located on the same chromosome, followed by duplication events.
The gene sstr2-like in the spotted gar likely resulted from a local duplication. Its asymmetric conservation in the teleost paralogon A suggests that the duplication occurred before the teleost whole genome duplication, potentially in their actinopterygian ancestor. However, the gene structure and encoded peptide are highly divergent, as they lack introns and possess only 6 transmembrane domains, unlike the 7 domains that are essential for the proper function of rhodopsin-like GPCRs (42). Thus, the sstr2-like gene may be undergoing a functional alteration that may possibly lead to pseudogenization.
Our phylogenetic analysis showed that the earliest divergence was into a major clade containing SSTR2, SSTR3, and SSTR5. These receptors, as well as SSTR1 and SSTR6, have a monophyletic origin and are basal to the previous clade. The sequences of SSTR4 are basal to the other groups. The receptors SSTR1 and SSTR6, as well as SSTR3 and SSTR5, share a monophyletic origin. A previous investigation explored the hypothesis that two rounds of whole genome duplication, referred to as 2R, influenced the genes encoding the SSTRs (42, 62). According to this framework, the ancestor of vertebrates after the 2R event should have possessed 8 SSTR genes, but only 6 genes are currently identified. This discrepancy may be explained by a loss of 2 genes prior to the radiation of vertebrates, resulting in the present count of 6 somatostatin receptors in extant species. Our phylogenetic analysis aligns with this hypothesis (42, 62). Notably, the absence of a monophyletic origin for a pair of receptors branching with SSTR4 suggests a potential loss of the duplicate sstr4 gene. Similarly, the clade housing the SSTR2 sequences lacks a coupled clade, indicating that the duplicate of the sstr2 gene might have been lost following the whole genome duplication events in the vertebrate ancestor.
Within the SSTR1, SSTR2, SSTR3, and SSTR5 clades, two distinct monophyletic groups emerged, separating the terrestrial tetrapods from aquatic species, including the coelacanth. Notably, SSTR4 is absent in nonsarcopterygian species, while SSTR6 remains conserved exclusively in aquatic counterparts, including an ancestral sarcopterygian, the coelacanth. The coelacanth grouping within aquatic species in SSTR1 and SSTR6 suggests that phylogenetic divergence mainly affected terrestrial tetrapods. Previous evolutionary studies found that competing selective pressures for aquatic and terrestrial environments produced unique functions and somatic structures, such as the forelimb locomotor mode (64). Further functional analysis could clarify the association between the sequence divergence in sarcopterygian SSTR receptors and terrestrialization events in the tetrapod lineage.
All receptors in teleosts exhibit a monophyletic origin when present, with the spotted gar serving as the basal species. However, exceptions are noted in the SSTR3 sequences from salmon and carp and in the SSTR5 sequence from salmon. These proteins have undergone significant divergence following the whole genome duplication events specific to salmonids, known as 4R (65, 66) and the allotetraploidy events in carp (67). A comprehensive investigation into the conservation of duplicated genes and their functions in salmonids, as highlighted by (68), suggests that genes retained as duplicates after the 3R are likely to persist after the 4R. Consequently, as in our analysis, highly divergent genes are conserved after the 4R and might position outside the major clades or in positions basal to their groups.
In fish, as in mammals, multiple subtypes of SSTRs are found in many tissues, including the kidney, thyroid, adrenal gland, GI tract, and brain (69). Four distinct subtypes (SSTR1–3 and SSTR5) and several SSTR isoforms have been characterized in different fish species (reviewed in (70). We identified the receptor types that are expressed in defined pituitary cells by RNA-seq of LH and FSH cell populations separated from the tilapia pituitary (21, 71). Three distinct subtypes of SSTRs (SSTR2a, SSTR3a, and SSTR5b) and one isoform (SSTR3b) were found at different levels in these gonadotrophs. SSTR3a is enriched in LH cells, while SSTR3b is significantly enriched in FSH cells. The most highly expressed SSTR variants in the somatotrophs were SSTR5b and SSTR3b. SSTR3a was the most abundant SST receptor in LH cells, pointing to the importance of somatostatin in regulating the LH gonadotropin (21).
SSTRs have already been found in the mammalian hypothalamus and pituitary. SSTR2a is the most prevalent SSTR subtype in GnRH neurons in male and female rats (72) and mice (73). In the rat pituitary, SSTR mRNA was widely distributed across major endocrine cell groups. Mammalian somatotrophs showed relatively high expression levels of SSTR4 (which is absent in fish) and SSTR5b, whereas SSTR2a was predominantly expressed in thyrotrophs and LH cells (74). Knowledge of SSTR distribution in specific pituitary and brain cells of fish is minimal. Our data indicate that SST directly regulates LH and FSH at the pituitary level, thereby expanding its previously recognized role in GH release.
The SSTR signal is transduced by intracellular mediators, such as Ca2+, cAMP, cGMP, and nitric oxide (NO) (17). In general, cAMP has appeared as the most prominent signaling pathway for both gene transcription and secretion of SST [reviewed in (75)]. Here, we used both an SSTR agonist and an antagonist to study the signal transduction of these receptors in tilapia. CRE-luc was increased dose-dependently in all SSTRs in the presence of a constant concentration of SSTR agonist (10 nM), whereas it was repressed by different doses of octreotide and a constant dose of SSTR antagonist. Cyclosomatostatin is a nonpeptide SSTR3a-selective antagonist (76). While it elevated cAMP activity in all SSTRs, the highest response was seen in SSTR3a. Conversely, octreotide is an SSTR agonist that binds with high affinity to human SSTR2 and SSTR5 and with moderate affinity to SSTR3a (44).
Our results revealed a similar pattern in tilapia, as SSTR2a had the highest response, followed by SSTR5b. However, SSTR3a was more strongly inhibited by octreotide than by the native tilapia SSTs. Taken together, our results suggest that the binding sites of tilapia SSTRs are similar to those of the human receptors. When SSTR3b was tested solely against a backdrop of FSK, octreotide demonstrated no discernible activation. However, when SSTR3b was activated by cyclosomatostatin in the presence of both FSK and octreotide, efficient activation was observed. This discrepancy might be explained by considering that FSK alone may not have been adequate to elevate cellular cAMP levels sufficiently to detect suppression.
The SSTR subtypes exhibited nearly identical affinity for the endogenous peptide SST14, although SST14 had only 40–55% sequence homology and substantial variation in the extracellular region containing the ligand interaction site (31). This suggests that the binding pocket residues and cavities have substantial similarity. Therefore, we performed binding-site analyses on SSTRs expressed in the tilapia pituitary (tiSSTR2a, tiSSTR3a, tiSSTR5b, and tiSSTR3b). All these SSTRs displayed characteristics of canonical binding sites of peptide-binding class A GPCRs. Studies in huSSTR have suggested that both the extracellular half of the TM domains and the ECLs play essential roles in ligand binding and subtype selectivity (31). Similarly, the orthosteric binding sites in selected tiSSTRs were located on the upper region of the transmembrane cavity and included the ECD and the ECL loops. In huSSTR1, the ECL2 is reported to influence selectivity for the binding of particular peptides (77), whereas ECL3 and its adjoining transmembrane-spanning regions are reported to be critical for the binding of selective agonists (78). The allosteric site reported in human SSTR1 and murine SSTR2 is located in a similar region, albeit deeper within the hydrophobic cleft, and shows typical responses to agonistic and antagonistic compounds, similar to those reported for hSSTR1 (79).
Although the reduction of GH release by SST has been well established in tilapia (39), the possible effect of SST on FSH and LH release was unknown. Therefore, we examined the influence of an IP injection of an SSTR agonist and antagonist on tilapia FSH, LH, and GH plasma levels. In our study, the SSTR antagonist raised LH and FSH levels for 2 h post-injection. LH returned to baseline after 4 h, while FSH remained elevated for 6 h. Octreotide, an SSTR agonist, reduced FSH levels similarly to GH but had no significant effect on LH levels. The high-affinity SSTR agonist octreotide mainly treats acromegaly and pituitary adenomas (44). In female sheep, intracerebroventricular (ICV) infusion of SST abolished pulsatile LH secretion and decreased LH release (80). In rats, the suckling-induced activation of SST-SSTR2a signaling mediated the suppression of pulsatile LH secretion during lactation (81). The lack of an effect of octreotide on LH levels in our study is inconsistent with these previous reports on different species.
SST inhibits the secretion of LH from the pituitary in rats (12), and it also affects LH secretion indirectly by reducing GnRH activity in goldfish, common carp, and grass carp [reviewed in (13)]. Possibly, the concentration of the SSTR agonist used in our experiment (100 µg/kg BW) was insufficient to affect LH levels. A previous study demonstrated a decrease in aggressive behavior in cichlid fish using a higher dose of octreotide (4 mg/kg) (45). In another study, SST administration directly to the target cells via ICV infusion in male rats over a five-day period suppressed the activity of LH-positive pituicytes (12). Our data suggest that SST has similar effects on GH and FSH in tilapia, but has no effect on LH release. Levels of FSH, which regulate gonad growth and development, increase during vitellogenesis in tilapia, whereas LH is responsible for final oocyte maturation and ovulation (40, 82, 83).
The intricate interplay between FSH and GH in fish is required to balance growth and reproduction. The role of GH in the different reproductive stages of fish is not fully understood. GH stimulates the synthesis and secretion of vitellogenin, probably because it enhances estradiol in the liver (84). The vitellogenic phase is characterized by rising levels of both GH and FSH (68). This is consistent with the decreased FSH and GH levels we observed in response to the GH agonist. In both goldfish and tilapia, LH levels increase before spawning and decrease afterward (40, 85). In tilapia, somatic growth increases significantly after spawning (86), and GH levels remain high, while LH levels decrease (39). This suggests that GH may play a role in promoting somatic growth after spawning, and this may be reflected in the increase in LH levels in response to a GH antagonist.
In summary, we have provided a demonstration of a direct regulation of gonadotropin release by somatostatin. We have identified the specific SSTR types expressed on LH and FSH cells and mapped their co-localizations. Indications were also found that SST may directly regulate LH and FSH secretion into the bloodstream. These findings suggest a possible involvement of SST and its receptors in the interplay between growth and reproductive processes and a possible bridging function for SST between the somatic and reproductive axes.
Data availability statement
The datasets presented in this study can be found in online repositories. The names of the repository/repositories and accession number(s) can be found in the article/Supplementary Material.
Ethics statement
The animal study was approved by Hebrew University administrative panel for laboratory animal care. The study was conducted in accordance with the local legislation and institutional requirements.
Author contributions
MN: Conceptualization, Data curation, Methodology, Visualization, Writing – original draft. H-CL: Data curation, Writing – review & editing. AI: Conceptualization, Data curation, Methodology, Writing – original draft. SM: Data curation, Methodology, Writing – review & editing. AC: Data Curation, Writing – review & editing. L-SB: Conceptualization, Funding acquisition, Methodology, Supervision, Writing – review & editing.
Funding
The author(s) declare financial support was received for the research, authorship, and/or publication of this article. The project received funding from the US National Science Foundation and the U.S.-Israel Binational Science Foundation Joint Funding Research Grants (grant # NSF-BSF-1947541), and Israel Science Foundation (ISF) 1540/17.
Conflict of interest
The authors declare that the research was conducted in the absence of any commercial or financial relationships that could be construed as a potential conflict of interest.
Publisher’s note
All claims expressed in this article are solely those of the authors and do not necessarily represent those of their affiliated organizations, or those of the publisher, the editors and the reviewers. Any product that may be evaluated in this article, or claim that may be made by its manufacturer, is not guaranteed or endorsed by the publisher.
Supplementary material
The Supplementary Material for this article can be found online at: https://www.frontiersin.org/articles/10.3389/fendo.2024.1302672/full#supplementary-material
Supplementary Table 1 | (A) (sstr2): Detailed information on the start and end positions of neighboring genes flanking the sstr2 gene within the spotted gar genome. The table features Ensembl accession numbers for these genes. Feasible, corresponding genes have been matched in teleost species such as Asian bonytongue, European seabass, zebrafish, tilapia, and fugu. The table additionally presents the start and end positions, along with the accession numbers, of these genes in the teleost species. (B) (sstr3): Detailed information on the start and end positions of neighboring genes surrounding the sstr3 gene in the spotted gar genome. Ensembl accession numbers for these genes are included. Comparable genes have been identified, wherever possible, in teleost species like Asian bonytongue, European seabass, zebrafish, tilapia, and fugu. The table also provides the start and end positions, as well as the accession numbers, of these genes in the teleost species. (C) (sstr5): Detailed information on the start and end positions of neighboring genes flanking the sstr5 gene within the spotted gar genome. The table contains Ensembl accession numbers for these genes. Comparable genes have been identified, when feasible, in teleost species including Asian bonytongue, European seabass, zebrafish, tilapia, and fugu. Additionally, the table presents the start and end positions, along with the accession numbers, of these genes in the teleost species.
SUPPLEMENTARY FILE 1 | Sequences of the Somatostatin receptors used in Figure 2 constructing the phylogenetic tree.
Supplementary Table 2 | Uniprot IDs of the SSTRs used in for constructing the phylogenetic tree.
References
1. Melamed P, Rosenfeld H, Elizur A, Yaron Z. Endocrine regulation of gonadotropin and growth hormone gene transcription in fish. Comp Biochem Physiol - C Pharmacol Toxicol Endocrinol. (1998) 119:325–38. doi: 10.1016/S0742–8413(98)00021–8
2. Brazeau P, Vale W, Ling N, Butcher M, Rivier J, Guillemin R. Hypothalamic polypeptide that inhibits the secretion of immunoreactive pituitary growth hormone. Science. (1973) 179:77–9. doi: 10.1126/science.179.4068.77
3. Weckbecker G, Lewis I, Albert R, Schmid HA, Hoyer D, Bruns C. Opportunities in somatostatin research: biological, chemical and therapeutic aspects. Nat Rev Drug Discovery. (2003) 2:999–1017. doi: 10.1038/nrd1255
4. Rivas RJ, Nishioka RS, Bern HA. In vitro effects of somatostatin and urotensin II on prolactin and growth hormone secretion in tilapia, Oreochromis mossambicus. Gen Comp Endocrinol. (1986) 63:245–51. doi: 10.1016/0016–6480(86)90162–0
5. Cook AF, Peter RE. The effects of somatostatin on serum growth hormone levels in the goldfish, Carassius auratus. Gen Comp Endocrinol. (1984) 54:109–13. doi: 10.1016/0016–6480(84)90205–3
6. Sweeting RM, McKeown BA. Growth hormone and seawater adaptation in coho salmon, Oncorhynchus kisutch. Comp Biochem Physiol A Physiol. (1987) 88:147–51. doi: 10.1016/0300–9629(87)90113–7
7. Melamed P, Eliahu N, Ofir M, Levavi-Sivan B, Smal J, Rentier-Delrue F, et al. The effects of gonadal development and sex steroids on growth hormone secretion in the male tilapia hybrid (Oreochromis niloticus × O. aureus). Fish Physiol Biochem. (1995) 14:267–77. doi: 10.1007/BF00004065
8. Allen JP, Hathway GJ, Clarke NJ, Jowett MI, Topps S, Kendrick KM, et al. Somatostatin receptor 2 knockout/lacZ knockin mice show impaired motor coordination and reveal sites of somatostatin action within the striatum. Eur J Neurosci. (2003) 17:1881–95. doi: 10.1046/j.1460-9568.2003.02629.x
9. Marazioti A, Kastellakis A, Antoniou K, Papasava D, Thermos K. Somatostatin receptors in the ventral pallidum/substantia innominata modulate rat locomotor activity. Psychopharmacol (Berl). (2005) 181:319–26. doi: 10.1007/s00213-005-2237-z
10. Hathway GJ, Emson PC, Humphrey PP, Kendrick KM. Somatostatin potently stimulates in vivo striatal dopamine and gamma-aminobutyric acid release by a glutamate-dependent action. J Neurochem. (1998) 70:1740–9. doi: 10.1046/j.1471-4159.1998.70041740.x
11. Saito T, Iwata N, Tsubuki S, Takaki Y, Takano J, Huang SM, et al. Somatostatin regulates brain amyloid β peptide Aβ42 through modulation of proteolytic degradation. Nat Med. (2005) 11:434–9. doi: 10.1038/nm1206
12. Starcevic V, Milosevic V, Brkic B, Severs WB. Somatostatin affects morphology and secretion of pituitary luteinizing hormone (LH) cells in male rats. Life Sci. (2002) 70:3019–27. doi: 10.1016/S0024–3205(02)01551–5
13. Canosa LF, Bertucci JI. Nutrient regulation of somatic growth in teleost fish. The interaction between somatic growth, feeding and metabolism. Mol Cell Endocrinol. (2020) 518:111029. doi: 10.1016/j.mce.2020.111029
14. Tostivint H, Gaillard AL, Mazan S, Pézeron G. Revisiting the evolution of the somatostatin family: Already five genes in the gnathostome ancestor. Gen Comp Endocrinol. (2019) 279:139–47. doi: 10.1016/j.ygcen.2019.02.022
15. Nelson LE, Sheridan MA. Regulation of somatostatins and their receptors in fish. Gen Comp Endocrinol. (2005) 142:117–33. doi: 10.1016/j.ygcen.2004.12.002
16. Liu Y, Lu D, Zhang Y, Li S, Liu X, Lin H. The evolution of somatostatin in vertebrates. Gene. (2010) 463:21–8. doi: 10.1016/j.gene.2010.04.016
17. Durán-Prado M, Malagón MM, Gracia-Navarro F, Castaño JP. Dimerization of G protein-coupled receptors: New avenues for somatostatin receptor signaling, control and functioning. Mol Cell Endocrinol. (2008) 286:63–8. doi: 10.1016/j.mce.2007.12.006
18. Siehler S, Nunn C, Hannon J, Feuerbach D, Hoyer D. Pharmacological profile of somatostatin and cortistatin receptors. Mol Cell Endocrinol. (2008) 286:26–34. doi: 10.1016/j.mce.2007.12.007
19. Wong AOL, Zhou H, Jiang Y, Ko WKW. Feedback regulation of growth hormone synthesis and secretion in fish and the emerging concept of intrapituitary feedback loop. Comp Biochem Physiol A Mol Integr Physiol. (2006) 144:284–305. doi: 10.1016/j.cbpa.2005.11.021
20. Campo A, Lafont A-G, Lefranc B, Leprince J, Tostivint H, Kamech N, et al. Tachykinin-3 genes and peptides characterized in a basal teleost, the european eel: evolutionary perspective and pituitary role. Front Endocrinol (Lausanne). (2018) 9:304. doi: 10.3389/fendo.2018.00304
21. Hollander-Cohen L, Golan M, Levavi-Sivan B. Differential regulation of gonadotropins as revealed by transcriptomes of distinct lh and fsh cells of fish pituitary. Int J Mol Sci. (2021) 22:6478. doi: 10.3390/ijms22126478
22. Hollander-Cohen L, Meir I, Shulman M, Levavi-Sivan B. Identifying the interaction of the brain and the pituitary in social - and reproductive - state of tilapia by transcriptome analyses. Neuroendocrinology. (2022) 112:1237–60. doi: 10.1159/000524437
23. Golan M, Levavi-Sivan B. Social dominance in tilapia is associated with gonadotroph hyperplasia. Gen Comp Endocrinol. (2013) 192:126–35. doi: 10.1016/j.ygcen.2013.04.032
24. Golan M, Biran J, Levavi-Sivan B. A novel model for development, organization, and function of gonadotropes in fish pituitary. Front Endocrinol (Lausanne). (2014) 5:182. doi: 10.3389/fendo.2014.00182
25. Biran J, Golan M, Mizrahi N, Ogawa S, Parhar IS, Levavi-Sivan B. LPXRFa, the piscine ortholog of GnIH, and LPXRF receptor positively regulate gonadotropin secretion in tilapia (Oreochromis niloticus). Endocrinology. (2014) 155:4391–401. doi: 10.1210/en.2013–2047
26. Levavi-Sivan B, Yaron Z. Involvement of cyclic adenosine monophosphate in the stimulation of gonadotropin secretion from the pituitary of the teleost fish, tilapia. Mol Cell Endocrinol. (1992) 85:175–83. doi: 10.1016/0303–7207(92)90256–6
27. Jones DT, Taylor WR, Thornton JM. The rapid generation of mutation data matrices from protein sequences. Comput Appl Biosci. (1992) 8:275–82. doi: 10.1093/bioinformatics/8.3.275
28. Kumar S, Stecher G, Tamura K. MEGA7: molecular evolutionary genetics analysis version 7.0 for bigger datasets. Mol Biol Evol. (2016) 33:1870–4. doi: 10.1093/MOLBEV/MSW054
29. Zhang Y. I-TASSER: fully automated protein structure prediction in CASP8. Proteins. (2009) 77:100–13. doi: 10.1002/prot.22588
30. Roy A, Yang J, Zhang Y. COFACTOR: An accurate comparative algorithm for structure-based protein function annotation. Nucleic Acids Res. (2012) 40:W471–7. doi: 10.1093/nar/gks372
31. Robertson MJ, Meyerowitz JG, Panova O, Borrelli K, Skiniotis G. Plasticity in ligand recognition at somatostatin receptors. Nat Struct Mol Biol. (2022) 29:210–7. doi: 10.1038/s41594–022-00727–5
32. Choi HMT, Schwarzkopf M, Fornace ME, Acharya A, Artavanis G, Stegmaier J, et al. Third-generation in situ hybridization chain reaction: multiplexed, quantitative, sensitive, versatile, robust. Development. (2018) 145:dev165753. doi: 10.1242/dev.165753
33. Mizrahi N, Gilon C, Atre I, Ogawa S, Parhar IS, Levavi-Sivan B. Deciphering direct and indirect effects of neurokinin B and GnRH in the brain-pituitary axis of tilapia. Front Endocrinol (Lausanne). (2019) 10:469. doi: 10.3389/fendo.2019.00469
34. Schindelin J, Arganda-Carreras I, Frise E, Kaynig V, Longair M, Pietzsch T, et al. Fiji: an open-source platform for biological-image analysis. Nat Methods. (2012) 9:676–82. doi: 10.1038/nmeth.2019
35. Ciani E, Fontaine R, Maugars G, Mizrahi N, Mayer I, Levavi-Sivan B, et al. Melatonin receptors in Atlantic salmon stimulate cAMP levels in heterologous cell lines and show season-dependent daily variations in pituitary expression levels. J Pineal Res. (2019) 67:e12590. doi: 10.1111/jpi.12590
36. Levavi-Sivan B, Aizen J, Avitan A. Cloning, characterization and expression of the D2 dopamine receptor from the tilapia pituitary. Mol Cell Endocrinol. (2005) 236:17–30. doi: 10.1016/j.mce.2005.03.010
37. Aizen J, Kasuto H, Golan M, Zakay H, Levavi-Sivan B. Tilapia follicle-stimulating hormone (FSH): immunochemistry, stimulation by gonadotropin-releasing hormone, and effect of biologically active recombinant FSH on steroid secretion1. Biol Reprod. (2007) 76:692–700. doi: 10.1095/biolreprod.106.055822
38. Levavi-Sivan B, Safarian H, Rosenfeld H, Elizur A, Avitan A. Regulation of gonadotropin-releasing hormone (GnRH)-receptor gene expression in tilapia: effect of GnRH and dopamine. Biol Reprod. (2004) 70:1545–51. doi: 10.1095/biolreprod.103.021998
39. Melamed P, Eliahu N, Levavi-Sivan B, Ofir M, Farchi-Pisanty O, Rentier-Delrue F, et al. Hypothalamic and thyroidal regulation of growth hormone in tilapia. Gen Comp Endocrinol. (1995) 97:13–30. doi: 10.1006/GCEN.1995.1002
40. Aizen J, Kasuto H, Levavi-Sivan B. Development of specific enzyme-linked immunosorbent assay for determining LH and FSH levels in tilapia, using recombinant gonadotropins. Gen Comp Endocrinol. (2007) 153:323–32. doi: 10.1016/j.ygcen.2007.04.004
41. Kasuto H, Levavi-Sivan B. Production of biologically active tethered tilapia LHbetaalpha by the methylotrophic yeast Pichia pastoris. Gen Comp Endocrinol. (2005) 140:222–32. doi: 10.1016/j.ygcen.2004.10.016
42. Hofmann KP, Scheerer P, Hildebrand PW, Choe HW, Park JH, Heck M, et al. A G protein-coupled receptor at work: the rhodopsin model. Trends Biochem Sci. (2009) 34:540–52. doi: 10.1016/j.tibs.2009.07.005
43. Wakefield AE, Mason JS, Vajda S, Keserű GM. Analysis of tractable allosteric sites in G protein-coupled receptors. Sci Rep. (2019) 9:6180. doi: 10.1038/s41598–019-42618–8
44. Lamberts SW, van der Lely AJ, de Herder WW, Hofland LJ. Octreotide. N Engl J Med. (1996) 334:246–54. doi: 10.1056/NEJM199601253340408
45. Trainor BC, Hofmann HA. Somatostatin regulates aggressive behavior in an African cichlid fish. Endocrinology. (2006) 147:5119–25. doi: 10.1210/en.2006–0511
46. Brown MR, Rivier C, Vale W. Central nervous system regulation of adrenocorticotropin secretion: Role of somatostatins. Endocrinology. (1984) 114:1546–9. doi: 10.1210/endo-114–5-1546
47. Bertherat J, Bluet-Pajot MT, Epelbaum J. Neuroendocrine regulation of growth hormone. Eur J Endocrinol. (1995) 132:12–24. doi: 10.1530/eje.0.1320012
48. Shimon I, Taylor JE, Dong JZ, Bitonte RA, Kim S, Morgan B, et al. Somatostatin receptor subtype specificity in human fetal pituitary cultures. Differential role of SSTR2 and SSTR5 for growth hormone, thyroid- stimulating hormone, and prolactin regulation. J Clin Invest. (1997) 99:789–98. doi: 10.1172/JCI119225
49. Lloyd KCK, Amirmoazzami S, Friedik F, Chew P, Walsh JH. Somatostatin inhibits gastrin release and acid secretion by activating sst2 in dogs. Am J Physiol Gastrointest Liver Physiol. (1997) 272:G1481–8. doi: 10.1152/ajpgi.1997.272.6.g1481
50. Moriyoshi Y, Shiratori K, Watanabe SI, Takeuchi T. Potentiating effect of CCK and secretin on rat exocrine pancreas and its cholinergic dependence. Pancreas. (1991) 6:603–8. doi: 10.1097/00006676–199109000–00015
51. Pederson RA, Dryburgh JR, Brown JC. The effect of somatostatin on release and insulinotropic action of gastric inhibitory polypeptide. Can J Physiol Pharmacol. (1975) 53:1200–5. doi: 10.1139/y75–168
52. Rökaeus Å. Increase in neurotensin-like immunoreactivity in rat plasma after administration of calcium, bombesin and fat and its inhibition by somatostatin. Acta Physiol Scand. (1984) 122:261–7. doi: 10.1111/j.1748–1716.1984.tb07509.x
53. Marco J, Correas I, Zulueta MA, Vincent E, Coy DH, Comaru-Schally AM, et al. Inhibitory effect of somatostatin-28 on pancreatic polypeptide, glucagon and insulin secretion in normal man. Hormone Metab Res. (1983) 15:363–6. doi: 10.1055/s-2007–1018725
54. Strowski MZ, Parmar RM, Blake AD, Schaeffer JM. Somatostatin inhibits insulin and glucagon secretion via two receptor subtypes: An in vitro study of pancreatic islets from somatostatin receptor 2 knockout mice. Endocrinology. (2000) 141:111–7. doi: 10.1210/endo.141.1.7263
55. Viollet C, Vaillend C, Videau C, Bluet-Pajot MT, Ungerer A, L’Heritier A, et al. Involvement of sst2 somatostatin receptor in locomotor, exploratory activity and emotional reactivity in mice. Eur J Neurosci. (2000) 12:3761–70. doi: 10.1046/j.1460-9568.2000.00249.x
56. Tostivint H, Lihrmann I, Vaudry H. New insight into the molecular evolution of the somatostatin family. Mol Cell Endocrinol. (2008) 286:5–17. doi: 10.1016/j.mce.2008.02.029
57. Meyer A, Van De Peer Y. From 2R to 3R: Evidence for a fish-specific genome duplication (FSGD). BioEssays. (2005) 27:937–45. doi: 10.1002/bies.20293
58. Lafont AG, Rousseau K, Tomkiewicz J, Dufour S. Three nuclear and two membrane estrogen receptors in basal teleosts, Anguilla sp.: Identification, evolutionary history and differential expression regulation. Gen Comp Endocrinol. (2016) 235:177–91. doi: 10.1016/j.ygcen.2015.11.021
59. Maugars G, Dufour S, Cohen-Tannoudji JL, Qué Rat B. Multiple thyrotropin b-subunit and thyrotropin receptor-related genes arose during vertebrate evolution. PloS One. (2014) 9:e111361. doi: 10.1371/journal.pone.0111361
60. Morini M, Pasquier J, Dirks R, Van Den Thillart G, Tomkiewicz J, Rousseau K, et al. Duplicated leptin receptors in two species of eel bring new insights into the evolution of the leptin system in vertebrates. PloS One. (2015) 10:e0126008. doi: 10.1371/journal.pone.0126008
61. Pasquier J, Lafont AG, Jeng SR, Morini M, Dirks R, van den Thillart G, et al. Multiple kisspeptin receptors in early osteichthyans provide new insights into the evolution of this receptor family. PloS One. (2012) 7:e48931. doi: 10.1371/journal.pone.0048931
62. Tostivint H, Ocampo Daza D, Bergqvist CA, Quan FB, Bougerol M, Lihrmann I, et al. Somatostatin/urotensin II receptors. J Mol Endocrinol. (2014) 52:T61–86. doi: 10.1530/JME-13-0274
63. Ocampo Daza D, Sundström G, Bergqvist CA, Larhammar D. The evolution of vertebrate somatostatin receptors and their gene regions involves extensive chromosomal rearrangements. BMC Evol Biol. (2012) 12:231. doi: 10.1186/1471–2148-12–231
64. Molnar JL, Hutchinson JR, Diogo R, Clack JA, Pierce SE. Evolution of forelimb musculoskeletal function across the fish-to-tetrapod transition. Sci Adv. (2021) 7:eabd7457. doi: 10.1126/sciadv.abd7457
65. Macqueen DJ, Johnston IA. A well-constrained estimate for the timing of the salmonid whole genome duplication reveals major decoupling from species diversification. Proc R Soc B: Biol Sci. (2014) 281:20132881. doi: 10.1098/rspb.2013.2881
66. Allendorf FW, Thorgaard GH. Tetraploidy and the Evolution of Salmonid Fishes. In: Evolutionary Genetics of Fishes. Springer, Boston, MA (1984).
67. Xu P, Xu J, Liu G, Chen L, Zhou Z, Peng W, et al. The allotetraploid origin and asymmetrical genome evolution of the common carp Cyprinus carpio. Nat Commun. (2019) 10:4625. doi: 10.1038/s41467–019-12644–1
68. Lien S, Koop BF, Sandve SR, Miller JR, Kent MP, Nome T, et al. The Atlantic salmon genome provides insights into rediploidization. Nature. (2016) 533:200–5. doi: 10.1038/nature17164
69. Lin X, Peter RE. Somatostatins and their receptors in fish. Comp Biochem Physiol B Biochem Mol Biol. (2001) 129:543–50. doi: 10.1016/s1096–4959(01)00362–1
70. Klein SE, Sheridan MA. Somatostatin signaling and the regulation of growth and metabolism in fish. Mol Cell Endocrinol. (2008) 286:148–54. doi: 10.1016/j.mce.2007.08.010
71. Hollander-Cohen L, Golan M, Levavi-Sivan B. Transcriptome of distinct LH and FSH cells reveals different regulation unique to each cell type. J Endocr Soc. (2021) 5:A557. doi: 10.1210/jendso/bvab048.1136
72. Bhattarai JP, Kaszas A, Park SA, Yin H, Park SJ, Herbison AE, et al. Somatostatin inhibition of gonadotropin-releasing hormone neurons in female and male mice. Endocrinology. (2010) 151:3258–66. doi: 10.1210/en.2010–0148
73. Todman MG, Han SK, Herbison AE. Profiling neurotransmitter receptor expression in mouse gonadotropin-releasing hormone neurons using green fluorescent protein-promoter transgenics and microarrays. Neuroscience. (2005) 132:703–12. doi: 10.1016/j.neuroscience.2005.01.035
74. O’Carroll AM, Krempels K. Widespread distribution of somatostatin receptor messenger ribonucleic acids in rat pituitary. Endocrinology. (1995) 136:5224–7. doi: 10.1210/endo.136.11.7588261
75. Patel YC. Somatostatin and its receptor family. Front Neuroendocrinol. (1999) 20:157–98. doi: 10.1006/frne.1999.0183
76. Troxler T, Hurth K, Schuh KH, Schoeffter P, Langenegger D, Enz A, et al. Decahydroisoquinoline derivatives as novel non-peptidic, potent and subtype-selective somatostatin sst(3) receptor antagonists. Bioorg Med Chem Lett. (2010) 20:1728–34. doi: 10.1016/j.bmcl.2010.01.063
77. Liapakis G, Tallent M, Reisine T. Molecular and functional properties of somatostatin receptor subtypes. Metabolism. (1996) 45:12–3. doi: 10.1016/S0026–0495(96)90070–0
78. Fitzpatrick VD, Vandlen RL. Agonist selectivity determinants in somatostatin receptor subtypes I and II. J Biol Chem. (1994) 269:24621–6. doi: 10.1016/s0021–9258(17)31437–0
79. Nagarajan SK, Babu S, Sohn H, Madhavan T. Molecular-level understanding of the somatostatin receptor 1 (SSTR1)-ligand binding: A structural biology study based on computational methods. ACS Omega. (2020) 5:21145–61. doi: 10.1021/acsomega.0c02847
80. Pillon D, Caraty A, Fabre-Nys C, Lomet D, Cateau M, Bruneau G. Regulation by estradiol of hypothalamic somatostatin gene expression: possible involvement of somatostatin in the control of luteinizing hormone secretion in the ewe. Biol Reprod. (2004) 71:38–44. doi: 10.1095/biolreprod.103.023689
81. Sugimoto A, Tsuchida H, Ieda N, Ikegami K, Inoue N, Uenoyama Y, et al. Somatostatin-somatostatin receptor 2 signaling mediates LH pulse suppression in lactating rats. Endocrinology. (2019) 160:473–83. doi: 10.1210/en.2018–00882
82. Levavi-Sivan B, Vaiman R, Sachs O, Tzchori I. Spawning induction and hormonal levels during final oocyte maturation in the silver perch (Bidyanus bidyanus). Aquaculture. (2004) 229:419–31. doi: 10.1016/S0044–8486(03)00349–1
83. Levavi-Sivan B, Bogerd J, Mañanós EL, Gómez A, Lareyre JJ. General and Comparative Endocrinology Perspectives on fish gonadotropins and their receptors. Gen Comp Endocrinol. (2010) 165:412–37. doi: 10.1016/j.ygcen.2009.07.019
84. Le Gac F, Blaise O, Fostier A, Le Bail PY, Loir M, Mourot B, et al. Growth hormone (GH) and reproduction: a review. Fish Physiol Biochem. (1993) 11:219–32. doi: 10.1007/BF00004569
85. Kobayashi M, Sorensen PW, Stacey NE. Hormonal and pheromonal control of spawning behavior in the goldfish. Fish Physiol Biochem. (2002) 26:71–84. doi: 10.1023/A:1023375931734
Keywords: LH, FSH, GH, fish, pituitary
Citation: Mizrahi N, Hollander-Cohen L, Atre I, Shulman M, Campo A and Levavi-Sivan B (2024) Characterization of the somatostatin system in tilapia: implications for growth and reproduction. Front. Endocrinol. 15:1302672. doi: 10.3389/fendo.2024.1302672
Received: 14 December 2023; Accepted: 30 May 2024;
Published: 21 June 2024.
Edited by:
Takayoshi Ubuka, International Cancer Laboratory Co., Ltd., JapanReviewed by:
Pei-San Tsai, University of Colorado Boulder, United StatesShin Matsubara, Suntory Foundation for Life Sciences, Japan
Copyright © 2024 Mizrahi, Hollander-Cohen, Atre, Shulman, Campo and Levavi-Sivan. This is an open-access article distributed under the terms of the Creative Commons Attribution License (CC BY). The use, distribution or reproduction in other forums is permitted, provided the original author(s) and the copyright owner(s) are credited and that the original publication in this journal is cited, in accordance with accepted academic practice. No use, distribution or reproduction is permitted which does not comply with these terms.
*Correspondence: Berta Levavi-Sivan, YmVydGEuc2l2YW5AbWFpbC5odWppLmFjLmls
†ORCID: Levavi-Sivan Berta, orcid.org/0000-0002-0183-9524