
95% of researchers rate our articles as excellent or good
Learn more about the work of our research integrity team to safeguard the quality of each article we publish.
Find out more
ORIGINAL RESEARCH article
Front. Endocrinol. , 26 June 2024
Sec. Obesity
Volume 15 - 2024 | https://doi.org/10.3389/fendo.2024.1272886
 Saara Laine1*
 Tanja Sjöros1
 Taru Garthwaite1
 Miikka-Juhani Honka1
 Eliisa Löyttyniemi2
 Olli Eskola1Maria Saarenhovi1,3Petri Kallio3,4
 Mikko Koivumäki1
 Henri Vähä-Ypyä5
 Harri Sievänen5
 Tommi Vasankari5,6
 Jussi Hirvonen6,7
 Kirsi Laitinen8Noora Houttu8Kari Kalliokoski1
 Virva Saunavaara1,9Juhani Knuuti1
 Ilkka H.A. Heinonen1
Background: Obesity is associated with impaired glucose metabolism and hepatic insulin resistance. The aim was to investigate the associations of hepatic glucose uptake (HGU) and endogenous glucose production (EGP) to sedentary behavior (SB), physical activity (PA), cardiorespiratory fitness, dietary factors, and metabolic risk markers.
Methods: Forty-four adults with metabolic syndrome (mean age 58 [SD 7] years, BMI ranging from 25–40kg/; 25 females) were included. HGU was measured by positron emission tomography during the hyperinsulinemic-euglycemic clamp. EGP was calculated by subtracting the glucose infusion rate during clamp from the glucose rate of disappearance. SB and PA were measured with hip-worn accelerometers (26 [SD3] days). Fitness was assessed by maximal bicycle ergometry with respiratory gas measurements and dietary intake of nutrients by 4-day food diaries.
Results: HGU was not associated with fitness or any of the SB or PA measures. When adjusted for sex, age, and body fat-%, HGU was associated with whole-body insulin sensitivity (β=0.58), water-insoluble dietary fiber (β=0.29), energy percent (E%) of carbohydrates (β=-0.32), saccharose (β=-0.32), mono- and polyunsaturated fatty acids (β=0.35, β=0.41, respectively). EGP was associated with whole-body insulin sensitivity (β=-0.53), and low-density lipoprotein cholesterol [β=-0.31], and when further adjusted for accelerometry wear time, EGP was associated with standing [β=-0.43]. (p-value for all< 0.05).
Conclusions: Standing more, consuming a diet rich in fiber and unsaturated fatty acids, and a lower intake of carbohydrates, especially sugar, associate beneficially with hepatic insulin sensitivity. Habitual SB, PA, or fitness may not be the primary modulators of HGU and EGP. However, these associations need to be confirmed with intervention studies.
The liver is an important organ for normal whole-body glucose homeostasis by maintaining the balance between the uptake and storage of glucose and glucose production. Obesity is associated with impaired glucose metabolism (1), and hepatic insulin resistance (2), which are major indicators of developing metabolic syndrome (MetS) and non-alcoholic fatty liver disease (NAFLD) (1–3). It has been suggested that the liver is more prone to developing insulin resistance compared to muscle or adipose tissue and that the insulin resistance of muscle and adipose tissue may result from hepatic insulin resistance (4).
In healthy humans, hepatic glucose uptake (HGU) during insulin stimulation increase, and defective stimulation of HGU by insulin predisposes to postprandial hyperglycemia due to defective liver glycogen storage (5). Insulin-stimulated glucokinase activity is a key factor in liver glycogen storage (6). Glucokinase is an enzyme in hepatocytes that regulates carbohydrate metabolism by balancing rising and falling glucose levels, e.g., after meals or during fasting. During insulin stimulation, HGU mainly represents the activity of glucokinase, because the capacity of glucose transporters (GLUT-2) in the liver is large, and insulin either decreases or has no effect on GLUT-2 activation (7, 8).
Endogenous glucose production (EGP) is a net result of the release of glucose from glycogenolysis and gluconeogenesis that mainly happens in the liver (9). Thus, EGP assists in blood glucose level regulation and inhibits hypoglycemia by producing glucose that tissues require during fasting or physical exercise (9, 10). After a meal, insulin is secreted in a dose-dependent manner as a response to absorbed glucose, and EGP is suppressed (11). However, when glucose tolerance is impaired because of insulin resistance, hepatic tissue is not responding to insulin, glucose uptake is reduced, and EGP rates are increased (12). Thus, decreased HGU and increased EGP during insulin stimulation are specific markers of hepatic insulin resistance.
Both sedentary behavior (SB) and lack of physical activity (PA) are associated with obesity (13–15) and NAFLD (16). On the other hand, PA is known to have beneficial effects on insulin sensitivity in both healthy and insulin-resistant individuals (17). Understanding how habitual SB and PA are associated with hepatic insulin resistance would be important because it reflects an increased risk of developing metabolic diseases such as type 2 diabetes or NAFLD. Consequently, our primary aim was to examine the associations of HGU and, EGP to device-measured habitual SB and PA. Additionally, we examined the associations of HGU, and EGP to fitness, daily nutrient, and energy intake, body composition, liver fat content, and common markers of cardiometabolic risk.
This study used the baseline data of an intervention trial (Medical and physiological benefits of reduced sitting, ClinicalTrials.gov ID NCT03101228) performed at the Turku PET Centre, Turku, Finland, between April 2017, and August 2019. All participants gave written informed consent before enrollment in the study. The study was conducted according to good clinical practice and the Declaration of Helsinki and was approved by the Ethics Committee of the Hospital District of Southwest Finland (16/1810/2017).
The participants were sedentary middle-aged adults with MetS, BMI ranging from 25–40kg/m², who were recruited through bulletin boards and newspaper advertisements. Fulfillment of the metabolic syndrome criteria included three of the following symptoms (18): central obesity (waist circumference ≥ 94 cm for males and ≥ 80 cm for females), blood triglycerides ≥ 1.7 mmol/l, HDL-C cholesterol< 1.0 mmol/l for males and< 1.3 mmol/l for females, systolic blood pressure ≥130 and/or diastolic blood pressure ≥85 mmHg and fasting glucose > 5.6 mmol/l. The inclusion and exclusion criteria for participation are described in Table 1.

Table 1 Inclusion and exclusion criteria.
Whole-body insulin-stimulated glucose uptake (M-value) was assessed with the gold standard hyperinsulinemic-euglycemic clamp method after an overnight fast, as previously reported (19).
The hyperinsulinaemic-euglycaemic clamp was performed after at least 10 hours of fasting. A primed-constant insulin (Actrapid, 100 U/ml, Novo Nordisk, Bagsvaerd, Denmark) infusion rate was 160 mU/min/m2 of the participant’s body surface area during the first 4 min. From 4 to 7 min, the infusion rate was reduced to 80 mU/m2/min, and from 7 min to the end of the clamp, it was kept constant at 40 mU/m2/min. An exogenous 20% glucose infusion was started 4 min after the initiation of the insulin infusion, with a rate of ml/h per participant’s body mass (kg) x 0.5, e.g. for a person weighing 80 kg, the rate was 40 ml/h ≈ 8 g of glucose per hour. At 10 min, the glucose infusion was doubled, and after that further adjusted according to blood glucose concentration to keep it as close as possible to the level of 5 mmol/L. Arterialized venous blood samples were collected every 5 min during the first 30 min and at steady state every 10 min to determine the glucose concentration for adjusting the glucose infusion rate. The whole-body insulin-stimulated GU rate was calculated from the measured steady-state glucose values and glucose infusion rate starting from 20 min after the start of the hyperinsulinaemic-euglycaemic clamp. The outcome, M-value, represents whole-body glucose uptake as mg/kg/min.
HGU was measured during hyperinsulinemic-euglycemic clamp combined with 2-deoxy-2-[18F] fluoro-D-glucose ([18F]-FDG)-positron emission tomography (PET) imaging (Figure 1) using PET/computed tomography (CT) scanner (GE D690, GE Healthcare, Milwaukee, US). Radiotracer [18F]-FDG (20) was produced and [18F]-FDG uptake was analyzed as previously described (21). Hepatic region imaging started simultaneously with the tracer (168 [SD 11] MBq) injection into the antecubital vein 75 (SD 12) min after starting the clamp. The cumulative availability of the tracer in plasma (input function) was determined from the radioactivity in the left ventricle of the heart during the first 40 min of PET imaging and from blood samples collected at approximately 50 and 70 min after the injection. All data were corrected for dead-time, decay, and measured photon attenuation. Dynamic PET scan was reconstructed with an iterative reconstruction method.
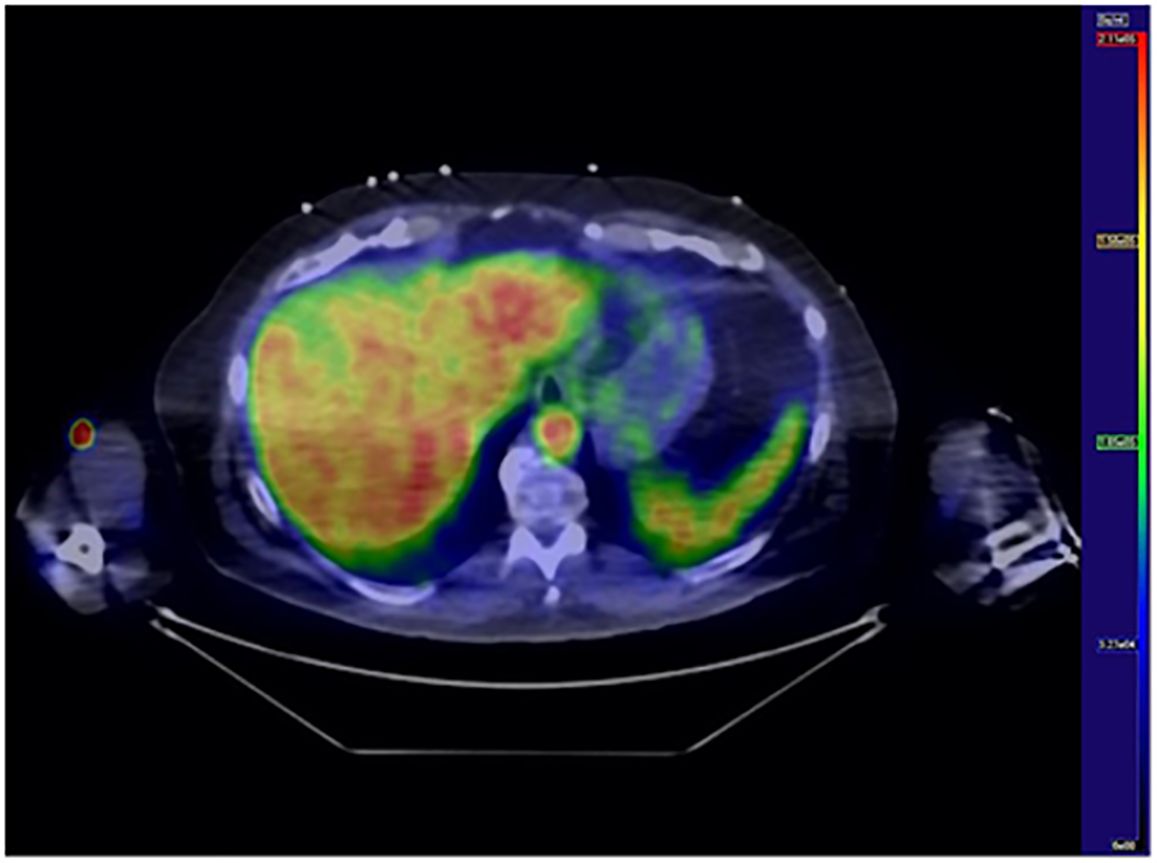
Figure 1 Hepatic glucose uptake. Transaxial [18F]FDG PET/CT image of the liver. Blue color represents low [18F]FDG uptake whereas red color represents high uptake.
18F-FDG activity in the hepatic tissue was measured by drawing a region of interest (ROI) in the right lobe of the liver using a CT image as an anatomic reference. The PET/CT images were analyzed with Carimas (v.2.71, Turku PET Centre, Turku, Finland). HGU (µmol/ml/min) was calculated by multiplying the tissue fractional phosphorylation rate (Ki) by the average plasma glucose concentration during scanning. Lumped constant (LC) for the liver is 1.0. The software Carimas (v.2.71, Turku PET Centre, Turku, Finland) was used to analyze PET/CT images of the liver. Plasma radioactivity was measured with an automatic gamma counter (Wizard 1480 3”, Wallac, Turku, Finland).
EGP was calculated by subtracting the exogenous glucose infusion rate (GIR) corrected by space correction (22) from the glucose rate of disappearance (Rd) during the hyperinsulinemic-euglycemic clamp (23), according to the following equation;
Rd = rate of disappearance (µmol/kg/min)
Vglucose = estimated glucose distribution volume (0.19 l/kg)
Δglucose = change in glucose from [18F]-FDG injection to the end of blood sampling (mmol/l)
ΔT = time from [18F]-FDG injection to the end of blood sampling (min)
GIR = glucose infusion rate (µmol/kg/min)
Rd was calculated using [18F]-FDG clearance corrected by tracer lost to urine (24);
DoseFDG = radioactivity of the injected [18F]-FDG
UrineFDG = secreted [18F]-FDG to urine from the tracer injection until voiding bladder at the end of the study
AUCFDG = area under the curve representing [18F]-FDG from the tracer injection to infinity
Glucoseavg = average glycemia during the interval between the time of [18F]-FDG injection and the end of blood sampling.
SB and PA were measured for four weeks with validated hip-worn tri-axial accelerometers (UKK AM30, UKK-Institute, Tampere, Finland) and analysis methods, as previously reported (25). Briefly, accelerometers were worn during waking hours for four consecutive weeks (except during water-based activities). The collected accelerometer data was analyzed in six-second epochs and SB (sitting and lying together), standing, light physical activity (LPA), moderate-to-vigorous physical activity (MVPA), steps, and breaks in SB were defined using mean amplitude deviation (MAD) (26) and angle for posture estimation (APE) methods (27). The daily means for the following SB and PA variables were calculated: SB (h/day), breaks in SB (times/day), standing (h/day), daily steps (number/day), LPA (h/day), MVPA (h/day), and total PA (LPA and MVPA together, h/day). For valid data collection, a daily wear time of 10–19 h and at least 4 days of valid measurements were required. Daily measurement time exceeding 19 h indicates that the participant has likely slept with the accelerometer and measurement hours exceeding 19 h per day, were subtracted from the SB time.
Maximal oxygen consumption (VO2max) measurements were conducted after the participants had passed a thorough physical examination and electrocardiographical measurements. VO2max was determined by bicycle ergometry (eBike EL Ergometer + CASE v6.7, GE Medical Systems Information Technologies, Inc. Milwaukee, WI, USA) with direct respiratory gas measurements (Vyntus CPX, CareFusion, Yorba Linda, CA, USA). VO2max per fat-free mass (FFM) (ml/min/kgFFM), and maximal load (Wmax) were also determined. The exercise workload was started at 25 W and increased by 25 W every three minutes until exhaustion. Participants were instructed to maintain a pace of 60–65 rpm throughout the test. Blood pressure and perceived exertion on the Borg scale (28) were measured one minute after each increase in workload. Maximal oxygen consumption (VO2max) was determined if one criterion was met: respiratory exchange ratio > 1.0, a plateau in VO2, or heart rate within ±10 bpm of the age-predicted maximum. VO2max was defined as the highest one-minute average in ml/min/kg.
Daily total energy intake and intakes of carbohydrates (CHO), protein, fat, alcohol, saturated fatty acids (SFA), monounsaturated fatty acids (MUFA), polyunsaturated fatty acids (PUFA), saccharose, fiber, and water-insoluble dietary fiber (WIDF) were calculated from 4-day food diaries (including one weekend day), and analyzed by a nutritionist with computerized software (AivoDiet 2.2.0.1, Aivo, Turku) that utilized Finnish Food Composition Database Fineli (29).
Validated (30) air displacement plethysmography (the Bod Pod system, COSMED, Inc., Concord, CA, USA) with predicted thoracic gas volume was used to estimate body composition (body fat-%) after fasting for at least four hours. Participants were advised not to exercise or take a shower beforehand on the day of the measurement. After emptying the bladder, participants entered the measurement chamber wearing a tight cap and underwear or a swimming suit. Body weight was measured by a scale (Seca 797, Vogel & Halke, Hamburg, Germany) in light clothing and body height barefooted with a wall-mounted stadiometer. Body mass index (BMI) was calculated from the measured weight and height in kg/m2. Waist circumference (WC) was measured with a flexible measuring tape midline between the iliac crest and the lowest rib, and the measurement was repeated twice or until the same measure was obtained twice. Blood pressure and resting heart rate were measured using a digital blood pressure monitor (Apteq AE701f, Rossmax International LtD, Taipei, Taiwan) in a seated position after at least 5 min of sitting. The mean of 2–3 measurements was used as the outcome measure. The anthropometric variables were measured under standard conditions. All the measurements were performed by the same researcher to ensure standardized measurements.
Liver fat content (LFC) was measured by magnetic resonance spectroscopy (MRS) and magnetic resonance imaging (MRI), based on two-point Dixon [2PD] method using a Philips 3 Tesla system (Ingenuity TF PET/MR) with a Q-Body coil. Because of the MRI scanner replacement during this study, MRS and MRI quantification of LFC of seven participants were conducted with Siemens Magnetom Skyra fit 3 T MRI system (Siemens Healthcare, Erlangen, Germany) with Siemens Body 30 and 18 channel coils, and 32 channel Spine coil.
The spectra were acquired using stimulated echo acquisition mode (STEAM) 1H MRS with parameters: repetition time (TR)/echo time (TE)/mixing time (TM) = 2000/11/17 ms, 4 averages, 2048 samples, spectral bandwidth 2000 Hz, and acquisition volume 20 x 20 x 30 mm3. Data were acquired during 12 breath holds. Water saturation was done with chemical shift selective (CHESS) with 50 Hz bandwidth. The duration of the scan was 3:12.0. The 3D T1-fast field echo sequence was acquired in the axial plane with parameters: TR/TE1/TE2 = 2.8/0.81/1.8 ms, flip angle 10°, FOV 510 mm x 510 mm, imaging matrix 188 x 188. Data was reconstructed to voxel size 2.13 x 2.13 x 4 mm3. Respiratory gating was used in the thorax–upper abdomen area.
MRS and MRI quantification of LFC conducted with Siemens Magnetom Skyra fit 3 T MRI system (Siemens Healthcare, Erlangen, Germany) with Siemens Body 30 and 18 channel coils, and 32 channel Spine coil. The spectra were acquired with point resolved spectroscopy (PRESS) 1H MRS with parameters TR/TE = 4000/30 ms, averages 32, 1024 samples, acquisition volume 20 x 20 x 20 mm3. Respiratory motion was controlled using a navigator. Water saturation was done with a 35 Hz bandwidth. The duration of the scan was 3:10. The 3D gradient echo volumetric interpolated breath-hold examination (VIBE Dixon) sequence was acquired in the axial plane with parameters: TR/TE1/TE2 = 3.97/1.23/2.46, flip angle 9°, and voxel size 2 x 2 x 2 mm3. Breath holds were used in the thorax–upper abdomen area. Controlled aliasing in parallel imaging results in higher acceleration (CAIPIRINHA) was used. Water signal and fat signal images were used to calculate the fat fraction map (31) from which the LFC was determined; an MRI image was used as an anatomical reference. LC Model (Version 6.3–0C) was used to quantify liver fat with ‘liver-4’ as a spectrum type. Lipid signals 1.6 ppm, 1.3 ppm, and 0.9 were used. The fat and water signals were corrected due to the difference in T2 decay (32, 33) and molar concentrations of 1H nuclei in fat and water as reported before (34, 35). Liver fat content was defined as fat in relation to the total weight of liver tissue (32).
MRI images were analyzed using Carimas software version 2.10 (http://turkupetcentre.fi/). Four representative three-dimensional regions of interest (ROIs) were drawn manually on the sections of the liver (left lateral and medial section, right anterior and posterior section) avoiding the main portal veins. The results were volume corrected with the following formula: mean volume of one section x (total volume (mm3) of one section/total volume of all sections).
Venous blood samples were drawn after at least 10 h of fasting. Plasma glucose was determined by enzymatic reference method with hexokinase GLUC3 and plasma insulin was determined by electrochemiluminescence immunoassay (Cobas 8000 e801, Roche Diagnostics GmbH, Mannheim, Germany). Hemoglobin A1c (HbA1c) was determined by turbidimetric inhibition immunoassay (Cobas 6000 c501, Roche Diagnostics GmbH, Mannheim, Germany). Plasma triglycerides, total cholesterol, low-density lipoprotein cholesterol (LDL-C), and high-density lipoprotein cholesterol (HDL-C) by enzymatic colorimetric tests (Cobas 8000 c702, Roche Diagnostics GmbH, Mannheim, Germany). Alanine aminotransferase (ALT) and aspartate aminotransferase (AST) were determined by the photometric IFCC (International Federation of Clinical Chemistry) method (Cobas 8000 c702 and c 502 Analyzer, Roche Diagnostics GmbH, Mannheim, Germany), and γ-glutamyltransferase (GGT) by enzymatic colorimetric tests and assay (Cobas 8000 c702, Roche Diagnostics GmbH, Mannheim, Germany). All the samples were analyzed at the Turku University Hospital Laboratory. Homeostatic model assessment of insulin resistance (HOMA-IR) was calculated using the formula: fasting glucose (mmol/l) x fasting insulin (mU/l)/22.5 (36).
The associations of HGU and EGP (dependent variables) with SB and PA measures, fitness, nutrient intake, and cardiometabolic health markers (independent variables) were examined with linear mixed models. The first model was adjusted for sex and age (model 1) and the second model additionally for body fat-% (model 2). Additionally, all the models with SB and PA outcomes were adjusted for accelerometer wear time. An unpaired t-test was used to compare the sexes and EGP according to standing time (≤1h 45min [n=22] vs. >1h 45 min [n=21], and daily sedentary time (≤ 10.0 h/day [n=21] vs. >10.0 h/day [n=22]), and HGU according to daily fiber consumption (≤ 18 g/day [n=21] vs. >18 g/day [n=22]) and water-insoluble dietary fiber consumption (≤ 13 g/day [n=21] vs. >13 g/day [n=22]). The normal distribution of the residuals was assessed by visual evaluation and the Shapiro-Wilk test, and logarithmic transformations were used when necessary to fulfill the normal distribution assumption. Multicollinearity was controlled for with variance inflation factors, which all were below five indicating no multicollinearity issues. Missing data was handled by pairwise deletion. A power calculation to determine the sample size was performed for the primary outcome (whole-body insulin sensitivity) of the sedentary behavior reduction intervention study (NCT03101228), from which the baseline imaging measurements form the data of this study. HGU and EGP measures of one participant were missing due to technical difficulties. VO2max measures of two participants were excluded because the test was stopped before reaching volitional exhaustion (due to knee pain or difficulties in breathing), and the results of one participant were lost due to technical problems. MRS-measured LFCs of three participants were missing due to image artifacts and MRS and MRI-measured LFCs of one participant were missing due to technical challenges with the scanner. Data are expressed as mean and standard deviation (SD), standardized β coefficients, and 95% confidence interval (CI) values. The level of statistical significance was set at 5% (two-tailed). All analyses were conducted with the JMP®, pro 13.1 for Windows (SAS Institute Inc., Cary, NC, USA), and with GraphPad Prism 5.01 (GraphPad Software, San Diego, CA). The figures were created with GraphPad Prism 5.01 (GraphPad Software, San Diego, CA) and JMP®, pro 16.0 (SAS Institute Inc., Cary, NC, 1989–2023).
In total, 263 individuals volunteered, of which 151 participated in the screening measurements and 44 participants were included in the study. Participants’ baseline characteristics grouped by sex are presented in Table 2. Sixty-six percent of the participants were obese (BMI ≥ 30 kg/m2), and 34% were overweight (BMI 25.0 to< 30). Participants had medication for elevated blood pressure (n=24) and for elevated blood cholesterol (n=9). Some participants also reported use of hormonal replacement therapy medication (n=7), pain medication (n=5), anticoagulants (n=5), thyroid medication (n=4), gastrointestinal medication (n=4), allergy or asthma medication (n=4), antidepressants (n=3), sleep medication (n=3), medication for urinary problems (n=2), osteoarthritis medication (n=1) and medication for restless legs syndrome (n=1).
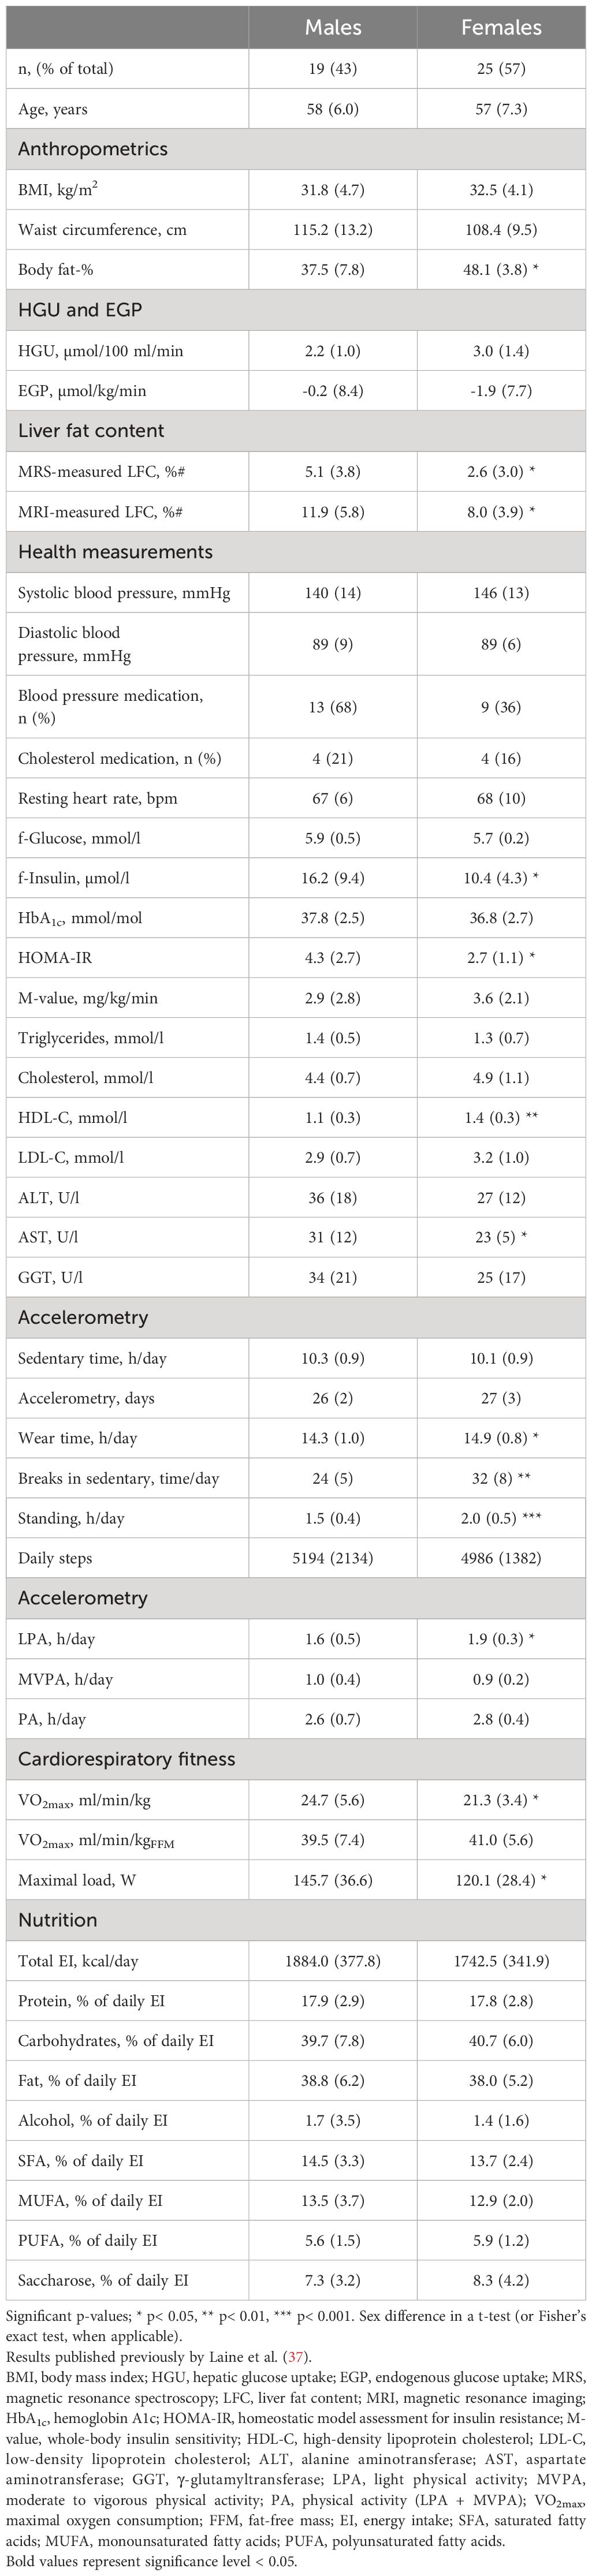
Table 2 Characteristics of the study participants by sex. If not otherwise stated, the results are reported as mean (SD).
When adjusted for age, sex, and accelerometer wear time, HGU was not associated with any of the SB, PA, or fitness variables (model 1, Table 3). Associations remained non-significant when body fat-% was added to the model (model 2, Table 3). In the age-, sex- and accelerometer wear time-adjusted model, EGP was negatively associated with standing time (h/day), and positively with SB time (h/day) (model 1, Table 3). When further adjusted for body fat-%, the association between EGP and standing time remained significant; however, the association between EGP and SB time turned non-significant (model 2, Table 3). Additionally, EGP was better with standing time >1h 45 min compared to ≤1h 45min [EGP -4.8 (−8.1, -1.6) vs. +2.4 (−0.8, 5.5), respectively, p = 0.003] (Figure 2A), and with sedentary time ≤10.0 h/day compared to >10.0 h/day [EGP -5.4 (-9.3, -1.6) vs. +3.0 (0.6, 5.3), respectively, p = 0.0005] (Figure 2B). When adjusted for age and sex, EGP associated negatively with VO2 max (ml/min/kg) (model 1, Table 3). However, when body fat-% was included in the model, the association turned non-significant (model 2, Table 3).
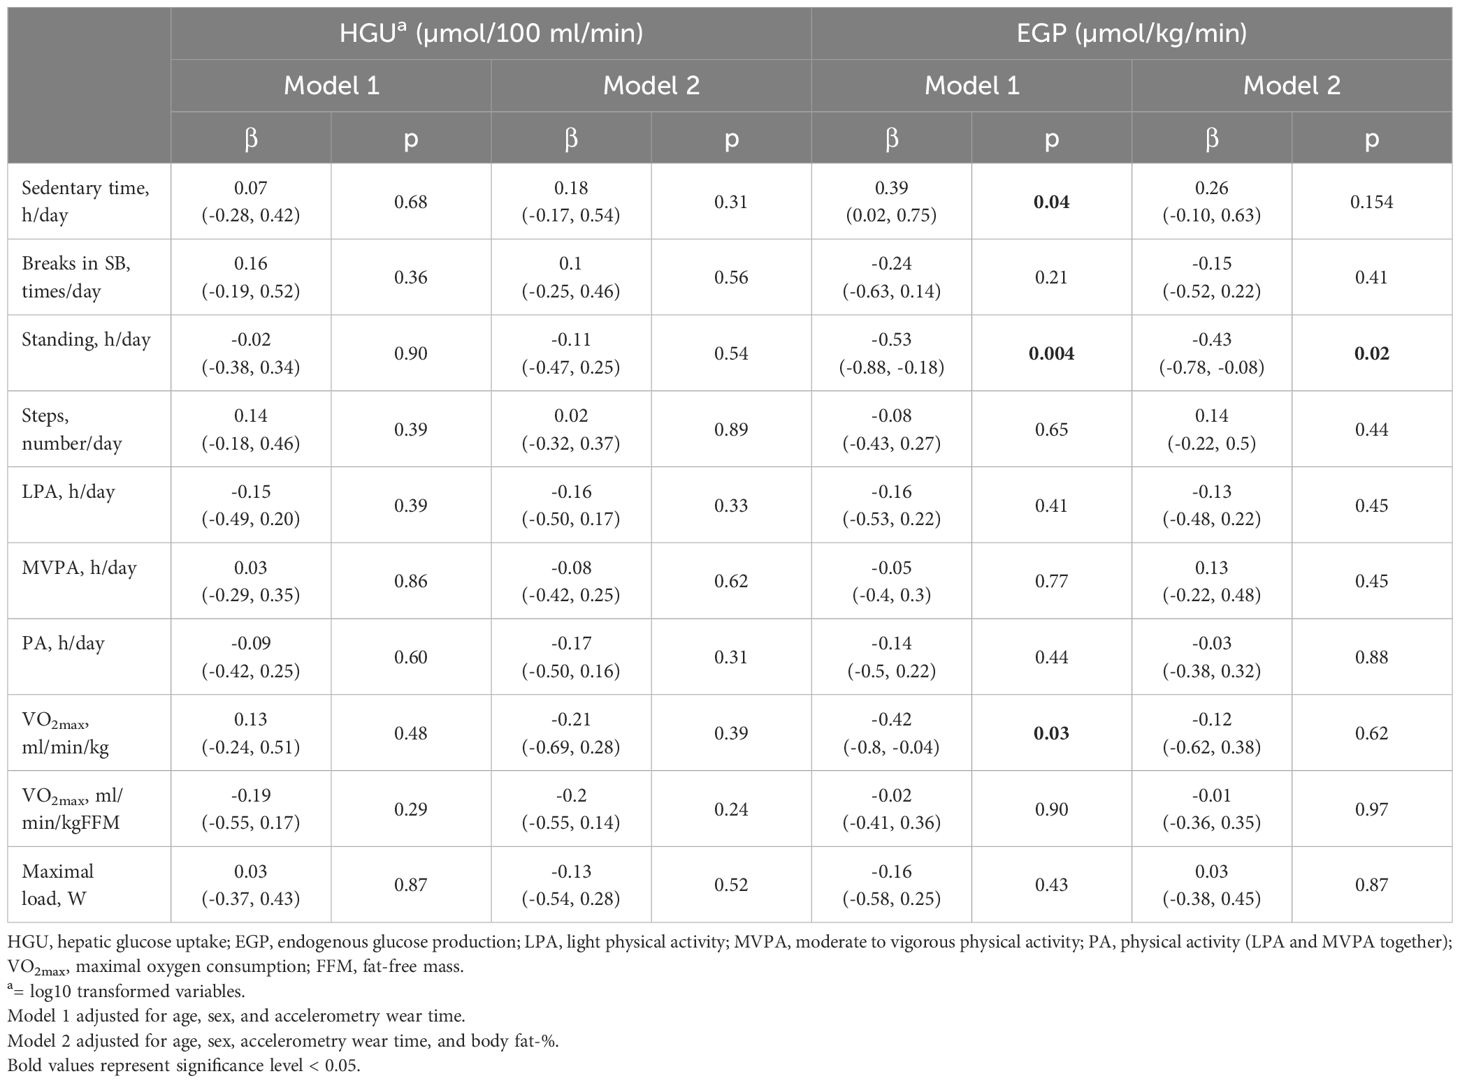
Table 3 Age-, sex- accelerometry wear time and body fat-% -adjusted linear mixed regression estimates (standardized β coefficients [95% CI]) between HGU, EGP, sedentary behavior, physical activity, and cardiorespiratory fitness.
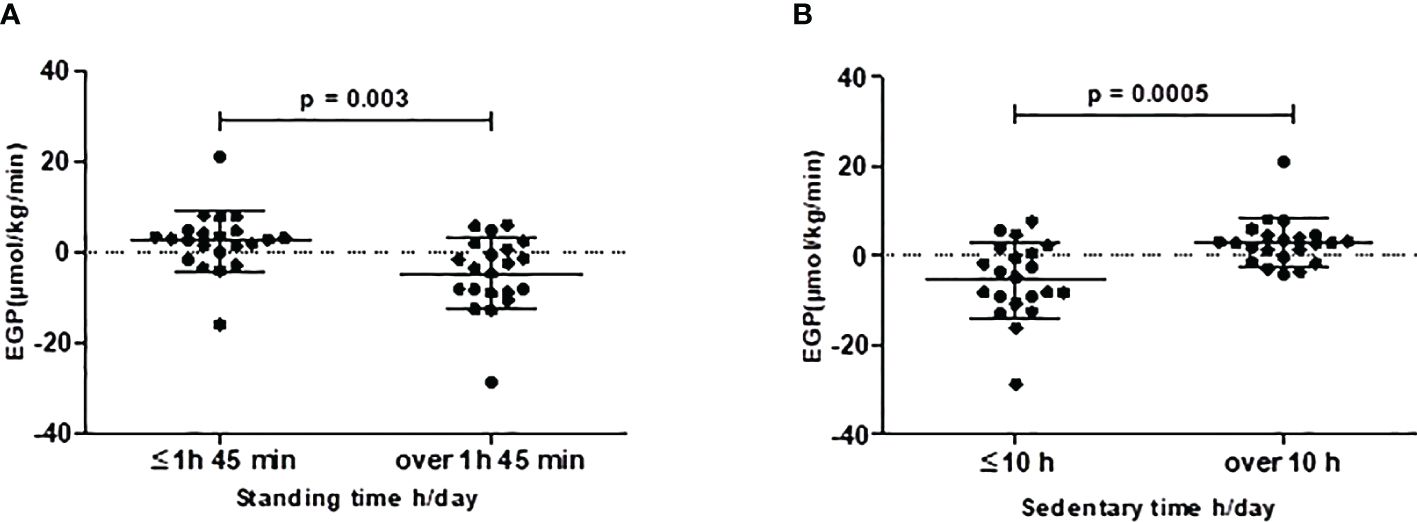
Figure 2 Endogenous glucose production (EGP) is better with (A) standing time >1h 45 min (n=21) vs ≤1h 45min (n=22) and with (B) sedentary time >10.0 h/day (n=22) vs. ≤10.0 h/day (n = 21). Black dots represent individual participants, and black lines with error bars indicate means (SD).
In the age- and sex-adjusted model HGU was positively associated with daily total fiber intake (g/day) and with water-insoluble dietary fiber (WIDF, g/day) (model 1, Table 4). The association between HGU and WIDF remained significant when body fat-% was added to the model (model 2, Table 4). Also, HGU was better with fiber consumption > 18 g/day compared to ≤ 18g/day [HGU 3.0 (± 0.3) vs. 2.2 (± 0.2), respectively, p = 0.03] (Figure 3A), and with consumption of water-insoluble dietary fiber > 13 g/day compared to ≤ 13g/day [HGU 3.0 (± 0.3) vs. 2.2 (± 0.2), respectively, p = 0.03] (Figure 3B). Additionally, in the age-, sex- and body fat-%-adjusted model, HGU was negatively associated with intakes of carbohydrates (CHO, E%) and saccharose (E%) and positively associated with the proportion of mono- and polyunsaturated fatty acids (MUFA, E%; PUFA, E%; respectively) (model 2, Table 4).
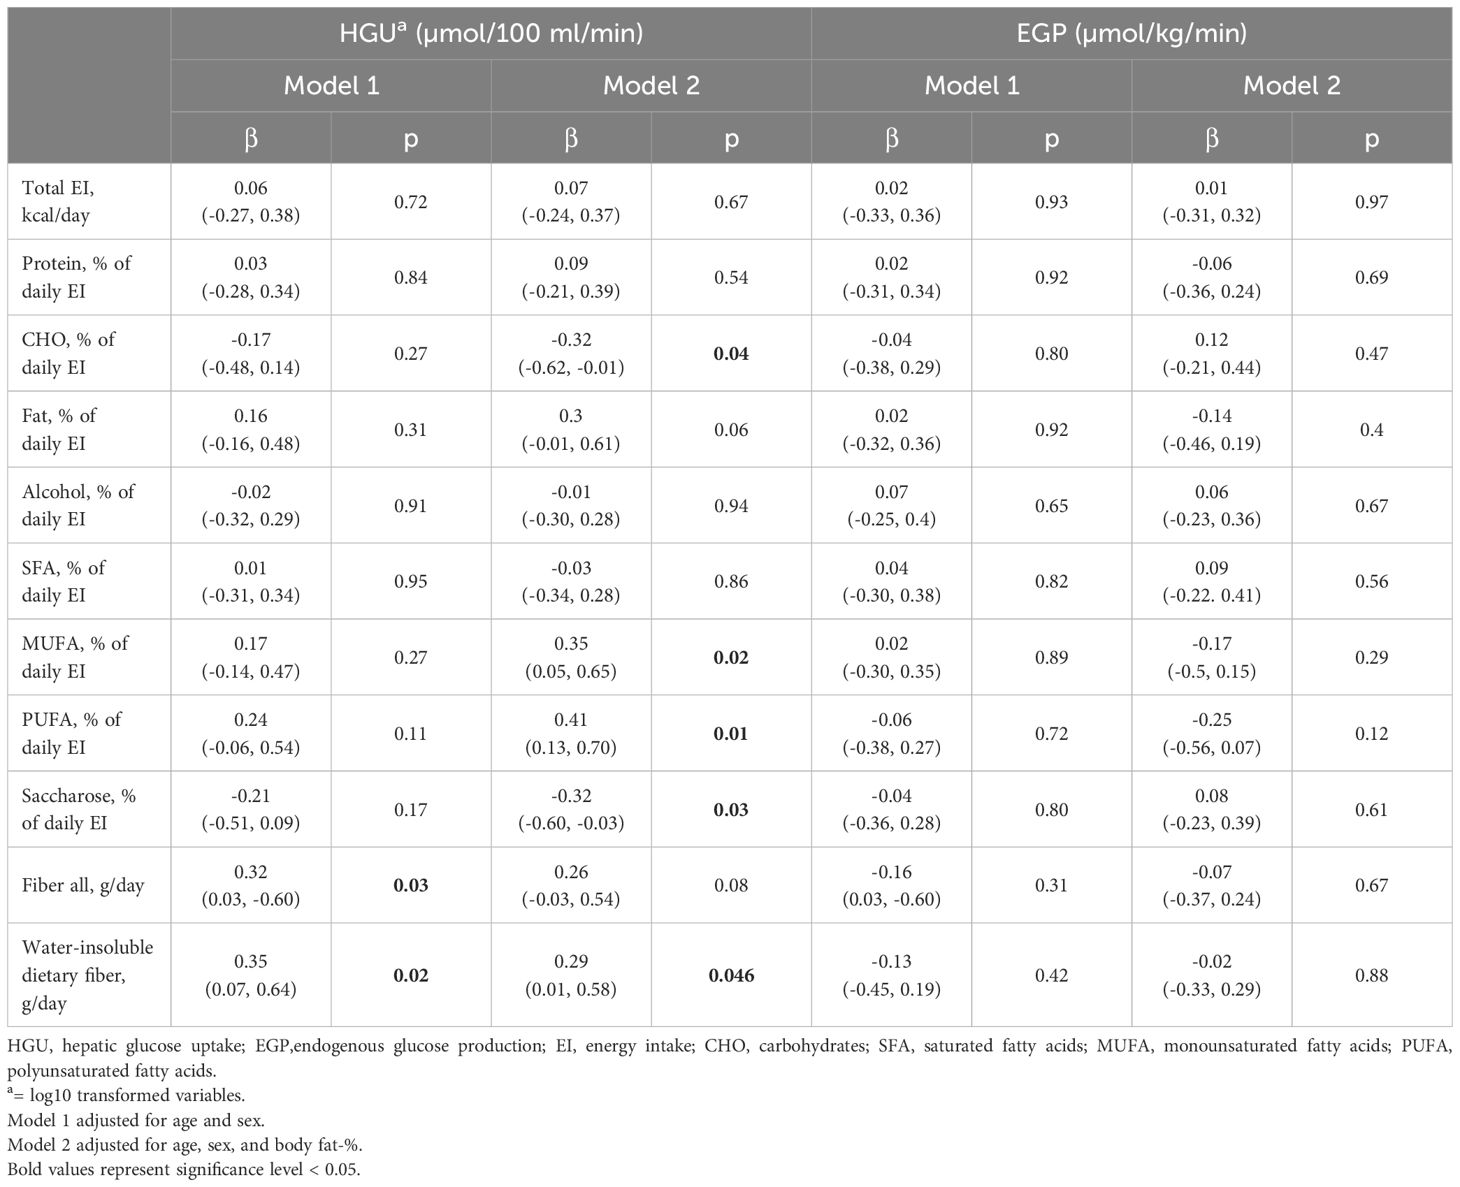
Table 4 Age- sex- and body fat-% -adjusted linear mixed regression estimates (standardized β coefficients [95% CI]) between HGU, EGP, and dietary intake.
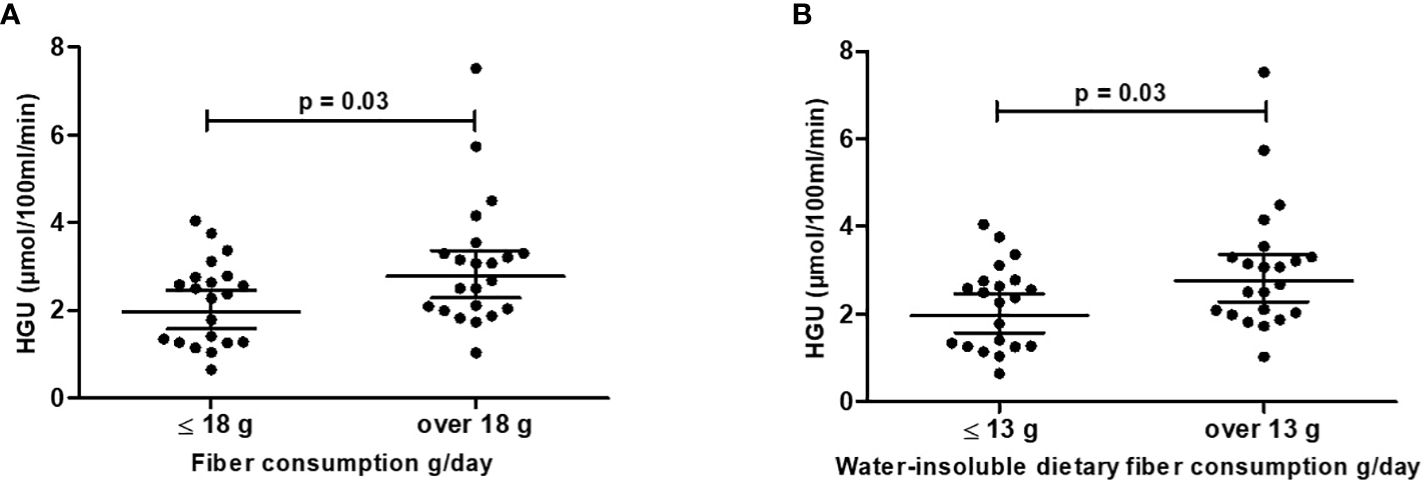
Figure 3 Hepatic glucose uptake (HGU) is better with (A) fiber consumption >18 g/day (n=22) vs. ≤ 18 g/day (n=21) and (B) water-insoluble dietary fiber consumption >13 g/day (n=22) vs. ≤ 13 g/day (n = 21). Black dots represent individual participants, and black lines with error bars indicate means (SD). HGU values are log10 transformed (means are back-transformed geometric model-based means [95% CI]).
In the sex-, and age-adjusted model, EGP was not associated with any of the dietary variables (model 1, Table 4), and the associations remained non-significant when body fat-% was added to the model (model 2, Table 4).
When adjusted for age and sex, HGU was associated negatively with body fat-%, fasting insulin, HOMA-IR, and positively with M-value (model 1, Table 5). After further adjustment for body fat-%, only the association between HGU and M-value remained significant (model 2, Table 5). When adjusted for age and sex, EGP was associated positively with body fat-%, waist circumference, fasting insulin, HOMA-IR, and negatively with M-value and LDL-C (model 1, Table 5). After further adjustment for body fat-%, the associations between EGP and M-value and LDL-C remained significant (model 2, Table 5). Neither HGU nor EGP was associated with liver enzymes ALT, AST or GGT, or MRS- and MRI-measured liver fat content in any of the models (model 1–2, Table 5).
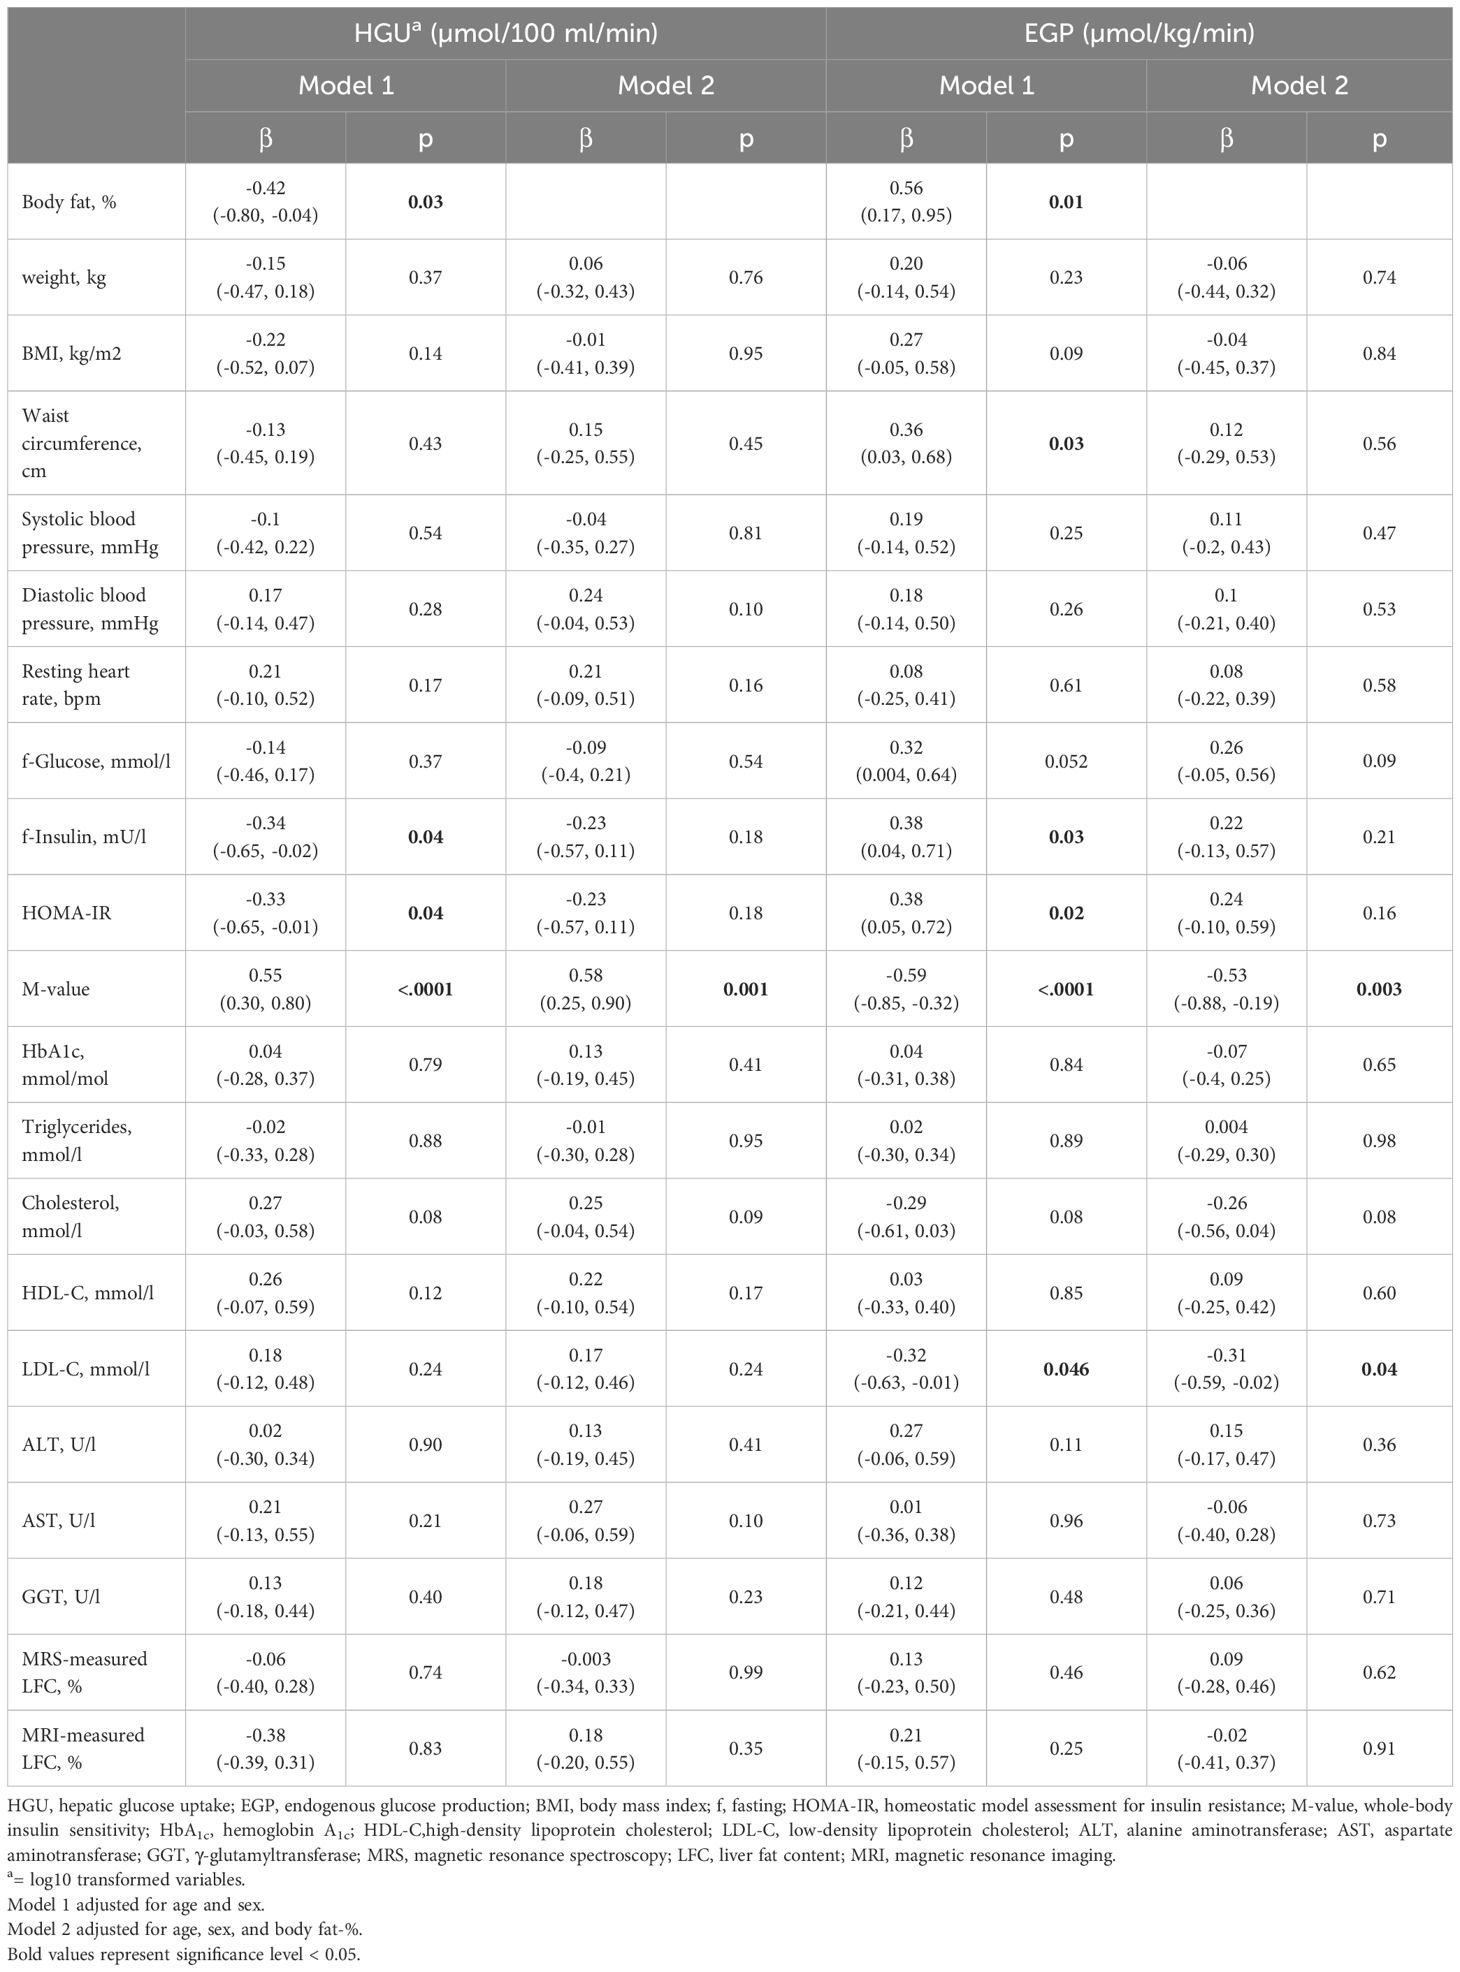
Table 5 Age-, sex- and body fat-% -adjusted linear mixed regression estimates (standardized β coefficients [95% CI]) between HGU, EGP, cardiometabolic health markers, and liver fat content.
In the present study, HGU was not associated with accelerometer-measured habitual SB, PA, or cardiorespiratory fitness. However, we found that EGP was negatively associated with daily standing time, even independently of body adiposity. Additionally, we found that HGU and EGP were associated with body adiposity and whole-body insulin resistance markers (fasting insulin, HOMA-IR, and M-value). We also observed that HGU was negatively associated with daily energy intake of carbohydrates and sugar and positively with daily dietary fiber intake, especially WIDF and unsaturated fatty acids (MUFA and PUFA). Taken together, our results indicate that increasing daily standing time and dietary fiber intake and replacing some of the daily carbohydrates and sugars with unsaturated fat sources might potentially improve hepatic insulin sensitivity. Additionally, we found a beneficial association between EGP with plasma LDL-C, suggesting LDL-C might decrease EGP and thus improve hepatic insulin sensitivity and potentially and paradoxically reduce the risk of type 2 diabetes. These results provide novel insights into the associations between hepatic insulin resistance markers and accelerometer-measured SB and PA, fitness, diet, and metabolic markers in adults with MetS.
HGU was not associated with SB or any of the PA measures. To the best of our knowledge, no previous studies have investigated the associations between HGU and accelerometer-measured habitual SB and PA. However, previous intervention studies using PET have shown that the intensity and duration of exercise have different effects on HGU. In a recent study, moderate-intensity training was shown to be more effective in improving HGU compared to sprint interval training in adults with normoglycemia or prediabetes/type 2 diabetes (38). However, in another study resistance training did not influence HGU in elderly females (39). Thus, it seems that moderate-intensity aerobic exercise may be the most effective in improving HGU. It is possible, that in the present study, the overall duration and/or intensity of PA were not sufficient to show any associations between HGU and PA. The small variation in PA levels in this homogenous, sedentary, and inactive population may also have prevented detecting associations.
When adjusted for age and sex, EGP was positively associated with SB time in the present study. However, when body fat-% was added to the model the association turned non-significant. Thus, it seems that SB is not independently associated with EGP, and body adiposity might play a more important role in regulating EGP. Although we did not find any associations between HGU and SB or PA, we found that EGP was beneficially associated with daily standing time, independently of body adiposity. To our knowledge, this is a novel finding. However, previous intervention studies have shown that resistance training (39), and treadmill walking (40) have beneficial effects on EGP. In the former study, elderly females performed medium-intensity resistance training three times per week for 4 months, and EGP was suppressed by 28% in the whole group when compared to the baseline results (39). In the latter study, adults with type 2 diabetes walked on a treadmill with medium intensity for 15 weeks (4–5 days/week) and their EGP was suppressed, even if splanchnic glucose uptake was reduced (40). Additionally, in another study, six weeks of MVPA for 20 minutes at least three times per week (60 to 85% of maximal aerobic capacity) resulted in increased insulin sensitivity assessed by both EGP and peripheral glucose uptake in sedentary men (41). Thus, EGP seems to improve with different exercise intensities, such as walking, moderate and vigorous PA, and resistance training. Additionally, we showed in our previous study that standing was favorably associated with whole-body insulin sensitivity (25). Thus, it is plausible to hypothesize that replacing sedentary behavior such as sitting with standing may also have beneficial effects on insulin sensitivity not only at the whole-body level but also at the hepatic tissue level. However, this must be confirmed with intervention studies to show causality.
Aerobic fitness is positively associated with whole-body insulin sensitivity (42, 43), but the role of fitness in hepatic insulin sensitivity is unclear. Our study did not find an association between HGU and cardiorespiratory fitness. When adjusted for sex and age, EGP was negatively associated with fitness. However, when further adjusted for body fat-% all the associations were attenuated. Thus, fitness does not seem to be independently associated with hepatic insulin sensitivity, and body adiposity might play a more important role in regulating liver glucose metabolism.
Previous studies have shown that sugar intake, especially fructose (one of the two components of saccharose), has a prominent role in developing NAFLD. Fructose induces fatty liver by two different mechanisms; de novo lipogenesis and β-oxidation, which can eventually lead to hepatic insulin resistance (44). In the present study, HGU was inversely associated with the intake of carbohydrates and saccharose of total energy intake (%), which might refer that a diet that consists of lower intakes of carbohydrates, especially sugar, when compared to other macronutrients may improve HGU, and thus hepatic insulin sensitivity in adults with Mets. Interestingly, HGU was not changed after 6 weeks of a very low-calorie diet in adults with obesity (45). However, in the aforementioned study, all meals were replaced with dietary products (carbohydrates 53%, protein 44%, and fat 3%). Thus, potentially different outcomes with different combinations of macronutrients were not assessed.
We also found that HGU was positively associated with the intakes of unsaturated fatty acids MUFA and PUFA. It has been previously shown that MUFA and PUFA may have beneficial effects on glucose and hepatic metabolism with a reduction of HbA1c, glycaemia, and liver fat (46). Additionally, a diet containing high levels of saturated fatty acids had a greater effect on intrahepatic triglyceride content and it increased lipolysis compared to a diet rich in unsaturated fatty acids (47). Although, both of the aforementioned diets increased intrahepatic triglyceride levels, a diet rich in unsaturated fatty acids had more positive effects on liver fat content and lipolysis than a diet with saturated fatty acids (47).
We also detected that HGU was positively associated with dietary fiber intake, especially with WIDF. Previous large prospective studies have shown that high dietary fiber intake, especially insoluble cereal dietary fiber is associated with a reduced risk of type 2 diabetes by potentially improving insulin sensitivity, inflammatory markers, and intestinal microbiota (48). Dietary fiber may also have beneficial effects on metabolic markers related to liver disease and liver cancer, such as high blood glucose, insulin resistance, fatty liver, and MetS (49). Moreover, dietary fiber may have beneficial effects not only on whole-body insulin sensitivity but according to our findings also on hepatic insulin sensitivity. In summary, our results suggest that a decrease in carbohydrates and sugar and an increase in unsaturated fatty acids and daily fiber consumption may have beneficial effects on hepatic insulin sensitivity in adults with MetS. However, this must be confirmed with intervention studies to show causality.
As mentioned earlier, in the insulin-stimulated state HGU is increased, and EGP is suppressed compared to fasting state in healthy individuals (5). However, in insulin-resistant individuals, the liver fails to increase HGU and suppress EGP adequately in response to insulin stimulation (50). In the present study with adults with MetS, HGU was inversely, and EGP positively associated with body adiposity, fasting insulin, and HOMA-IR. Additionally, HGU was positively, and EGP inversely associated with whole-body insulin sensitivity measured by hyperinsulinemic-euglycemic clamp. Thus, our findings build on the existing evidence and support the notion that obesity and insulin resistance markers are closely associated with hepatic insulin resistance.
Excess fat in the liver affects glucose uptake by taking up space in the hepatocytes, and on the other hand, the fat metabolism intermediates diacylglycerides (DAGs) interfere with insulin signaling (51). Overnutrition and overweight can increase DAG content in the liver due to high delivery of free fatty acids from the circulation or due to increased de novo lipogenesis, which both increase intrahepatocellular lipid content, leading to liver insulin resistance (51, 52). A previous study in healthy subjects and type 2 diabetic patients show an inverse association between MRS-measured liver fat content and HGU (53). However, in the present study, we did not find a significant association between HGU, or EGP, and liver fat content measured either with MRS or MRI. It may be so that, fatty acid metabolism intermediates, rather than liver fat content per se, may interfere with hepatic glucose metabolism and lead to insulin resistance in the liver.
Finally, we also found that EGP was inversely associated with LDL-C. Even though this beneficial association may not sound expected because high plasma LDL-C levels are closely associated with an increased risk of cardiovascular disease (54), it is in accordance with recent findings regarding LDL-C and glucose metabolism. An increase in LDL-C has been found to be positively associated with insulin secretion (55), and inversely with the risk of type 2 diabetes (56). A meta-analysis found that cholesterol-lowering drugs slightly increased the risk of developing type 2 diabetes (57). Our results suggest that the inverse association of EGP with LDL-C might indicate that LDL-C decreases EGP, thus improving hepatic insulin sensitivity and paradoxically reducing the risk of type 2 diabetes in adults with MetS. To our knowledge, this is a novel result and may be one possible mechanistic explanation for the reduced risk of type 2 diabetes. However, this must be confirmed with intervention studies to show causality.
A major strength of the current study is the use of the gold standard euglycemic-hyperinsulinemic clamp method (22) for measuring insulin sensitivity, combined with PET imaging to measure glucose uptake directly in the liver. PET represents the current gold standard for assessing non-invasive tissue-specific glucose uptake in vivo (58). Further advantages are the use of accelerometers and validated algorithms for measuring SB and PA (26, 27) for four consecutive weeks, as well as the measurement of cardiorespiratory fitness with direct respiratory gas measurements. Limitations include a relatively small sample size, but the techniques, especially PET imaging, used in this study prevent from using larger groups. Also, a limitation would be the medications some of the participants used which might have affected the results. The key limitation of the present study is the cross-sectional setting, which prevents the causal interpretation of these results. Therefore, future studies should aim to assess the relationship between HGU, EGP and habitual SB, PA, and other lifestyle factors in longitudinal and experimental settings.
Taken together the results of the present study show that dietary factors may be more important than daily habitual physical (in) activity or aerobic fitness for the healthy liver. The negative association between HGU and daily carbohydrates and saccharose intake, and the positive associations between MUFA, PUFA, and WIDF suggest that replacing some of the daily carbohydrates and sugars with quality fats, as well as adding fiber to the diet might result in a healthier liver. However, interventions investigating the impact of dietary modification on hepatic insulin sensitivity are warranted. On the other hand, SB, PA, or fitness were not associated with HGU, and standing was the only parameter associated with insulin sensitivity markers (EGP). This suggests that increasing standing in daily life could lead to healthier liver glucose metabolism, but this also needs to be confirmed in targeted intervention studies. Our results also confirm unhealthy body composition is associated with impaired hepatic insulin sensitivity markers. Additionally, the beneficial association between EGP and plasma LDL-C, suggests that LDL-C may decrease EGP and thus improve hepatic insulin sensitivity and paradoxically reduce the risk of type 2 diabetes.
The original contributions presented in the study are included in the article/supplementary material. Further inquiries can be directed to the corresponding author.
The studies involving humans were approved by Ethics Committee of the Hospital District of Southwest Finland. The studies were conducted in accordance with the local legislation and institutional requirements. The participants provided their written informed consent to participate in this study.
SL: Data curation, Formal Analysis, Funding acquisition, Investigation, Visualization, Writing – original draft, Writing – review & editing. TS: Conceptualization, Data curation, Formal Analysis, Funding acquisition, Investigation, Writing – review & editing. TG: Data curation, Formal Analysis, Investigation, Writing – review & editing. MH: Formal Analysis, Supervision, Writing – review & editing. EL: Formal Analysis, Supervision, Writing – review & editing. OE: Methodology, Writing – review & editing. MS: Investigation, Writing – review & editing. PK: Investigation, Writing – review & editing. MK: Investigation, Writing – review & editing. HV: Data curation, Formal Analysis, Methodology, Writing – review & editing. HS: Formal Analysis, Methodology, Writing – review & editing. TV: Conceptualization, Writing – review & editing. JH: Investigation, Writing – review & editing. KL: Conceptualization, Writing – review & editing. NH: Data curation, Investigation, Writing – review & editing. KK: Conceptualization, Writing – review & editing. VS: Conceptualization, Formal Analysis, Investigation, Writing – review & editing. JK: Conceptualization, Writing – review & editing. IH: Conceptualization, Formal Analysis, Funding acquisition, Investigation, Project administration, Resources, Supervision, Writing – review & editing.
The author(s) declare financial support was received for the research, authorship, and/or publication of this article. The study was financially supported by the Academy of Finland (324243), Instrumentarium Science Foundation (200034), Turku University Foundation (80519), Juho Vainio Foundation (202300322), Hospital District of South-West Finland (11212), Finnish Diabetes Research Foundation (180021), Finnish Cultural Foundation (190988) and Yrjö Jahnsson Foundation (20227535).
This study was conducted within the Centre of Excellence in Cardiovascular and Metabolic Research, supported by the Academy of Finland, the University of Turku, Turku University Hospital, and Åbo Akademi University. We thank the staff of Turku PET Centre, the University of Turku, and the Turku University Hospital laboratory personnel for their excellent technical assistance.
JK received consultancy fees from GE Healthcare and AstraZeneca and speaker fees from GE Healthcare, Bayer, Lundbeck, Boehringer-Ingelheim, and Merck, outside of the submitted work.
The remaining authors declare that the research was conducted in the absence of any commercial or financial relationships that could be constructed as a potential conflict of interest.
The author(s) declared that they were an editorial board member of Frontiers, at the time of submission. This had no impact on the peer review process and the final decision.
All claims expressed in this article are solely those of the authors and do not necessarily represent those of their affiliated organizations, or those of the publisher, the editors and the reviewers. Any product that may be evaluated in this article, or claim that may be made by its manufacturer, is not guaranteed or endorsed by the publisher.
ALT, alanine aminotransferase; AST, aspartate aminotransferase; DAG, diacylglyceride; EGP, endogenous glucose production; [18F] FDG, 2-deoxy-2-(18F) fluoro-D-glucose; GGT, γ-glutamyltransferase; HDL-C, high-density lipoprotein cholesterol; HGU, hepatic glucose uptake; HOMA-IR, homeostatic model assessment of insulin resistance; LDL-C, low-density lipoprotein cholesterol; LPA, light physical activity; MetS, metabolic syndrome; MUFA, monounsaturated fatty acids; M-value, whole-body insulin sensitivity; MVPA, moderate-to-vigorous physical activity; NAFLD, non-alcoholic fatty liver disease; PA, physical activity; PET, positron emission tomography; PUFA, polyunsaturated fatty acids; SB, sedentary behavior; VO2max, maximal oxygen consumption; WIDF, water-insoluble dietary fiber.
1. Parekh S, Anania FA. Abnormal lipid and glucose metabolism in obesity: implications for nonalcoholic fatty liver disease. Gastroenterol N Y N 1943. (2007) 132:2191–207. doi: 10.1053/j.gastro.2007.03.055
2. Meshkani R, Adeli K. Hepatic insulin resistance, metabolic syndrome and cardiovascular disease. Clin Biochem. (2009) 42:1331–46. doi: 10.1016/j.clinbiochem.2009.05.018
3. Kim SP, Ellmerer M, Van Citters GW, Bergman RN. Primacy of hepatic insulin resistance in the development of the metabolic syndrome induced by an isocaloric moderate-fat diet in the dog. Diabetes N Y N. (2003) 52:2453–60. doi: 10.2337/diabetes.52.10.2453
4. Ahmed B, Sultana R, Greene MW. Adipose tissue and insulin resistance in obese. BioMed Pharmacother. (2021) 137:111315. doi: 10.1016/j.biopha.2021.111315
5. Moore MC, Coate KC, Winnick JJ, An Z, Cherrington AD. Regulation of hepatic glucose uptake and storage in vivo. Adv Nutr Bethesda Md. (2012) 3:286–94. doi: 10.3945/an.112.002089
6. Ferre T, Riu E, Bosch F, Valera A. Evidence from transgenic mice that glucokinase is rate limiting for glucose utilization in the liver. FASEB J. (1996) 10:1213–8. doi: 10.1096/fasebj.10.10.8751724
7. Borges DO, Patarrão RS, Ribeiro RT, de Oliveira RM, Duarte N, Belew GD. Loss of postprandial insulin clearance control by Insulin-degrading enzyme drives dysmetabolism traits. Metabolism. (2021) 118:154735. doi: 10.1016/j.metabol.2021.154735
8. Im SS, Kang SY, Kim SY, Kim H, Kim JW, Kim KS. Glucose-stimulated upregulation of GLUT2 gene is mediated by sterol response element–binding protein-1c in the hepatocytes. Diabetes. (2005) 54:1684–91. doi: 10.2337/diabetes.54.6.1684
9. Roden M, Bernroider E. Hepatic glucose metabolism in humans—its role in health and disease. Best Pract Res Clin Endocrinol Metab. (2003) 17:365–83. doi: 10.1016/S1521-690X(03)00031-9
10. Ormsbee JJ, Zhou T, Knopp JL, Chase JG. Estimating endogenous glucose production during exercise using heart rate: implications for diabetes management. IFAC-Pap. (2021) 54:478–83. doi: 10.1016/j.ifacol.2021.10.302
11. Kowalski GM, Moore SM, Hamley S, Selathurai A, Bruce CR. The effect of ingested glucose dose on the suppression of endogenous glucose production in humans. Diabetes N Y N. (2017) 66:2400–6. doi: 10.2337/db17-0433
12. Basu R, Basu A, Johnson CM, Schwenk WF Rizza RA. Insulin dose-response curves for stimulation of splanchnic glucose uptake and suppression of endogenous glucose production differ in nondiabetic humans and are abnormal in people with type 2 diabetes. Diabetes N Y N. (2004) 53:2042–50. doi: 10.2337/diabetes.53.8.2042
13. Cassidy S, Chau JY, Catt M, Bauman A, Trenell MI. Low physical activity, high television viewing and poor sleep duration cluster in overweight and obese adults; a cross-sectional study of 398,984 participants from the UK Biobank. Int J Behav Nutr Phys Act. (2017) 14:57. doi: 10.1186/s12966-017-0514-y
14. Heinonen I, Helajarvi H, Pahkala K, Heinonen OJ, Hirvensalo M, Palve K. Sedentary behaviours and obesity in adults: the Cardiovascular Risk in Young Finns Study. BMJ Open. (2013) 3(6):e002901. doi: 10.1136/bmjopen-002901
16. Hallsworth K, Thoma C, Moore S, Ploetz T, Anstee QM, Taylor R. Non-alcoholic fatty liver disease is associated with higher levels of objectively measured sedentary behaviour and lower levels of physical activity than matched healthy controls. Frontline Gastroenterol. (2015) 6:44–51. doi: 10.1136/flgastro-2014-100432
17. Borghouts LB, Keizer HA. Exercise and insulin sensitivity: A review. Int J Sports Med. (2000) 21:1–12. doi: 10.1055/s-2000-8847
18. Alberti KG, Eckel RH, Grundy SM, Zimmet PZ, Cleeman JI, Donato KA. Harmonizing the metabolic syndrome: a joint interim statement of the International Diabetes Federation Task Force on Epidemiology and Prevention; National Heart, Lung, and Blood Institute; American Heart Association; World Heart Federation; International Atherosclerosis Society; and International Association for the Study of Obesity. Circulation. (2009) 120:1640–5. doi: 10.1161/CIRCULATIONAHA.109.192644
19. Sjöros T, Laine S, Garthwaite T, Vähä-Ypyä H, Löyttyniemi E, Koivumäki M. Reducing sedentary time and whole-body insulin sensitivity in metabolic syndrome - A 6-month randomized controlled trial. Med Sci Sports Exerc. (2022) 55(3):342–53. doi: 10.1249/MSS.0000000000003054
20. Hamacher K, Coenen HH, Stöcklin G. Efficient stereospecific synthesis of no-carrier-added 2-[18F]-fluoro-2-deoxy-D-glucose using aminopolyether supported nucleophilic substitution. J Nucl Med Off Publ Soc Nucl Med. (1986) 27:235–8.
21. Patlak CS, Blasberg RG. Graphical evaluation of blood-to-brain transfer constants from multiple-time uptake data. Generalizations J Cereb Blood Flow Metab. (1985) 5:584–90. doi: 10.1038/jcbfm.1985.87
22. DeFronzo RA, Tobin JD, Andres R. Glucose clamp technique: a method for quantifying insulin secretion and resistance. Am J Physiol. (1979) 237:214. doi: 10.1152/ajpendo.1979.237.3.E214
23. Honka MJ, Latva-Rasku A, Bucci M, Virtanen KA, Hannukainen JC, Kalliokoski KK. Insulin-stimulated glucose uptake in skeletal muscle, adipose tissue and liver: a positron emission tomography study. Eur J Endocrinol. (2018) 178:523–31. doi: 10.1530/EJE-17-0882
24. Iozzo P, Gastaldelli A, Jarvisalo MJ, Kiss J, Borra R, Buzzigoli E. F-18-FDG assessment of glucose disposal and production rates during fasting and insulin stimulation: A validation study. J Nucl Med 1978. (2006) 47:1016–22.
25. Garthwaite T, Sjöros T, Koivumäki M, Laine S, Vähä-Ypyä H, Saarenhovi M. Standing is associated with insulin sensitivity in adults with metabolic syndrome. J Sci Med Sport. (2021) 24:1255–60. doi: 10.1016/j.jsams.2021.08.009
26. Vähä-Ypyä H, Vasankari T, Husu P, Mänttäri A, Vuorimaa T, Suni J. Validation of cut-points for evaluating the intensity of physical activity with accelerometry-based mean amplitude deviation (MAD). PLoS One. (2015) 10:e0134813. doi: 10.1371/journal.pone.0134813
27. Vähä-Ypyä H, Husu P, Suni J, Vasankari T, Sievänen H. Reliable recognition of lying, sitting, and standing with a hip-worn accelerometer. Scand J Med Sci Sports. (2018) 28:1092–102. doi: 10.1111/sms.13017
28. Borg GA. Psychophysical bases of perceived exertion. Med Sci Sports Exerc. (1982) 14:377–81. doi: 10.1249/00005768-198205000-00012
29. National Institute for Health and Welfare, Public Health Promotion Unit. Fineli. Finnish food composition database. Release 20. Helsinki (2019). Available at: www.fineli.fi.
30. Fields DA, Goran MI, McCrory MA. Body-composition assessment via air-displacement plethysmography in adults and children: a review. Am J Clin Nutr. (2002) 75:453–67. doi: 10.1093/ajcn/75.3.453
31. Bray TJ, Chouhan MD, Punwani S, Bainbridge A, Hall-Craggs MA. Fat fraction mapping using magnetic resonance imaging: insight into pathophysiology. Br J Radiol. (2018) 91:20170344. doi: 10.1259/bjr.20170344
32. Thomsen C, Becker U, Winkler K, Christoffersen P, Jensen M, Henriksen O. Quantification of liver fat using magnetic resonance spectroscopy. Magn Reson Imaging. (1994) 12:487–95. doi: 10.1016/0730-725X(94)92543-7
33. Weis J, Kullberg J, Ahlström H. Multiple breath-hold proton spectroscopy of human liver at 3T: Relaxation times and concentrations of glycogen, choline, and lipids. J Magn Reson Imaging. (2018) 47:410–7. doi: 10.1002/jmri.25734
34. Rigazio S, Lehto HR, Tuunanen H, Nagren K, Kankaanpaa M, Simi C. The lowering of hepatic fatty acid uptake improves liver function and insulin sensitivity without affecting hepatic fat content in humans. Am J Physiol Endocrinol Metab. (2008) 295:413. doi: 10.1152/ajpendo.00744.2007
35. Szczepaniak LS, Babcock EE, Schick F, Dobbins RL, Garg A, Burns DK. Measurement of intracellular triglyceride stores by H spectroscopy: validation in vivo. Am J Physiol - Endocrinol Metab. (1999) 276:977–89. doi: 10.1152/ajpendo.1999.276.5.E977
36. Matthews DR, Hosker JP, Rudenski AS, Naylor BA, Treacher DF, Turner RC. Homeostasis model assessment: insulin resistance and beta-cell function from fasting plasma glucose and insulin concentrations in man. Diabetologia. (1985) 28:412–9. doi: 10.1007/BF00280883
37. Laine S, Sjöros T, Garthwaite T, Saarenhovi M, Kallio P, Löyttyniemi E. Relationship between liver fat content and lifestyle factors in adults with metabolic syndrome. Sci Rep. (2022) 12:17428. doi: 10.1038/s41598-022-22361-3
38. Motiani KK, Savolainen AM, Toivanen J, Eskelinen JJ, Yli-Karjanmaa M, Virtanen KA. Effects of short-term sprint interval and moderate-intensity continuous training on liver fat content, lipoprotein profile, and substrate uptake: a randomized trial. J Appl Physiol. (2019) 126:1756–68. doi: 10.1152/japplphysiol.00900.2018
39. Honka MJ, Bucci M, Andersson J, Huovinen V, Guzzardi MA, Sandboge S. Resistance training enhances insulin suppression of endogenous glucose production in elderly women. J Appl Physiol. (2016) 120:633–9. doi: 10.1152/japplphysiol.00950.2015
40. Gregory JM, Muldowney JA, Engelhardt BG, Tyree R, Marks-Shulman P, Silver HJ. Aerobic exercise training improves hepatic and muscle insulin sensitivity, but reduces splanchnic glucose uptake in obese humans with type 2 diabetes. Nutr Diabetes. (2019) 9:25–12. doi: 10.1038/s41387-019-0090-0
41. Shojaee-Moradie F, Shojaee-Moradie F, Baynes K, Baynes K, Pentecost C, Pentecost C. Exercise training reduces fatty acid availability and improves the insulin sensitivity of glucose metabolism. Diabetologia. (2007) 50:404–13. doi: 10.1007/s00125-006-0498-7
42. Messier V, Malita FM, Rabasa-Lhoret R, Brochu M, Karelis AD. Association of cardiorespiratory fitness with insulin sensitivity in overweight and obese postmenopausal women: a Montreal Ottawa New Emerging Team study. Metabolism. (2008) 57:1293–8. doi: 10.1016/j.metabol.2008.04.026
43. Solomon TPJ, Malin SK, Karstoft K, Knudsen SH, Haus JM, Laye MJ. Association between cardiorespiratory fitness and the determinants of glycemic control across the entire glucose tolerance continuum. Diabetes Care toukokuuta. (2015) 38:921–9. doi: 10.2337/dc14-2813
44. Jensen T, Abdelmalek MF, Sullivan S, Nadeau KJ, Green M, Roncal C. Fructose and sugar: A major mediator of non-alcoholic fatty liver disease. J Hepatol. (2018) 68:1063–75. doi: 10.1016/j.jhep.2018.01.019
45. Viljanen APM, Iozzo P, Borra R, Kankaanpää M, Karmi A, Lautamäki R. Effect of weight loss on liver free fatty acid uptake and hepatic insulin resistance. J Clin Endocrinol Metab. (2009) 94:50–5. doi: 10.1210/jc.2008-1689
46. Silva Figueiredo P, Carla Inada A, Marcelino G, Maiara Lopes Cardozo C, de Cássia Freitas K, de Cássia Avellaneda Guimarães R. Fatty acids consumption: the role metabolic aspects involved in obesity and its associated disorders. Nutrients. (2017) 9(10):1158. doi: 10.3390/nu9101158
47. Luukkonen PK, Sädevirta S, Zhou Y, Kayser B, Ali A, Ahonen L. Saturated fat is more metabolically harmful for the human liver than unsaturated fat or simple sugars. Diabetes Care. (2018) 41:1732–9. doi: 10.2337/dc18-0071
48. Weickert MO, Pfeiffer AFH. Metabolic effects of dietary fiber consumption and prevention of diabetes. J Nutr. (2008) 138:439–42. doi: 10.1093/jn/138.3.439
49. Liu X, Yang W, Petrick JL, Liao LM, Wang W, He N. Higher intake of whole grains and dietary fiber are associated with lower risk of liver cancer and chronic liver disease mortality. Nat Commun. (2021) 12:6388. doi: 10.1038/s41467-021-26448-9
50. Titchenell PM, Lazar MA, Birnbaum MJ. Unraveling the regulation of hepatic metabolism by insulin. Trends Endocrinol Metab. (2017) 28:497–505. doi: 10.1016/j.tem.2017.03.003
51. Erion DM, Shulman GI. Diacylglycerol-mediated insulin resistance. Nat Med. (2010) 16:400–2. doi: 10.1038/nm0410-400
52. Weiss R, Dufour S, Taksali SE, Tamborlane WV, Petersen KF, Bonadonna RC. Prediabetes in obese youth: a syndrome of impaired glucose tolerance, severe insulin resistance, and altered myocellular and abdominal fat partitioning. Lancet. (2003) 362:951–7. doi: 10.1016/S0140-6736(03)14364-4
53. Borra R, Lautamäki R, Parkkola R, Komu M, Sijens PE, Hällsten K. Inverse association between liver fat content and hepatic glucose uptake in patients with type 2 diabetes mellitus. Metabolism. (2008) 57:1445–51. doi: 10.1016/j.metabol.2008.05.015
54. Carson JAS, Lichtenstein AH, Anderson CAM, Appel LJ, Kris-Etherton PM, Meyer KA. Dietary cholesterol and cardiovascular risk: A science advisory from the American heart association. Circulation. (2020) 141:e39–53. doi: 10.1161/CIR.0000000000000743
55. Dannecker C, Wagner R, Peter A, Hummel J, Vosseler A, Häring HU. Low-density lipoprotein cholesterol is associated with insulin secretion. J Clin Endocrinol Metab. (2021) 106:1576–84. doi: 10.1210/clinem/dgab147
56. Merino J, Rotter JI. LDL cholesterol and dysglycemia: an intriguing physiological relationship. Diabetes. (2020) 69:2058–60. doi: 10.2337/dbi20-0031
57. Sattar N, Preiss D, Murray HM, Welsh P, Buckley BM, de Craen AJM. Statins and risk of incident diabetes: a collaborative meta-analysis of randomised statin trials. Lancet Lond Engl. (2010) 375:735–42. doi: 10.1016/S0140-6736(09)61965-6
Keywords: hepatic insulin sensitivity, hepatic glucose uptake, endogenous glucose production, sedentary behavior, physical activity
Citation: Laine S, Sjöros T, Garthwaite T, Honka M-J, Löyttyniemi E, Eskola O, Saarenhovi M, Kallio P, Koivumäki M, Vähä-Ypyä H, Sievänen H, Vasankari T, Hirvonen J, Laitinen K, Houttu N, Kalliokoski K, Saunavaara V, Knuuti J and Heinonen IHA (2024) Daily standing time, dietary fiber, and intake of unsaturated fatty acids are beneficially associated with hepatic insulin sensitivity in adults with metabolic syndrome. Front. Endocrinol. 15:1272886. doi: 10.3389/fendo.2024.1272886
Received: 04 August 2023; Accepted: 11 June 2024;
Published: 26 June 2024.
Edited by:
Nigel Turner, University of New South Wales, AustraliaReviewed by:
Hayley Maree O’Neill, Bond University, AustraliaCopyright © 2024 Laine, Sjöros, Garthwaite, Honka, Löyttyniemi, Eskola, Saarenhovi, Kallio, Koivumäki, Vähä-Ypyä, Sievänen, Vasankari, Hirvonen, Laitinen, Houttu, Kalliokoski, Saunavaara, Knuuti and Heinonen. This is an open-access article distributed under the terms of the Creative Commons Attribution License (CC BY). The use, distribution or reproduction in other forums is permitted, provided the original author(s) and the copyright owner(s) are credited and that the original publication in this journal is cited, in accordance with accepted academic practice. No use, distribution or reproduction is permitted which does not comply with these terms.
*Correspondence: Saara Laine, c2FhbGFpeUB1dHUuZmk=
Disclaimer: All claims expressed in this article are solely those of the authors and do not necessarily represent those of their affiliated organizations, or those of the publisher, the editors and the reviewers. Any product that may be evaluated in this article or claim that may be made by its manufacturer is not guaranteed or endorsed by the publisher.
Research integrity at Frontiers
Learn more about the work of our research integrity team to safeguard the quality of each article we publish.