
95% of researchers rate our articles as excellent or good
Learn more about the work of our research integrity team to safeguard the quality of each article we publish.
Find out more
ORIGINAL RESEARCH article
Front. Endocrinol. , 14 February 2023
Sec. Obesity
Volume 14 - 2023 | https://doi.org/10.3389/fendo.2023.985338
This article is part of the Research Topic Nutritional Approaches to the Treatment of Obesity View all 4 articles
Background: The association between iron status and obesity-related traits is well established by observational studies, but the causality is uncertain. In this study, we performed a two-sample bidirectional Mendelian randomization analysis to investigate the causal link between iron status and obesity-related traits.
Methods: The genetic instruments strongly associated with body mass index (BMI), waist-hip ratio (WHR), serum ferritin, serum iron, transferrin saturation (TSAT), and total iron-binding capacity (TIBC) were obtained through a series of screening processes from summary data of genome-wide association studies (GWAS) of European individuals. We used numerous MR analytical methods, such as inverse-variance weighting (IVW), MR-Egger, weighted median, and maximum likelihood to make the conclusions more robust and credible, and alternate methods, including the MR-Egger intercept test, Cochran’s Q test, and leave-one-out analysis to evaluate the horizontal pleiotropy and heterogeneities. In addition, the MR-PRESSO and RadialMR methods were utilized to identify and remove outliers, eventually achieving reduced heterogeneity and horizontal pleiotropy.
Results: The results of IVW analysis indicated that genetically predicted BMI was associated with increased levels of serum ferritin (β: 0.077, 95% CI: 0.038, 0.116, P=1.18E-04) and decreased levels of serum iron (β: -0.066, 95% CI: -0.106, -0.026, P=0.001) and TSAT (β: -0.080, 95% CI: -0.124, -0.037, P=3.08E-04), but not associated with the levels of TIBC. However, the genetically predicted WHR was not associated with iron status. Genetically predicted iron status were not associated with BMI and WHR.
Conclusions: In European individuals, BMI may be the causative factor of serum ferritin, serum iron, and TSAT, but the iron status does not cause changes in BMI or WHR.
Obesity and iron deficiency (ID) are the most common nutritional diseases worldwide and have attracted great interest currently (1). Over the decades, the prevalence of obesity has substantially increased and reached pandemic levels (2), and ID anemia has become one of the leading causes of years lived with disability (3). The high prevalence of obesity and ID can lead to substantial health and economic burdens (4, 5).
As a nutritionally essential trace element, iron can affect the physical performance in hematopoiesis, transport oxygen, and various metabolic pathways (6). Given that, accumulating evidence has suggested the correlation between iron status and obesity since 1962 (7). Observational studies have found that obesity can predict lower iron absorption and affect iron metabolism, and body fat distribution (central obesity) is more likely to cause abnormal iron metabolism in women (8, 9). Additionally, previous studies suggested that inflammatory response characterized by obesity is involved in the regulation of iron metabolism (10, 11). A cross-sectional study found that serum ferritin was positively associated with lipid metabolism and abdominal obesity (12). Some studies have shown that iron homeostasis plays a crucial role in lipid accumulation and is a manifestation of obesity (13). Recently, studies indicated that the association between obesity and iron metabolism is reciprocal (14). Although observational evidence has recognized the association between obesity and iron status, it is difficult to assess the causal association.
The causal estimate of a modifiable phenotype or exposure to a disease is often of public health interest, but it is difficult or impractical to investigate the causality through randomized controlled trials (RCT). Mendelian randomization (MR) is an analytic approach using genetic variants as instrumental variables (IVs) for exposure, which can reduce the influence of confounders due to the premise that genotype only indirectly affects the disease state and is allocated during meiosis (15). It can provide a novel way to assess the causal association between potential factors and disease and solve existing reverse causation or confounding factors in observational epidemiology (16). To obtain causal estimates, MR analysis needs to fulfill the following three key assumptions: (1) genetic variants associated with the phenotype or exposure; (2) genetic variants have no association with confounding factors, and (3) genetic variants have no association with the disease or outcome except through the exposure (17). Thus, this method could provide new opportunities to elucidate the causal relationship between iron status and obesity-related traits.
In this study, we used body mass index (BMI) and waist and hip ratio (WHR) as obesity-related traits and four iron-related biomarkers for clinical evaluation of iron status to explore the causal relationship between iron status and obesity-related traits in European individual. We aimed to use the bidirectional MR analysis to supplement the findings of observational studies on whether iron status has an effect on obesity and vice versa.
This study described the bidirectional causality assessment of the relationships between iron status and obesity-related traits. Genetic instruments are required for both iron status-related biomarkers and obesity-related traits, and MR analysis was performed in both directions. The data of the instrumental variable are publicly available from the summary statistics among European populations, and no ethical approval was required. The overall design of our study is shown in Figure 1.
We obtained the genetic instruments based on the latest genome-wide association study (GWAS) data on iron status, which performed a meta-analysis combining GWAS results from Iceland (deCODE genetics), United Kingdom (INTERVAL study) and Denmark (Danish Blood Donor Study) for four iron-related biomarkers: serum ferritin (up to N=246,139 individuals), serum iron (up to N=163,511 individuals), TIBC (up to N=135,430 individuals), and TSAT (up to N=131,471 individuals) (18). For the iron status, serum ferritin reflects stored iron, serum iron reflects circulating iron, and transferrin saturation reflects iron availability, which is derived as serum iron divided by the total iron-binding capacity (TIBC) from Genetics of Iron Status (GIS), and the TIBC as measured directly.
Genetic instruments with obesity-related traits were obtained from the Genetic Investigation of Anthropometric Traits (GIANT) Consortium. The BMI data were derived from a two-stage meta-analysis of 322,154 individuals of European descent (19), and WHR data were obtained from a meta-analysis of GWAS in 212,244 European individuals (20). Supplementary Table 1 summarizes the data sources used in this study.
Genetic variants were extracted from each published GWAS at the genome-wide significance level (P<5×10⁻⁸) for each exposure. To ensure that each single nucleotide polymorphism (SNP) was independent of the other, we assessed the linkage disequilibrium (LD) between the SNPs, satisfying the criteria of r2 = 0.001 and kb=5,000. If an exposure-associated index SNP was absent from the outcome data set, a proxy SNP was not used. In addition, we performed variant harmonization of the genetic variants by combining two or more independently generated data. It is necessary to ensure that genetic variants from all publicly available datasets are consistent and allele mismatches are avoided, which can lead to bias in the causal effect estimate (21). Palindromic and ambiguous SNPs were removed from the analysis. The R2 and F values for each trait were calculated based on the derived summary statistics (Supplementary Tables 2-7). The F statistic can reflect the strength of instrumental variants (IVs), and a threshold of F < 10 has been used to define a weak IV, which is well-accepted in the field. Thus, we screened the F statistic of IVs > 10 in our analysis, ensuring that the relative bias in effect estimations caused by weak IVs was < 10% (22). This was calculated using the following formula:
R2, which is as an indicator of power for MR studies, is defined as the proportion of variability in the exposure explained by genetic variants; k is the number of instruments used in the model; and n is the sample size.
In this study, we consider several methods, including Inverse variance weighted (IVW), MR-Egger regression, weighted median, and maximum likelihood, to weigh the estimated impact between exposure and outcome (23). The IVW was used as the most common method to assess the MR estimates for the causal effect under the assumption of balanced pleiotropy (24). The multiplicative random-effects model IVW was used as the primary analysis to avoid heterogeneity bias (25). Meanwhile, other MR methods have also been used to provide more accurate estimates, one of which is the MR-Egger regression, which differs from the IVW method by allowing a non-zero intercept. Additionally, the intercept term can be used to predict the directional pleiotropic effects (26). The weighted median estimator method was consistent even if 50% of the genetic variants were invalid (27). The maximum likelihood method estimates the probability distribution parameters by maximizing the likelihood function, and the bias is small (28). Indeed, these methods have relatively low statistical power compared to the IVW method, which was mainly designed to confirm consistent effects estimates seen in the main IVW estimate to determine the reliability of the results.
After the causal effect was detected using the above methods, we performed sensitivity analyses to assess the robustness of these findings to the assumption of balanced pleiotropy, including heterogeneity and the pleiotropy effect. Cochran’s Q was used in our study to identify heterogeneity in MR analysis (29). Additionally, we focused on methods that can test the bias from the horizontal pleiotropic effect. The MR-Egger intercept represents the average pleiotropic effect across genetic variants. If the intercept differs from zero (MR-Egger test), there is directional pleiotropy evidence (30). Then, the MR pleiotropy residual sum and outlier (MR-PRESSO) test removed the variant in question and refused IVW regression to identify horizontal pleiotropic outliers in the MR context (31). To improve the visualization of the IVW, we performed radial variants of the IVW instead of a scatter plot. The RadialMR imaging was used to complete the automated detection of outliers (32). The leave-one-out analysis was performed to assess whether the potentially pleiotropic SNPs affected causal estimates. In addition, we used MR Steiger to infer the direction of causality in our hypothesis. The threshold of the P-value was < 0.05, which is likely to be correct about the causal direction (33).
The TwoSampleMR package (34) and the RadialMR package (32) were used to perform the analysis in R (version 4.0.3). A P < 0.05 was defined as a threshold for statistical significance. The Bonferroni correction redefined the threshold for statistical significance in multiple testing (P < 0.05/n), where n refers to the number of MR tests (35). The adjusted P-values were 0.025 (0.05/2) for the forward MR analysis and 0.0125 (0.05/4) for the reverse MR analysis.
In this study, the four biomarkers of iron status constituted the exposure and obesity-related traits were set as the outcomes. A total of 23 SNPs of serum ferritin, 6 SNPs of serum iron, 8 SNPs of TIBC, and 6 SNPs of TSAT remained (Supplementary Tables 2-7) after filtering and variant harmonization. The F statistics for the four biomarkers of iron status ranged from 10 to 86. The detailed MR estimates from different methods of assessing the causal effect are available in Supplementary Tables 8-13, which are presented as forest plots (Figures 2, 3).
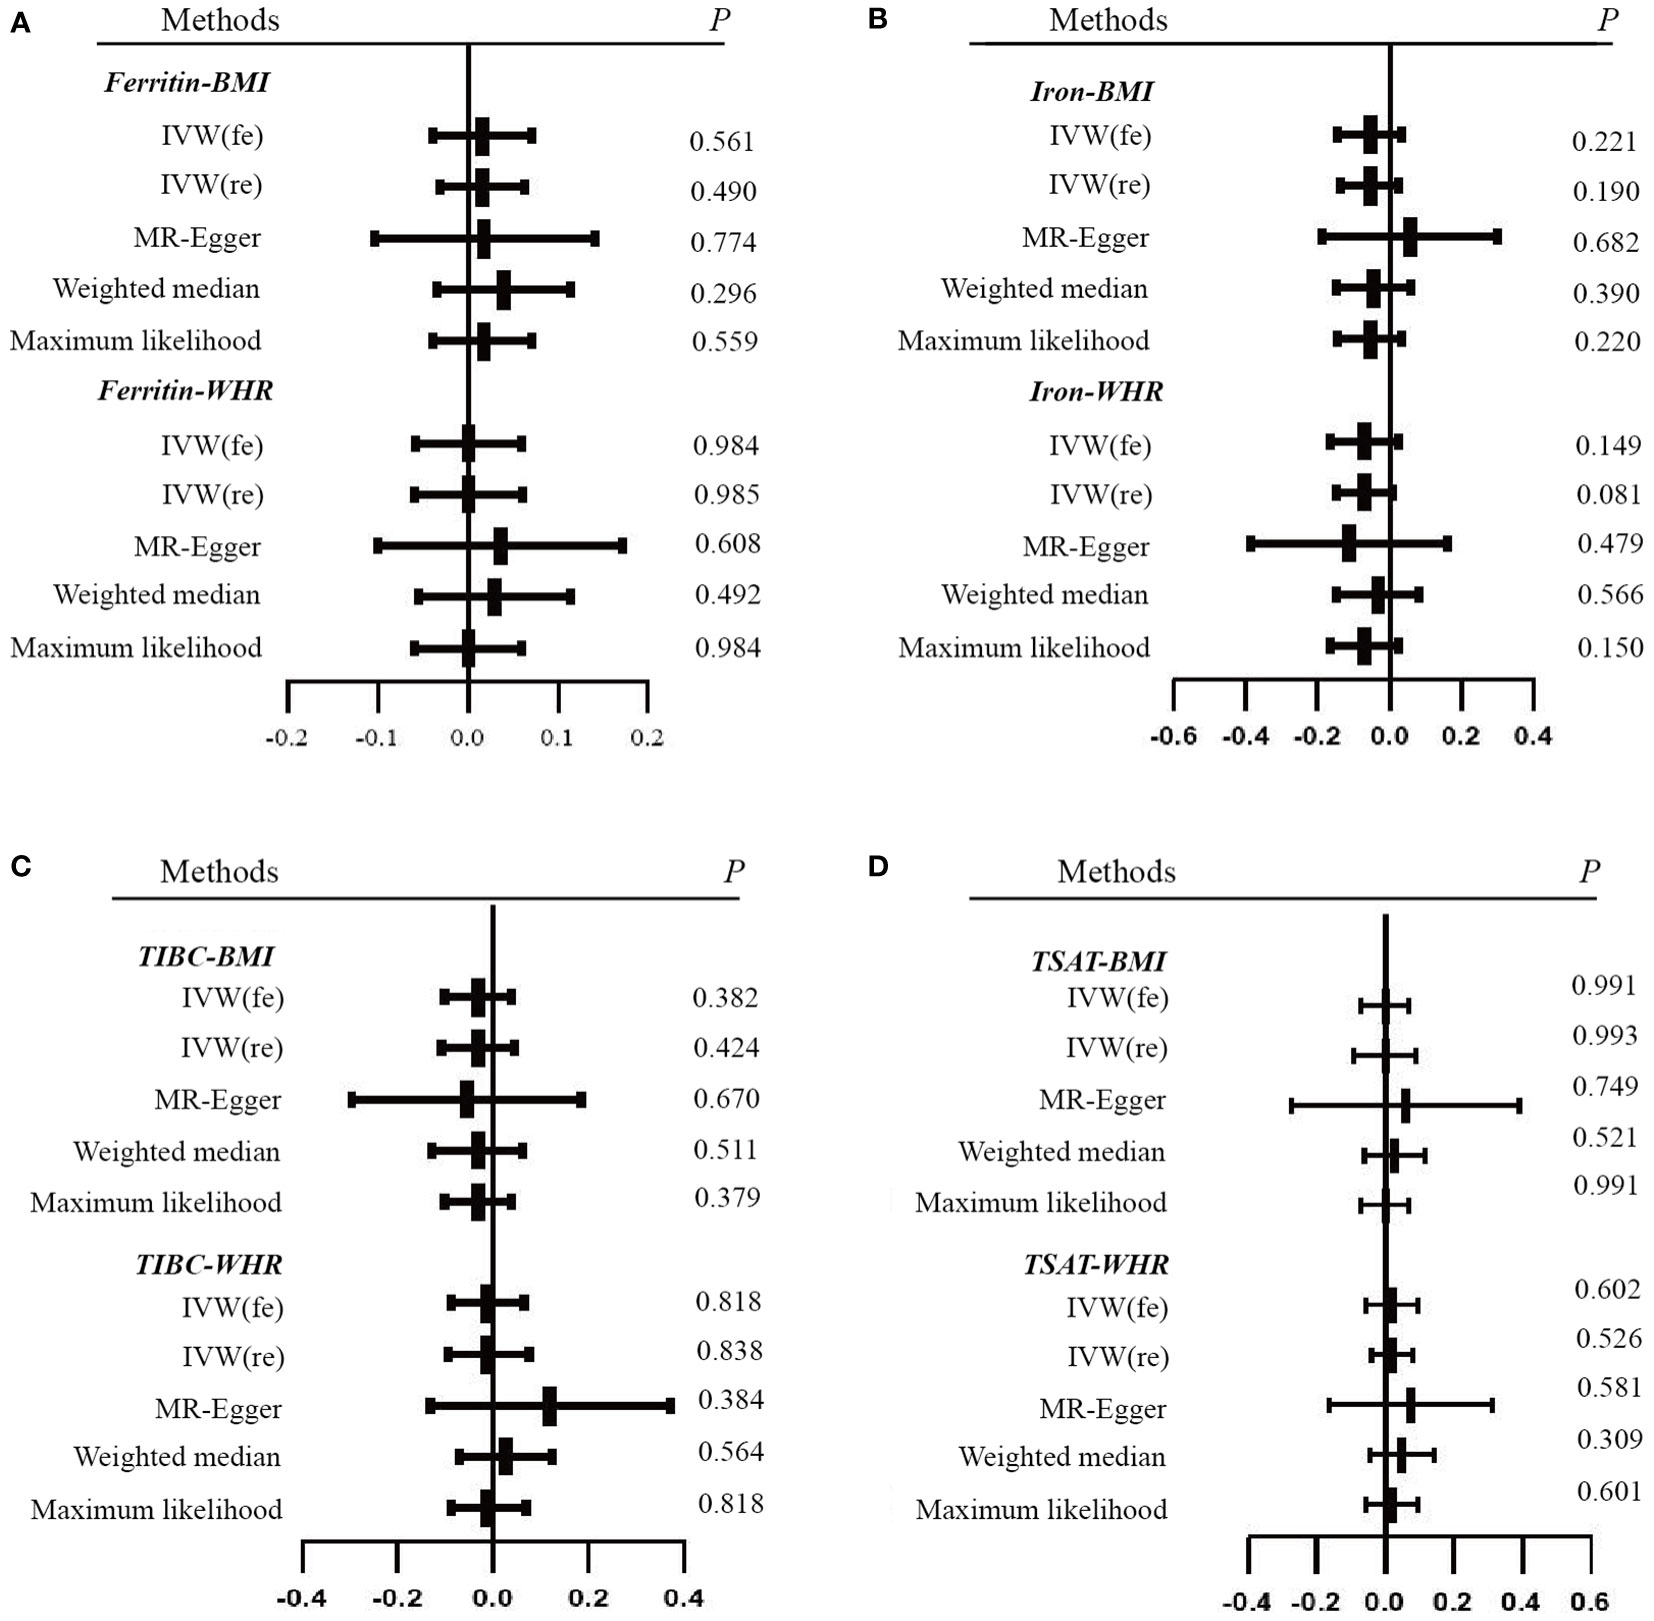
Figure 2 Forest plots of Mendelian randomization analyses of the association between genetically predicted iron status and obesity-related traits. (A) serum ferritin – BMI and WHR; (B) serum iron – BMI and WHR; (C) TIBC – BMI and WHR; (D) TSAT - BMI and WHR. Data are expressed as raw β with 95% CI. IVW, inverse variance–weighted method; fe, fixed effects model; re, multiplicative random effects model; BMI, body mass index; WHR, waist-hip ratio; TIBC, total iron-binding capacity; TSAT, transferrin saturation.
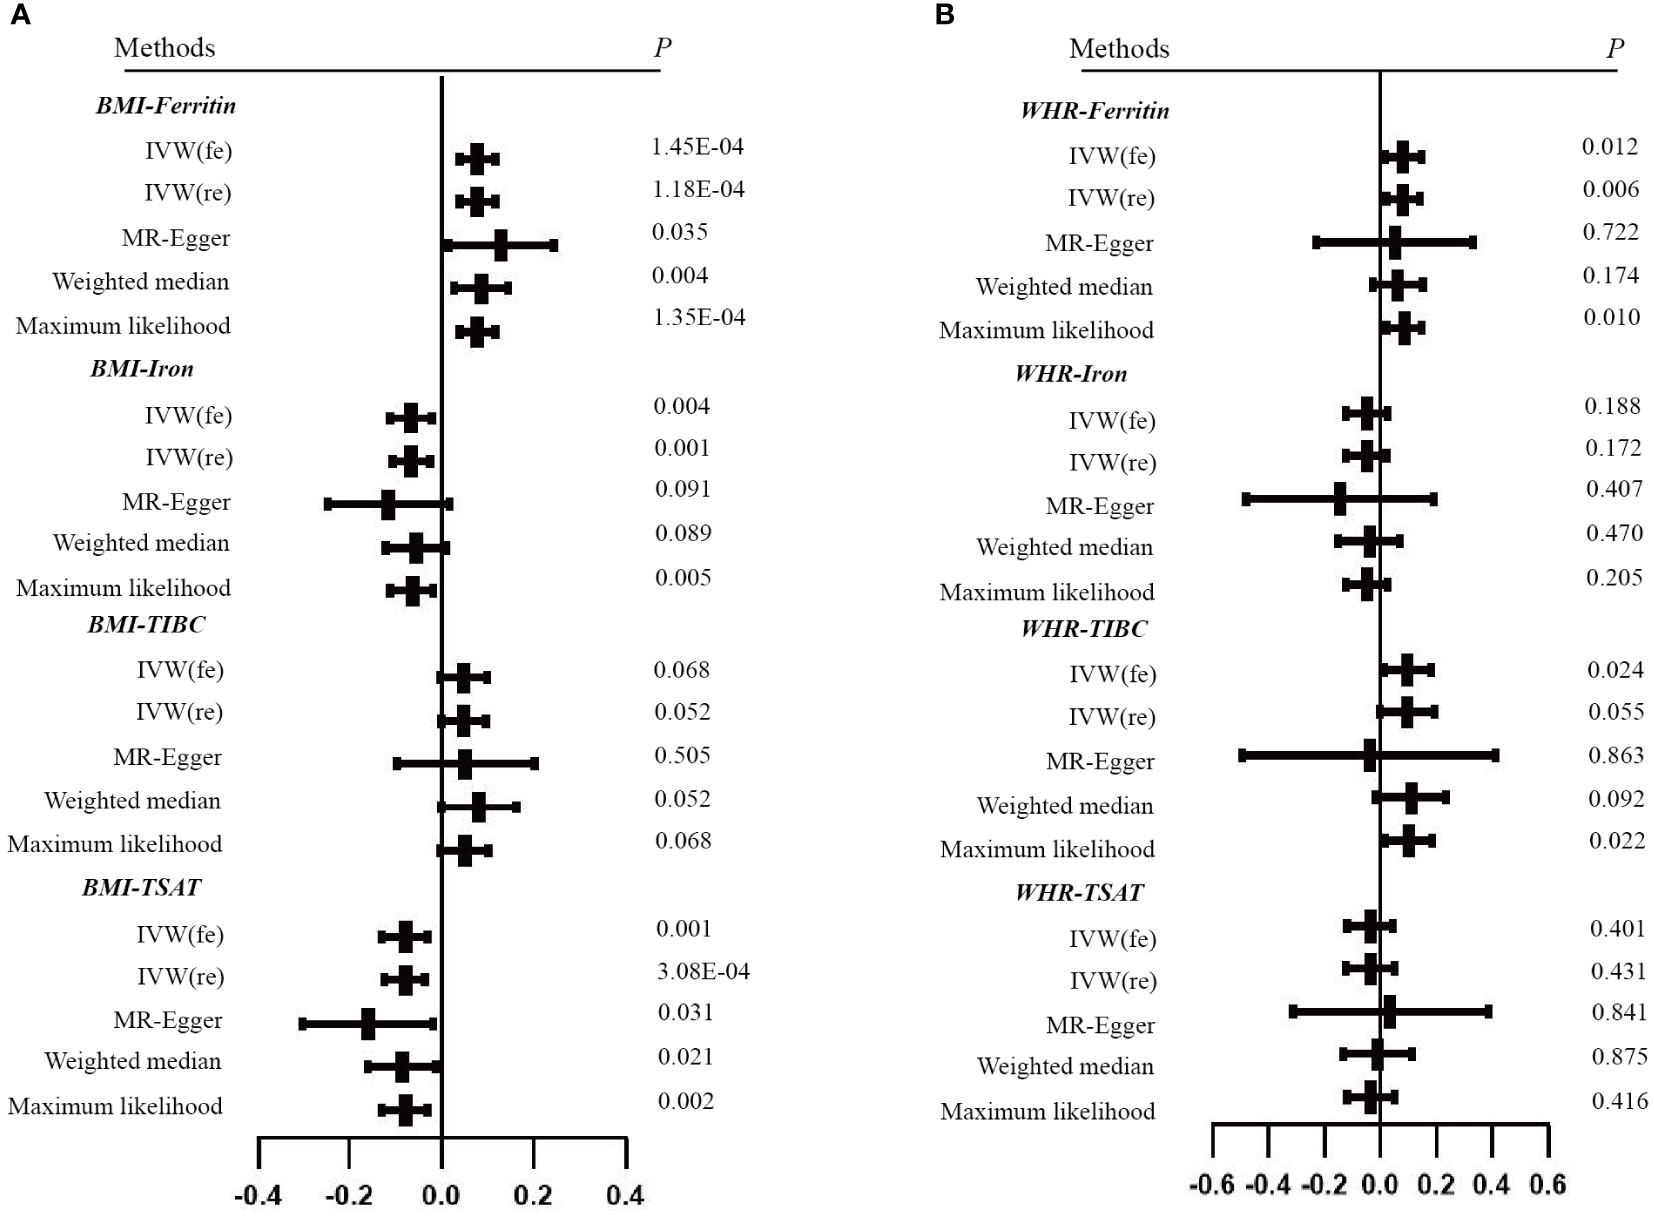
Figure 3 Forest plots of Mendelian randomization analyses of the association between genetically predicted iron status and obesity-related traits. (A) BMI - serum ferritin, serum iron, TIBC and TSAT; (B) WHR - serum ferritin, serum iron, TIBC and TSAT. Data are expressed as raw β with 95% CI.
With the IVW method as the primary analysis, there was no association between the genetically predicted iron status biomarkers and the risk of obesity, including serum ferritin for BMI (β = 0.016, 95% CI: -0.030, 0.063, P = 0.490) and WHR (β = 0.001, 95% CI: -0.060, 0.061, P = 0.985); serum iron for BMI (β = -0.055, 95% CI: -0.137, 0.027, P = 0.190) and WHR (β = -0.070, 95% CI: -0.148, 0.009, P = 0.081); TIBC for BMI (β = -0.031, 95% CI: -0.107, 0.045, P = 0.424) and WHR (β = -0.009, 95% CI: -0.094, 0.077, P = 0.838); TSAT for BMI (β = 0, 95% CI: -0.091, 0.091, P = 0.993) and WHR (β = 0.020, 95% CI: -0.041, 0.081, P = 0.526). The MR Egger, weighted median, and maximum likelihood had the same effects as the IVW estimates. Moreover, the sensitivity analyses suggested no evidence of pleiotropy or heterogeneity (Table 1 and Supplementary Tables 8-11). The MR-PRESSO and RadialMR outliers were removed to obtain the robust results (Supplementary Tables 2-5 and Supplementary Figure 1). The result of the leave-one-out plot indicated that excluding any single SNP of the genetic variants hardly biased the outcome (Supplementary Figure 3). The results of the MR Steiger directionality test illustrated the accuracy of our estimate of causal direction (Supplemental Tables 2-5).
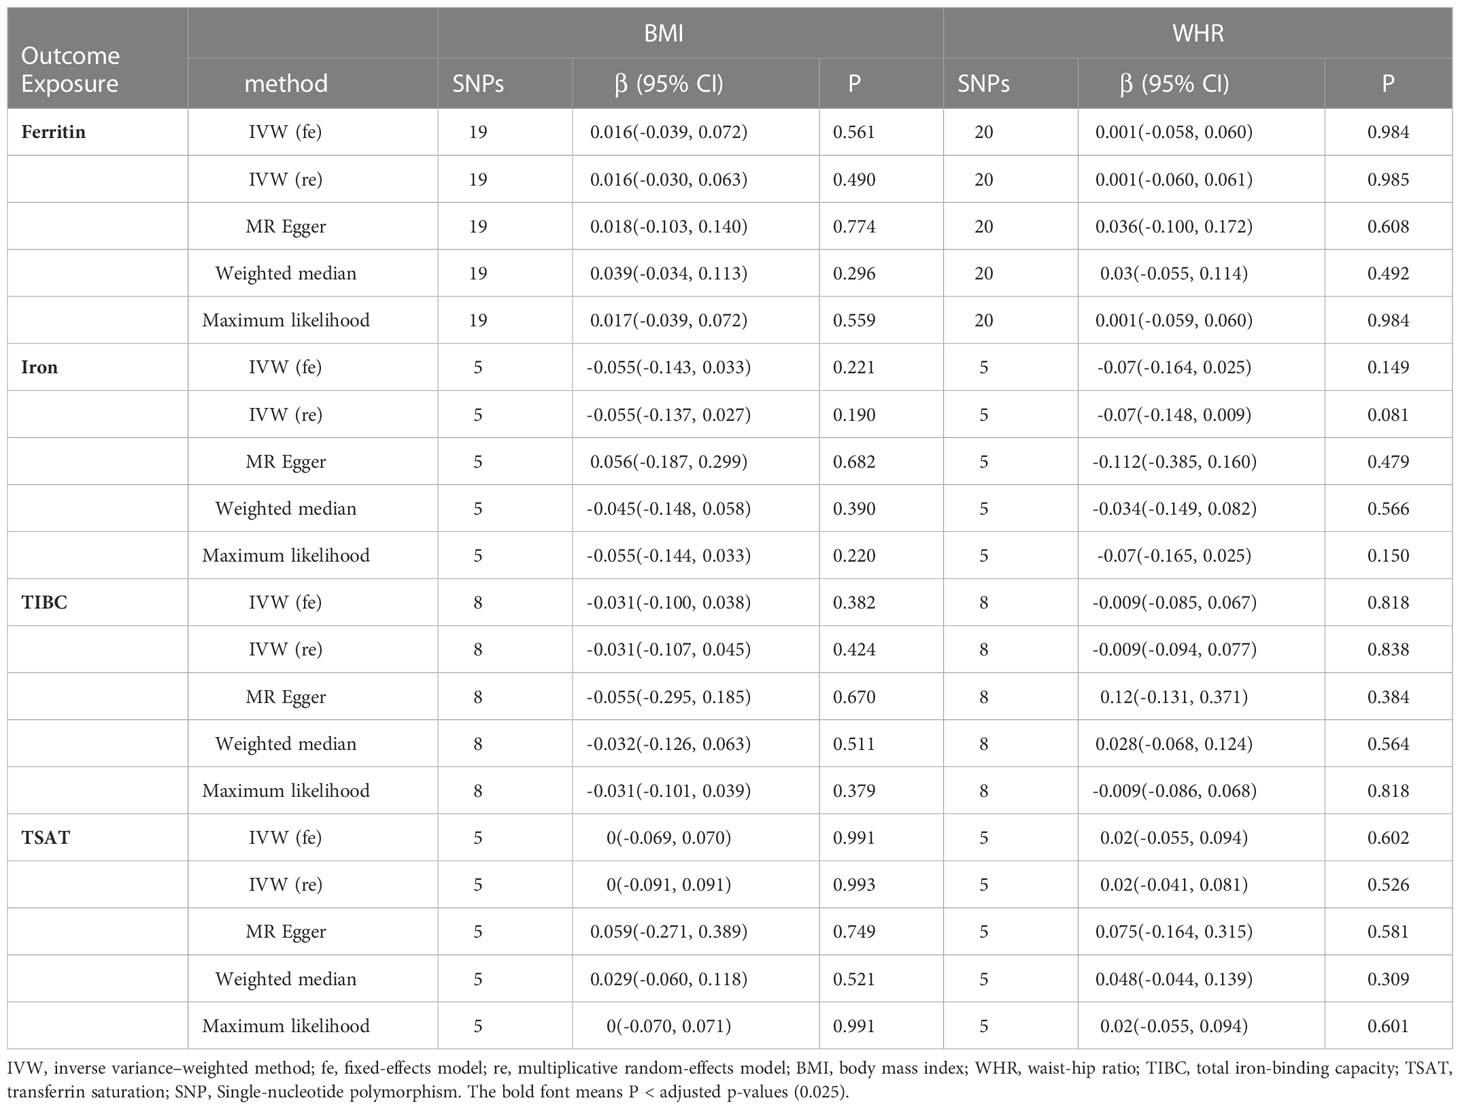
Table 1 MR results of the causal estimates of genetically predicted iron status on obesity-related traits.
For the reverse MR, the obesity-related traits constituted the exposure and the biomarkers of iron status were the outcomes. We screened 58 and 24 SNPs associated with BMI and WHR (Supplementary Tables 6-7). The F statistics for the obesity-related traits ranged from 10 to 97. The primary analysis revealed that obesity-related traits and iron status had a significant causal association after excluding the outlier SNPs. Specifically, the BMI for serum ferritin is β = 0.077, 95% CI: 0.038,0.116, P = 1.18E-04; for serum iron β = -0.066, 95% CI: -0.106, -0.026, P = 0.001 and for TSAT β = -0.080, 95% CI: -0.124, -0.037, P = 3.08E-04. However, we found that genetically predicted BMI was not associated with TIBC. The robustness of these results has been validated with additional methods (Table 2 and Supplementary Table 12). Cochran’s Q and MR Egger intercept tests showed no evidence of instrumental heterogeneity and horizontal pleiotropy for serum ferritin, serum iron and TSAT (P > 0.05). Leave-one-out analysis indicated that the causality was not driven by any SNP (Supplemental Figure 4).
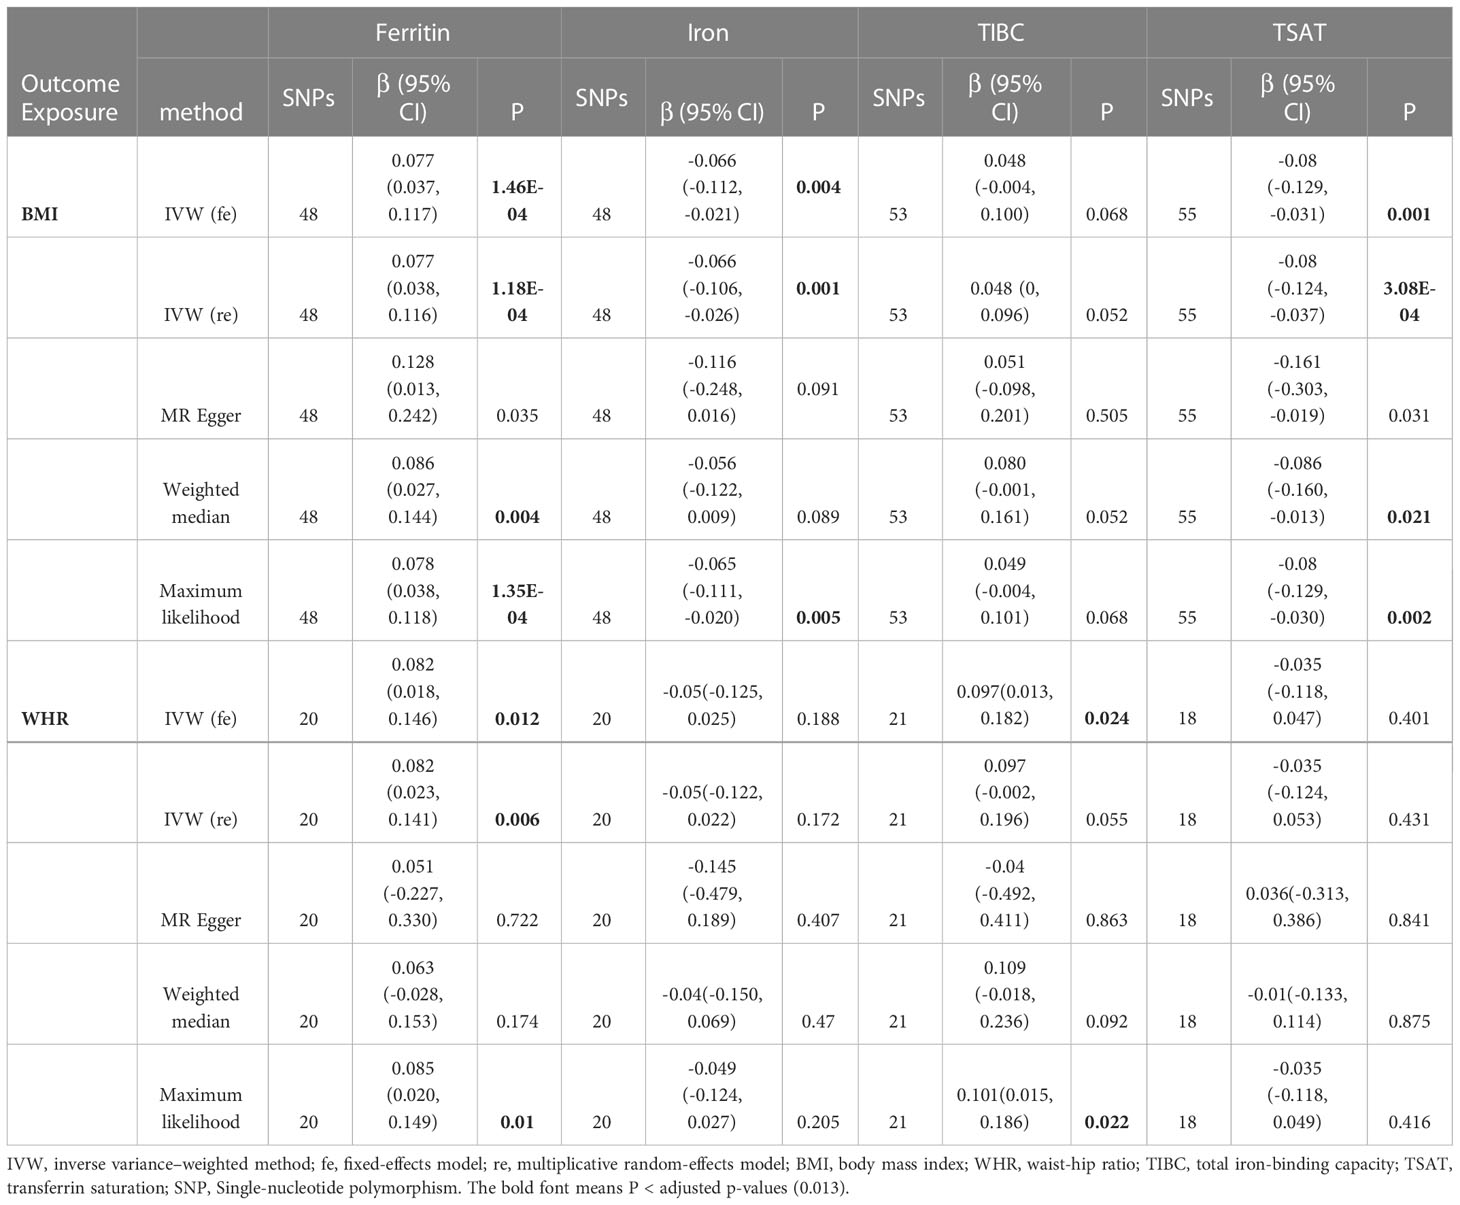
Table 2 MR results of the causal estimates of genetically predicted obesity-related traits on iron status.
In addition, WHR was associated with the serum ferritin levels (β = 0.082, 95%CI: 0.023, 0.141, P = 0.006). However, MR Egger and weighted median did not provide consistent results (Table 2 and Supplemental Tables 13). The results of the MR Steiger directionality test illustrated the accuracy of the causal direction of the current MR analysis. The forest plots and scatter plots of MR analysis were used to present the data (Figures 2–5).
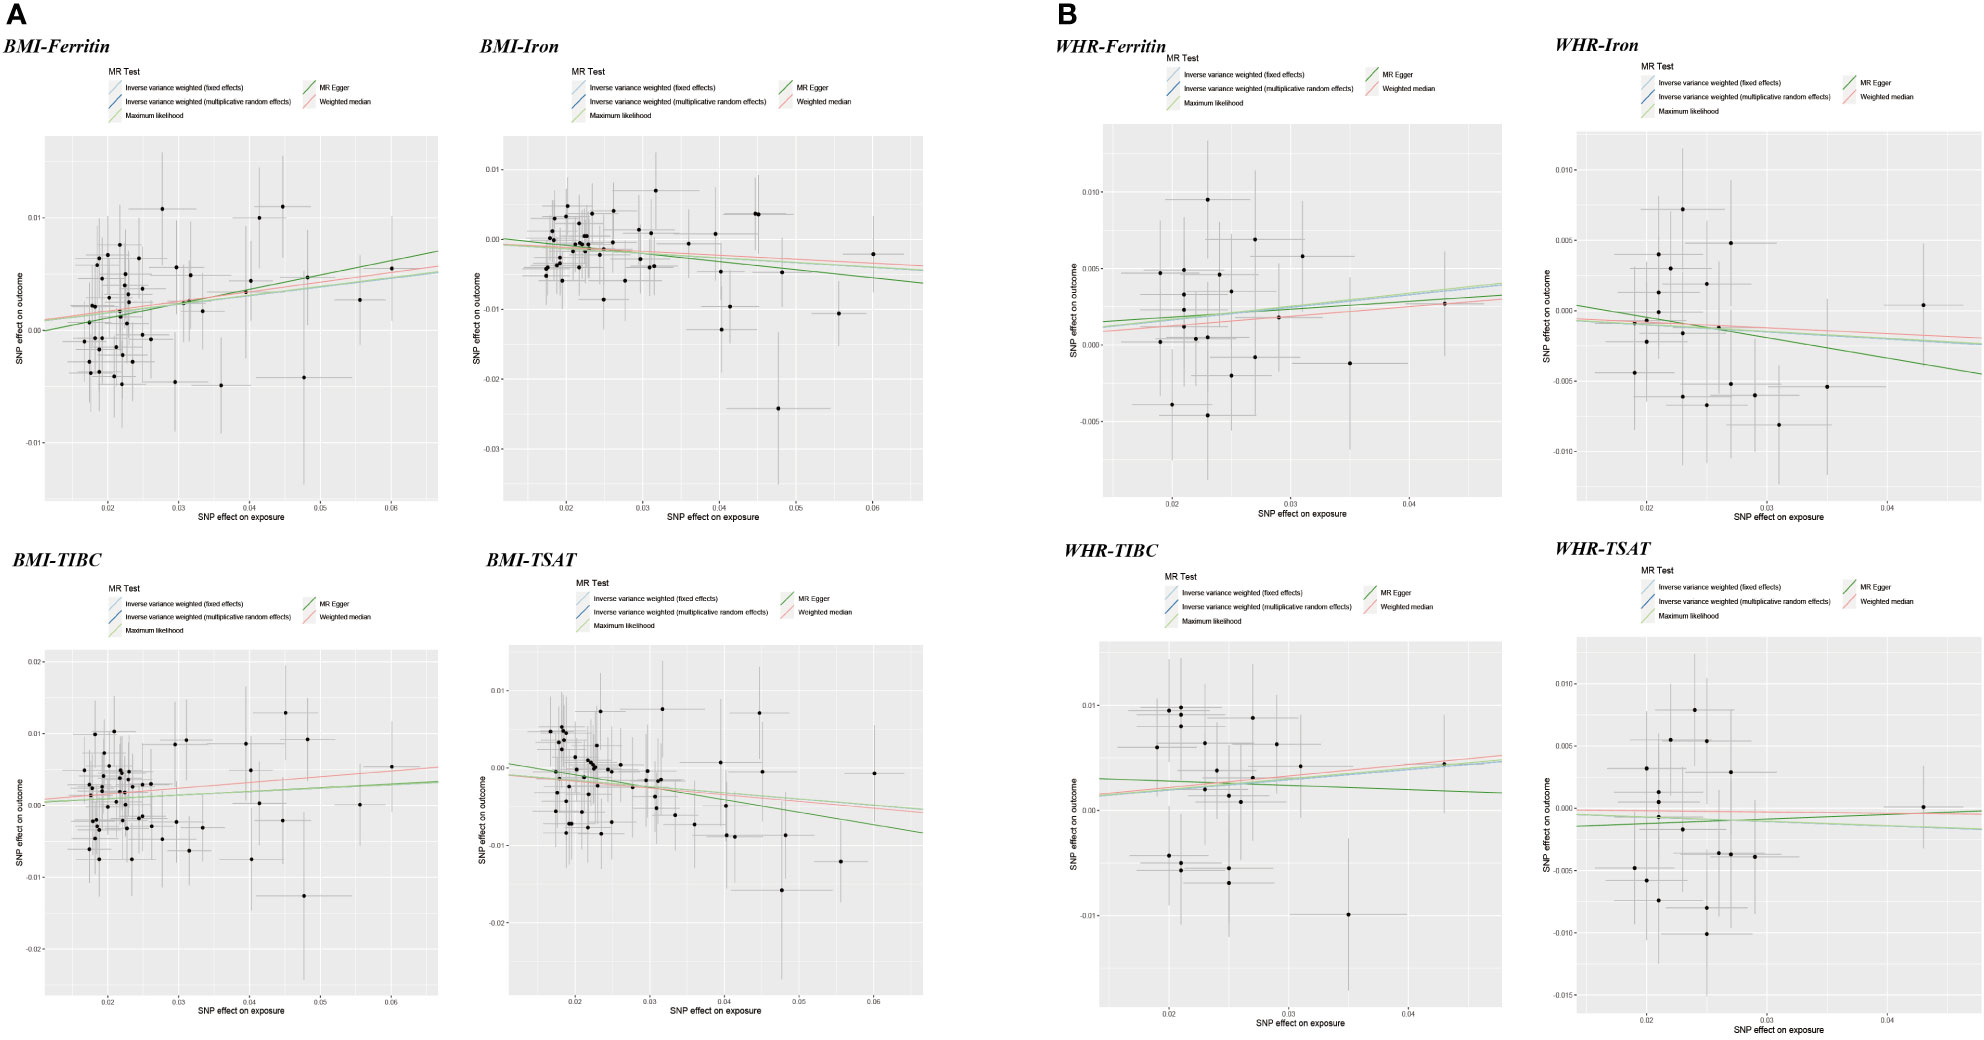
Figure 4 Scatter plots of Mendelian randomization analyses of the association between genetically predicted obesity-related traits and iron status. (A) BMI - serum ferritin, serum iron, TIBC and TSAT; (B) WHR - serum ferritin, serum iron, TIBC and TSAT.
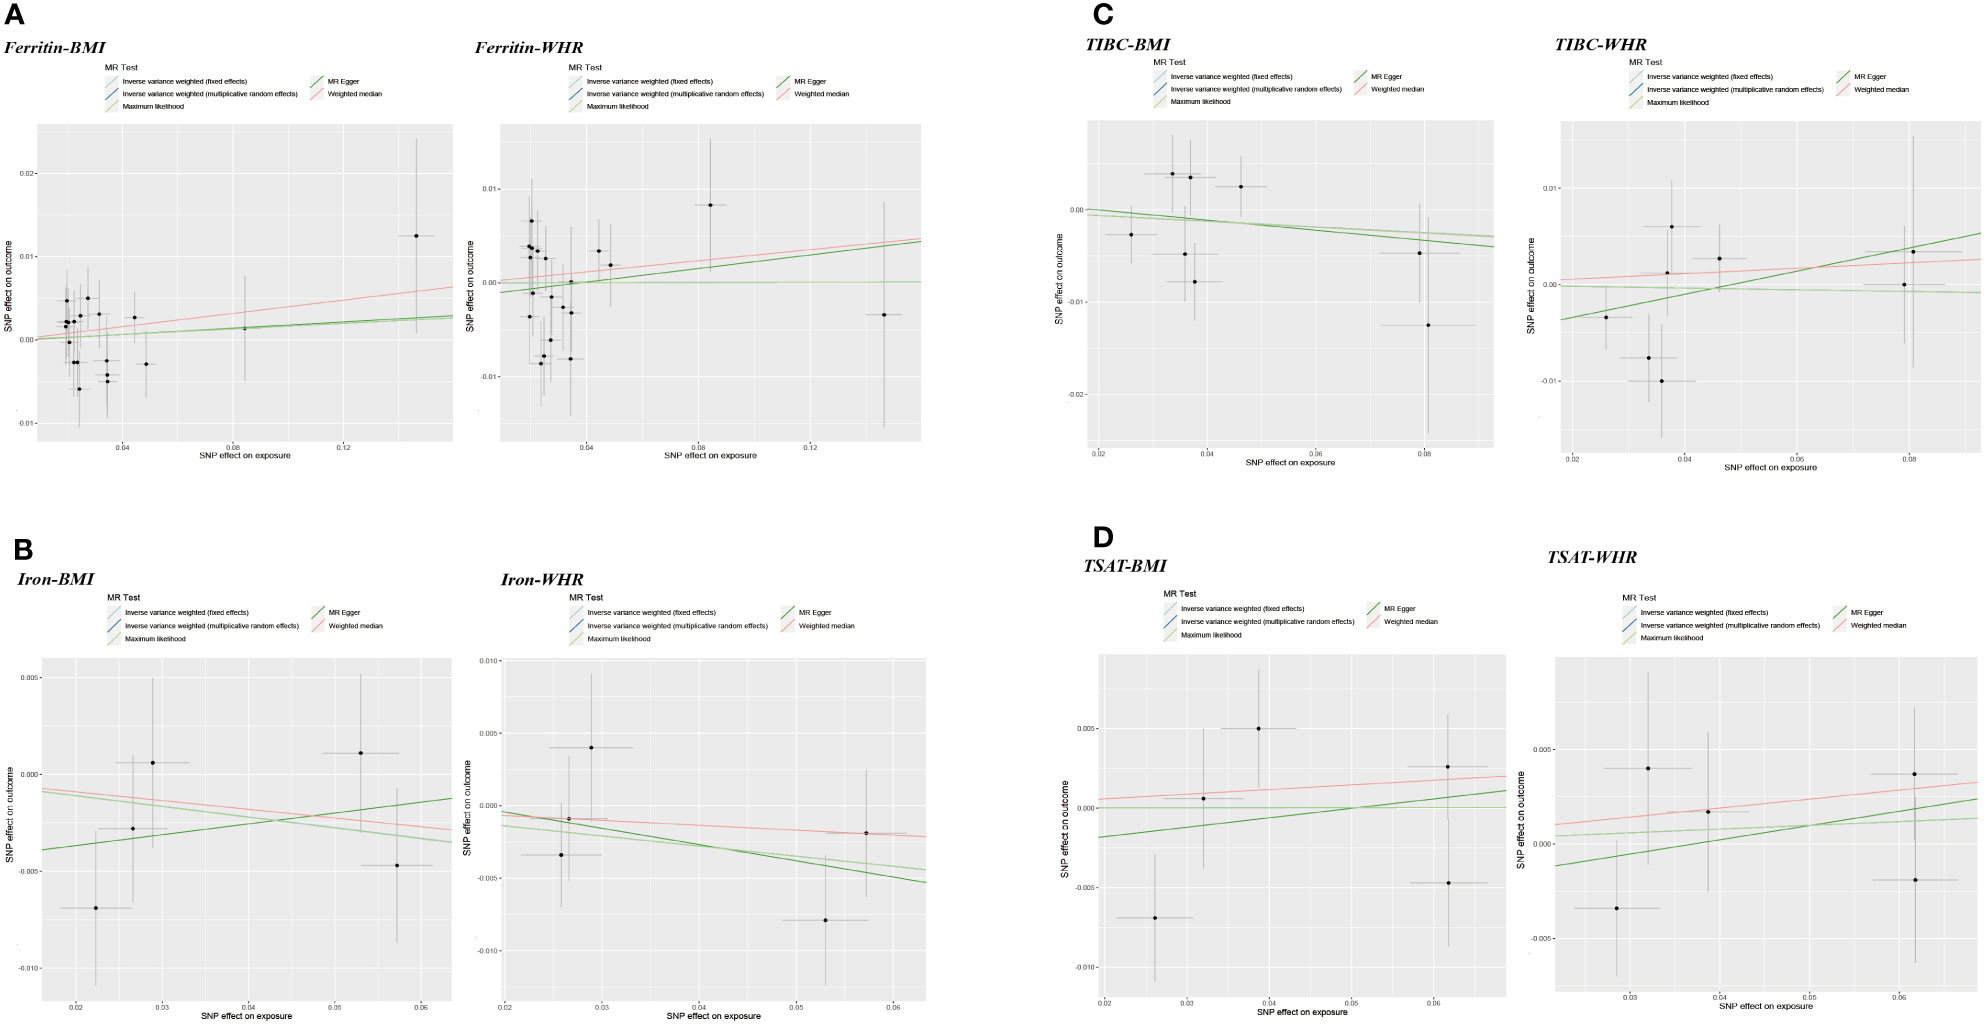
Figure 5 Scatter plots of Mendelian randomization analyses of the association between genetically predicted iron status and obesity-related traits. (A) serum ferritin – BMI and WHR; (B) serum iron – BMI and WHR; (C) TIBC – BMI and WHR; (D) TSAT - BMI and WHR.
In this two-sample bidirectional MR study, we used the summary GWAS data from the European population to investigate the causal association between iron status and obesity-related traits. Our findings showed that genetically predicted iron status biomarkers were not associated with a higher risk of obesity. For the reverse analysis, genetically predicted BMI was associated with decreased serum iron and TSAT levels and increased serum ferritin levels. Moreover, the inference of causality between WHR and serum ferritin levels cannot be confirmed using additional methods, suggesting that the evidence is insufficient and conclusion should be drawn carefully. To the best of our knowledge, this is the first study on causality between iron status and obesity-related traits using MR approach. The stability of our results lies in the following: We identified and removed the outliers using multiple methods and obtained a stable positive result. In addition, the same results can be obtained using various MR methods, which can increase the stability of the results.
A previous study indicated that iron content in the adipose tissue of obese patients appears to be increased (36). A cross-sectional study showed a high burden of obesity in women of reproductive age with iron deficiency anemia (IDA) (37). In addition, animal studies revealed that dietary iron deficiency could modulate diet-induced weight gain in mice (38). However, numerous other factors contribute to obesity, including total energy intake. Thus, the previous observational studies might influence by unmeasured confounders. Our findings suggest no causal association between iron status biomarkers and the risk of obesity. Further investigation is still needed into the effect of iron status on obesity and the potential mechanism.
We found evidence that BMI was associated with decreased serum iron and TSAT levels and increased serum ferritin levels. Our results are in line with previous clinical studies that the serum iron reserves in obese participants are consistently higher, and the decrease in BMI improves the iron state and absorption by reducing hepcidin levels (39, 40). In addition, epidemiological studies showed that BMI was negatively associated with iron, TIBC, and TSAT levels and positively associated with serum ferritin levels (41, 42). Potential mechanism might be proposed to explain this association. The association between BMI and iron status could be attributed to inflammation and hepcidin. In the set of ongoing inflammation, the serum ferritin levels increase while the serum iron levels decrease, which impacts iron homeostasis (43). Some researchers suggest that hepcidin may involve in mediating the pathways between inflammation and iron status (44). Hepcidin is regarded as a central regulatory peptide of intestinal iron absorption and iron recycling and is regulated by interleukin-6 (IL-6) secreted by adipose tissues (45). Therefore, we speculated that obesity might reduce iron absorption and storage by mediating inflammation and decreasing hepcidin levels. In addition, Failla et al. observed lower concentrations of iron in obese mice, which may be due to an adaptive response to expanded blood volume (46). Our results provide a theoretical basis for further research on lowering BMI to the prevention of abnormal iron metabolism. Further studies should provide insights into the pathogenesis of BMI in ID.
In addition, the causal estimate of WHR and serum ferritin did not yield stable results in our analysis. Studies on the impact of WHR on the iron status are still limited. Waist circumference, as the main indicator of concentric obesity, is suggested to be positively but insignificantly associated with plasma iron, TSAT, and ferritin concentrations (47). The potential mechanism may be that the massive release of leptin from the adipose tissue causes increased hepcidin release, resulting in iron depletion or low circulating iron concentrations (47). Nevertheless, more studies are needed to confirm this result.
The main strength of our study is the use of inborn genetic instruments to proxy the exposure trait, which could be less influenced by confounding or reverse causation. However, our study has several limitations. First, the data of genetic variants relied primarily on the GWAS of iron status and obesity-related traits from European descent, which may limit our finding from being fully representative of the whole population. However, restricting participants’ descent can minimize the risk of confounding by population admixture. Second, the use of summary-level data limits the range of analyses that can be performed, including the nonlinear relationship between exposure and outcomes and the stratified analysis of either age or sex. Last, we are not able to estimate the degree of overlap of participants between the datasets in the current study. However, the genetic instrument used in the current study was judged by F-statistics, with a strong instrument defined as an F > 10, which could minimize the bias from sample overlap (48).
In summary, we found that the genetically predicted BMI may contribute to the decreased serum ferritin levels and increased serum iron and TSAT levels. However, there was no evidence to support the causality of iron status on the risk of obesity. This may help inform clinicians that early intervention to improve iron status should involve appropriate weight control, which may be an effective measure and potential strategy.
The original contributions presented in the study are included in the article/Supplementary Material. Further inquiries can be directed to the corresponding author.
ZZ, HZ conceived and designed the study. ZZ, HZ, KC, and CL performed experiments and wrote the manuscript. ZZ interpreted the data and prepared the manuscript. All authors read and approved the final manuscript.
We thank the investigators for providing the data for this study.
The authors declare that the research was conducted in the absence of any commercial or financial relationships that could be construed as a potential conflict of interest.
All claims expressed in this article are solely those of the authors and do not necessarily represent those of their affiliated organizations, or those of the publisher, the editors and the reviewers. Any product that may be evaluated in this article, or claim that may be made by its manufacturer, is not guaranteed or endorsed by the publisher.
The Supplementary Material for this article can be found online at: https://www.frontiersin.org/articles/10.3389/fendo.2023.985338/full#supplementary-material
1. Afshin A, Forouzanfar MH, Reitsma MB, Sur P, Estep K, Lee A, et al. Health effects of overweight and obesity in 195 countries over 25 years. New Engl J Med (2017) 377(1):13–27. doi: 10.1056/NEJMoa1614362
2. Blüher M. Obesity: Global epidemiology and pathogenesis. Nat Rev Endocrinol (2019) 15(5):288–98. doi: 10.1038/s41574-019-0176-8
3. Disease GBD, Injury I, Prevalence C. Global, regional, and national incidence, prevalence, and years lived with disability for 328 diseases and injuries for 195 countries, 1990-2016: A systematic analysis for the global burden of disease study 2016. Lancet (2017) 390(10100):1211–59. doi: 10.1016/S0140-6736(17)32154-2
4. Zimmermann MB, Hurrell RF. Nutritional iron deficiency. Lancet (2007) 370(9586):511–20. doi: 10.1016/s0140-6736(07)61235-5
5. Dai H, Alsalhe TA, Chalghaf N, Riccò M, Bragazzi NL, Wu J. The global burden of disease attributable to high body mass index in 195 countries and territories, 1990-2017: An analysis of the global burden of disease study. PLoS Med (2020) 17(7):e1003198–e. doi: 10.1371/journal.pmed.1003198
6. McClung JP. Iron, zinc, and physical performance. Biol Trace Element Res (2019) 188(1):135–9. doi: 10.1007/s12011-018-1479-7
7. Wenzel BJ, Stults HB, Mayer J. Hypoferraemia in obese adolescents. Lancet (1962) 2(7251):327–8. doi: 10.1016/s0140-6736(62)90110-1
8. Stoffel NU, El-Mallah C, Herter-Aeberli I, Bissani N, Wehbe N, Obeid O, et al. The effect of central obesity on inflammation, hepcidin, and iron metabolism in young women. Int J Obes (2005) (2020) 44(6):1291–300. doi: 10.1038/s41366-020-0522-x
9. Zimmermann MB, Zeder C, Muthayya S, Winichagoon P, Chaouki N, Aeberli I, et al. Adiposity in women and children from transition countries predicts decreased iron absorption, iron deficiency and a reduced response to iron fortification. Int J Obes (2005) (2008) 32(7):1098–104. doi: 10.1038/ijo.2008.43
10. Ellulu MS, Patimah I, Khaza'ai H, Rahmat A, Abed Y. Obesity and inflammation: The linking mechanism and the complications. Arch Med Sci AMS (2017) 13(4):851–63. doi: 10.5114/aoms.2016.58928
11. Coimbra `S, Catarino C, Santos-Silva A. The role of adipocytes in the modulation of iron metabolism in obesity. Obes Rev an Off J Int Assoc Stud Obes (2013) 14(10):771–9. doi: 10.1111/obr.12057
12. Jehn M, Clark JM, Guallar E. Serum ferritin and risk of the metabolic syndrome in U.S. adults. Diabetes Care (2004) 27(10):2422–8. doi: 10.2337/diacare.27.10.2422
13. Ma W, Jia L, Xiong Q, Feng Y, Du H. The role of iron homeostasis in adipocyte metabolism. Food Funct (2021) 12(10):4246–53. doi: 10.1039/d0fo03442h
14. El-Mallah CA, Beyh YS, Obeid OA. Iron fortification and supplementation: Fighting anemia of chronic diseases or fueling obesity? Curr Dev Nutr (2021) 5(4):nzab032–nzab. doi: 10.1093/cdn/nzab032
15. Didelez V, Sheehan N. Mendelian randomization as an instrumental variable approach to causal inference. Stat Methods Med Res (2007) 16(4):309–30. doi: 10.1177/0962280206077743
16. Smith GD, Ebrahim S. 'Mendelian randomization': Can genetic epidemiology contribute to understanding environmental determinants of disease? Int J Epidemiol (2003) 32(1):1–22. doi: 10.1093/ije/dyg070
17. Davey Smith G, Hemani G. Mendelian randomization: Genetic anchors for causal inference in epidemiological studies. Hum Mol Genet (2014) 23(R1):R89–98. doi: 10.1093/hmg/ddu328
18. Bell S, Rigas AS, Magnusson MK, Ferkingstad E, Allara E, Bjornsdottir G, et al. A genome-wide meta-analysis yields 46 new loci associating with biomarkers of iron homeostasis. Commun Biol (2021) 4(1):156. doi: 10.1038/s42003-020-01575-z
19. Locke AE, Kahali B, Berndt SI, Justice AE, Pers TH, Day FR, et al. Genetic studies of body mass index yield new insights for obesity biology. Nature (2015) 518(7538):197–206. doi: 10.1038/nature14177
20. Shungin D, Winkler TW, Croteau-Chonka DC, Ferreira T, Locke AE, Mägi R, et al. New genetic loci link adipose and insulin biology to body fat distribution. Nature (2015) 518(7538):187–96. doi: 10.1038/nature14132
21. Hartwig FP, Davies NM, Hemani G, Davey Smith G. Two-sample mendelian randomization: Avoiding the downsides of a powerful, widely applicable but potentially fallible technique. Int J Epidemiol (2016) 45(6):1717–26. doi: 10.1093/ije/dyx028
22. Pierce BL, Ahsan H, Vanderweele TJ. Power and instrument strength requirements for mendelian randomization studies using multiple genetic variants. Int J Epidemiol (2011) 40(3):740–52. doi: 10.1093/ije/dyq151
23. Burgess S, Scott RA, Timpson NJ, Davey Smith G, Thompson SG, Consortium E-I. Using published data in mendelian randomization: A blueprint for efficient identification of causal risk factors. Eur J Epidemiol (2015) 30(7):543–52. doi: 10.1007/s10654-015-0011-z
24. Burgess S, Butterworth A, Thompson SG. Mendelian randomization analysis with multiple genetic variants using summarized data. Genet Epidemiol (2013) 37(7):658–65. doi: 10.1002/gepi.21758
25. Burgess S, Davey Smith G, Davies NM, Dudbridge F, Gill D, Glymour MM, et al. Guidelines for performing mendelian randomization investigations. Wellcome Open Res (2019) 4:186. doi: 10.12688/wellcomeopenres.15555.2
26. Hemani G, Bowden J, Davey Smith G. Evaluating the potential role of pleiotropy in mendelian randomization studies. Hum Mol Genet (2018) 27(R2):R195–208. doi: 10.1093/hmg/ddy163
27. Bowden J, Davey Smith G, Haycock PC, Burgess S. Consistent estimation in mendelian randomization with some invalid instruments using a weighted median estimator. Genet Epidemiol (2016) 40(4):304–14. doi: 10.1002/gepi.21965
28. Milligan BG. Maximum-likelihood estimation of relatedness. Genetics (2003) 163(3):1153–67. doi: 10.1093/genetics/163.3.1153
29. Greco MF, Minelli C, Sheehan NA, Thompson JR. Detecting pleiotropy in mendelian randomisation studies with summary data and a continuous outcome. Stat Med (2015) 34(21):2926–40. doi: 10.1002/sim.6522
30. Bowden J, Davey Smith G, Burgess S. Mendelian randomization with invalid instruments: Effect estimation and bias detection through egger regression. Int J Epidemiol (2015) 44(2):512–25. doi: 10.1093/ije/dyv080
31. Verbanck M, Chen CY, Neale B, Do R. Detection of widespread horizontal pleiotropy in causal relationships inferred from mendelian randomization between complex traits and diseases. Nat Genet (2018) 50(5):693–8. doi: 10.1038/s41588-018-0099-7
32. Bowden J, Spiller W, Del Greco MF, Sheehan N, Thompson J, Minelli C, et al. Improving the visualization, interpretation and analysis of two-sample summary data mendelian randomization Via the radial plot and radial regression. Int J Epidemiol (2018) 47(4):1264–78. doi: 10.1093/ije/dyy101
33. Hemani G, Tilling K, Davey Smith G. Orienting the causal relationship between imprecisely measured traits using gwas summary data. PLoS Genet (2017) 13(11):e1007081. doi: 10.1371/journal.pgen.1007081
34. Hemani G, Zheng J, Elsworth B, Wade KH, Haberland V, Baird D, et al. The Mr-base platform supports systematic causal inference across the human phenome. eLife (2018) 7:e34408. doi: 10.7554/eLife.34408
35. Wang X, Gao X, Han Y, Zhang F, Lin Z, Wang H, et al. Causal association between serum thyrotropin and obesity: A bidirectional, mendelian randomization study. J Clin Endocrinol Metab (2021) 106(10):e4251–e9. doi: 10.1210/clinem/dgab183
36. Pihan-Le Bars F, Bonnet F, Loréal O, Le Loupp AG, Ropert M, Letessier E, et al. Indicators of iron status are correlated with adiponectin expression in adipose tissue of patients with morbid obesity. Diabetes Metab (2016) 42(2):105–11. doi: 10.1016/j.diabet.2015.10.007
37. Ali NB, Dibley MJ, Islam S, Rahman MM, Raihana S, Bhuiyan SET, et al. Overweight and obesity among urban women with iron deficiency anaemia in Bangladesh. Matern Child Nutr (2021) 17(2):e13102. doi: 10.1111/mcn.13102
38. Yook J-S, Thomas SS, Toney AM, You M, Kim Y-C, Liu Z, et al. Dietary iron deficiency modulates adipocyte iron homeostasis, adaptive thermogenesis, and obesity in C57bl/6 mice. J Nutr (2021) 151(10):2967–75. doi: 10.1093/jn/nxab222
39. Moreno-Navarrete JM, Moreno M, Puig J, Blasco G, Ortega F, Xifra G, et al. Hepatic iron content is independently associated with serum hepcidin levels in subjects with obesity. Clin Nutr (Edinburgh Scotland) (2017) 36(5):1434–9. doi: 10.1016/j.clnu.2016.09.022
40. Amato A, Santoro N, Calabrò P, Grandone A, Swinkels DW, Perrone L, et al. Effect of body mass index reduction on serum hepcidin levels and iron status in obese children. Int J Obes (2010) 34(12):1772–4. doi: 10.1038/ijo.2010.204
41. Hamza RT, Hamed AI, Kharshoum RR. Iron homeostasis and serum hepcidin-25 levels in obese children and adolescents: Relation to body mass index. Horm Res Paediatr (2013) 80(1):11–7. doi: 10.1159/000351941
42. Aka S, Kilercik M, Arapoglu M, Semiz S. The hepcidin and 25-Oh-Vitamin d levels in obese children as a potential mediator of the iron status. Clin Lab (2021) 67(5). doi: 10.7754/Clin.Lab.2020.200813
43. Kernan KF, Carcillo JA. Hyperferritinemia and inflammation. Int Immunol (2017) 29(9):401–9. doi: 10.1093/intimm/dxx031
44. McClung JP, Karl JP. Iron deficiency and obesity: The contribution of inflammation and diminished iron absorption. Nutr Rev (2009) 67(2):100–4. doi: 10.1111/j.1753-4887.2008.00145.x
45. Nemeth E, Valore EV, Territo M, Schiller G, Lichtenstein A, Ganz T. Hepcidin, a putative mediator of anemia of inflammation, is a type ii acute-phase protein. Blood (2003) 101(7):2461–3. doi: 10.1182/blood-2002-10-3235
46. Failla ML, Kennedy ML, Chen ML. Iron metabolism in genetically obese (Ob/Ob) mice. J Nutr (1988) 118(1):46–51. doi: 10.1093/jn/118.1.46
47. Choma SS, Alberts M, Modjadji SE. Conflicting effects of bmi and waist circumference on iron status. J Trace Elements Med Biol Organ Soc Minerals Trace Elements (GMS) (2015) 32:73–8. doi: 10.1016/j.jtemb.2015.06.003
Keywords: iron status, obesity-related traits, Mendelian randomization, serum ferritin, serum iron, transferrin saturation
Citation: Zhou Z, Zhang H, Chen K and Liu C (2023) Iron status and obesity-related traits: A two-sample bidirectional Mendelian randomization study. Front. Endocrinol. 14:985338. doi: 10.3389/fendo.2023.985338
Received: 03 August 2022; Accepted: 02 February 2023;
Published: 14 February 2023.
Edited by:
Jason C. G. Halford, University of Liverpool, United KingdomReviewed by:
Simon N. Dankel, University of Bergen, NorwayCopyright © 2023 Zhou, Zhang, Chen and Liu. This is an open-access article distributed under the terms of the Creative Commons Attribution License (CC BY). The use, distribution or reproduction in other forums is permitted, provided the original author(s) and the copyright owner(s) are credited and that the original publication in this journal is cited, in accordance with accepted academic practice. No use, distribution or reproduction is permitted which does not comply with these terms.
*Correspondence: Zengyuan Zhou, enp5MjU0NDQ1Njk3QDE2My5jb20=
†These authors have contributed equally to this work
Disclaimer: All claims expressed in this article are solely those of the authors and do not necessarily represent those of their affiliated organizations, or those of the publisher, the editors and the reviewers. Any product that may be evaluated in this article or claim that may be made by its manufacturer is not guaranteed or endorsed by the publisher.
Research integrity at Frontiers

Learn more about the work of our research integrity team to safeguard the quality of each article we publish.