 Lu Huang
 Xin Deng†
 Zhong Tang
 Min Tao
 Shaojun Liu
94% of researchers rate our articles as excellent or good
Learn more about the work of our research integrity team to safeguard the quality of each article we publish.
Find out more
ORIGINAL RESEARCH article
Front. Endocrinol. , 23 January 2024
Sec. Experimental Endocrinology
Volume 14 - 2023 | https://doi.org/10.3389/fendo.2023.1310000
This article is part of the Research Topic Recent Insights into the Role of Hormones during Development and Their Functional Regulation View all 6 articles
Background: Melanocortin-3 and -4 receptors (MC3R and MC4R), G protein-coupled receptors, play vital roles in the regulation of energy homeostasis. To understand the functions of mc3r and mc4r in the energy homeostasis of red crucian carp (Carassius auratus red var., RCC), we cloned mc3r and mc4r, analyzed the tissue expression and localization of the genes, and investigated the effects of knockout of mc3r (mc3r+/-) and mc4r (mc4r+/-) in RCC.
Results: The full-length cDNAs of RCC mc3r and mc4r were 1459 base pairs (bp) and 1894 bp, respectively. qRT-PCR indicated that mc3r and mc4r were profusely expressed in the brain, but lower expressed in the periphery tissues. ISH revealed that mc3r and mc4r were located in NPP, NPO, NAPv, NSC, NAT, NRL, NLTl, and NLTp of the brain, suggesting that mc3r and mc4r might regulate many physiological and behavioral aspects in RCC. To further verify the roles of mc3r and mc4r in energy homeostasis, the mc3r+/- and mc4r+/- fish were obtained by the CRISPR/Cas9 system. The average body weights, total lengths, body depths, and food intake of mc4r+/- fish were significantly higher than those of mc3r+/- and the normal wild-type (WT) fish, but there was no difference between the mc3r+/- and WT fish, indicating that the RCC phenotype and food intake were mainly influenced by mc4r but not mc3r. Interestingly, mc4r+/- fish displayed more visceral fat mass than mc3r+/- and WT fish, and mc3r+/- fish also exhibited slightly more visceral fat mass compared to WT. RNA-seq of the liver and muscle revealed that a large number of differentially expressed genes (DEGs) differed in WT vs. mc3r+/-, WT vs. mc4r+/-, and mc3r+/- vs. mc4r+/-, mainly related to lipid, glucose, and energy metabolism. The KEGG enrichment analysis revealed that DEGs were mainly enriched in pathways such as steroid biosynthesis, fatty acid metabolism, fatty acid biosynthesis, glycolysis/gluconeogenesis, wnt signaling pathway, PPAR signaling pathway, and MAPK signaling pathway, thereby affecting lipid accumulation and growth.
Conclusion: In conclusion, these results will assist in the further investigation of the molecular mechanisms in which MC3R and MC4R were involved in the regulation of energy homeostasis in fish.
The melanocortins are post-translational products of proopiomelanocortin (POMC), consisting of α-, β-, and γ-melanocyte-stimulating hormones (MSHs) and adrenocorticotropic hormone (ACTH) that play important roles in multiple physiological functions via binding to melanocortin receptors (MCRs) (1, 2). MCRs, members of rhodopsin-like Family A G-protein-coupled receptors (GPCRs), comprise five members (MC1R to MC5R) with diverse physiological roles including skin and hair pigmentation, steroid secretion, energy homeostasis, and exocrine secretion (1).
MC3R and MC4R are mainly expressed in the central nervous system (CNS) and play critical roles in regulating energy homeostasis. To our knowledge, mutations of mc3r or mc4r in mice result in obesity (3, 4). The mc4r knockout mice show decreased energy expenditure, increased food consumption, increased fat mass, increased somatic growth, and substantial insulin resistance (3, 5). It is of note that the obesity phenotype of mc3r knockout mice are different from mc4r knockout mice, mc3r knockout mice do not exhibit significantly increased food intake, increased weight, and substantial insulin resistance, while they have increased fat mass and feed efficiency (4, 6). Recent data suggest that mc3r knockout mice are involved in triglyceride synthesis and hepatic lipogenesis (7). Likely, mutations of mc3r or mc4r in human are associated with obesity (5, 8, 9).
The relative expression of mc3r and mc4r has also been found in several peripheral tissues in addition to the central nervous system, indicating other potential physiological functions in the periphery with reproduction, cardiovascular, and immune response (1, 9–13). The MC3R and MC4R are primarily coupled to the stimulatory G protein (Gs) to stimulate the adenylyl cyclase activity, which will increase intracellular cAMP production to trigger downstream signaling (11, 14).
As in mammals, MC3R and MC4R have also attracted extensive attention in teleosts due to their functions in regulating energy homeostasis. The mc3r and mc4r are profusely expressed in CNS and widely expressed in peripheral tissues of topmouth culter (Culter alburnus) (9, 11). MC4R is involved in regulating the somatic growth, adipocyte hypertrophy, and energy homeostasis of zebrafish (Danio rerio) (15–17). In cavefish (Astyanax mexicanus), mc4r knockout fish have shown increased starvation resistance (18). In rainbow trout (Oncorhynchus mykiss), Schjolden et al. reported that MC4R could regulate the food intake in 2008 (19). The pharmacological properties of MC3R are investigated in channel catfish (Ictalurus punctatus) (8), common carp (Cyprinus carpio) (20), and zebrafish (21), indicating the functions in regulating energy homeostasis.
Red crucian carp (Carassius auratus red var.) is an ornamental fish with vivid red color and accounts for important proportion of freshwater aquaculture production worldwide. In this study, we investigated the physiological functions of MC3R and MC4R in red crucian carp by gene cloning, tissue distribution, and localization. To further verify the roles of MC3R and MC4R in regulating energy homeostasis and growth, we obtained the mc3r and mc4r knockout RCC and compared the difference of growth performance, lipid accumulation, DEGs, and KEGG pathways among different types. These findings laid the foundation for future physiological studies of teleosts MC3R and MC4R.
All animal experiments were approved by the Animal Care Committee of Hunan Normal University and the Administration of Affairs Concerning Experimental Animals of China. Red crucian carp was collected from the Engineering Research Center of Polyploid Fish Reproduction and Breeding of the Ministry of Education at Hunan Normal University.
Red crucian carp was anesthetized before decapitation and the tissues were excised and stored at −80°C. Total RNA was purified by Trizol™ Reagent (Invitrogen, USA). The first-strand cDNA was synthesized by PrimeScript RT reagent Kit (TaKaRa, Japan). Primers, designed using Primer Premier 5.0 (Supplementary Table 1), were used to obtain full-length cDNA via PCR and touch-down PCR with TaKaRa LA Taq®. The PCR products were separated through 1.2% agarose gels, purified by SanPrep Column DNA Gel (Sangon, China), subcloned into the PMD18-T, and then sequenced (Sangon).
To explore the tissue distribution of these genes, the medulla, mesencephalon, cerebellum, olfactory bulb, telencephalon, hypothalamus, pituitary, spleen, muscle, gonads (ovary and testis), gill, heart, liver, kidney, head kidney, and skin were obtained from three males (45.27 ± 4.79 g) and three females (46.33 ± 3.17 g), respectively. Primers were designed by AlleleID 6 and selected in qRT-PCR with 95%–105% amplification efficiency and single melting curve, and β-actin was used as the internal control (Supplementary Table 1). The qRT-PCR was carried out by a Prism 7,500 Sequence Detection System (ABI, USA). The 10-μL mixture of the reaction consisted of 5 μL of SYBR green PCR Master Mix (TaKaRa), 0.5 μL of each primer, 3 μL of ddH2O, and 1 μL of diluted cDNA sample. The qRT-PCR procedure was set as follows: 50°C for 2 min, 95°C for 10 min, followed by 40 cycles at 95°C for 15 s and 61°C for 45 s. The experimental samples were added to a 96-well plate repeated thrice. The relative expression of genes was calculated using the 2−ΔΔCt method (22).
Primers (Supplementary Table 1) for the in situ hybridization (ISH) were designed by Primer Premier 5.0. Antisense digoxigenin (DIG)-labeled probes were synthesized through in vitro transcription using MAXIscript™ T7 In Vitro Transcription Kit (Invitrogen, USA) and purified by LiCl precipitation as described in the title (23). The probes were stored at −80°C.
The RCC brain was fixed in 4% paraformaldehyde (PFA, Sangon) for a night at 4°C. Next, the tissue was dehydrated using a series of graded sucrose solutions (15%, 20%, and 30%) and embedded in Tissue-Tek O.C.T. Compound® (Sakura, USA). Then, the embedded tissues were cut using a freezing microtome (Leica CM3050 S Cryostat, Germany) into 20-μm-thick sections according to the instruction manual.
The ISH experiment needs to maintain an RNase-free environment. Prior to hybridization, the sections were washed with 1×PBST at room temperature (RT) for 5 min, treated with 5 μg/mL proteinase K at RT for 5 min, fixed with 4% PFA at RT for 10 min, and prehybridized (prehybridization solution was mixed as follows: 50 mL of deionized formamide, 25 mL of 20 × SSC, 920 μL of 1 M citric acid, 1 mL of 0.5 M EDTA, 500 μL of 20% Tween-20, 100 μL of 50 mg/mL heparin, 100 μL of 50 mg/mL tRNA, and 22.38 mL of DEPC-H2O) at 60°C for 4 h. Then, the sections were hybridized (hybridization solution was prepared by adding the RNA probe into prehybridization solution) at 60°C for 16 h. Post-hybridization, the sections were washed with 50% deionized formamide at 50°C for 15 min, 2×SSCT at RT for 15 min, and incubated with 2 μg/mL RNase A (Thermo Fisher Scientific, USA) buffer at RT for 30 min. Then, they were washed with 2×SSCT, 0.2×SSCT, and 1×PBST for 10 min, respectively. Next, the sections were blocked with blocking buffer at RT for 2 h and then incubated with AP-conjugated anti-DIG antibody (Roche, Germany, 1:3,000 diluted in the blocking buffer) overnight at 4°C. The sections were stained with NBT/BCIP stock solution (Roche, Germany) and the hybridization signals were detected using light microscopy (Olympus, Japan). The negative control was incubated with PBS instead of probes.
The CRISPR/Cas9 system was made up of Cas9 protein and guide RNA (gRNA) (24). gRNAs were designed and generated using the Maxiscript T7 PCR-based method. The gRNAs targeting mc3r and mc4r were designed using the online software tool (http://zifit.partners.org/ZiFiT) and two gRNAs of each gene were selected to ensure the knockout efficiency. Taking the DR274 plasmid as a template, the gRNAs were synthesized with corresponding primers (Supplementary Table 1) using Takara EX Taq (TaKaRa, Japan). The PCR products were confirmed with 1.2% agarose gel and used as templates in subsequent in vitro transcription reactions following the manufacturer’s guidelines of TranscriptAid T7 High Yield Transcription Kit (Thermo Fisher Scientific, USA) for synthesizing the gRNAs.
The TrueCut™ Cas9 Protein v2 was obtained from Thermo Fisher Scientific. The injection solutions were prepared by mixing Cas9 Protein and gRNAs, and then the mixture was incubated for 5 min on ice before being injected into the two-cell stage via a microinjector (PV830, WPI, USA). The final concentrations of gRNAs and Cas9 Protein were 200 ng/μL and 300 ng/μL, respectively.
Fin-clip samples of each fish were collected in sterile Eppendorf tubes and extracted genomic DNA using Tissue DNA Kit (Omega, USA) for mutation examination. The primers (Supplementary Table 1) for PCR amplification were encapsulated all possible mutation sites. Then, the amplified products were separated, purified, and sequenced as above.
For this experiment, 6-month-old WT (n = 18, 10.28 ± 2.18 g), mc3r+/− (n = 18, 10.38 ± 2.27 g), and mc4r+/− (n = 18, 16.80 ± 4.68 g) fish were individually placed into nine tanks (six fish each) with the same feeding environment, and each type of fish was divided into three replicates. The fish were fed once a day. The feeding trial was carried out for 12 days and food intake was recorded daily. Food intake was calculated as the difference between the initial dry weight and residual dry weight.
Total RNA was extracted from liver and muscle samples of treatment and control groups for transcriptome sequencing. The cDNA libraries were constructed using the NEBNext® UltraTM RNA Library Prep Kit for Illumina® (NEB, USA) according to manufacturer instructions. Then, the cDNA libraries were sequenced with Illumina HiSeq™ sequencing platform. The fastp v 0.19.3 was used to remove the low-quality bases and empty reads. Next, HISAT v2.1.0 was used to construct the index and compare clean reads to the reference genome (https://www.ncbi.nlm.nih.gov/nuccore/1764596402). The differential expressions of two groups were analyzed via DESeq2 v1.22.1. Genes with |log2Fold Change| ≥ 1 and false discovery rate (FDR) < 0.05 were defined as differentially expressed genes (DEGs). The DEGs enrichment analysis was performed based on the hypergeometric test. The Kyoto Encyclopedia of Genes and Genomes (KEGG) and gene ontology (GO) were performed based on the pathway and GO term, respectively.
DNAMAN version 5.0 was used to analyze multiple sequence alignment. Phylogenetic tree was constructed with MEGA 5 software. SPSS 19.0 software was used to calculate all data that were presented as the mean ± SEM. One-way ANOVA was used to analyze statistically significant differences in gene expression between multiple groups. The significance of differences in the average body weights, total lengths, body depths, food intake, visceral fat mass, and gene expression of mutated and control fish were determined by Student’s t-test. p < 0.05 was considered as statistically significant.
The full-length cDNAs of mc3r (GenBank: OR573936) and mc4r (GenBank: OR573935) in red crucian carp were 1,459 base pairs (bp) and 1,894 bp, respectively. RCC mc3r included 339 bp 5′ UnTranslated Regions (UTR), 136 bp 3′UTR, and 984 bp open reading frame (ORF) encoding a putative protein of 327 amino acids (Figure 1A). RCC mc4r consisted of 331 bp 5′UTR, 582 bp 3′UTR, and 981 bp ORF encoding a putative protein of 326 amino acids (Figure 2A). Both RCC mc3r and mc4r had seven hydrophobic transmembrane domains (TMDs) and several conserved motifs (PMY, DRY, and DPxxY) that were significantly conserved with those of other species (Figures 1 and 2, and Supplementary Figure 1). Also, three potential N-linked glycosylation sites (Asn2, Asn16, and Asn23) were observed in RCC mc3r and four potential N-linked glycosylation sites (Asn2, Asn15, Asn94, and Asn108) were discovered in RCC mc4r. The consensus sequences for protein kinase C phosphorylation were found in mc3r (Thr313, Phe314, and Lys315) and mc4r (Thr310, Phe311, and Lys312), respectively (Figures 1 and 2). The results of multiple sequence alignment analysis showed that RCC MC3R and MC4R had higher positives with other piscinae and mammals (Supplementary Figure 1). Phylogenetic tree analysis revealed that RCC MC3R nested with common carp, fathead minnow, wuchang bream, and topmouth culter MC3Rs, and RCC MC4R nested with wuchang bream, common carp, topmouth culter, and zebrafish MC4Rs (Figures 1B and 2B).
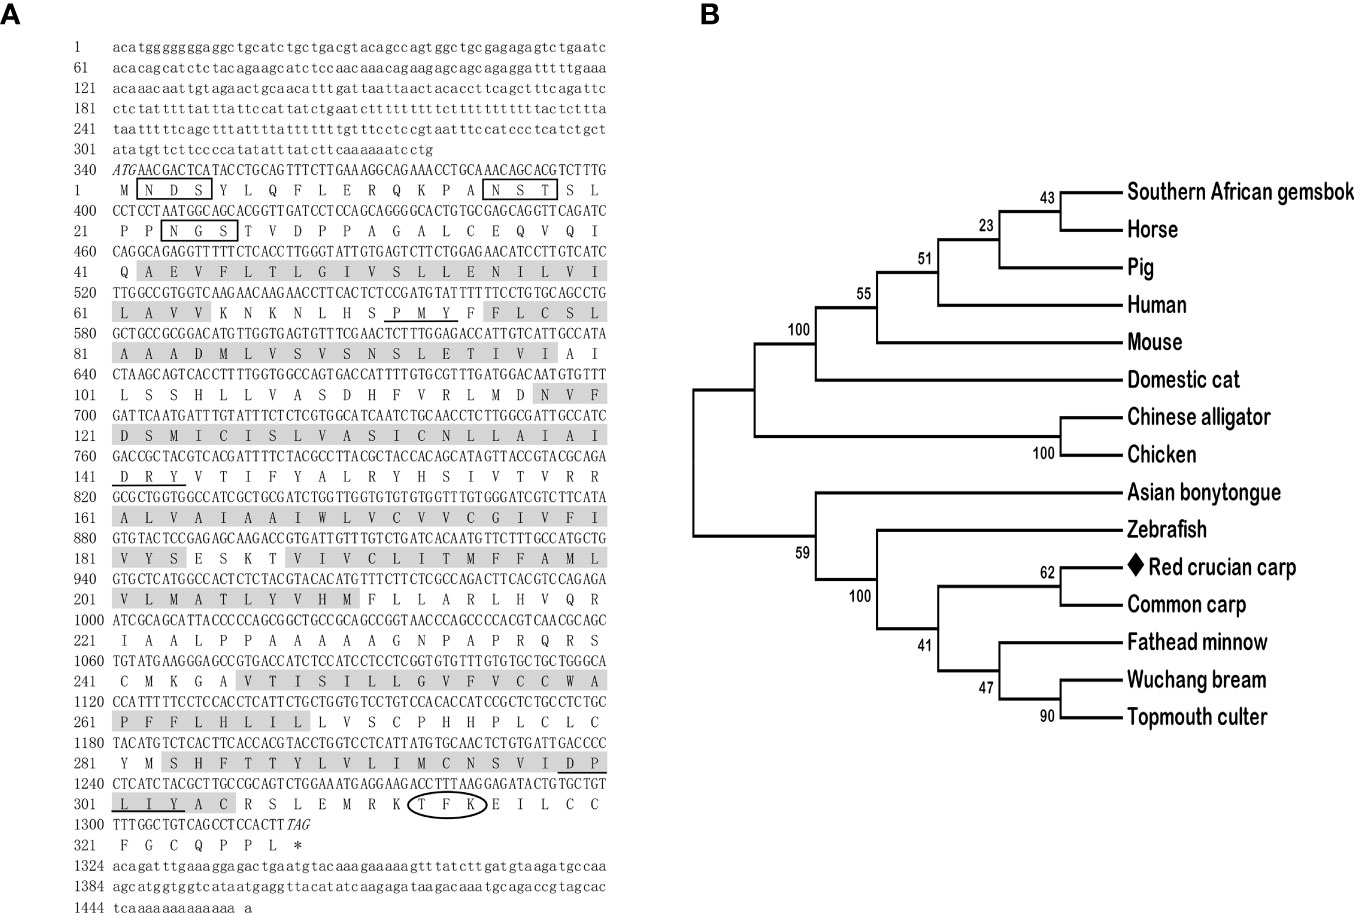
Figure 1 Nucleotide and deduced amino acid sequences and phylogenetic tree of RCC MC3R. (A) Nucleotide and deduced amino acid sequences of RCC MC3R. Lowercase letters and uppercase letters represent the non-coding regions and coding regions of the nucleotide sequence, respectively. Shaded boxes refer to putative TMD1-7. N-linked glycosylation sites are present in open boxes. Oval frame shows potential phosphorylation. Underlines denote PMY, DRY, and DPxxY motifs. Asterisk (*) shows stop codon. (B) Phylogenetic tree of RCC MC3R. The neighbor-joining (NJ) method was used to construct the phylogenetic tree. Numbers at nodes represent the bootstrap percentages, obtained for 1,000 replicates. Carassius auratus red var. (red crucian carp, OR573936), Cyprinus carpio (common carp, XP_042585810.1), Megalobrama amblycephala (wuchang bream, XP_048067317.1), Danio rerio (zebrafish, AAO24744.1), Culter alburnus (topmouth culter, QTW97901.1), Pimephales promelas (fathead minnow, XP_039535361.1), Scleropages formosus (Asian bonytongue, XP_018615783.1), Alligator sinensis (Chinese alligator, XP_006018246.1), Oryx gazella (southern African gemsbok, XP_040103238.1), Mus musculus (mouse, AAI03670.1), Gallus gallus (chicken, XP_040544507.1), Sus scrofa (pig, NP_001116609.1), Equus caballus (horse, NP_001243901.1), Felis catus (domestic cat, XP_023106851.2), and Homo sapiens (human, AKI72214.1).
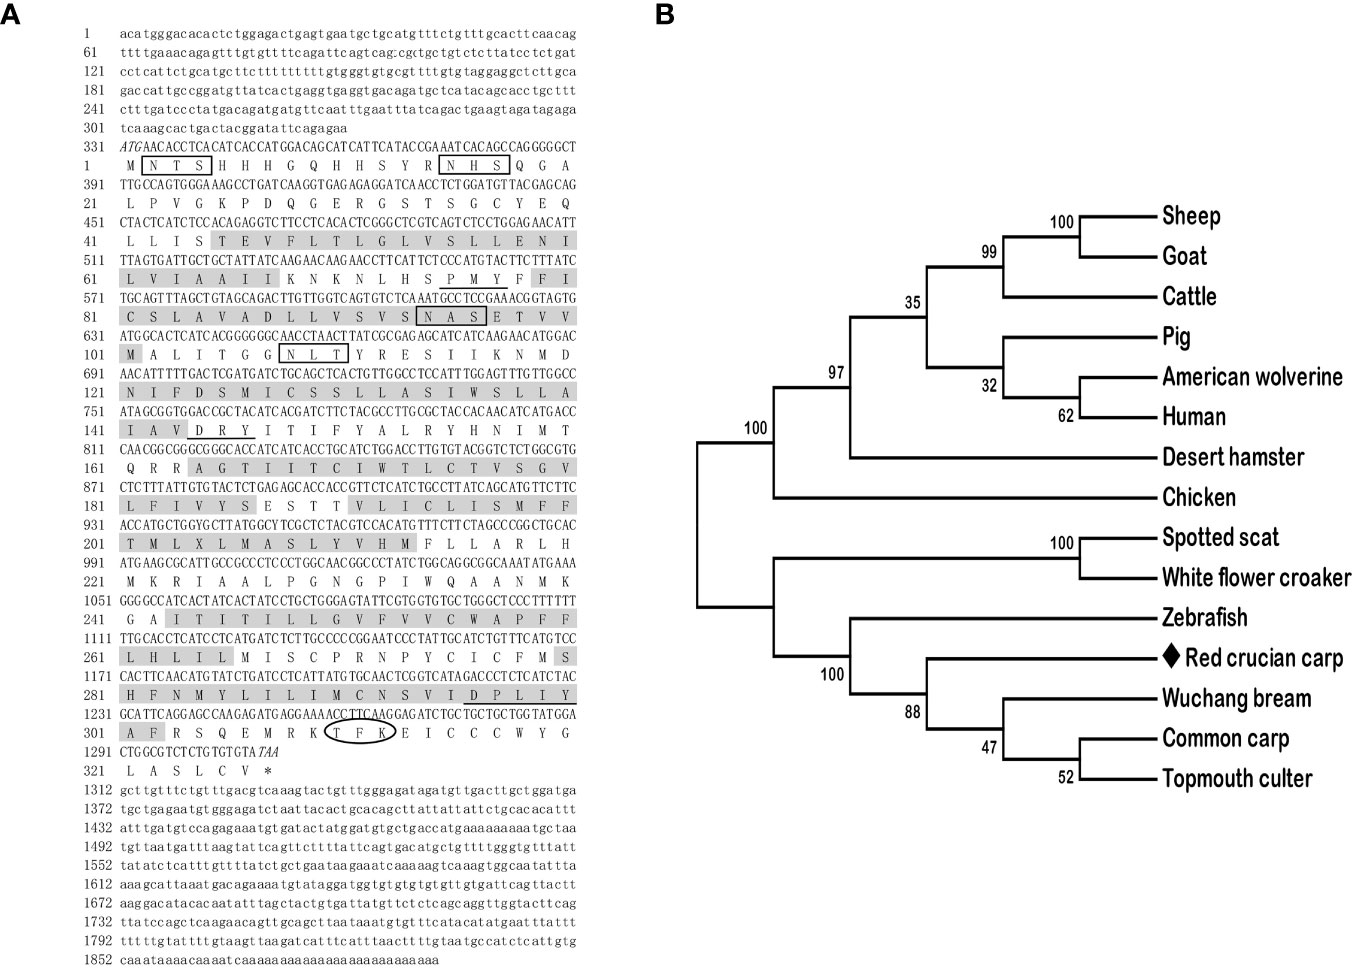
Figure 2 Nucleotide and deduced amino acid sequences and phylogenetic tree of RCC MC4R. (A) Nucleotide and deduced amino acid sequences of RCC MC4R. Lowercase letters and uppercase letters represent the non-coding regions and coding regions of the nucleotide sequence, respectively. Shaded boxes refer to putative TMD1-7. N-linked glycosylation sites are present in open boxes. Oval frame shows potential phosphorylation. Underlines denote PMY, DRY, and DPxxY motifs. Asterisk (*) shows stop codon. (B) Phylogenetic tree of RCC MC4R. The neighbor-joining (NJ) method was used to construct the phylogenetic tree. Numbers at nodes represent the bootstrap percentages, obtained for 1,000 replicates. Carassius auratus red var. (red crucian carp, OR573935), Cyprinus carpio (common carp, XP_042630234.1), Megalobrama amblycephala (wuchang bream, AWA81516.1), Danio rerio (zebrafish, NP_775385.1), Culter alburnus (topmouth culter, QKY77175.1), Scatophagus argus (spotted scat, AOQ25859.1), Nibea albiflora (white flower croaker, KAG8009637.1), Phodopus roborovskii (desert hamster, XP_051056768.1), Ovis aries (sheep, NP_001119842.1), Capra hircus (goat, NP_001272520.1), Gulo gulo luscus (American wolverine, KAI5773012.1), Sus scrofa (pig, NP_999338.1), Bos taurus (cattle, NP_776535.1), Gallus gallus (chicken, NP_001026685.2), and Homo sapiens (human, NP_005903.2).
The qRT-PCR was used to analyze the relative expression of RCC mc3r and mc4r. The results reported that mc3r and mc4r were mainly expressed in the brain, and moderately expressed in peripheral tissues (Figure 3). In female RCC, mc3r was profusely expressed in the hypothalamus and pituitary gland but expressed at low levels in other tissues (Figure 3A). In male RCC, the highest expression of mc3r was observed in the hypothalamus, and also partially expressed in the olfactory bulb, telencephalon, spleen, testis, and head kidney (Figure 3B).
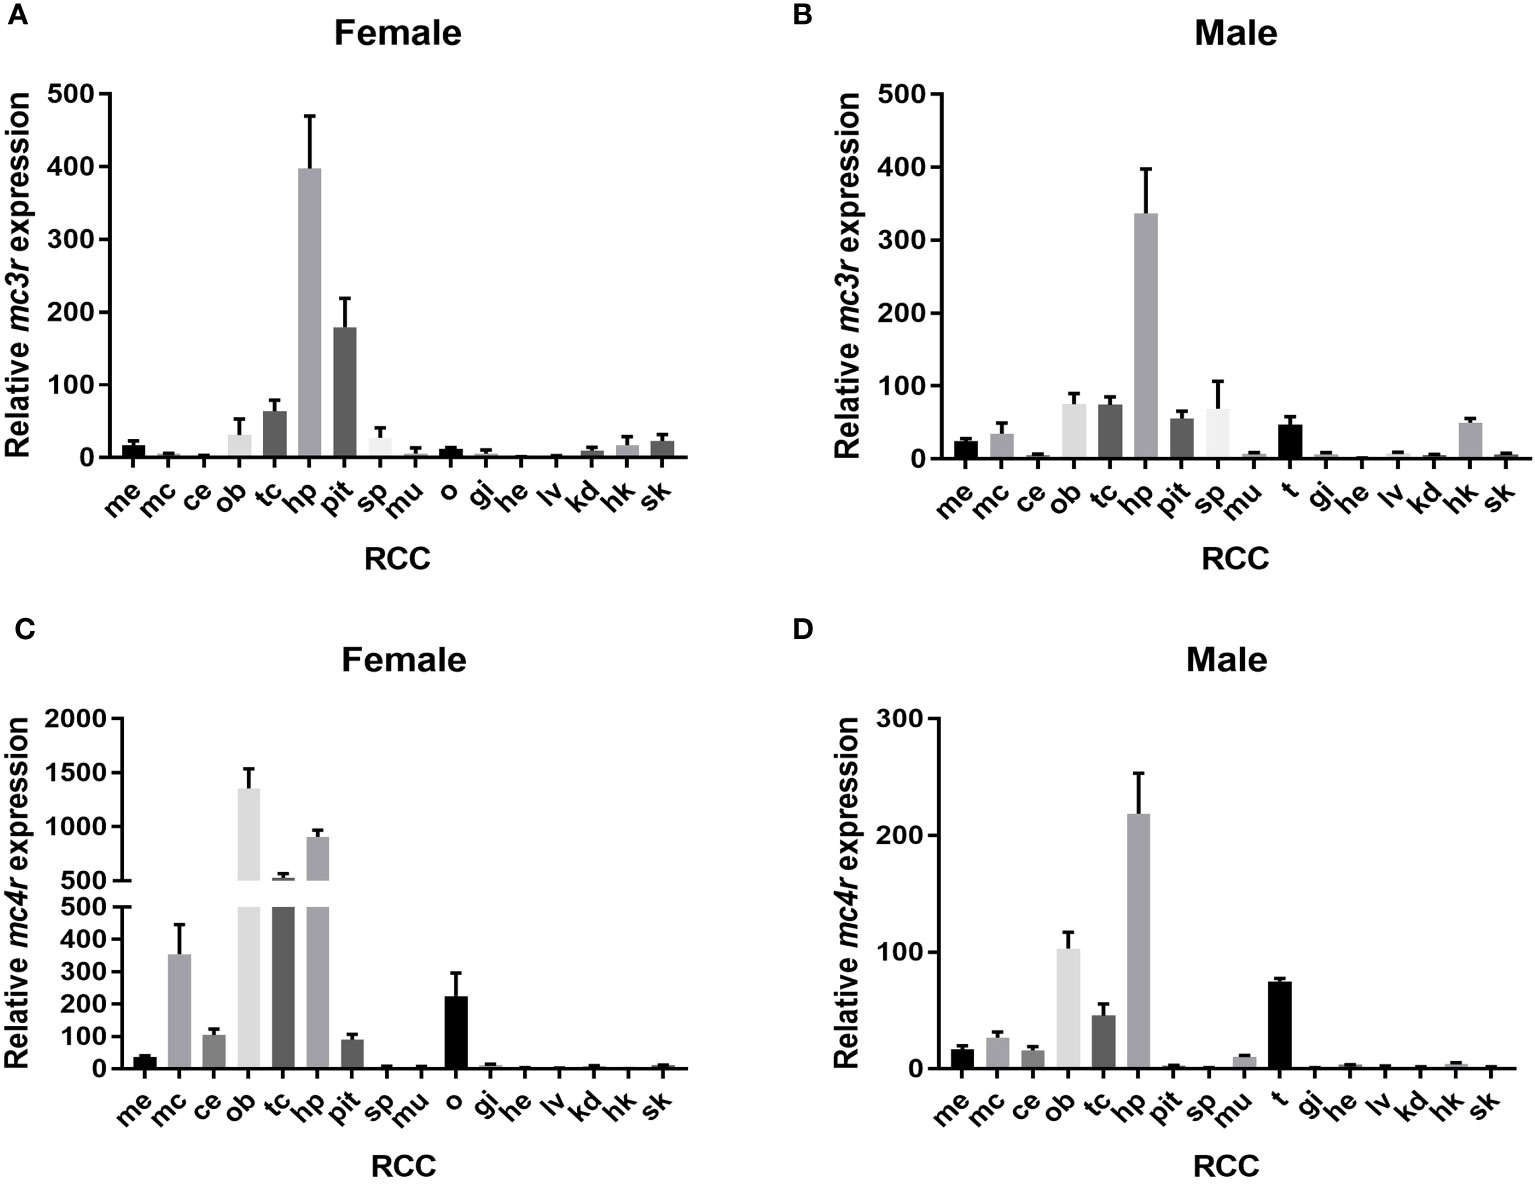
Figure 3 Relative expression of mc3r and mc4r in female and male RCC. (A) Relative expression of mc3r in female RCC. (B) Relative expression of mc3r in male RCC. (C) Relative expression of mc4r in female RCC. (D) Relative expression of mc4r in male RCC. The β-actin was used as the internal control. Data were shown as the mean ± SEM (n = 3). Me, medulla; mc, mesencephalon; ce, cerebellum; ob, olfactory bulb; tc, telencephalon; hp, hypothalamus; pit, pituitary gland; sp, spleen; mu, muscle; o, ovary; t, testis; gi, gill; he, heart; lv, liver; kd, kidney; hk, head kidney; sk, skin.
Similar to RCC mc3r expression. In female RCC, mc4r was highly expressed in the olfactory bulb, hypothalamus, telencephalon, mesencephalon, and ovary (Figure 3C). In male RCC, the relative expression of mc4r was higher in the hypothalamus, olfactory bulb, telencephalon, and followed by testis (Figure 3D).
ISH was used to further determine the localization of mc3r and mc4r in the RCC brain with antisense probes, with the PBS used as the negative control.
Both of the cell groups expressing mc3r and mc4r mRNAs were detected in several parts of the preoptic area and tuberal hypothalamus. In the preoptic area, mc3r-expressing and mc4r-expressing neurons were localized in the periventricular part of the preoptic nucleus (NPP), magnocellular neurons of the preoptic nucleus (NPO), the anterior periventricular nucleus (NAPv), and the suprachiasmatic nucleus (NSC), in which the expressions adopt a periventricular disposition (Figures 4A, B). Within the tuberal hypothalamus, positive mc3r-labeled and mc4r-labeled cells were evident in the anterior tuberal nucleus (NAT), the lateral recess nucleus (NRL), the posterior part of the lateral tuberal nucleus (NLTp), and the lateral part of the lateral tuberal nucleus (NLTl) (Figures 4D, E). No signals were found in the negative control (Figures 4C, F).
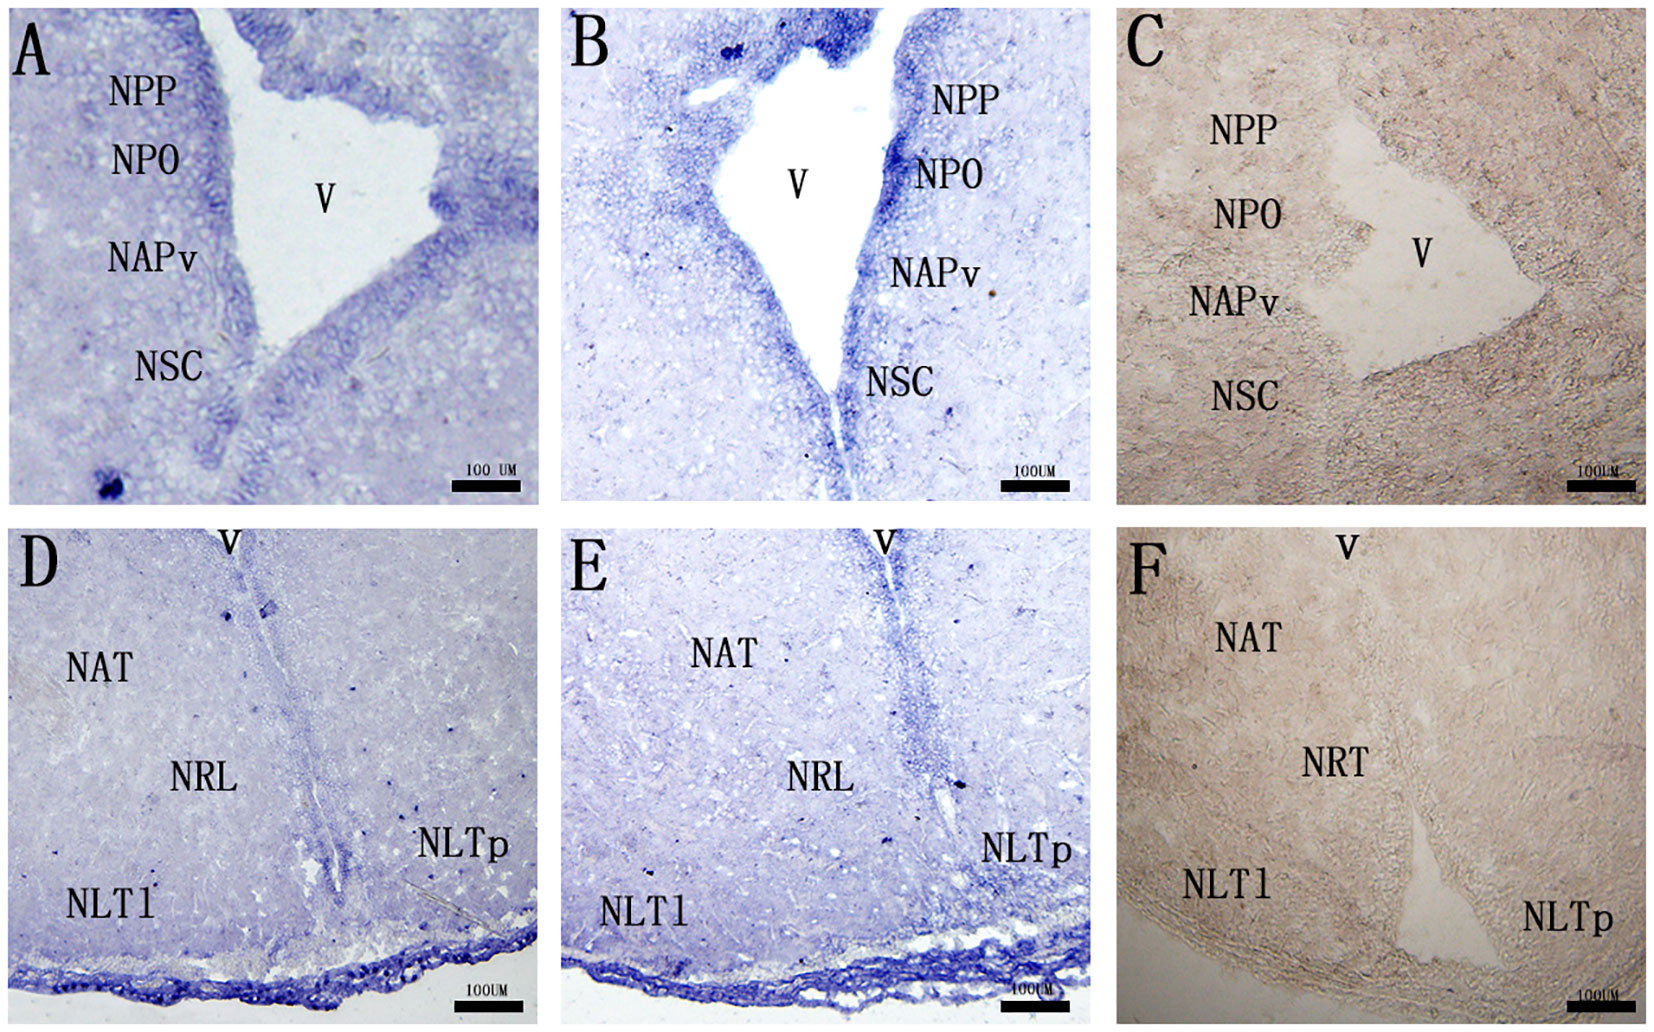
Figure 4 Localization of mc3r (A, D) and mc4r (B, E) in RCC brain. (C, F) represent negative control. The mRNA signals were determined by ISH. The periventricular part of the preoptic nucleus (NPP), magnocellular neurons of the preoptic nucleus (NPO), the anterior periventricular nucleus (NAPv), the suprachiasmatic nucleus (NSC), the anterior tyberal nucleus (NAT), the lateral recess nucleus (NRL), the posterior part of the lateral tuberal nucleus (NLTP), and the lateral part of the lateral tuberal nucleus (NLTl), third ventricle (v). Scale bar, 100 μm.
To verify the physiological functions of mc3r and mc4r in RCC energy homeostasis, the CRISPR/Cas9 system was used to mutate the RCC mc3r and mc4r. As we all know, genomic mutations contain either or all of the deletion, insertion, and substitution in the target areas at different levels. The PCR and Sanger sequencing revealed that multi-peaks were found in mc3r-gRNA2 and mc4r-gRNA1, the targeted areas (Figures 5, 6). The gene cloning results of mutant mc3r and mc4r both had 2 different levels of mutations (Figures 5D, 6D). There were two types of mutations in the mutant mc3r-gRNA2 group, including a type with 40-bp deletion, and another type with 3-bp deletion but 7-bp insertion (Figure 5D). Mutated fishes from the mc4r-gRNA1 group also exhibited two types of mutations, consisting of a type of 179-bp deletions and a type of 4-bp insertion (Figure 6D). The mutation rates were 32.3% in the mc3r mutation and 35.5% in the mc4r mutation. The survival rates of WT, mc3r+/−, and mc4r+/− were 82.1%, 80.5%, and 57.7%, respectively.
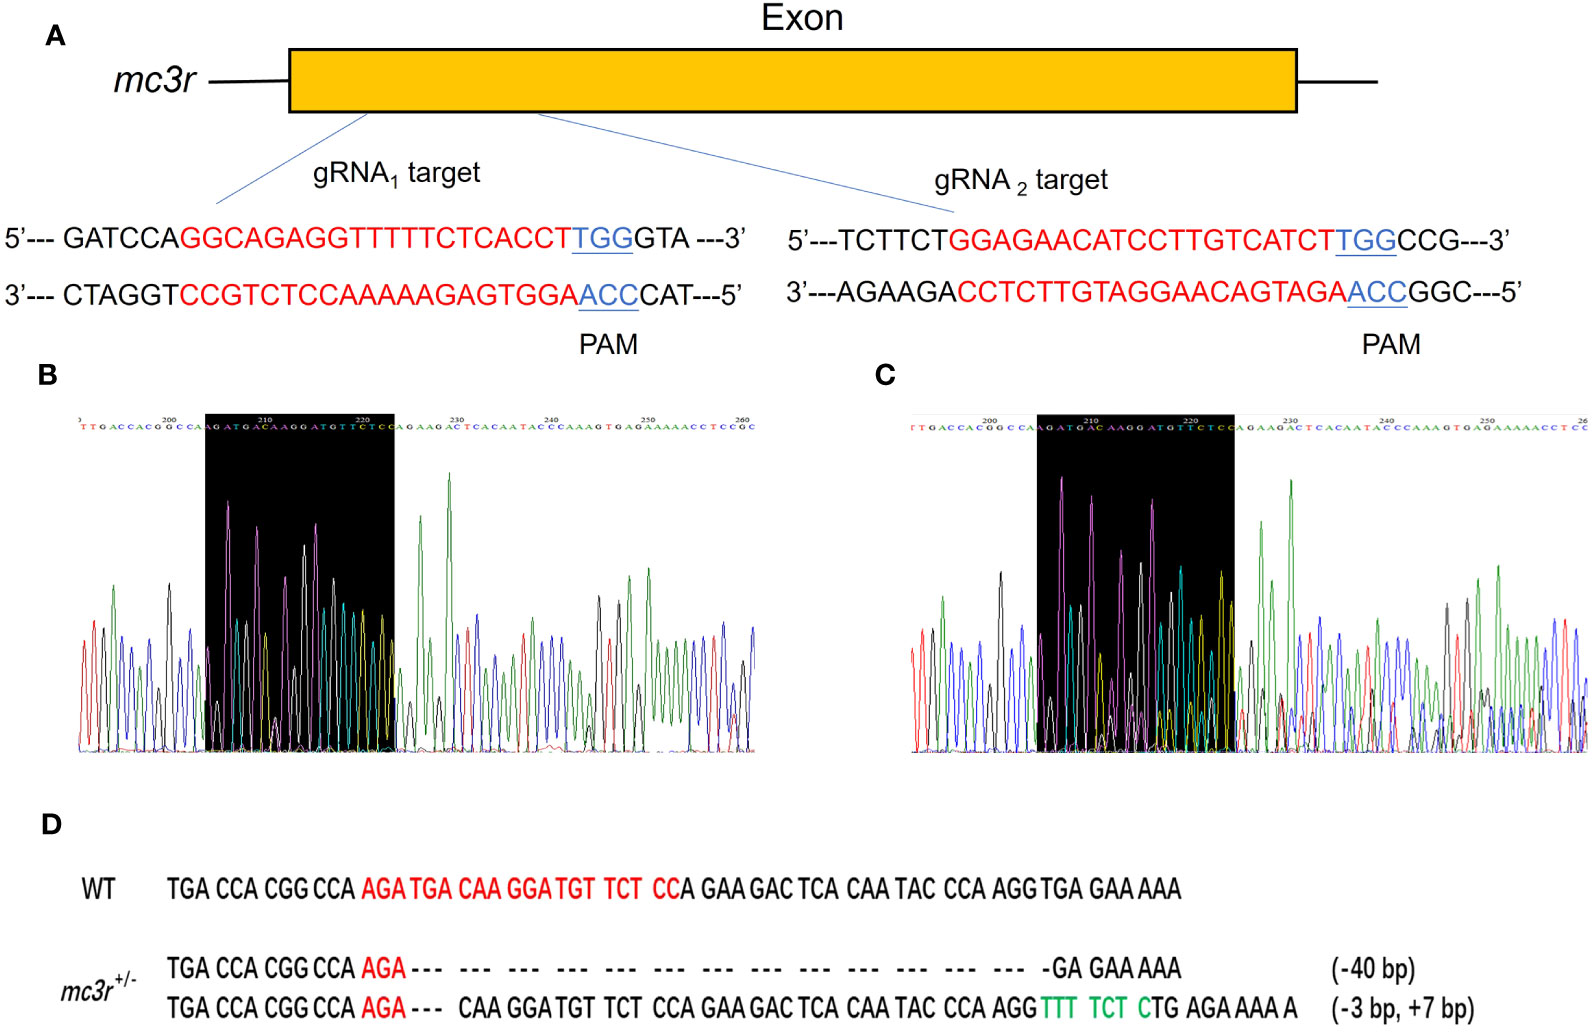
Figure 5 Generation of mc3r-deficient RCC with the CRISPR/Cas9 system. (A) Schematic representation of two genomic target sites on exon, respectively. The guide RNA target sites are indicated in red followed by PAM (Protospacer adjacent motif, NGG) in blue. (B) The Sanger sequencing result of WT. The black-shaded box denotes target site. (C) The Sanger sequencing result of mc3r+/− fish. The black-shaded box denotes target site. Multiple peaks occurred near the target sites. (D) DNA sequences of the mutants. Red sequences represent the guide RNA target sites, green sequences represent insertions, dashed lines represent deletions, and each dash corresponds to a nucleotide.
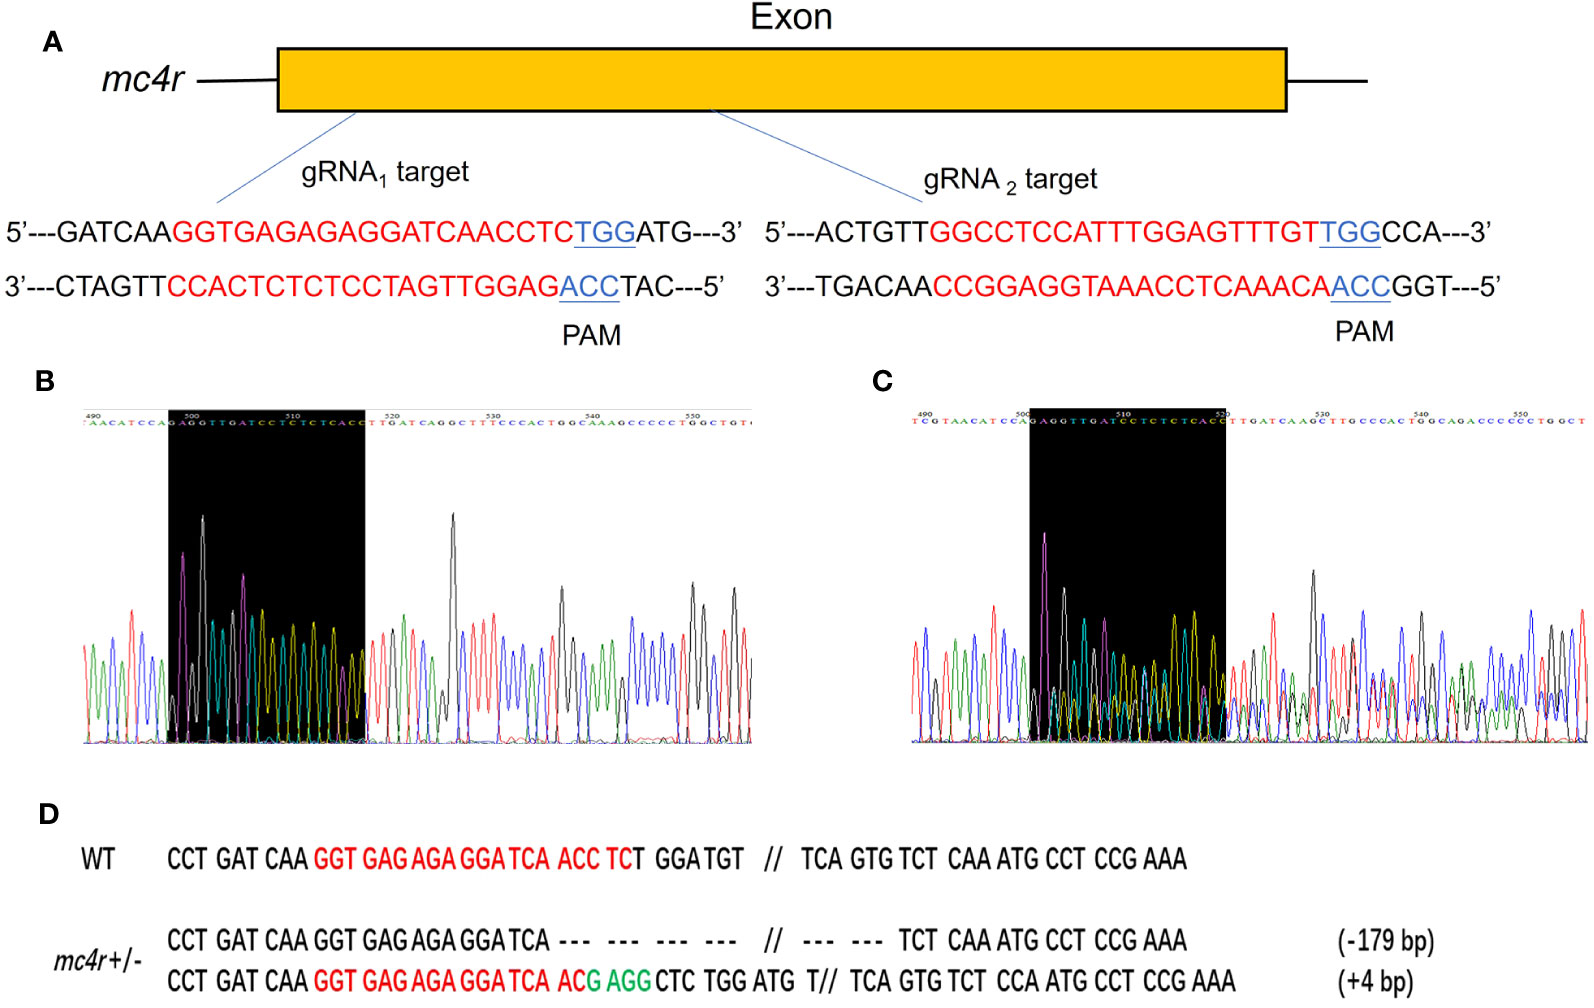
Figure 6 Generation of mc4r-deficient RCC with the CRISPR/Cas9 system. (A) Schematic representation of two genomic target sites on exon, respectively. The guide RNA target sites are indicated in red followed by PAM (Protospacer adjacent motif, NGG) in blue. (B) The Sanger sequencing result of WT. The black-shaded box denotes target site. (C) The Sanger sequencing result of mc4r+/− fish. The black-shaded box denotes target site. Multiple peaks are occurred near the target sites. (D) DNA sequences of the mutants. Red sequences represent the guide RNA target sites, green sequences represent insertions, double slash indicates that there is a large deletion, dashed lines represent deletions, and each dash corresponds to a nucleotide.
All individuals were fed in the tanks (height is 86 cm, diameter is 101 cm) with the same environment and fed twice a day at 9 a.m. and 5 p.m. The data of average body weights, total lengths, and body depths were measured at 6 months after hatching (mah) (Table 1; Figures 7A–C). The average body weights of WT, mc3r+/−, and mc4r+/− fish were 10.91 ± 1.14 g (n = 8), 10.74 ± 0.42 g (n = 8), and 15.22 ± 2.45 g (n = 8), respectively. The average total lengths of WT, mc3r+/−, and mc4r+/− fish were 8.70 ± 0.36 cm (n = 8), 8.72 ± 0.28 cm (n = 8), and 9.55 ± 0.34 cm (n = 8), respectively. The average body depths of WT, mc3r+/−, and mc4r+/− fish were 2.75 ± 0.96 cm (n = 8), 2.78 ± 0.05 cm (n = 8), and 3.18 ± 0.22 cm (n = 8), respectively. The average body weights of mc4r+/− fish were 39.51% and 41.71% heavier than WT and mc3r+/− fish, respectively. The mc4r+/− fish had 9.77% and 9.52% increase in the average total lengths compared with WT and mc3r+/− fish, respectively. In addition, the rates of increase in the average body depths of mc4r+/− fish were 15.64% and 14.39% compared to WT and mc3r+/− fish, respectively. In a word, the average body weights, total lengths, and body depths of mc4r+/− fish were significantly higher than WT and mc3r+/− fish, but not between the WT and mc3r+/− fish. It is noted that the food intake of mc4r+/− fish was significantly increased compared to WT and mc3r+/− fish. However, there was no significant difference in food intake between WT and mc3r+/− fish (Figure 7D). In addition, it is more interesting that mc4r+/− fish displayed more visceral fat mass than WT and mc3r+/− fish. mc3r+/− fish also exhibited slightly more visceral fat mass compared to WT (Figures 7E–H). These data suggested that MC3R and MC4R play important roles in growth and lipid synthesis.
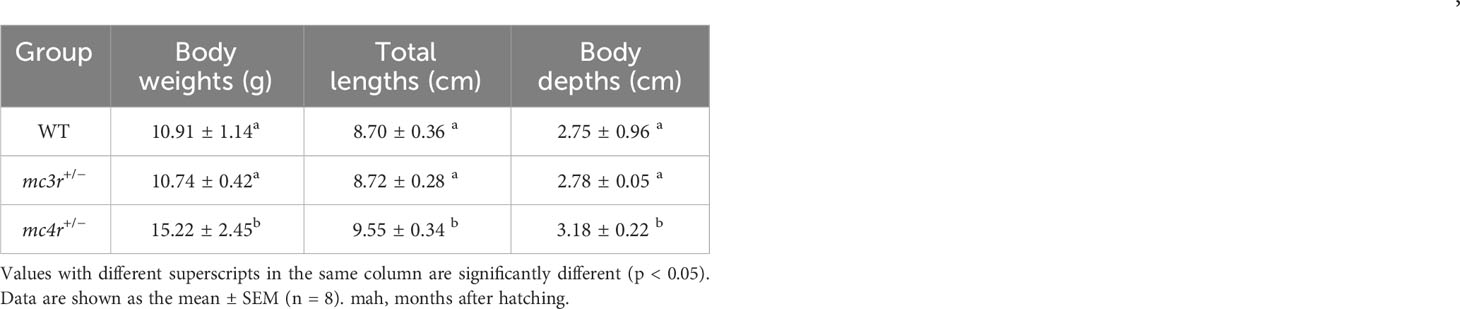
Table 1 Growth performance of WT, mc3r+/−, and mc4r+/− RCC at 6 mah.
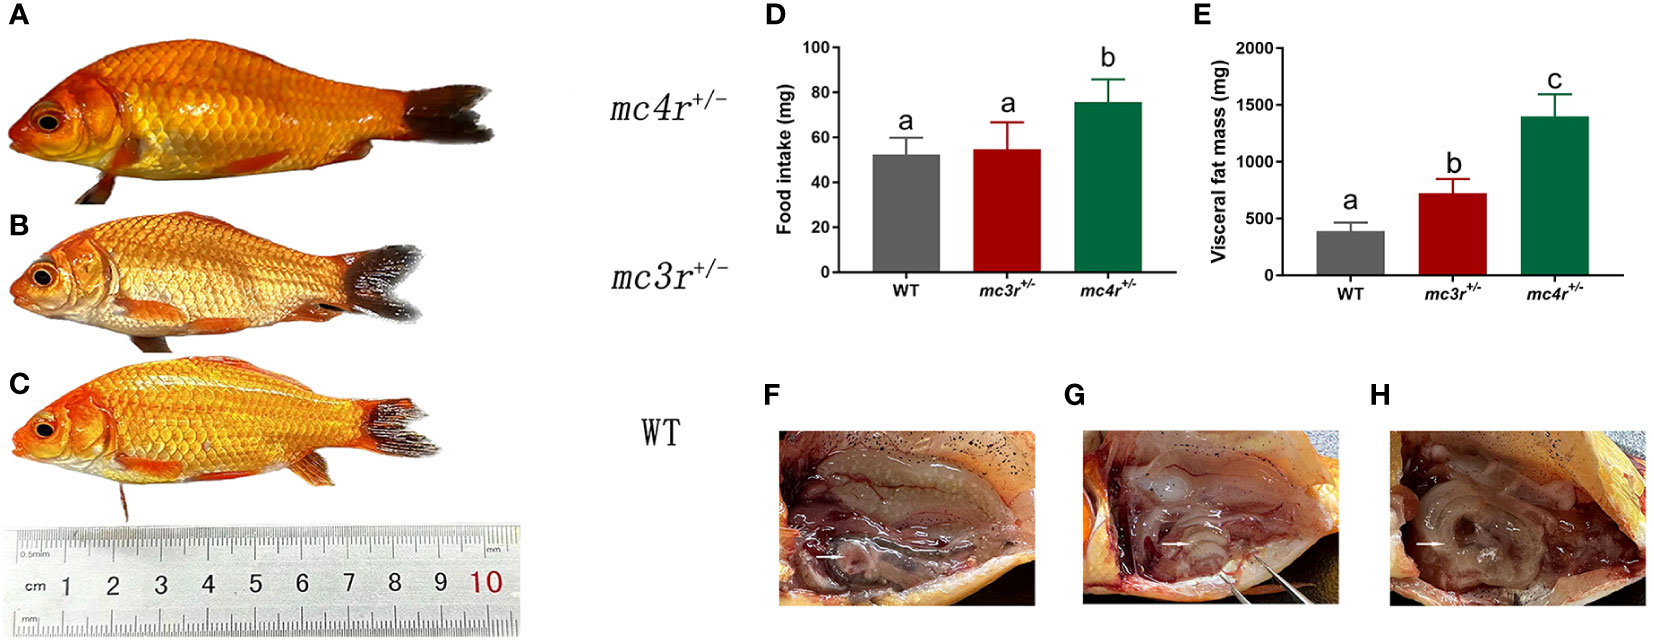
Figure 7 The growth, food intake, and visceral fat mass of WT and mutation fish. (A) The morphological observations of mc4r+/− fish. (B) The morphological observations of mc3r+/− fish. (C) The morphological observations of WT. (D) The food intake of WT, mc3r+/− and mc4r+/− fish. (E) The visceral fat mass of WT, mc3r+/−, and mc4r+/− fish. (F) The anatomical diagram of WT. (G) The anatomical diagram of mc3r+/− fish. (H) The anatomical diagram of mc4r+/− fish. The white arrows in (F–H) point to the visceral adipose tissue. Different letters represent significant differences (p < 0.05). Data are shown as the mean ± SEM.
Transcriptome analysis of RCC WT, mc3r mutation, and mc4r mutation were performed to explain the mechanism of mc3r and mc4r in regulating energy homeostasis. The raw reads of liver and muscle were submitted to NCBI under accession PRJNA1018679 and PRJNA1018689, respectively.
The genes with |log2Fold Change| ≥ 1 and FDR < 0.05 were defined as DEGs. In the liver, there were 1,279 DEGs and 599 DEGs in the mc4r mutation group relative to the WT and mc3r mutation group, respectively, with 458 and 171 upregulated genes and the corresponding amounts of downregulated genes were 821 and 428. A total of 668 DEGs were identified in the mc3r mutation group compared to the WT group, including 317 upregulated genes and 351 downregulated genes (Figures 8A–C). As shown in the Venn diagram, the numbers of overlap DEGs in WT vs. mc3r+/− and WT vs. mc4r+/−, WT vs. mc3r+/− and mc3r+/− vs. mc4r+/−, and WT vs. mc4r+/− and mc3r+/− vs. mc4r+/− were 288, 81, and 178, respectively (Figure 9A).
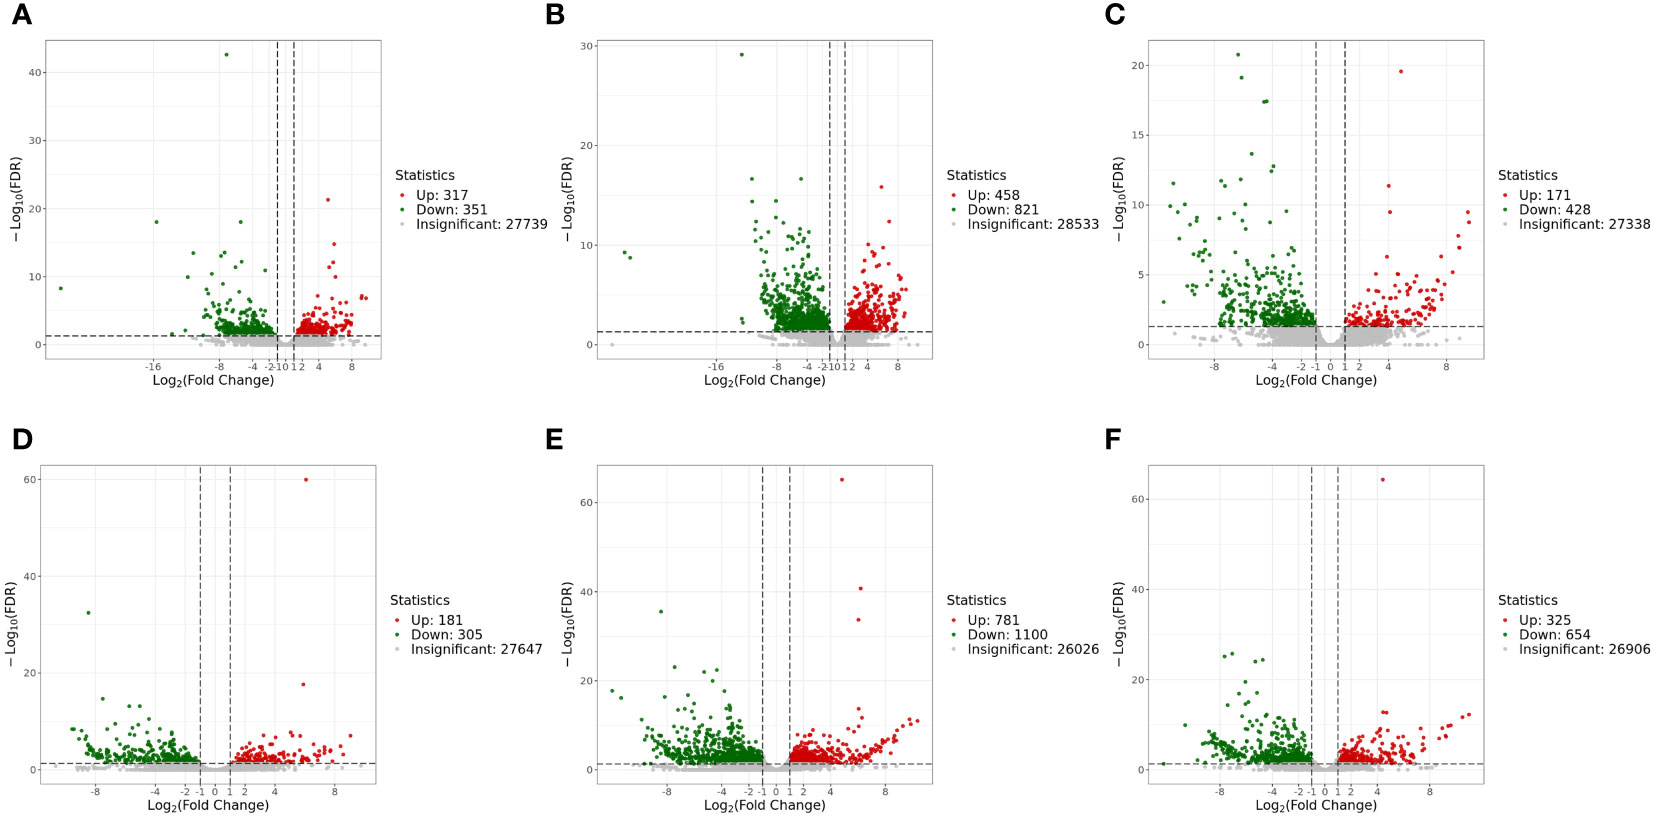
Figure 8 Volcano map of EDGs (n = 3). (A) Volcano map of EDGs between WT and mc3r+/− in liver. (B) Volcano map of EDGS between WT and mc4r+/− in liver. (C) Volcano map of EDGs between mc3r+/− and mc4r+/− in liver. (D) Volcano map of EDGs between WT and mc3r+/− in muscle. (E) Volcano map of EDGs between WT and mc4r+/− in muscle. (F) Volcano map of EDGs between mc3r+/− and mc4r+/− in muscle. Significantly up- and downregulated genes are highlighted in red and green, respectively, and insignificant genes are shown in gray.
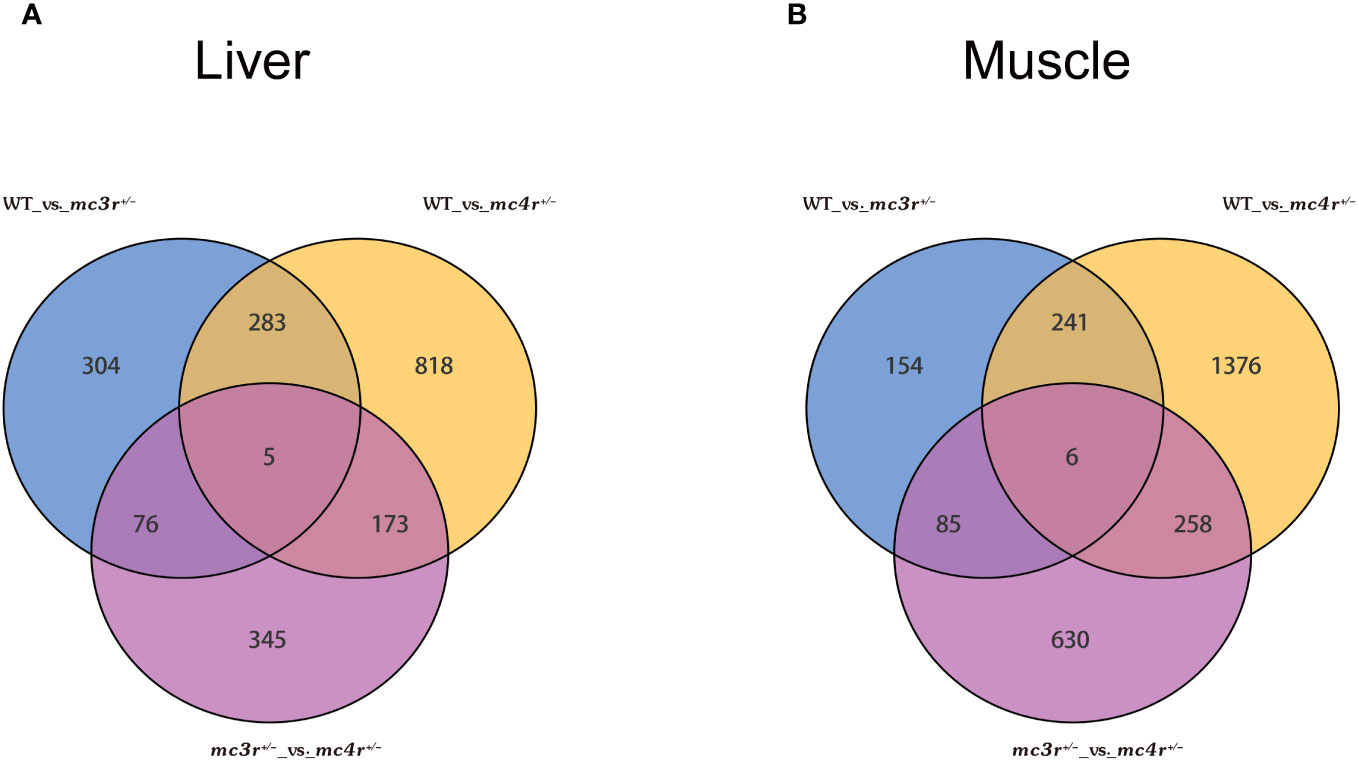
Figure 9 Venn diagram of DEGs (n = 3). (A) Venn diagram comparing the DEGs of WT vs. mc3r+/−, WT vs. mc4r+/−, and mc3r+/− vs. mc4r+/− in liver. (B) Venn diagram comparing the DEGs of WT vs. mc3r+/−, WT vs. mc4r+/−, and mc3r+/− vs. mc4r+/− in muscle. The non-overlapping region represents the unique DEGs for the differential group and the overlapping region represents the shared DEGs for the differential group.
In the muscle, the mc4r mutation group had 1,881 DEGs and 979 DEGs relative to the WT and mc3r mutation group, respectively, including 781 and 325 upregulated genes and 1,100 and 654 downregulated genes. The mc3r mutation group had 486 DEGs compared to the WT group, consisting of 181 upregulated genes and 305 downregulated genes (Figures 8D–F). As shown in the Venn diagram, the numbers of overlap DEGs in WT vs. mc3r+/− and WT vs. mc4r+/−, WT vs. mc3r+/− and mc3r+/− vs. mc4r+/−, and WT vs. mc4r+/− and mc3r+/− vs. mc4r+/− were 247, 91, and 264, respectively (Figure 9B).
GO annotation of DEGs was obtained by Blast2GO, and classified into three categories: biological process (BP), cellular component (CC), and molecular function (MF) (Supplementary Figure 2). Moreover, GO enrichment analysis of the WT vs. mc3r+/−, WT vs. mc4r+/−, and mc3r+/− vs. mc4r+/− in liver and muscle was performed, respectively, and the top 20 enrichment terms are shown in Figure 10.
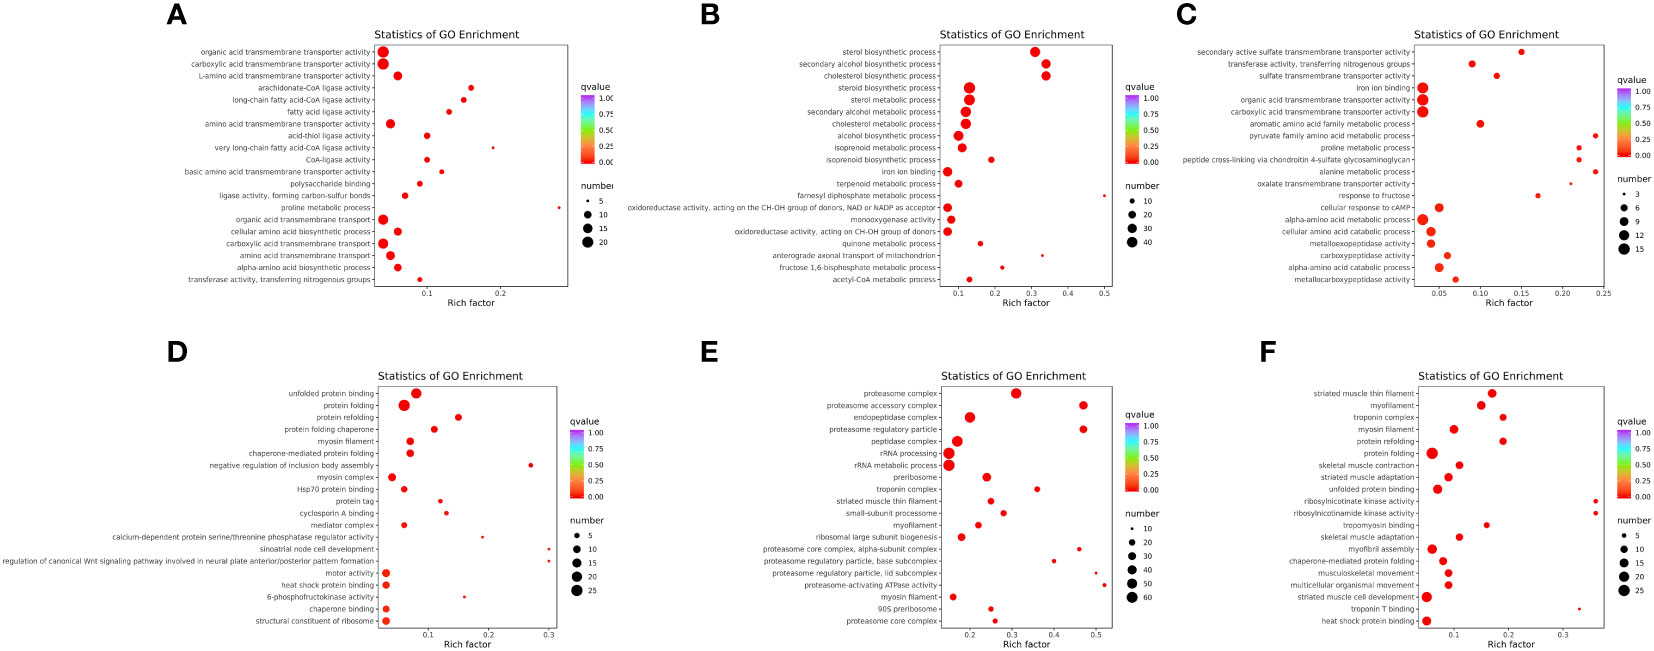
Figure 10 GO enrichment analysis of the DEGs in liver and muscle (n = 3). (A) GO enrichment analysis of the DEGs between WT and mc3r+/− in liver. (B) GO enrichment analysis of the DEGs between WT and mc4r+/− in liver. (C) GO enrichment analysis of the DEGs between mc3r+/− and mc4r+/− in liver. (D) GO enrichment analysis of the DEGs between WT and mc3r+/− in muscle. (E) GO enrichment analysis of the DEGs between WT and mc4r+/− in muscle. (F) GO enrichment analysis of the DEGs between mc3r+/− and mc4r+/− in muscle. The vertical coordinate represents the GO term. The horizontal coordinate represents the Rich factor. The larger the Rich factor, the greater the degree of enrichment. The larger the dot, the greater the number of DEGs enriched in the GO term. The redder the color of the dot, the more significant the enrichment.
In the liver, GO annotation of the three groups showed that most DEGs of the three groups were all annotated into BP and MF (Supplementary Figures 2A–C). GO enrichment analysis of WT vs. mc3r+/− showed that the enriched terms included organic acid transmembrane transporter activity, carboxylic acid transmembrane transporter activity, L-amino acid transmembrane transporter activity, arachidonate-CoA ligase activity, and long-chain fatty acid-CoA ligase activity (Figure 10A). In the WT vs. mc4r+/−, the sterol biosynthetic process, secondary alcohol biosynthetic process, cholesterol biosynthetic process, steroid biosynthetic process, and sterol metabolic process were the most enriched (Figure 10B). In mc3r+/− vs. mc4r+/−, secondary active sulfate transmembrane transporter activity, transferase activity, transferring nitrogenous groups, sulfate transmembrane transporter activity, iron ion binding, and organic acid transmembrane transporter activity were the most enriched (Figure 10C).
In the muscle, GO annotation of the three groups showed that most DEGs of the three groups were all annotated into BP (Supplementary Figures 2D–F). GO enrichment analysis of the WT vs. mc3r+/− showed that the enriched terms included unfolded protein binding, protein folding, protein refolding, protein folding chaperone, and myosin filament (Figure 10D). In the WT vs. mc4r+/−, the enriched terms included proteasome complex, proteasome accessory complex, endopeptidase complex, proteasome regulatory particle, and peptidase complex (Figure 10E). In mc3r+/− vs. mc4r+/−, striated muscle thin filament, myofilament, troponin complex, myosin filament, and protein refolding were the most enriched (Figure 10F).
KEGG is a public pathway-related database, which is widely used to identify the biological pathways of DEGs. In the liver, a total of 122 pathways were enriched in WT vs. mc3r+/−, 23 of which were significantly enriched (p < 0.05), such as metabolic pathways, arginine and proline metabolism, fatty acid biosynthesis, steroid biosynthesis, PPAR signaling pathway, adipocytokine signaling pathway, fatty acid metabolism, fatty acid degradation, and glycolysis/gluconeogenesis (Figure 11A). The representative genes related to lipid, glucose, and energy metabolism were FACL4, fabp7a, LDHA, mthfr, and odc1. In WT vs. mc4r+/−, the DEGs were enriched in 149 pathways, and 34 pathways were significantly enriched (p < 0.05), including steroid biosynthesis, metabolic pathways, terpenoid backbone biosynthesis, carbon metabolism, glycolysis/gluconeogenesis, fructose and mannose metabolism, and PPAR signaling pathway (Figure 11B). The representative genes related to lipid, glucose, and energy metabolism were sc5d, dhcr7, gamt, eno1, eno3, and acat2. In mc3r+/− vs. mc4r+/−, the DEGs were enriched in 117 pathways, and 21 pathways were significantly enriched (p < 0.05), such as metabolic pathways; cysteine and methionine metabolism; glycine, serine, and threonine metabolism; steroid biosynthesis; pyruvate metabolism; and FoxO signaling pathway (Figure 11C). The representative genes related to lipid, glucose, and energy metabolism were pck1, foxo1a, gatm, acot12, and cdo1.
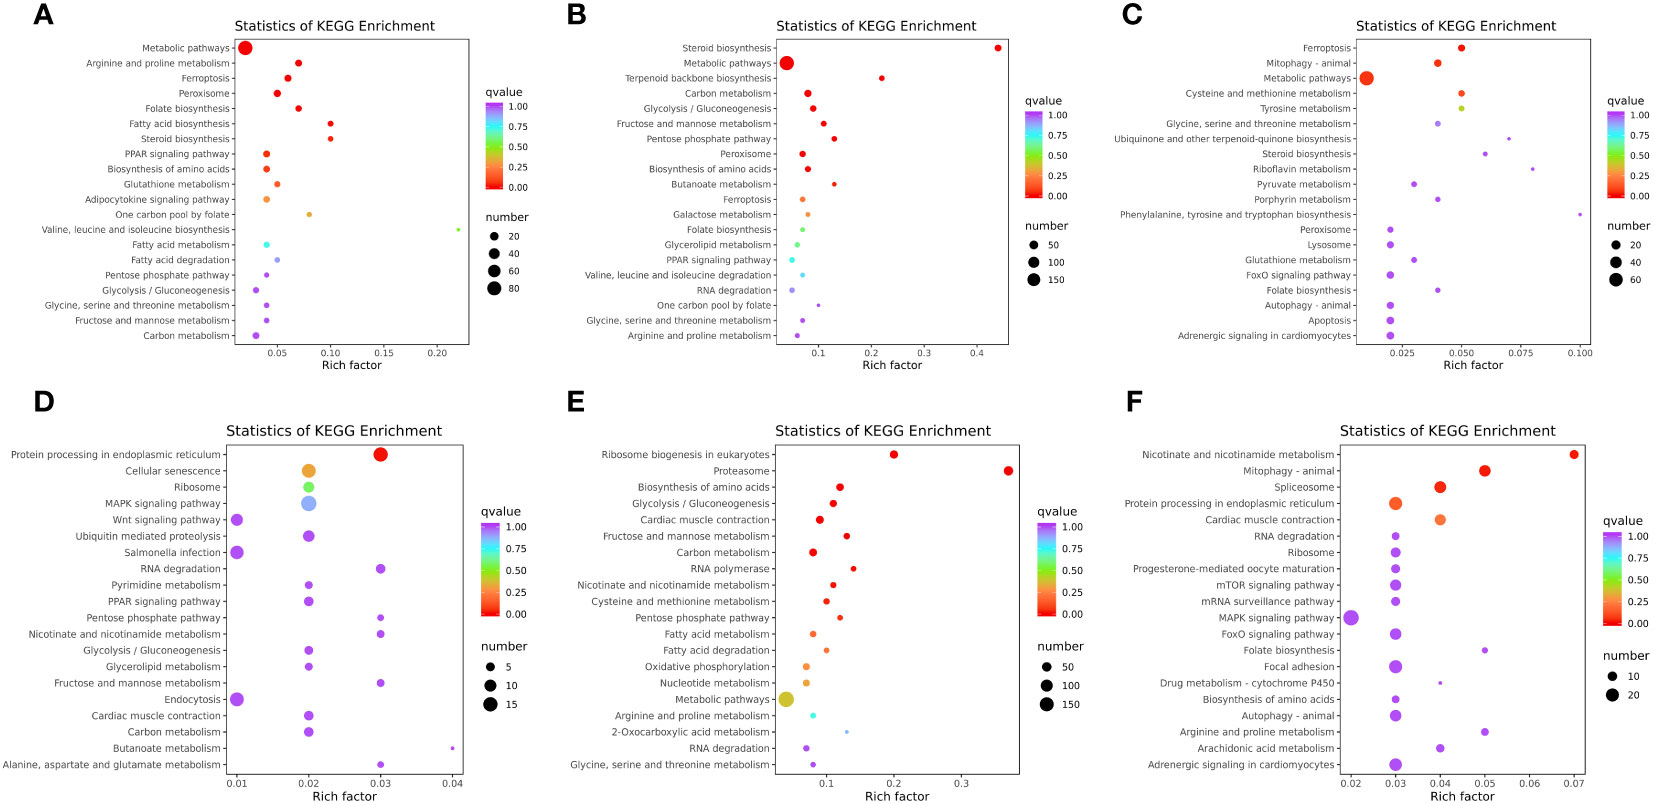
Figure 11 KEGG enrichment analysis of DEGs in liver and muscle (n = 3). (A) KEGG enrichment analysis of the DEGs between WT and mc3r+/− in liver. (B) KEGG enrichment analysis of the DEGs between WT and mc4r+/− in liver. (C) KEGG enrichment analysis of the DEGs between mc3r+/− and mc4r+/− in liver. (D) KEGG enrichment analysis of the DEGs between WT and mc3r+/− in muscle. (E) KEGG enrichment analysis of the DEGs between WT and mc4r+/− in muscle. (F) KEGG enrichment analysis of the DEGs between mc3r+/− and mc4r+/− in muscle. The vertical coordinate represents the GO term. The horizontal coordinate represents the Rich factor. The larger the Rich factor, the greater the degree of enrichment. The larger the dot, the greater the number of DEGs enriched in the GO term. The redder the color of the dot, the more significant the enrichment.
In the muscle, a total of 101 pathways were enriched in WT vs. mc3r+/−, 12 of which were significantly enriched (p < 0.05), such as MAPK signaling pathway, wnt signaling pathway, PPAR signaling pathway, glycolysis/gluconeogenesis, glycerolipid metabolism, and carbon metabolism (Figure 11D). The representative genes related to lipid, glucose, and energy metabolism were DUSP8, irak4, gpam, mgll, and lipg. In WT vs. mc4r+/−, the DEGs were enriched in 152 pathways, and 31 pathways were significantly enriched (p < 0.05), such as the proteasome, biosynthesis of amino acids, glycolysis/gluconeogenesis, carbon metabolism, cysteine and methionine metabolism, fatty acid metabolism, and fatty acid degradation (Figure 11E). The representative genes related to lipid, glucose, and energy metabolism were psma4, psma6, psmb4, acadl, cpt1, cpt2, and mat2b. In mc3r+/− vs. mc4r+/−, the DEGs were enriched in 128 pathways, and 16 pathways were significantly enriched (p < 0.05), such as nicotinate and nicotinamide metabolism, mTOR signaling pathway, MAPK signaling pathway, FoxO signaling pathway, biosynthesis of amino acids, and arginine and proline metabolism (Figure 11F). The representative genes related to lipid, glucose, and energy metabolism were nampta, SGK1, irs1, and IGF-1R.
To verify the dependability of transcriptome data, the DEGs associated to lipid metabolism, glucose metabolism, and amino acid metabolism were selected for qRT-PCR validation in the liver and muscle of the three groups. In the liver, LDHA, eno1, eno3, tgfbr2, nampta, p4ha1, fbp1b, FACL4, and aldob were used for qRT-PCR validation (Figure 12). In muscle, DUSP8, irak4, acadl, rps24, mgll, psma4, psma6, psmb4, and cpt2 were used for qRT-PCR validation (Figure 13). The primers were designed based on transcriptome sequencing data (Supplementary Table 1). Our results showed that all the relative expression levels of the above genes had a similar trend with transcriptome data, indicating the dependability of transcriptome sequencing.
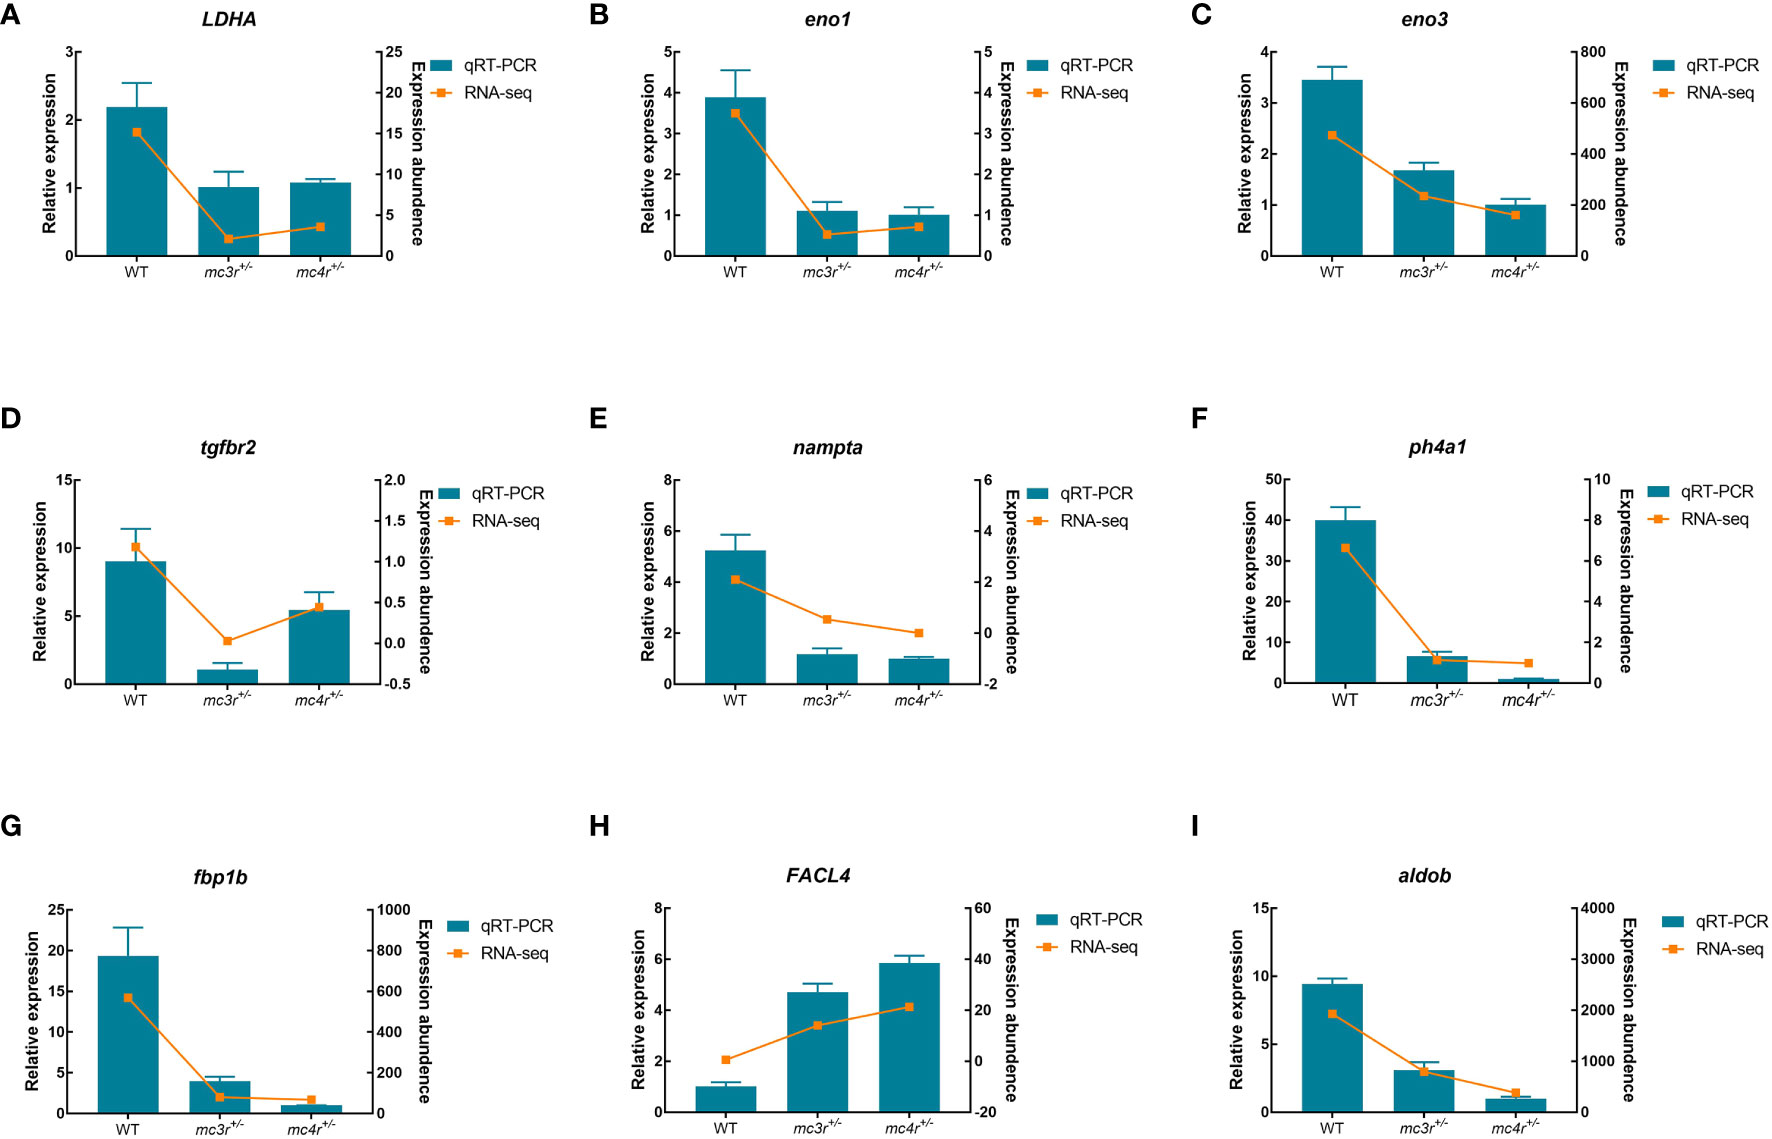
Figure 12 Results of qRT-PCR for nine genes of WT, mc3r+/−, and mc4r+/− in liver. (A) LDHA, (B) eno1, (C) eno3, (D) tgfbr2, (E) nampta, (F) p4ha1, (G) fbp1b, (H) FACL4, and (I) aldob. The β-actin was used as the internal control. The data were shown as the mean ± SEM (n = 3) .
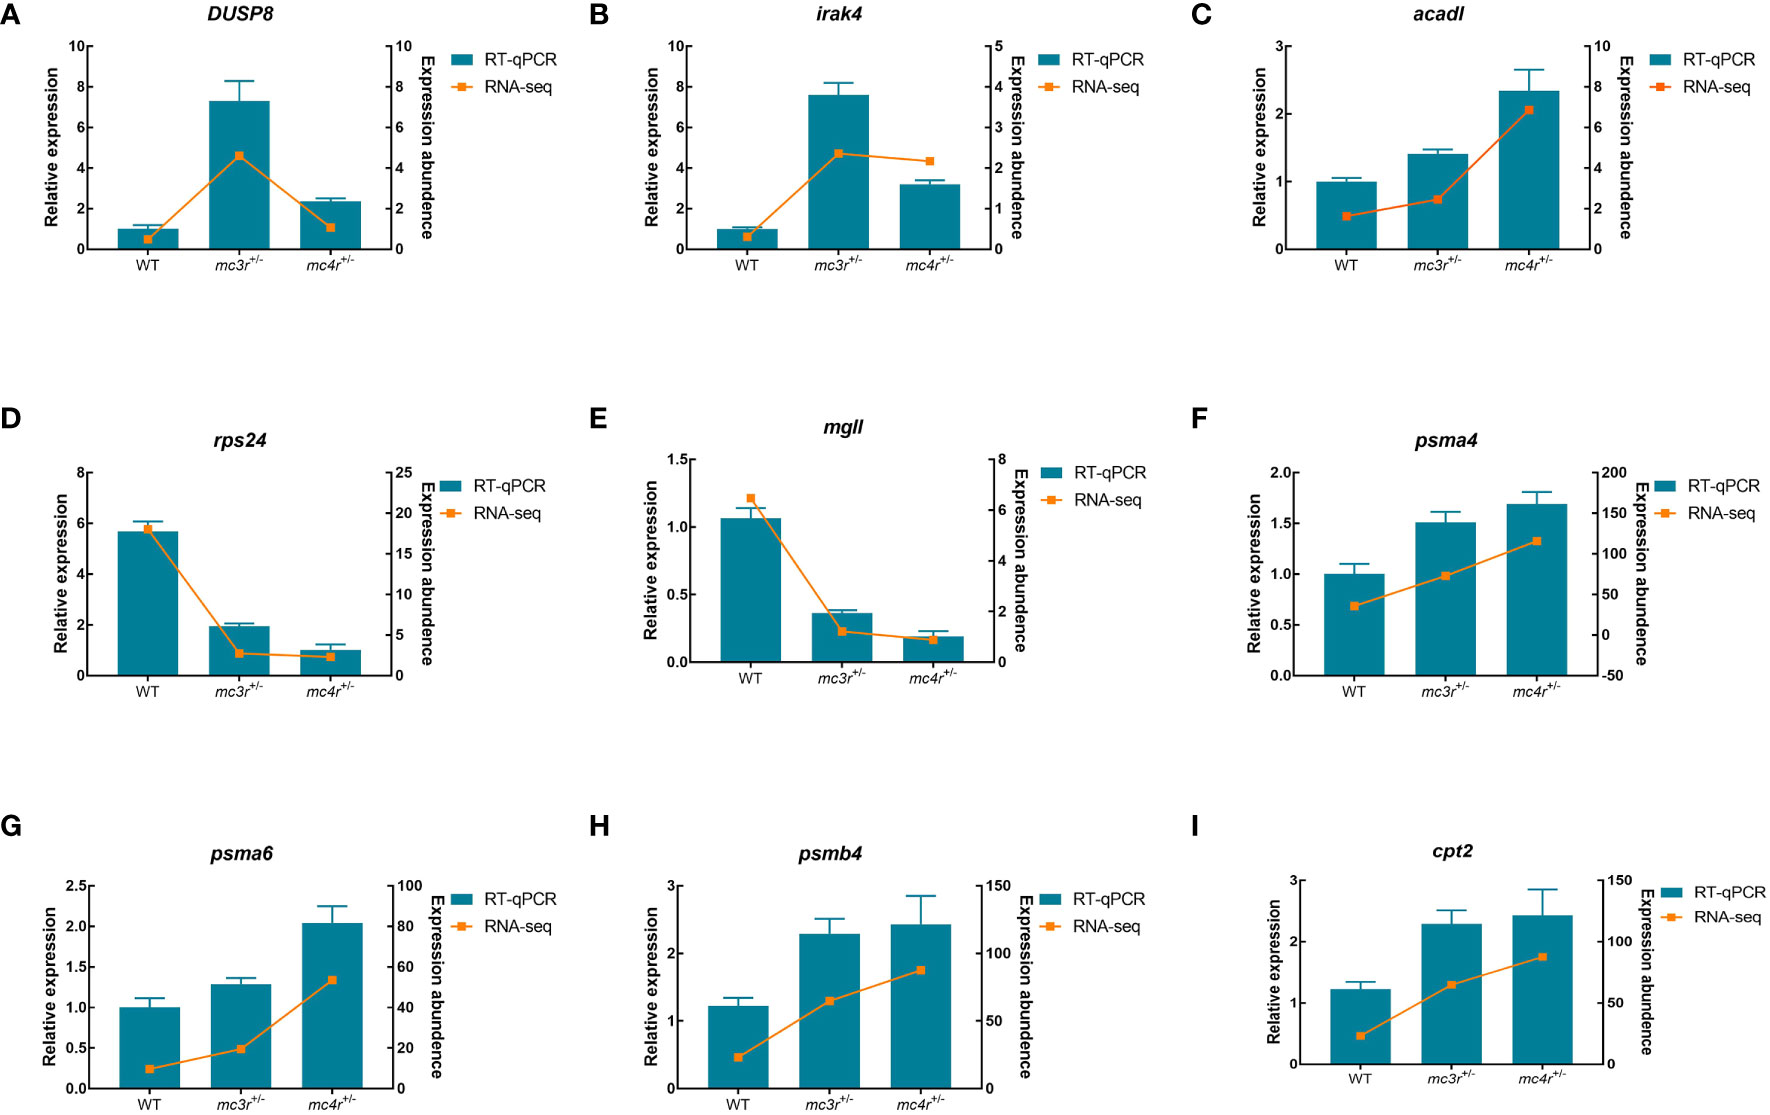
Figure 13 Results of qRT-PCR for nine genes of WT, mc3r+/−, and mc4r+/− in muscle. (A) DUSP8, (B) irak4, (C) acadl, (D) rps24, (E) mgll, (F) psma4, (G) psma6, (H) psmb4, and (I) cpt2. The β-actin was used as the internal control. The data were shown as the mean ± SEM (n = 3).
In the present study, we cloned the full-length cDNAs of mc3r and mc4r in red crucian carp, which were 1,459 bp and 1,894 bp, respectively (Figures 1A and 2A). The mc3r had a 984-bp ORF encoding a putative protein of 327 amino acids and the mc4r had a 981-bp ORF encoding a putative protein of 326 amino acids (Figures 1A and 2A). Multiple sequence alignment revealed that RCC MC3R and MC4R both had seven TMDs and several conserved motifs as other species (Figures 1A and 2A, and Supplementary Figure 1). Phylogenetic analysis showed that MC3R and MC4R clustered with teleost MC3Rs and MC4Rs, individually (Figures 1B and 2B), consistent with previous studies (8, 9, 11, 25). These data indicated that RCC MC3R and MC4R shared high identity levels with MC3Rs and MC4Rs of other species, respectively.
We observed that RCC mc3r and mc4r were highly expressed in the brain, especially in the hypothalamus (Figure 3), indicating their roles in regulating energy homeostasis (9, 11, 25, 26). In addition, mc3r and mc4r were widely expressed in peripherical tissues, especially in the ovary and testis, indicating that they might play a vital function in regulating reproduction. Of note, several studies have confirmed the point that MC4R is associated with reproduction in various species (7, 13, 27–30). However, no data prove that MC3R is involved in regulating reproduction.
To further verify the functions of the central MC3R and MC4R in RCC, we detected the neuronal localization of mc3r and mc4r in the brain by ISH. In the brain, we found that the two receptor transcripts were observed in almost areas of the brain, such as the preoptic area, ventral thalamus, tuberal hypothalamus, and hypothalamic inferior lobe, and the positive signal of mc4r was stronger than mc3r (Figure 4). To our knowledge, the CNS is the center of appetite regulation, involved in regulating feeding, nutrient partitioning, and energy expenditure as in mammals (21, 31, 32). Previous reports have indicated that hormones involved in food intake such as NPY, AGRP, and were highly expressed in brain (33–35). Briefly, the mc3r and mc4r highly expressed in the brain might be associated with appetite regulation like the above hormones. We found that mc4r was extensively expressed in NPP, NPO, NAPv, NAT, NRL, NLTl, and NLTP (Figures 4B, E), consistent with the previous studies in rats and teleost (36–39). Evidence also shows that mc4r is expressed on NPY, GHRH, and AgRP neurons (40), and NPY could stimulate GH secretion (41). Similarly, mc3r was also detected in the same areas of the brain as the distribution of mc4r (Figures 4A, D). The distribution of mc3r is also observed in the hypothalamic arcuate nucleus of mice (42) and mc3r is expressed on POMC, GHSR, and NPY neurons, which are associated with feeding and growth (42, 43). In cyprinid fish, the NPP and NPO are primary corticotrophin-releasing hormone-producing areas (36, 44). The NLT of fish is regarded as a homologue of mammalian arcuate nucleus, which is a crucial receptor of feeding in mammals (40, 45). MC3R and MC4R co-expressed in these areas of the brain indicated that MC3R and MC4R might play crucial roles in regulating feeding and growth of RCC.
To further investigate the effects of MC3R and MC4R in growth, food intake, and energy homeostasis, the RCC mc3r+/− and mc4r+/− were generated by the CRISPR-Cas9 system with microinjection of gRNAs targeting the RCC mc3r and mc4r in conjunction with Cas9 protein. We found that the average body weights, total lengths, body depths, and food intake of mc4r+/− fish were significantly higher than WT and mc3r+/− fish, but there was no significant difference between WT and mc3r+/− fish at 6 mah (Figures 7A–D), indicating that RCC MC4R might play more important roles in growth and food intake than MC3R, consistent with previous studies (3–6, 19, 36). In addition, it is more interesting that RCC mc4r+/− displayed more visceral fat mass than mc3r+/− and WT. RCC mc3r+/− also exhibited slightly more visceral fat mass compared to WT (Figures 7E–H), indicating that MC3R and MC4R played an essential role in lipid accumulation and the role of MC4R was more significant than that of MC3R, consistent with previous studies in mice (3, 46). The mc4r mutants have been researched in several species including fish, pigs, and chickens (3, 47–52). In channel catfish, the body weights of mc4r-deficient fish exhibited 20%–38% improvement compared to WT (49). Holland’s carp containing SNP in the mc4r gene have more predominant growth traits than WT (52). Pigs and chickens containing SNPs in the mc4r gene also have more predominant growth traits than WT (48, 51). In addition, previous studies have proved that the body weights and fats of mc3r-deficient pigs were higher than WT (53). Chickens and blue foxes containing SNPs in the mc3r gene have more predominant growth traits than WT (54, 55). It can be seen that our data were consistent with those of previous studies. These data suggested that MC3R and MC4R were involved in growth regulation and food intake, but MC4R may play more important roles than MC3R. The improved growth in mc3r- and mc4r-deficient RCC might provide a new strategy for aquaculture.
The liver plays crucial roles in regulating glycogen storage, protein synthesis, and hormone production, and muscle is a major effector organ in fish (56, 57). Thus, we obtained and further analyzed the transcriptome sequences of liver and muscle in WT and mc3r- and mc4r-deficient RCC. Results show that a large of DEGs were found in the liver and muscle of WT vs. mc3r+/−, WT vs. mc4r+/−, and mc3r+/− vs. mc4r+/−, and the DEGs mainly enriched in these pathways were related to growth, development, and energy metabolism (Figures 8, 9, and 11). In the liver, we found that mc3r deficiency could lead to the differential expression of the genes compared to WT like FACL4, fabp7a, LDHA, mthfr, and odc1 in RCC. The FACL4 plays an important role in lipid biosynthesis and fatty acid degradation (58). The fabp plays an essential role in intracellular lipid trafficking, and the upregulation of fabp7a can cause lipid accumulation (59–61). The LDHA-deficient mice exhibit moderately elevated body fat (62). The mthfr polymorphisms correlate with high homocysteine levels and subsequent insulin resistance and will cause overweight (63, 64). The odc1-deficient fruit fly exhibits increased number of fat cells and triglycerides (65). mc4r deficiency also led to the differential expression of the genes compared to WT like sc5d, dhcr7, gamt, eno1, eno3, and acat2 in RCC. The sc5d and gamt play crucial roles in growth, lipid synthesis, and cellular metabolism (66, 67). The dhcr7 is involved in steroid synthesis (68). The acat2 is a key gene for fatty acid anabolism (69). The eno1 has been found to be involved in the development, growth, and reproduction of organisms (70), and the eno3 is well known for its functions in energy and lipid metabolism (71). In the mc3r+/− vs. mc4r+/−, there were also some DEGs related to growth, lipid, and glucose metabolism like pck1, foxo1a, gatm, acot12, and cdo1 in RCC. The pck1 is a key gene for lipid metabolism and glucose homeostasis (72). The foxo1a is thought to be involved in controlling food intake (73). The gatm plays vital roles in lipid metabolism and energy homeostasis (67). The acot12 and cdo1 are suggested to be involved in regulating lipogenesis (74, 75).
In muscle, we found that mc3r deficiency could lead to the differential expression of the genes compared to WT like DUSP8, irak4, gpam, mgll, and lipg in RCC. The DUSP8-deficient mice can increase the energy expenditure and thus affect the body weight (76). The irak4 can regulate the secretion of glucagon (77). The gpam is an enzyme in lipid metabolism and is thought to be influenced by the synthesis of triglyceride, cholesterol, and fatty acid contents in bovine mammary epithelial cells (78). The mgll is suggested to be involved in the regulation of lipid and biosynthesis and glycerolipid metabolism (79). The lipg is a member of the triglyceride lipase family and is integrally involved in lipid absorption, transport, and metabolism (80). mc4r deficiency also led to the differential expression of the genes compared to WT like psma4, psma6, psmb4, acadl, cpt1, cpt2, and mat2b in RCC. The psma4 can regulate insulin sensitivity (81). The psma6, mat2b, and psmb4 play essential roles in adipogenesis (82, 83). The acadl, cpt1, and cpt2 are thought to be involved in lipolysis (84–86). In mc3r+/− vs. mc4r+/−, there were also some DEGs related to growth, lipid, and glucose metabolism like nampta, SGK1, irs1, and IGF-1R in RCC. nampta is involved in regulating feeding and energy homeostasis in goldfish (87). SGK1 may be associated with insulin secretion and obesity (88). The decreased expression of irs1 may cause insulin resistance (89). The IGF-1R mutation has been suggested to affect skeletal development and growth in sheep (90). These data suggested that mc3r and mc4r mutations affected the differential expression of these genes involved in growth, lipid, and glucose metabolism, consistent with the above results regarding growth performance and lipid accumulation after mc3r and mc4r mutations in RCC.
In summary, we cloned the full-length cDNAs and analyzed the relative expression of mc3r and mc4r in RCC. Both genes were primarily present in the CNS, and widely present in the periphery. We also detected the localizations of mc3r and mc4r in the brain, and we found that the mc3r-expressing and mc4r-expressing neurons were localized in NPP, NPO, NAPv, NSC, NAT, NRL, NLTP, and NLTl, which were involved in regulating feeding and growth. The average body weights, total lengths, body depths, and food intake of mc4r+/− fish were significantly higher than those of mc3r+/− and WT fish, but there was no significant difference between mc3r+/− and WT fish. However, it is more interesting that RCC mc4r+/− displayed more visceral fat mass than mc3r+/− and WT. RCC mc3r+/− also exhibited slightly more visceral fat mass compared to WT. The data of RNA-seq showed that both mc3r and mc4r knockout affected the differential expression of many genes involved in growth, lipid, and glucose metabolism, indicating that mc3r and mc4r play vital roles in growth, lipid accumulation, lipidolysis, and insulin resistance. These findings laid the foundation for future physiological studies on the functions of mc3r and mc4r that might provide new strategies for improving the growth and aquaculture of teleost.
The datasets presented in this study can be found in online repositories. The names of the repository/repositories and accession number(s) can be found below: https://www.ncbi.nlm.nih.gov/bioproject/PRJNA1018679/, https://www.ncbi.nlm.nih.gov/bioproject/?term=PRJNA1018689, https://www.ncbi.nlm.nih.gov/nuccore/OR573936.1/, and Available at: https://www.ncbi.nlm.nih.gov/nuccore/OR573935. Accession numbers: PRJNA1018679, PRJNA1018679, OR573936, and OR573935.
The animal study was approved by Animal Care Committee of Hunan Normal University and the Administration of Affairs Concerning Experimental Animals of China. The study was conducted in accordance with the local legislation and institutional requirements.
LH: Conceptualization, Data curation, Investigation, Writing – original draft. XD: Data curation, Writing – original draft. XY: Data curation, Writing – original draft. ZT: Data curation, Writing – original draft. SF: Data curation, Writing – original draft. ZZ: Data curation, Writing – original draft. MT: Conceptualization, Data curation, Funding acquisition, Project administration, Writing – review & editing. SL: Conceptualization, Data curation, Funding acquisition, Project administration, Writing – review & editing.
The author(s) declare financial support was received for the research, authorship, and/or publication of this article. This research was supported by the National Natural Science Foundation of China (Grant No. 32293253, 32293252), the Hunan Province Science and Technology Innovation Platform and Talent Program leading talent (Grant No. 2023RC1053), the Postgraduate Science Research Innovation Project of Hunan Province (Grant No. CX20230523), the earmarked fund for China Agriculture Research System (Grant No. CARS-45), 111 Project (D20007).
We would like to thank all participants who contributed to this study. In addition, thank to Tao YX from Auburn University and Ji RL from Harvard University for their reasonable suggestions and careful guidance of the experiment.
The authors declare that the research was conducted in the absence of any commercial or financial relationships that could be construed as a potential conflict of interest.
All claims expressed in this article are solely those of the authors and do not necessarily represent those of their affiliated organizations, or those of the publisher, the editors and the reviewers. Any product that may be evaluated in this article, or claim that may be made by its manufacturer, is not guaranteed or endorsed by the publisher.
The Supplementary Material for this article can be found online at: https://www.frontiersin.org/articles/10.3389/fendo.2023.1310000/full#supplementary-material
Supplementary Figure 1 | Comparison of amino acid sequence between RCC and other species. (A) Comparison of amino acid sequence between RCC MC3R and MC3Rs from other species. (B) Comparison of amino acid sequence between RCC MC4R and MC4Rs from other species. Shaded boxes refer putative TMD1-7. Rectangular boxes denote PMY, DRY, DPxxY motifs. Carassius auratus red var. (red crucian carp, MC3R: OR573936), Cyprinus carpio (common carp, MC3R: XP_042585810.1), Megalobrama amblycephala (wuchang bream, MC3R: XP_048067317.1), Danio rerio (zebrafish, MC3R: AAO24744.1), Culter alburnus (topmouth culter, MC3R: QTW97901.1), Pimephales promelas (fathead minnow, MC3R: XP_039535361.1), Scleropages formosus (asian bonytongue, MC3R: XP_018615783.1), Alligator sinensis (chinese alligator, MC3R: XP_006018246.1), Oryx gazella (southern African gemsbok, MC3R: XP_040103238.1), Mus musculus (mouse, MC3R: AAI03670.1), Gallus gallus (chicken, MC3R: XP_040544507.1), Sus scrofa (pig, MC3R: NP_001116609.1), Equus caballus (horse, MC3R: NP_001243901.1), Felis catus (domestic cat, MC3R: XP_023106851.2), Homo sapiens (human, MC3R: AKI72214.1), Carassius auratus red var. (red crucian carp, MC4R: OR573935), Cyprinus carpio (common carp, MC4R: XP_042630234.1), Megalobrama amblycephala (wuchang bream, MC4R: AWA81516.1), Danio rerio (zebrafish, MC4R: NP_775385.1), Culter alburnus (topmouth culter, MC4R: QKY77175.1), Scatophagus argus (spotted scat, MC4R: AOQ25859.1), Nibea albiflora (white flower croaker, MC4R: KAG8009637.1), Phodopus roborovskii (desert hamster, MC4R: XP_051056768.1), Ovis aries (sheep, MC4R: NP_001119842.1), Capra hircus (goat, MC4R: NP_001272520.1), Gulo gulo luscus (american wolverine, MC4R: KAI5773012.1), Sus scrofa (pig, MC4R: NP_999338.1), Bos taurus (cattle, MC4R: NP_776535.1), Gallus gallus (chicken, MC4R: NP_001026685.2), Homo sapiens (human, MC4R: NP_005903.2).
Supplementary Figure 2 | GO annotation analysis of DEGs in liver and muscle. (A) The result of WT vs. mc3r+/- in liver. (B) The result of WT vs. mc4r+/- in liver. (C) The result of mc3r+/- vs. mc4r+/- in liver. (D) The result of WT vs. mc3r+/- in muscle. (E) The result of WT vs. mc4r+/- in muscle. (F) The result of mc3r+/- vs. mc4r+/- in muscle.
1. Gantz I, Fong TM. The melanocortin system. Am J Physiol Endocrinol Metab. (2003) 284:E468–74. doi: 10.1152/ajpendo.00434.2002
2. Dores RM, Lecaude S. Trends in the evolution of the proopiomelanocortin gene. Gen Comp Endocr (2005) 142(1-2):81–93. doi: 10.1016/j.ygcen.2005.02.003
3. Huszar D, Lynch CA, Fairchild-Huntress V, Dunmore JH, Fang Q, Berkemeier LR, et al. Targeted disruption of the melanocortin-4 receptor results in obesity in mice. Cell. (1997) 88(1):131–41. doi: 10.1016/s0092-8674(00)81865-6
4. Butler AA, Kesterson RA, Khong K, Cullen MJ, Pelleymounter MA, Dekoning J, et al. A unique metabolic syndrome causes obesity in the melanocortin-3 receptor-deficient mouse. Endocrinology. (2000) 141:3518–21. doi: 10.1210/endo.141.9.7791
5. Demidowich AP, Jun JY, Yanovski JA. Polymorphisms and mutations in the melanocortin-3 receptor and their relation to human obesity. BBA-MOL BASIS Dis. (2017) 1863(10):2468–76. doi: 10.1016/j.bbadis.2017.03.018
6. Wang W, Lin YJ, Chen ZX, Guo DY. Identification and characterization of two novel melanocortin-3 receptor mutations in Chinese obese individuals. BBA-MOL BASIS Dis. (2021) 1867(6):166107. doi: 10.1016/j.bbadis.2021.166107
7. Girardet C, Begriche K, Ptitsyn A, Koza RA, Butler AA. Unravelling the mysterious roles of melanocortin-3 receptors in metabolic homeostasis and obesity using mouse genetics. Int J Obes Supplements (2014) 4(1):S37–44. doi: 10.1038/ijosup.2014.10
8. Yang LK, Zhang ZR, Wen HS, Tao YX. Characterization of channel catfish (Ictalurus punctatus) melanocortin-3 receptor reveals a potential network in regulation of energy homeostasis. Gen Comp Endocr (2019) 277:90–103. doi: 10.1016/j.ygcen.2019.03.011
9. Tao M, Ji RL, Huang L, Fan SY, Liu T, Liu SJ, et al. Regulation of melanocortin-4 receptor pharmacology by two isoforms of melanocortin receptor accessory protein 2 in topmouth culter (Culter alburnus). Front Endocrinol. (2020) 11:538. doi: 10.3389/fendo.2020.00538
10. Chandramohan G, Durham N, Sinha S, Norris K, Vaziri ND. Role of γ melanocyte-stimulating hormone–renal melanocortin 3 receptor system in blood pressure regulation in salt-resistant and salt-sensitive rats. Metabolism. (2009) 58(10):1424–9. doi: 10.1016/j.metabol.2009.04.022
11. Ji RL, Huang L, Wang Y, Liu T, Fan SY, Tao M, et al. Topmouth culter melanocortin-3 receptor: regulation by two isoforms of melanocortin-2 receptor accessory protein 2. Endocr Connect (2021) 10(11):1489–501. doi: 10.1530/ec-21-0459
12. Getting SJ, Riffo-Vasquez Y, Pitchford S, Kaneva M, Grieco P, Page CP, et al. A role for MC3R in modulating lung inflammation. Pulm Pharmacol Ther. (2008) 21(6):866–73. doi: 10.1016/j.pupt.2008.09.004
13. Jiang DN, Li JT, Tao YX, Chen HP, Deng SP, Zhu CH, et al. Effects of melanocortin-4 receptor agonists and antagonists on expression of genes related to reproduction in spotted scat. Scatophagus argus. J Comp Physiol B. (2017) 187(4):603–12. doi: 10.1007/s00360-017-1062-0
14. Gantz I, Konda Y, Tashiro T, Shimoto Y, Miwa H, Munzert G, et al. Molecular cloning of a novel melanocortin receptor. J Biol Chem. (1993) 268(11):8246–50. doi: 10.1016/s0021-9258(18)53088-x
15. Zhang C, Forlano Paul M, Cone Roger D. AgRP and POMC neurons are hypophysiotropic and coordinately regulate multiple endocrine axes in a larval teleost. Cell Metab. (2012) 15(2):256–64. doi: 10.1016/j.cmet.2011.12.014
16. Song Y, Cone RD. Creation of a genetic model of obesity in a teleost. FASEB J. (2007) 21(9):2042–9. doi: 10.1096/fj.06-7503com
17. Sebag JA, Zhang C, Hinkle PM, Bradshaw AM, Cone RD. Developmental control of the melanocortin-4 receptor by MRAP2 proteins in zebrafish. Science. (2013) 341(6143):278–81. doi: 10.1126/science.1232995
18. Aspiras AC, Rohner N, Martineau B, Borowsky RL, Tabin CJ. Melanocortin 4 receptor mutations contribute to the adaptation of cavefish to nutrient-poor conditions. P Natl Acad Sci USA. (2015) 112(31):9668–73. doi: 10.1073/pnas.1510802112
19. Schjolden J, Schiöth HB, Larhammar D, Winberg S, Larson ET. Melanocortin peptides affect the motivation to feed in rainbow trout (Oncorhynchus mykiss). Gen Comp Endocr (2009) 160(2):134–8. doi: 10.1016/j.ygcen.2008.11.003
20. Du YY, Yao MX, Yu HX, Mo HL, Yang QY, Yu JJ, et al. Molecular cloning, tissue distribution, and pharmacologic function of melanocortin-3 receptor in common carp (Cyprinus carpio). Gen Comp Endocr (2023) 330:114149. doi: 10.1016/j.ygcen.2022.114149
21. Renquist BJ, Zhang C, Williams SY, Cone RD. Development of an assay for high-throughput energy expenditure monitoring in the zebrafish. Zebrafish. (2013) 10(3):343–52. doi: 10.1089/zeb.2012.0841
22. Livak KJ, Schmittgen TD. Analysis of relative gene expression data using real-time quantitative PCR and the 2 (-Delta Delta C(T)) Method. Methods. (2001) 25(4):402–8. doi: 10.1006/meth.2001.1262
23. Hua R, Yu S, Liu M, Li H. A PCR-based method for RNA probes and applications in neuroscience. Front Neurosci-Switz (2018) 12:266. doi: 10.3389/fnins.2018.00266
24. Ou M, Wang F, Li K, Wu Y, Huang S, Luo Q, et al. Generation of myostatin gene-edited blotched snakehead (Channa maculata) using CRISPR/Cas9 system. Aquaculture. (2023) 563:738988. doi: 10.1016/j.aquaculture.2022.738988
25. Li JT, Yang Z, Chen HP, Zhu CH, Deng SP, Li GL, et al. Molecular cloning, tissue distribution, and pharmacological characterization of melanocortin-4 receptor in spotted scat, Scatophagus argus. Gen Comp Endocr (2016) 230-231:143–52. doi: 10.1016/j.ygcen.2016.04.010
26. Butler AA. The melanocortin system and energy balance. Peptides. (2006) 27(2):281–90. doi: 10.1016/j.peptides.2005.02.029
27. Lampert KP, Schmidt C, Fischer P, Volff JN, Hoffmann C, Muck J, et al. Determination of onset of sexual maturation and mating behavior by melanocortin receptor 4 polymorphisms. Curr Biol. (2010) 20(19):1729–34. doi: 10.1016/j.cub.2010.08.029
28. Zhang Y, Wen HS, Li Y, Lyu LK, Zhang ZX, Wang XJ, et al. Melanocortin-4 receptor regulation of reproductive function in black rockfish (Sebastes schlegelii). Gene. (2020) 741:144541. doi: 10.1016/j.gene.2020.144541
29. Sandrock M, Schulz A, Merkwitz C, Schöneberg T, Spanel-Borowski K, Ricken A. Reduction in corpora lutea number in obese melanocortin-4-receptor-deficient mice. Reprod Biol Endocrin (2009) 7(1):1–9. doi: 10.1186/1477-7827-7-24
30. Van der Ploeg. LHT, Martin WJ, Howard AD, Nargund RP, Austin CP, Guan XM, et al. A role for the melanocortin 4 receptor in sexual function. P Natl Acad Sci USA. (2002) 99(17):11381–6. doi: 10.1073/pnas.172378699
31. Heisler LK, Lam DD. An appetite for life: brain regulation of hunger and satiety. Curr Opin Pharmacol. (2017) 37:100–6. doi: 10.1016/j.coph.2017.09.002
32. Gao Q, Horvath TL. Neurobiology of feeding and energy expenditure. Annu Rev Neurosci. (2007) 30(1):367–98. doi: 10.1146/annurev.neuro.30.051606.094324
33. Volkoff H. The neuroendocrine regulation of food intake in fish: A review of current knowledge. Front Neurosci-Switz (2016) 10:540. doi: 10.3389/fnins.2016.00540
34. Narnaware YK, Peter RE. Effects of food deprivation and refeeding on neuropeptide Y NPY mRNA levels in goldfish. Comp Biochem Phys B. (2001) 129(2-3):633–7. doi: 10.1016/s1096-4959(01)00359-1
35. Huang J, Hao Y, Lai K, Lyu L, Yuan X, Yang G, et al. Neurosecretory protein GL in GIFT tilapia (Oreochromis niloticus): cDNA cloning, tissue distribution and effects of feeding on its expression. Gen Comp Endocr (2022) 327:114096. doi: 10.1016/j.ygcen.2022.114096
36. Cerdá-Reverter JM, Ringholm A, Schiöth HB, Peter RE. Molecular cloning, pharmacological characterization, and brain mapping of the melanocortin 4 receptor in the goldfish: involvement in the control of food intake. Endocrinology. (2003) 144(6):2336–49. doi: 10.1210/en.2002-0213
37. Sánchez E, Rubio VC, Thompson D, Metz J, Flik G, Millhauser GL, et al. Phosphodiesterase inhibitor-dependent inverse agonism of agouti-related protein on melanocortin 4 receptor in sea bass (Dicentrarchus labrax). Am J Physiol-Reg I (2009) 296(5):R1293–306. doi: 10.1152/ajpregu.90948.2008
38. Jangprai A, Boonanuntanasarn S, Yoshizaki G. Characterization of melanocortin 4 receptor in Snakeskin Gourami and its expression in relation to daily feed intake and short-term fasting. Gen Comp Endocr (2011) 173(1):27–37. doi: 10.1016/j.ygcen.2011.04.021
39. Kishi T, Aschkenasi CJ, Lee CE, Mountjoy KG, Saper CB, Elmquist JK. Expression of melanocortin 4 receptor mRNA in the central nervous system of the rat. T J Comp Neurol. (2003) 457(3):213–35. doi: 10.1002/cne.10454
40. Unniappan S, Cerdá-Reverter JM, Peter RE. In situ localization of preprogalanin mRNA in the goldfish brain and changes in its expression during feeding and starvation. Gen Comp Endocr (2004) 136(2):200–7. doi: 10.1016/j.ygcen.2003.12.010
41. Peng C CJ, Yu KL, Wong AO-L, Van Goor F, Peter RE, Rivier JE. Neuropeptide Y stimulates growth hormone and gonadotropin-II secretion in the goldfish pituitary: involvement of both presynaptic and pituitary cell actions. Endocrinology. (1993) 132:1820–9. doi: 10.1210/en.132.4.1820
42. Rediger A, Piechowski CL, Yi CX, Tarnow P, Strotmann R, Grüters A, et al. Mutually opposite signal modulation by hypothalamic heterodimerization of ghrelin and melanocortin-3 receptors. J Biol Chem. (2011) 286(45):39623–31. doi: 10.1074/jbc.M111.287607
43. Cowley MA, Smart JL, Rubinstein M, Cerdan MG, Diano S, Horvath TL, et al. Leptin activates anorexigenic POMC neurons through a neural network in the arcuate nucleus. Nature. (2001) 411(6836):480–4. doi: 10.1038/35078085
44. Olivereau M OF, Vandesande F, Verdonck W. Immunocytochemical identification of CRF-like and SRIF-like peptides in the brain and the pituitary of cyprinid fish. Cell Tissue Res. (1984) 237(2):379–82. doi: 10.1007/bf00217162
45. Cerdá-Reverter JM, Schiöth HB, Peter RE. The central melanocortin system regulates food intake in goldfish. Regul Peptides (2003) 115(2):101–13. doi: 10.1016/s0167-0115(03)00144-7
46. Chen AS, Marsh DJ, Trumbauer ME, Frazier EG, Guan XM, Yu H, et al. Inactivation of the mouse melanocortin-3 receptor results in increased fat mass and reduced lean body mass. Nat Genet. (2000) 26(1):97–102. doi: 10.1038/79254
47. Brouwers B, de Oliveira EM, Marti-Solano M, Monteiro FBF, Laurin S-A, Keogh JM, et al. Human MC4R variants affect endocytosis, trafficking and dimerization revealing multiple cellular mechanisms involved in weight regulation. Cell Rep. (2021) 34(12):108862. doi: 10.1016/j.celrep.2021.108862
48. Yan LJ, Fang XT, Liu Y, Zhang CL, Liu XX, Zhao J, et al. Effects of single and combined genotypes of MC4R and POU1F1 genes on two production traits in Langshan chicken. Mol Biol Rep. (2013) 40(7):4645–50. doi: 10.1007/s11033-013-2558-7
49. Khalil K, Elaswad A, Abdelrahman H, Michel M, Chen W, Liu S, et al. Editing the melanocortin-4 receptor gene in channel catfish using the CRISPR-cas9 system. Fishes. (2023) 8(2):116. doi: 10.3390/fishes8020116
50. Coogan M, Alston V, Su B, Khalil K, Elaswad A, Khan M, et al. Improved growth and high inheritance of melanocortin-4 receptor (mc4r) mutation in CRISPR/cas-9 gene-edited channel catfish. Ictalurus punctatus. Mar Biotechnol. (2022) 24(5):843–55. doi: 10.1007/s10126-022-10146-8
51. Kim KS, Larsen N, Short T, Plastow G, Rothschild MF. A missense variant of the porcine melanocortin-4 receptor (MC4R) gene is associated with fatness, growth, and feed intake traits. Mamm Genome (2000) 11(2):131–5. doi: 10.1007/s003350010025
52. Yang Y, Lan Z, Shu H, Zhou H, Jiang X, Hou L, et al. Association between expression levels and growth trait-related SNPs located in promoters of the MC4R and MSTN genes in. Spinibarbus hollandi. Genes Genom. (2018) 40(11):1119–25. doi: 10.1007/s13258-018-0666-4
53. Yin Y, Hao H, Xu X, Shen L, Wu W, Zhang J, et al. Generation of an MC3R knock-out pig by CRSPR/Cas9 combined with somatic cell nuclear transfer (SCNT) technology. Lipids Health Dis. (2019) 18(1):1–8. doi: 10.1186/s12944-019-1073-9
54. Moazeni SM, Mohammadabadi MR, Sadeghi M, Shahrbabak HM, Esmailizadeh AK. Association of the melanocortin-3(MC3R) receptor gene with growth and reproductive traits in Mazandaran indigenous chicken. Shahid Bahonar Univ Kerman Iranian Soc Anim Science (2016) 4(2):51–6. doi: 10.22103/JLST.2016.1513
55. Yu DY, Wu RZ, Zhao Y, Nie ZH, Wei L, Wang TY, et al. Polymorphisms of four candidate genes and their correlations with growth traits in blue fox (Alopex lagopus). Gene. (2019) 717:143987. doi: 10.1016/j.gene.2019.143987
56. Gomes AV, Sun Y, Huang Y, Hu G, Zhang X, Ruan Z, et al. Comparative transcriptomic study of muscle provides new insights into the growth superiority of a novel grouper hybrid. PloS One. (2016) 11(12):e0168802. doi: 10.1371/journal.pone.0168802
57. Sun Y, Guo CY, Wang DD, Li XF, Xiao L, Zhang X, et al. Transcriptome analysis reveals the molecular mechanisms underlying growth superiority in a novel grouper hybrid (Epinephelus fuscogutatus♀ × E. lanceolatus♂). BMC Genet. (2016) 17(1):1–10. doi: 10.1186/s12863-016-0328-y
58. Cao Y, Traer E, Zimmerman GA, McIntyre TM, Prescott SM. Cloning, expression, and chromosomal localization of human long-chain fatty acid-coA ligase 4 (FACL4). Genomics. (1998) 49(2):327–30. doi: 10.1006/geno.1998.5268
59. Liu L, Zhou Q, Lin C, He L, Wei L. Integrative analyses of gene expression and alternative splicing to gain insights into the effects of copper on hepatic lipid metabolism in swamp eel (Monopterus albus). Aquaculture. (2022) 546:737367. doi: 10.1016/j.aquaculture.2021.737367
60. Cui X, Cui H, Liu L, Zhao G, Liu R, Li Q, et al. Decreased testosterone levels after caponization leads to abdominal fat deposition in chickens. BMC Genomics. (2018) 19(1):1–10. doi: 10.1186/s12864-018-4737-3
61. Ahn J, Lee H, Jung CH, Ha T. Lycopene inhibits hepatic steatosis via microRNA-21-induced downregulation of fatty acid-binding protein 7 in mice fed a high-fat diet. Mol Nutr Food Res. (2012) 56(11):1665–74. doi: 10.1002/mnfr.201200182
62. Feng T, Zhao X, Gu P, Yang W, Wang C, Guo Q, et al. Adipocyte-derived lactate is a signalling metabolite that potentiates adipose macrophage inflammation via targeting PHD2. Nat Commun. (2022) 13(1):5208. doi: 10.1038/s41467-022-32871-3
63. Zhi X, Yang B, Fan S, Li Y, He M, Wang D, et al. Additive interaction of MTHFR C677T and MTRR A66G polymorphisms with being overweight/obesity on the risk of type 2 diabetes. Int J Env Res Pub He (2016) 13(12):1243. doi: 10.3390/ijerph13121243
64. Fu L, Li Y, Luo D, Deng S, Hu YQ. Plausible relationship between homocysteine and obesity risk via MTHFR gene: a meta-analysis of 38,317 individuals implementing Mendelian randomization. Diabetes Metab Synd Ob (2019) 12:1201–12. doi: 10.2147/dmso.S205379
65. Leon KE, Fruin AM, Nowotarski SL, DiAngelo JR. The regulation of triglyceride storage by ornithine decarboxylase (Odc1) in Drosophila. Biochem Bioph Res Co. (2020) 523(2):429–33. doi: 10.1016/j.bbrc.2019.12.078
66. Wang J, Shi R, Yang Q, Chen Z, Wang J, Gong Z, et al. Characterization and potential function of 7-dehydrocholesterol reductase (dhcr7) and lathosterol 5-desaturase (sc5d) in Cynoglossus semilaevis sexual size dimorphism. Gene. (2023) 853:147089. doi: 10.1016/j.gene.2022.147089
67. Zhang X, Tang B, Li J, Ouyang Q, Hu S, Hu J, et al. Comparative transcriptome analysis reveals mechanisms of restriction feeding on lipid metabolism in ducks. Poultry Sci. (2023) 102(10):102963. doi: 10.1016/j.psj.2023.102963
68. Jiang K, Zheng M, Wang Z, Li H, Wang YB, Tian YD, et al. Evolution, expression profile, regulatory mechanism, and functional verification of EBP-like gene in cholesterol biosynthetic process in chickens (Gallus Gallus). Front Genet. (2020) 11:587546. doi: 10.3389/fgene.2020.587546
69. Wang YJ, Bian Y, Luo J, Lu M, Xiong Y, Guo SY, et al. Cholesterol and fatty acids regulate cysteine ubiquitylation of ACAT2 through competitive oxidation. Nat Cell Biol. (2017) 19(7):808–19. doi: 10.1038/ncb3551
70. Ji H, Wang J, Guo J, Li Y, Lian S, Guo W, et al. Progress in the biological function of alpha-enolase. Anim Nutr. (2016) 2(1):12–7. doi: 10.1016/j.aninu.2016.02.005
71. Zappaterra M, Braglia S, Bigi M, Zambonelli P, Davoli R. Comparison of expression levels of fourteen genes involved in the lipid and energy metabolism in two pig breeds. Livest Sci. (2015) 181:156–62. doi: 10.1016/j.livsci.2015.09.007
72. Millward CA, DeSantis D, Hsieh CW, Heaney JD, Pisano S, Olswang Y, et al. Phosphoenolpyruvate carboxykinase (Pck1) helps regulate the triglyceride/fatty acid cycle and development of insulin resistance in mice. J Lipid Res. (2010) 51(6):1452–63. doi: 10.1194/jlr.M005363
73. Li Q, Wen H, Li Y, Zhang Z, Wang L, Mao X, et al. FOXO1A promotes neuropeptide FF transcription subsequently regulating the expression of feeding-related genes in spotted sea bass (Lateolabrax maculatus). Mol Cell Endocrinol. (2020) 517:110871. doi: 10.1016/j.mce.2020.110871
74. Fang X, Zhao Z, Jiang P, Yu H, Xiao H, Yang R. Identification of the bovine HSL gene expression profiles and its association with fatty acid composition and fat deposition traits. Meat Sci. (2017) 131:107–18. doi: 10.1016/j.meatsci.2017.05.003
75. Deng P, Chen Y, Ji N, Lin Y, Yuan Q, Ye L, et al. Cysteine dioxygenase type 1 promotes adipogenesis via interaction with peroxisome proliferator-activated receptor gamma. Biochem Bioph Res Co (2015) 458(1):123–7. doi: 10.1016/j.bbrc.2015.01.080
76. Liu R, Peters M, Urban N, Knowlton J, Napierala T, Gabrysiak J. Mice lacking DUSP6/8 have enhanced ERK1/2 activity and resistance to diet-induced obesity. Biochem Bioph Res Co (2020) 533(1):17–22. doi: 10.1016/j.bbrc.2020.08.106
77. Picard A, Berney X, Castillo-Armengol J, Tarussio D, Jan M, Sanchez-Archidona AR, et al. Hypothalamic Irak4 is a genetically controlled regulator of hypoglycemia-induced glucagon secretion. Mol Metab. (2022) 61:101479. doi: 10.1016/j.molmet.2022.101479
78. Yu H, Iqbal A, Fang X, Jiang P, Zhao Z. Transcriptome analysis of CRISPR/Cas9-mediated GPAM–/– in bovine mammary epithelial cell-line unravelled the effects of GPAM gene on lipid metabolism. Gene. (2022) 834:146574. doi: 10.1016/j.gene.2022.146574
79. Wang C, Huang Y, Liu X, Li L, Xu H, Dong N, et al. Andrographolide ameliorates aortic valve calcification by regulation of lipid biosynthesis and glycerolipid metabolism targeting MGLL expression. Vitro vivo. Cell Calcium (2021) 100:102495. doi: 10.1016/j.ceca.2021.102495
80. Mank-Seymour AR, Durham KL, Thompson JF, Seymour AB, Milos PM. Association between single-nucleotide polymorphisms in the endothelial lipase (LIPG) gene and high-density lipoprotein cholesterol levels. BBA-Mol Cell Biol L (2004) 1636(1):40–6. doi: 10.1016/j.bbalip.2003.12.001
81. Zhang Y, Lan M, Liu C, Wang T, Liu C, Wu S, et al. Islr regulates insulin sensitivity by interacting with Psma4 to control insulin receptor alpha levels in obese mice. Int J Biochem Cell B. (2023) 159:106420. doi: 10.1016/j.biocel.2023.106420
82. Zhang W, Chen Q, Xu L, Cai J, Zhang J. The potential role of PSMA6 in modulating fat deposition in pigs by promoting preadipocyte proliferation and differentiation. Gene. (2021) 769:145228. doi: 10.1016/j.gene.2020.145228
83. Willemsen N, Arigoni I, Studencka-Turski M, Krüger E, Bartelt A. Proteasome dysfunction disrupts adipogenesis and induces inflammation via ATF3. Mol Metab. (2022) 62:101518. doi: 10.1016/j.molmet.2022.101518
84. Dong Y, Lu H, Li Q, Qi X, Li Y, Zhang Z, et al. (5R)-5-hydroxytriptolide ameliorates liver lipid accumulation by suppressing lipid synthesis and promoting lipid oxidation in mice. Life Sci. (2019) 232:116644. doi: 10.1016/j.lfs.2019.116644
85. Mercier J, Nagengast AA, DiAngelo JR. The role of SR protein kinases in regulating lipid storage in the Drosophila fat body. Biochem Bioph Res Co (2023) 649:10–5. doi: 10.1016/j.bbrc.2023.01.093
86. Pereyra AS, Rajan A, Ferreira CR, Ellis JM. Loss of muscle carnitine palmitoyltransferase 2 prevents diet-induced obesity and insulin resistance despite long-chain acylcarnitine accumulation. Cell Rep. (2020) 33(6). doi: 10.1016/j.celrep.2020.108374
87. Butler MJ, Volkoff H. The role of visfatin/NAMPT in the regulation of feeding in goldfish (Carassius auratus). Peptides. (2023) 160:170919. doi: 10.1016/j.peptides.2022.170919
88. Li P, Pan F, Hao Y, Feng W, Song H, Zhu D. SGK1 is regulated by metabolic-related factors in 3T3-L1 adipocytes and overexpressed in the adipose tissue of subjects with obesity and diabetes. Diabetes Res Clin Pr (2013) 102(1):35–42. doi: 10.1016/j.diabres.2013.08.009
89. Zhao S, Wang D, Li Z, Xu S, Chen H, Ding W, et al. FGF15/FGF19 alleviates insulin resistance and upregulates placental IRS1/GLUT expression in pregnant mice fed a high-fat diet. Placenta. (2021) 112:81–8. doi: 10.1016/j.placenta.2021.07.286
Keywords: red crucian carp, MC3R, MC4R, CRISPR/Cas9 system, energy homeostasis
Citation: Huang L, Deng X, Yang X, Tang Z, Fan S, Zhou Z, Tao M and Liu S (2024) Cloning, distribution, and effects of growth regulation of MC3R and MC4R in red crucian carp (Carassius auratus red var.). Front. Endocrinol. 14:1310000. doi: 10.3389/fendo.2023.1310000
Received: 09 October 2023; Accepted: 27 December 2023;
Published: 23 January 2024.
Edited by:
Yong Zhu, East Carolina University, United StatesReviewed by:
Ciaran Shaughnessy, Oklahoma State University, United StatesCopyright © 2024 Huang, Deng, Yang, Tang, Fan, Zhou, Tao and Liu. This is an open-access article distributed under the terms of the Creative Commons Attribution License (CC BY). The use, distribution or reproduction in other forums is permitted, provided the original author(s) and the copyright owner(s) are credited and that the original publication in this journal is cited, in accordance with accepted academic practice. No use, distribution or reproduction is permitted which does not comply with these terms.
*Correspondence: Min Tao, bWlubWluZGl1QDEyNi5jb20=; Shaojun Liu, bHNqQGh1bm51LmVkdS5jbg==
†These authors have contributed equally to this work
Disclaimer: All claims expressed in this article are solely those of the authors and do not necessarily represent those of their affiliated organizations, or those of the publisher, the editors and the reviewers. Any product that may be evaluated in this article or claim that may be made by its manufacturer is not guaranteed or endorsed by the publisher.
Research integrity at Frontiers
Learn more about the work of our research integrity team to safeguard the quality of each article we publish.