 Elsa Puerto-Carranza1,2Silvia Nuevo-Casals2Berta Roca-Portella2Berta Mas-Parés1Ariadna Gómez-Vilarrubla3
 Gemma Carreras-Badosa1Maria Niubó3
 Anna Prats-Puig4
 Francis de Zegher5
 Lourdes Ibáñez6,7
 Judit Bassols3*†
 Abel López-Bermejo1,2*†
- 1Pediatric Endocrinology Group, Girona Biomedical Research Institute (IDIBGI), Salt, Spain
- 2Pediatrics, Dr. Trueta University Hospital, Girona, Spain
- 3Maternal-Fetal Metabolic Group, Girona Biomedical Research Institute (IDIBGI), Salt, Spain
- 4University School of Health and Sport (EUSES), University of Girona, Girona, Spain
- 5Department of Development & Regeneration, University of Leuven, Leuven, Belgium
- 6Endocrinology, Pediatric Research Institute, Sant Joan de Déu Children’s Hospital, Esplugues, Barcelona, Spain
- 7Spanish Biomedical Research Centre in Diabetes and Associated Metabolic Disorders (CIBERDEM), ISCIII, Madrid, Spain
Objective: Bilirubin and triglycerides can regulate insulin secretion and glucose uptake. The aim of our study is to analyze associations between total bilirubin (TB) and the bilirubin-to-triglycerides ratio (BTR) with metabolic markers in healthy prepubertal children.
Methods: Subjects were 246 healthy children (mean age 8), of whom 142 (58%) were reevaluated 4 years later (mean age 12). The subjects were stratified according to age into three groups (<7.8 years; 7.8-9.6 years; and >9.6 years; n=82 each) at baseline and into two groups (<12.9 years and ≥12.9 years; n=71 each) at follow-up. Anthropometrics and laboratory parameters [TB and its fractions (direct and indirect bilirubin), triglycerides, HDL-cholesterol, glucose, insulin, HOMA-IR, HOMA-B and glycated hemoglobin (HbA1c)] were assessed at both baseline and follow-up.
Results: TB and BTR showed independent and negative association with baseline and follow-up HbA1c. These associations were stronger for BTR and in the highest age group. No independent associations were observed with HOMA-IR or HOMA-B.
Conclusion: TB and BTR are independently associated with HbA1c and predict its changes over time in healthy children. Our results indicate that TB and BTR may be useful parameters in studies of glucose tolerance in healthy children.
Introduction
Bilirubin is an abundant molecule present in human plasma. It was firstly considered as a toxic waste product and a marker of hepatobiliary disease or the cause of kernicterus and brain damage in neonates. However, later studies showed that high-normal or moderately increased bilirubin levels may have beneficial effects thanks to its anti-oxidant, cytoprotective and anti-inflammatory properties (1, 2). Indeed, several epidemiological studies have suggested inverse associations between bilirubin and metabolic syndrome (3–8) diabetes mellitus (9–11), hypertension (12), coronary artery disease (13) and cardiovascular disease (14).
While bilirubin is a protective factor, dyslipidemia is tightly related to insulin resistance and metabolic syndrome. The effects of insulin resistance on lipoprotein metabolism have been extensively studied; however, there is increasing evidence that hypertriglyceridemia and low HDL cholesterol are possible causes of insulin resistance as well (15, 16).
In children, a number of cross-sectional studies (17–20) have shown that there is an inverse correlation between serum bilirubin, insulin resistance and metabolic syndrome. A positive relationship between triglycerides, insulin resistance and metabolic syndrome has also been reported in healthy children (21, 22) or in obese children (23, 24); however, longitudinal studies that associate total bilirubin (TB) or the bilirubin-to-triglycerides ratio (BTR, derived from the ratio between TB and triglycerides) are lacking. We hypothesize that TB and BTR will be associated with metabolic markers in apparently healthy children and assess this hypothesis in both cross-sectional and longitudinal studies.
Materials and methods
Subjects and ethics
Subjects were 246 healthy children (116 girls and 130 boys, age 8.8 ± 0.1) from a cohort study designed to assess cardiovascular risk factors in children in Northern Spain, of whom 142 (58%) were reevaluated 4 years later (68 girls and 74 boys, age 12.9 ± 0.1). No differences were observed for baseline characteristics between children with and without follow-up. For the purpose of the present study, at baseline the children were categorized into three groups according to tertiles of age: <7.8 years; between 7.8 and 9.6 years; and >9.6 years (n=82 for each group). Because of the smaller sample size, at follow-up the children were categorized into two age groups, according to the median value: < 12.9 years and ≥12.9 years (n=71 for each group).
Inclusion criteria were: 1) Caucasian origin; 2) age between 5 and 12 years at baseline. Exclusion criteria were: 1) major congenital anomalies; 2) evidence of chronic illness or prolonged use of any kind of medication; 3) acute illness or use of medications in the month preceding potential enrollment; 4) bilirubin higher than 1.2 mg/dl; 5) HbA1c higher than 6.5% (48 mmol/mol); 6) triglycerides higher than 200 mg/dl; 7) systolic blood pressure and/or diastolic blood pressure higher than 97th percentile for age, gender and height; 8) HDL cholesterol lower than 35 mg/dl.
The study protocol was approved by the Institutional Review Board of Dr. Josep Trueta Hospital. Informed written consent was obtained from parents.
Clinical and laboratory data
Clinical and laboratory examinations were performed between 8:00 and 9:00 AM. Height was measured with a Harpenden stadiometer (Holtain) and weight was measured wearing light clothes with a calibrated scale (Seca). Body mass index (BMI) was calculated using the formula: weight (kg)/height (meters)2. Weight, height and BMI were transformed to Z-score values using regional data (25). Waist circumference was measured at the umbilical level. Puberty was assessed by a trained nurse using Marshall and Tanner criteria (26, 27). Blood pressure (BP) was measured in the supine position on the right arm after 10 minutes rest using an electronic sphygmomanometer (Dinamap Pro 100, GE Healthcare) with cuff size appropriate for arm circumference and the average of three readings were recorded in each subject.
All serum samples were obtained under fasting conditions. Serum glucose was analyzed by the hexokinase method. Insulin was measured by immunochemiluminiscence (Immulite2000, Siemens); the detection limit was 0.4 mIU/l and the inter- and intra-assay coefficient of variation (CVs) were lower than 10%. Insulin resistance was estimated from fasting insulin and glucose levels using the homeostasis model assessment index (HOMA-IR) calculated with the formula: fasting insulin (µIU/ml) x fasting glucose (mg/dl)/405. Homeostasis model assessment of beta-cell function (HOMA-B) was calculated with the formula: 20 × fasting insulin (µU/ml)/[fasting plasma glucose (mg/dl) – 63]. HbA1c was measured using the standardized method Diabetes Control and Complications Trial (DCCT)/International Federation of Clinical Chemistry (IFCC) (Menarini). Total cholesterol was measured using colorimetric enzymatic method (Cobas 702, Roche); HDL cholesterol was quantified by homogenous method of selective detergent with accelerator (ARCHITECHT, Abbot Laboratories); and LDL was calculated with Fridewald formula. Total serum triglycerides were measured by monitoring the reaction of glycerol-phosphate-oxidase method (ARCHITECTH, Abbot Laboratories); the detection limit was 5 mg/dl and CVs lower than 5%. The triglyceride-to-HDL ratio was calculated as TG divided by HDL. TB and DB were measured using the 2-4 and 2-5 diazoateddichloroaniline method (Roche); the detection limit was 0.1 mg/dl and the CVs lower than 10% for both. IB was obtained by subtracting absolute DB values from absolute TB values. The BTR (%) was calculated as TB value divided by triglycerides value and multiplied by 100.
Statistics
Statistical analyses were performed using SPSS version 22.0 (SPSS Inc, Chicago, IL, USA). Results for Gaussian variables are expressed as mean and SEM and for non-Gaussian variables as median and interquartile range. Non-Gaussian variables were mathematically transformed to logarithm to improve symmetry. Differences in continuous variables among age groups were examined by ANOVA. The relation between variables was analyzed by Pearson correlation followed by multiple regression analysis (the stepwise method being used for computing effect sizes of the observed associations). Significance level was set at p< 0.05. The interaction of age in the association between HbA1c and both TB and BTR was tested using ANCOVA analysis. A relevant interaction was considered with p values < 0.15 (28). Finally, logistic binary regression analyses were used to estimate the odds ratio (OR) and 95% confidence interval (CI) of having a follow-up HbA1c value above 5.3 (the median calculated for the studied subjects) based on baseline TB and BTR values. Receiver operating characteristic (ROC) curve analyses were done to evaluate the usefulness of TB and BTR to predict follow-up HbA1c levels and distinguish between two diagnostic groups (HbA1c≥5.3 and HbA1c<5.3).
Results
Results for clinical and laboratory assessments at baseline (n=246) are described in Supplementary Table 1 in all the studied subjects as a whole and in subgroups thereof according to age tertiles. Follow-up results are shown in Supplementary Table 2 for the whole sample (n=142) and for groups according to median of age. As expected, significant differences were observed among age groups for most clinical data. Total, direct and indirect bilirubin and BTR showed no differences among groups.
Associations between bilirubin and metabolic parameters
Baseline TB levels associated with a more favorable metabolic profile at baseline including lower BMI-SDS, insulin, HOMA-IR, HOMA-B, HbA1c and higher HDL-cholesterol (all p<0.05) (Supplementary Table 3). The association with HbA1c increased progressively across age tertile groups, showing the strongest and significant association in the third tertile (r=−0.334; p=0.002; Supplementary Table 3 and Figure 1). Baseline TB levels also associated with a more favorable metabolic profile at follow-up including lower insulin, HOMA-IR, HOMA-B, HbA1c, triglycerides and TG/HDL (Supplementary Table 3). Again, the association with HbA1c was stronger in the highest age group (r=−0.377; p=0.001; Supplementary Table 3 and Figure 2).
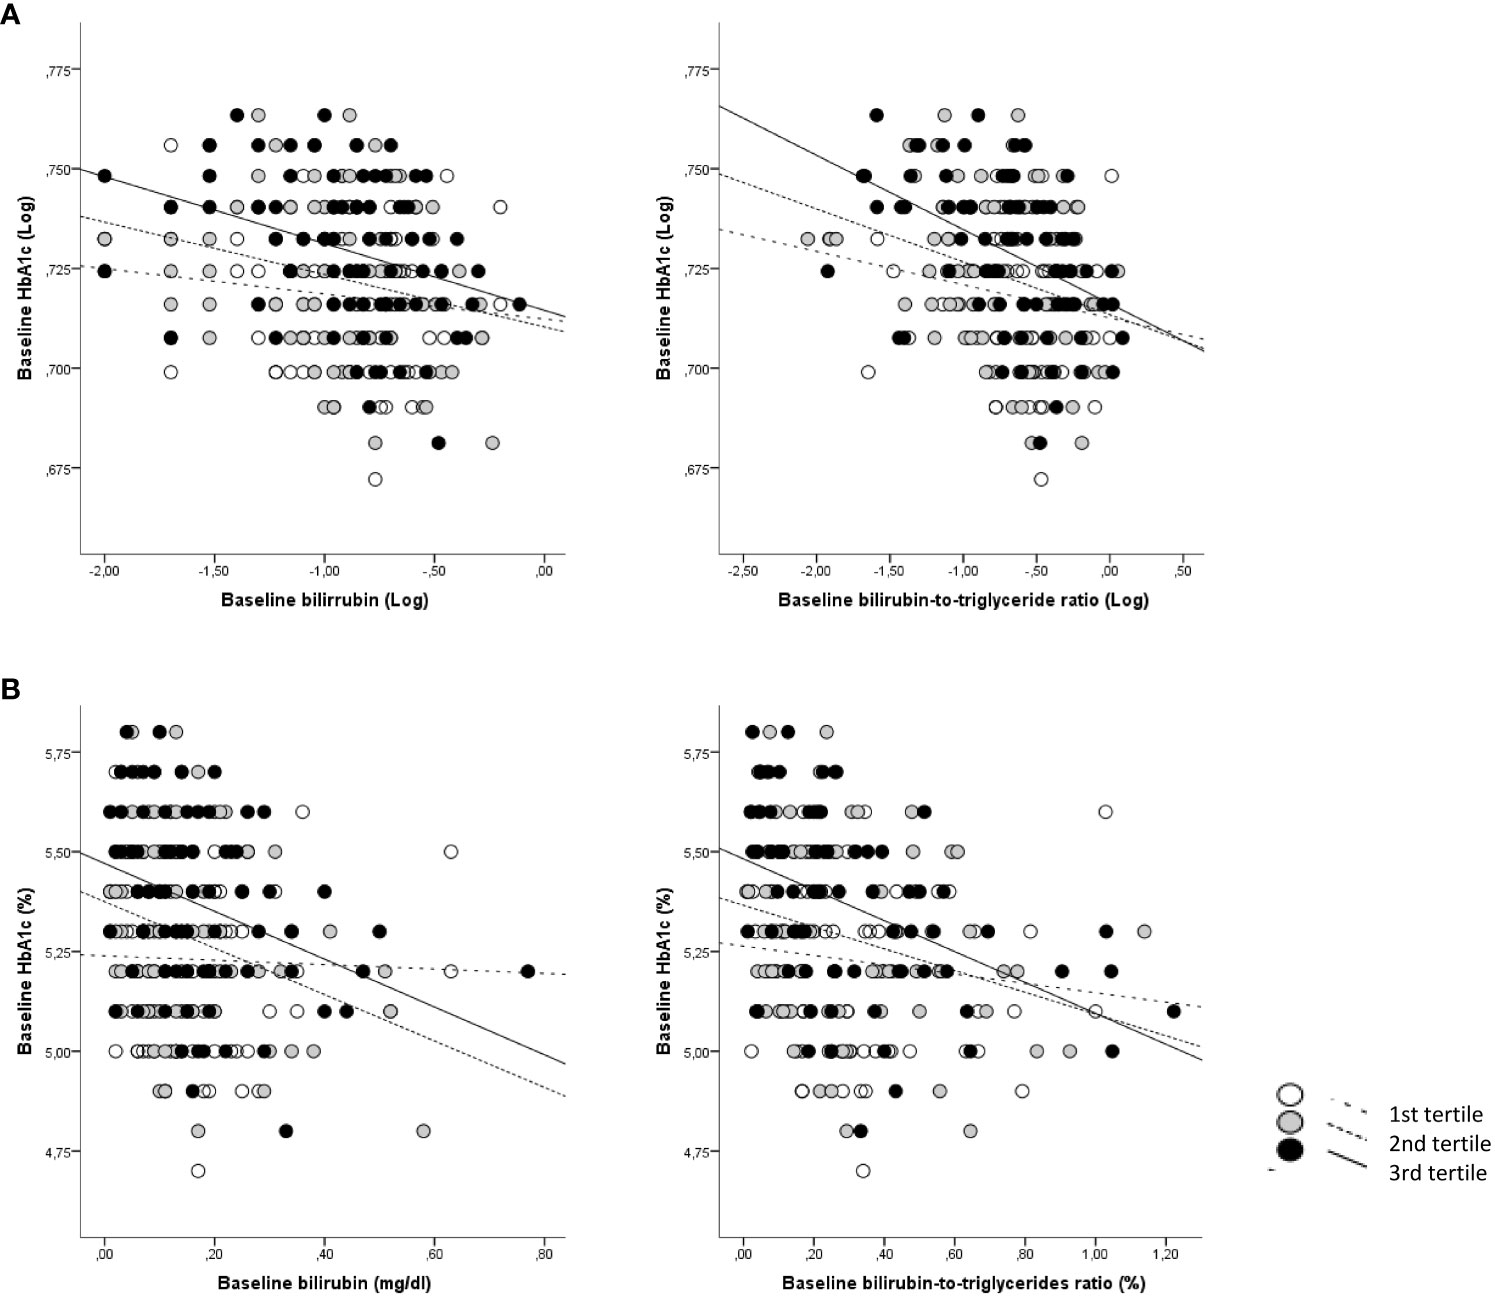
Figure 1 Correlations between baseline total bilirubin and BTR with baseline HbA1c according to age categories. (A) Log-transformed data for bilirubin and BTR are shown; (B) Absolute data for bilirubin and BTR are shown. White dots and dotted lines depict children <7.9 years (1st tertile); grey dots and dashed lines depict children between 7.9 and 9.6 years (2nd tertile) and black dots and solid lines depict children >9.6 years (3rd tertile).
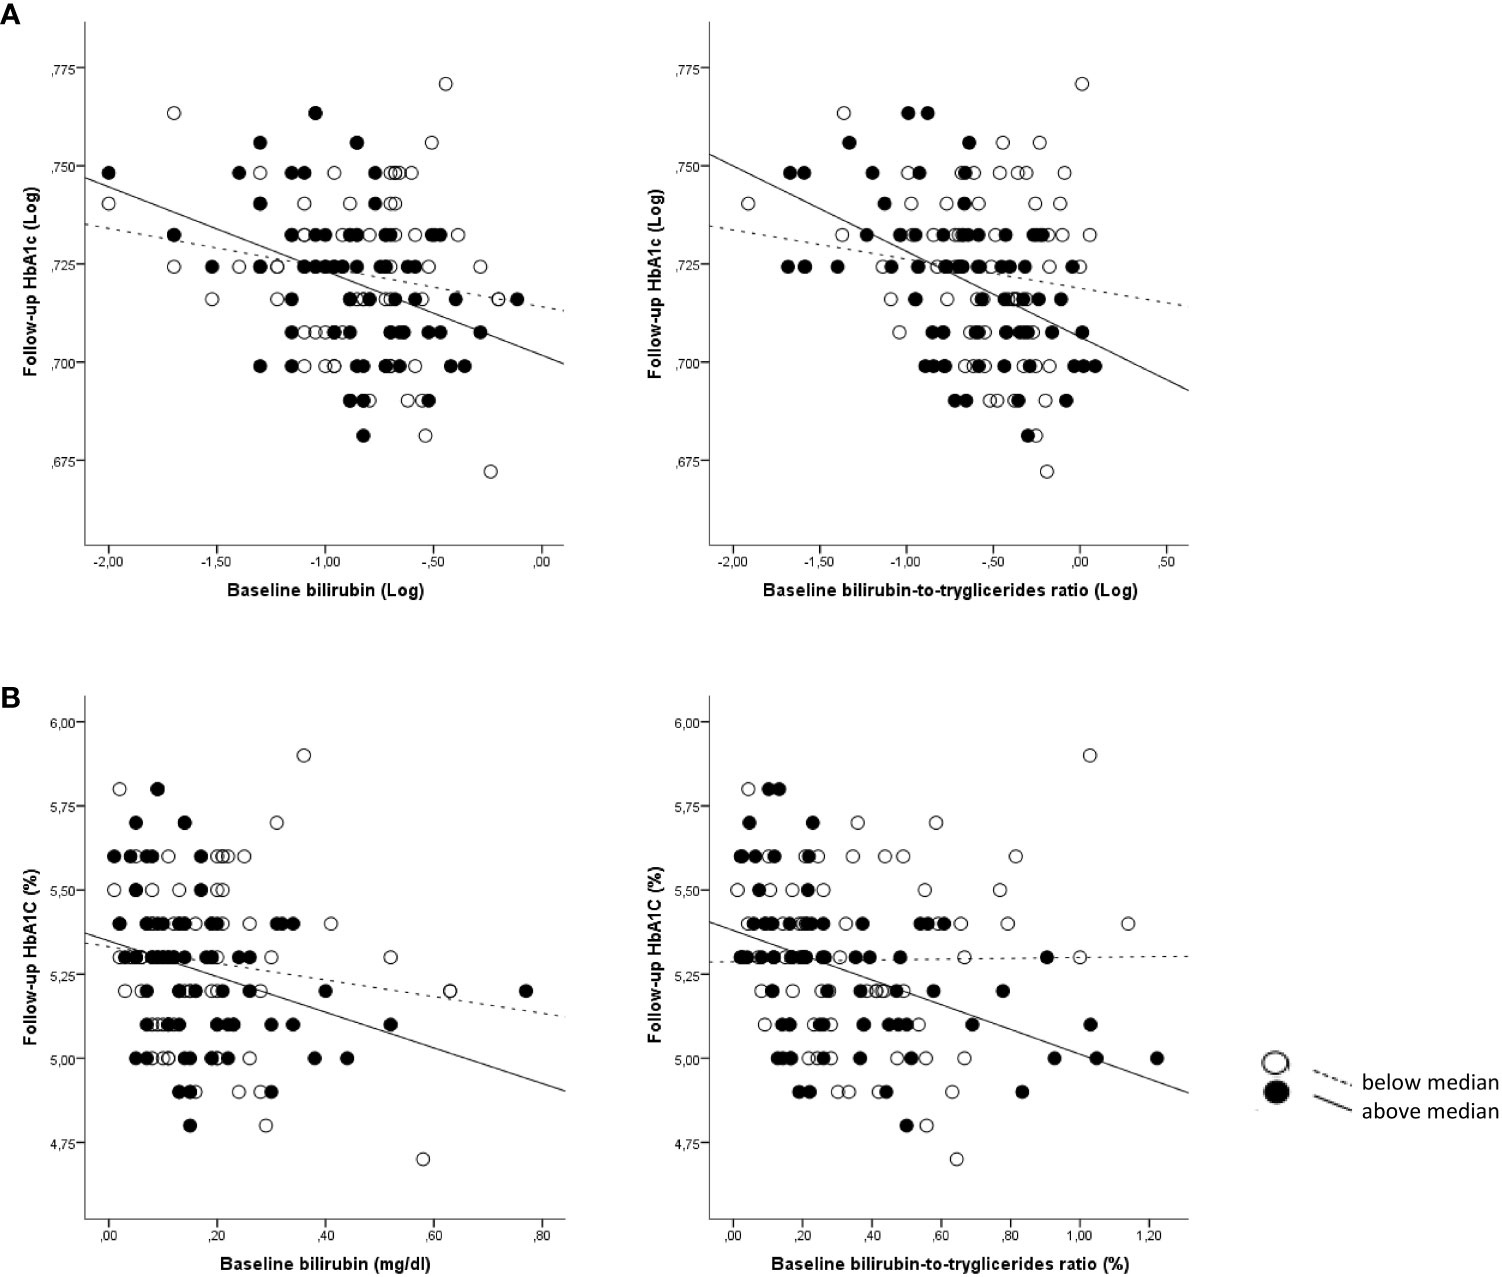
Figure 2 Correlations between baseline bilirubin and BTR with follow-up HbA1c according to age categories. (A) Log-transformed data for bilirubin and BTR are shown; (B) Absolute data for bilirubin and BTR are shown. White dots and dotted lines depict children <12.9 years (below median) and black dots and solid lines depict children >12.9 years (above median).
In multivariate linear regression analyses adjusting for confounding variables (age, gender, puberty, BMI, waist, HOMA-IR), baseline TB showed independent associations with baseline HbA1c (β= −0.220; p=0.001; R2 = 3.9%) (Table 1). This independent association proved to be stronger in the 2nd age tertile (β= −0.284; p=0.019; R2 = 6.7%) and especially so in the 3rd age tertile (β= −0.284; p=0.019; R2 = 10.1%). In the follow-up sample, baseline TB was an independent predictor of follow-up HbA1c (β= −0.275; p=0.002; R2 = 6.8%) after adjusting for the same confounding variables (Table 1). This association with HbA1c was stronger in the higher age group (β= −0.417; p=0.002; R2 = 15.8%). The effect sizes of the observed associations were as follows: per each 1 unit-increase in baseline total bilirubin (mg/dL), follow-up HbA1c decreased by 0.4% ± 0.2 (p=0.018) in the total population, and by 0.5% ± 0.2 (p=0.019) in the higher age group (Supplementary Table 4).
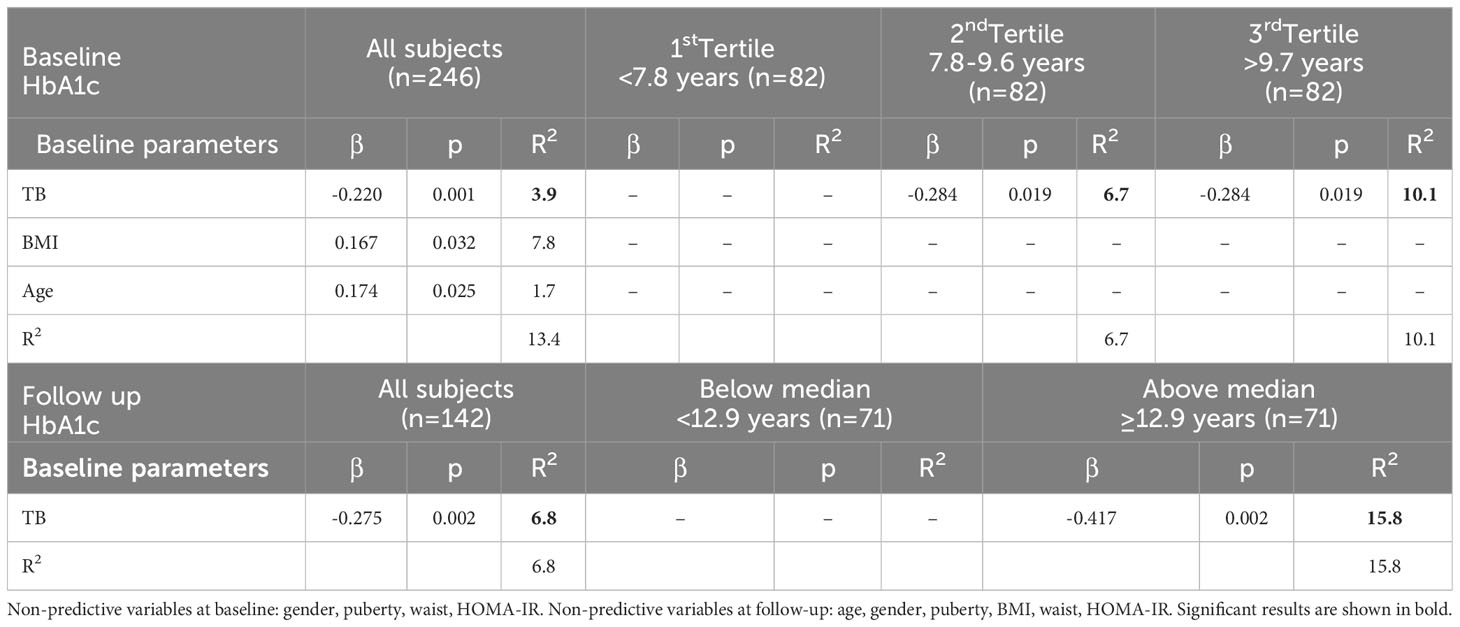
Table 1 Multivariate linear models of baseline and follow-up HbA1c as dependent variable and TB as independent variable in the studied subjects as a whole and in subgroups thereof according to age.
No independent associations were found between baseline bilirubin fractions and either baseline or follow-up HbA1c or with any of the bilirubin measurement and either HOMA-IR or HOMA-B at baseline or follow-up.
In a logistic binary regression analysis, the OR for having a follow-up HbA1c value > 5.3% (34 mmol/mol) (i.e., the median value for all the studied subjects) was 0.337 (95% CI 0.163-0.697; p=0.003) in subjects with baseline TB above the median for the whole group, adjusted for baseline age and BMI. In ROC curve analysis, TB was found to have an acceptable discriminatory accuracy for follow-up HbA1c prediction in all subjects (AUC of 0.658) and in the higher age group (AUC of 0.726) (Figure 3A).
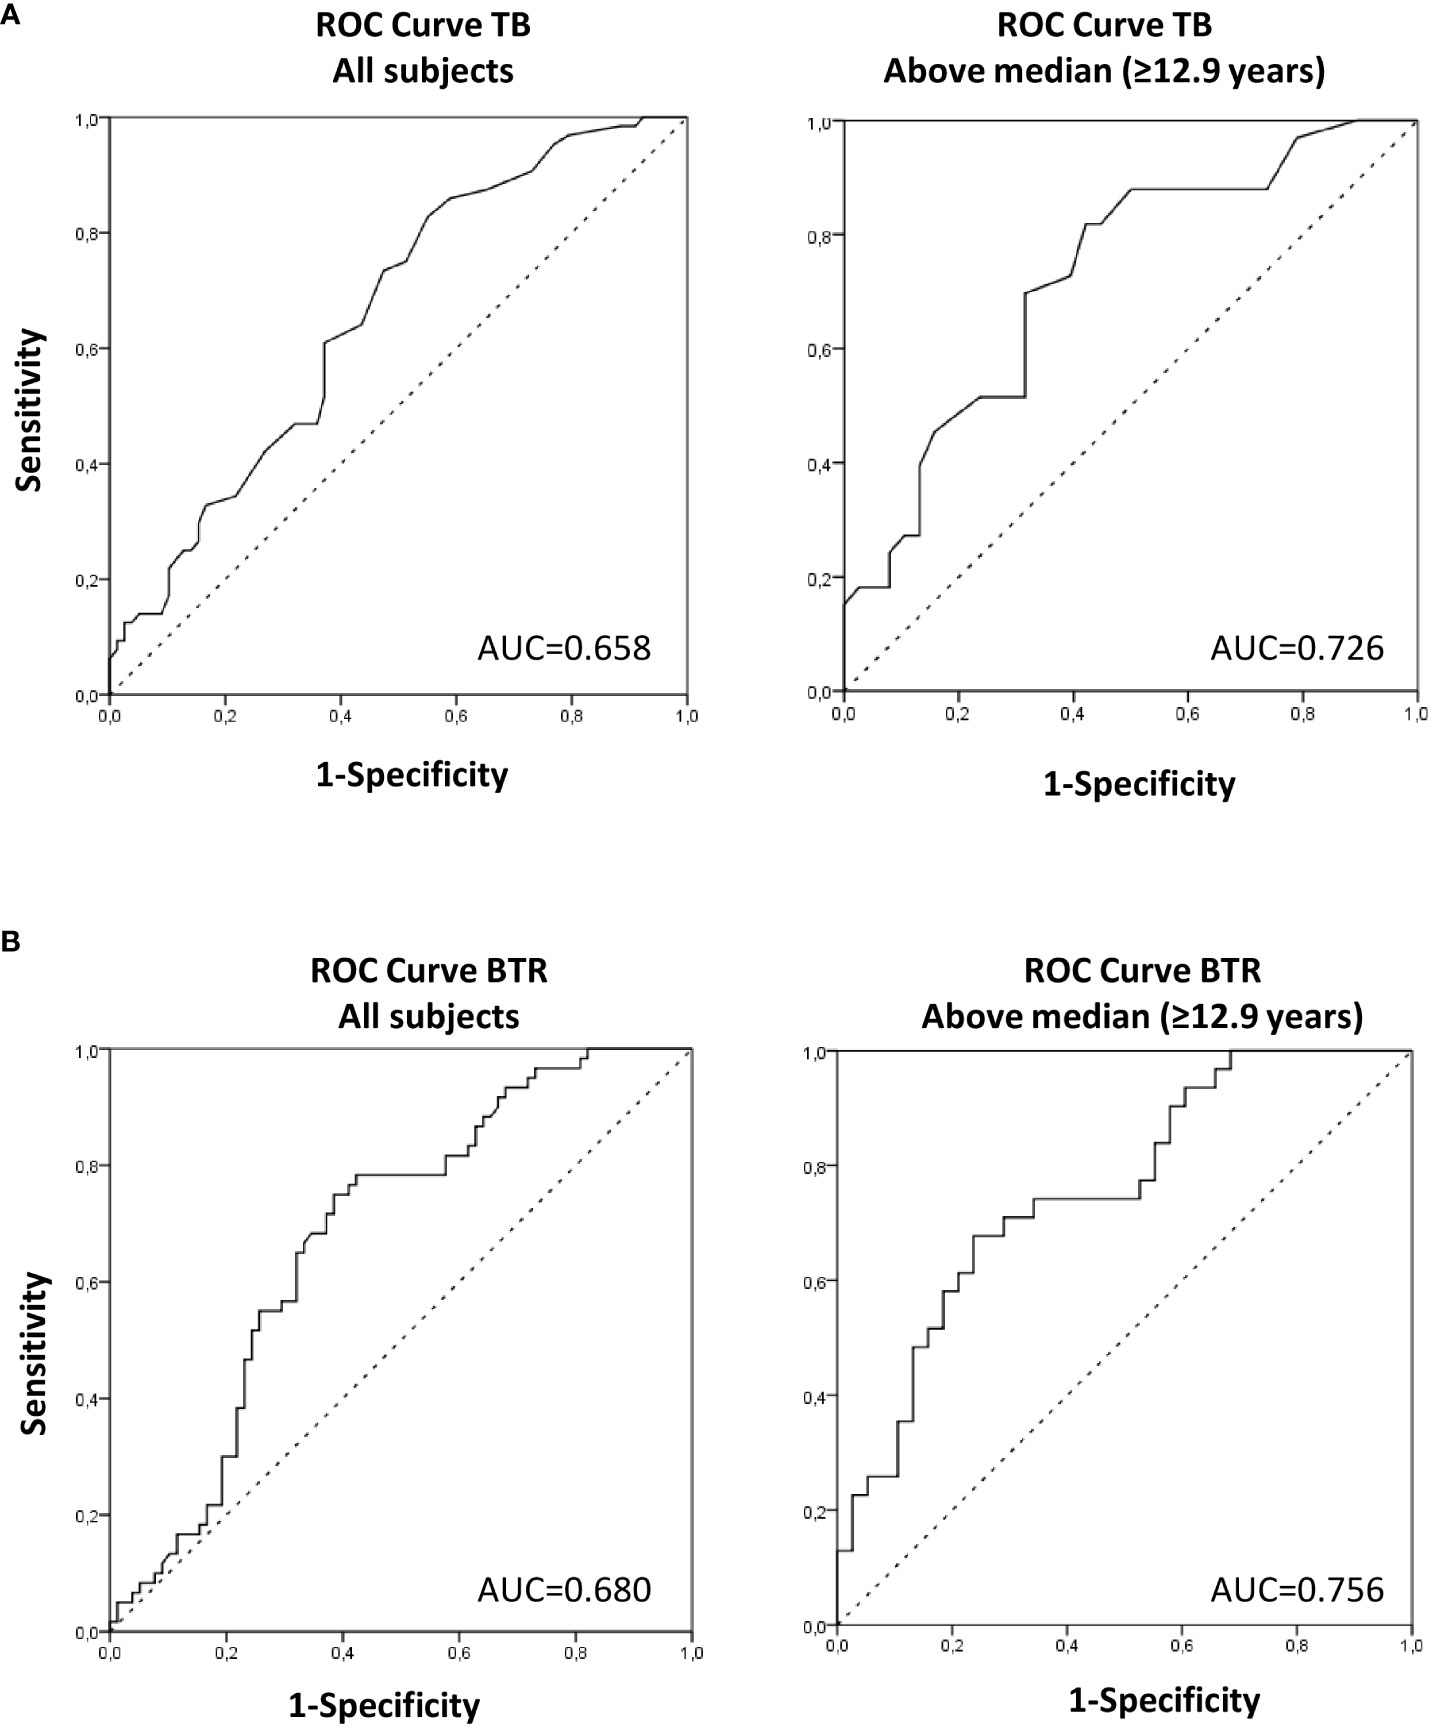
Figure 3 Area under the ROC curve (AUC) of TB (A) and BTR (B) to predict HbA1c at follow-up in the studied subjects as a whole and in children >12.9 years (above median). AUC between 0.59–0.74 indicate acceptable discriminatory accuracy and AUC between 0.75–0.9 indicate good discriminatory accuracy.
Associations between bilirubin-to-triglycerides ratio and metabolic parameters
The above-mentioned associations were stronger when both bilirubin and triglycerides levels were taken into account using the bilirubin-to-triglycerides ratio (BTR). Thus baseline BTR showed negative associations with baseline weight-SDS, BMI-SDS, waist, SBP, DBP, glucose, insulin, HOMA-IR, HOMA-B, HbA1c (all p<0.0001). Baseline BTR also showed negative associations with follow-up weight-SDS, BMI-SDS, waist, SBP, DBP, glucose, insulin, HOMA-IR, HOMA-B, HbA1c (all p ≤ 0.01) (Supplementary Table 5). Again, the association with HbA1c increased across age tertile groups, showing the strongest association in the highest age group (baseline: r= −0.452; p<0.0001; follow-up: r=-0.479; p<0.0001) (Supplementary Table 5 and Figures 1, 2).
The associations with HbA1c remained significant in multivariate regression analyses adjusting for possible confounding variables (age, gender, puberty, BMI, waist, HOMA-IR). Baseline BTR showed independent associations with baseline HbA1c in the whole population (β= −0.299; p<0.00001; R2 = 10.5%) and were stronger in the 2nd tertile (β= −0.325; p=0.007; R2 = 9.2%) and especially in the 3rd tertile (β= −0.428; p<0.0001; R2 = 17.0%) of age (Table 2). Moreover, baseline BTR was an independent predictor of follow-up HbA1c in the whole population (β= −0.246; p=0.004; R2 = 8.4%), again this being stronger in the higher age group (β= −0.486; p<0.0001; R2 = 22.5%) (Table 2). The effect sizes of the observed associations were as follows: per each 1 unit-increase in baseline BTR (%), follow-up HbA1c decreased by 0.2% ± 0.1 (p=0.014) in the total population, and by 0.4% ± 0.1 (p=<0.001) in the higher age group (Supplementary Table 6).
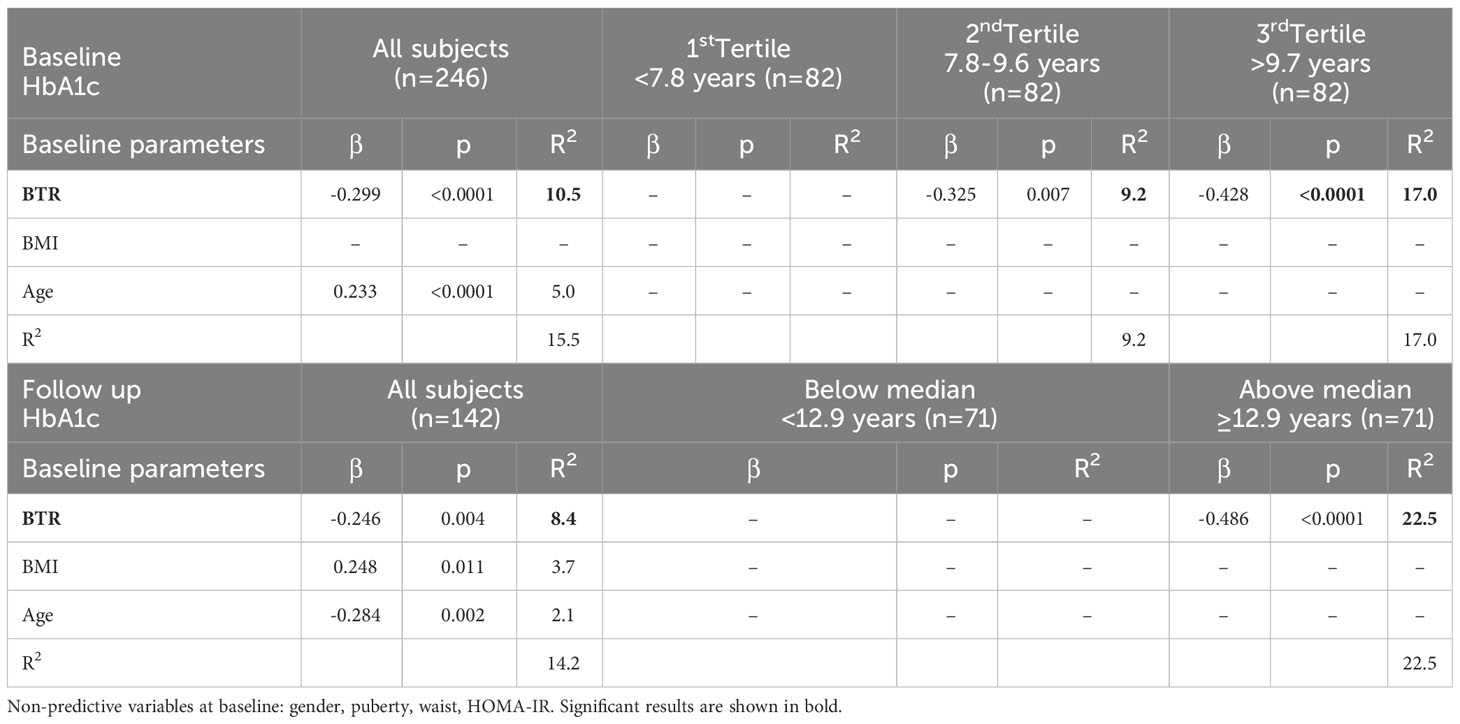
Table 2 Multivariate linear models of baseline and follow-up HbA1c as dependent variable and BTR as independent variable in the studied subjects as a whole and in subgroups thereof according to age.
In a logistic binary regression analysis, the OR for having a follow-up HbA1c value > 5.3% (34 mmol/mol) (i.e., the median value for all the studied subjects) was 0.193 (95% CI 0.089-0.420; p<0.0001) in subjects with baseline BTR above the median for the whole group, adjusted for baseline age and BMI. In ROC curve analysis, BTR was found to have an acceptable discriminatory accuracy for follow-up HbA1c prediction in all subjects (AUC of 0.680) and a good discriminatory accuracy in the higher age group (AUC of 0.756) (Figure 3B).
Age interactions
The interactions of age in the association between HbA1c and both TB and BTR at baseline and at follow-up were also tested. ANCOVA analysis showed age interactions with p values < 0.15 in the association between TB and HbA1c at follow up (p=0.067) and in the association between BTR and HbA1c at baseline (p=0.120).
Discussion
We show that TB and BTR are independently associated with HbA1c in apparently healthy children, in both cross-sectional and longitudinal analyses. These associations were noteworthy in older children.
In line with our results, several studies in healthy adults have reported negative associations between bilirubin and HbA1c (3, 10, 29). In children, a study in type 1 diabetic subjects showed that bilirubin was also inversely associated with HbA1c (30). Lin et al. showed an inverse association between serum bilirubin and metabolic syndrome in children and adolescents and showed also inverse associations with insulin and HOMA-IR. The authors, however, did not report HbA1c levels (17). In our study, we also observed associations between TB and HOMA-IR and HOMA-B but they did not remain significant in multivariate linear models. Further studies assessing more dynamic measurements of insulin resistance and secretion are warranted.
Total serum bilirubin is composed of direct and indirect forms of bilirubin. Studies on the effects of bilirubin on cardiovascular disease and metabolic syndrome have typically focused on total serum bilirubin (3–5, 8). Even though some studies have also described and inverse relationship between direct bilirubin and metabolic syndrome in adult patients (31, 32) we have not found independent associations assessing either of the bilirubin fractions.
Studies in adult patients showed that type 2 diabetic patients had lower bilirubin values (33) and higher concentrations of serum bilirubin were associated with decreased prevalence of type 2 diabetes (9, 10). Moreover, diabetic patients with Gilbert’s syndrome (who have mild elevations of bilirubin) had better HbA1c values and a more favorable profile of cardiovascular risk markers compared to those without Gilbert’s syndrome (34). Apart from a longitudinal study that described a negative association between serum bilirubin levels and incident type 2 diabetes in a 4-year period in healthy Korean men (11), the majority of published studies to-date are cross-sectional and cannot draw conclusions regarding the temporal nature of the association.
Several possible mechanisms have been suggested for the association of bilirubin with HbA1c values, metabolic syndrome and diabetes, although the underlying exact mechanism is still not known (7). Insulin resistance and impaired glucose tolerance are all accompanied by oxidative stress and subclinical inflammation state (4). Oxidative stress contributes to progressive β-cell damage and plays an important role in type 2 diabetes, and also in type 1 diabetes (35), which is mainly caused by autoimmunity and inflammation. As bilirubin is a potent anti-inflammatory and anti-oxidant agent, capable of protecting cells from a, 10000-fold excess of oxidants (36), it seems reasonable to suggest that the inverse relationship between bilirubin, insulin resistance and diabetes might result from these protective properties. Experimental studies in mice and rats with type 2 diabetes and insulin resistance revealed that the up-regulation of bilirubin synthesis by induction of heme-oxigenase ameliorates glucose metabolism and insulin sensitivity in rodents (37, 38). Another experimental study performed in a type 2 diabetic rat model demonstrated that the administration of biliverdin (a precursor of bilirubin) improved glucose tolerance by attenuating the oxidative stress in β-cells and protecting them from destruction (39). Cohen et al. demonstrated that bilirubin can modulate the expression of glucose transporter-1 and increase the rate of glucose uptake in vascular endothelial cells (40) and Lin et al. postulate that a low human biliverdin, and consequently bilirubin activity, could not only result in unopposed tissue oxidative stress but also cause dysregulation of insulin signaling, which is a hallmark of metabolic syndrome (17). Higher HbA1c itself is significantly associated with increased oxidative stress. Therefore, another explanation could be that mildly elevated serum bilirubin may inhibit the glycation of hemoglobin by reducing oxidative stress (29). Further studies assessing the relationship between HbA1c and markers of oxidative stress are required to elucidate this issue.
Several authors have shown that serum triglycerides are positively associated with insulin resistance and metabolic syndrome (15, 16, 21, 24) and negatively associated with bilirubin (4, 5, 9, 18, 31). Dyslipidemia and insulin resistance are strongly linked but it is largely unknown which of these factors is the precursor, or whether the temporal relationship between them is bidirectional. Several studies in humans support the theory that hypertriglyceridemia and low HDL cholesterol may be causal factors of insulin resistance; epidemiological studies have shown that hypertriglyceridemia can predict the risk of developing type 2 diabetes, intervention studies have suggested that lowering triglyceride treatments could delay the onset of insulin resistance in adult patients with coronary artery disease or attenuate the declining of β-cell function in adult diabetic patients and genetic studies have shown that mutations in genes involved in lipoprotein pathways that have no direct role in insulin resistance can cause dyslipidemia and consequently lead to insulin resistance (16). A cross-lagged path analysis performed by Han et al. demonstrated that changes in triglycerides and HDL cholesterol precede peripheral insulin resistance (15). The underlying mechanisms of the association between triglycerides and HDL cholesterol and insulin resistance are not clear but it seems that the excess of intracellular lipids (free fatty acids, triacylglycerol and triglyceride-rich lipoproteins) in skeletal muscle, liver and heart muscle results in insulin resistance and altered organ function. Cell cultures and rodent models have demonstrated that lipotoxicity, which is associated with hypertriglyceridemia, increases β-cell apoptosis and decreases β-cell insulin secretion (41). However, the effects of hypertriglyceridemia on human β-cell function remain still unclear and more research is needed. In our study bilirubin showed negative associations with TG/HDL ratio at follow-up. The TG to HDL ratio has been associated previously with IR in obese white boys and girls (42). There are also other studies that use TG/HDL ratio as a marker of insulin resistance in minorities (43–45). In reference to insulin sensitivity, experimental data in mice models showed that bilirubin administration improves hyperglycemia and obesity by increasing insulin sensitivity and suggest that bilirubin or bilirubin-increasing drugs might be useful as an insulin sensitizer for the treatment of obesity-induced insulin resistance and type 2 diabetes based on its profound anti-ER stress and anti-inflammatory properties (46). In humans, the relationships between bilirubin and insulin sensitivity varied according to the different types of bilirubin and serum indirect bilirubin has been suggested to be a protective factor that enhances insulin sensitivity (47). In our study, bilirubin and BTR showed negative associations with HOMA-B, but they did not remain significant in multivariate linear models.
Our results showed that the associations between HbA1c and both total bilirubin and the bilirubin-to-triglycerides ratio are influenced by age and are stronger in older children. We speculate that this age-dependent association could be related to a less favorable metabolic profile (higher insulin resistance and TG/HDL ratio) at an older age in our subjects (48).
The major strength of our study is its longitudinal nature, suggesting a causal relationship between bilirubin and the bilirubin-to-triglycerides ratio and HbA1c levels over time. Unfortunately, some children were lost to follow-up, but it may probably not influence our results since there were no differences in baseline clinical or laboratory assessments between lost-to-follow-up children and the rest of the cohort. Another limitation could be that our study did not include an oral glucose tolerance test, which would have been helpful to further characterize the associations with glucose tolerance or insulin secretion. However, HbA1c is clinical parameter that describes the extent of glucose tolerance over a long period and therefore may be a more robust indicator of glycemia than a parameter describing it in a given moment only, such as during an oral glucose tolerance test (49). We also acknowledge that the children in our study were rather overweight at baseline (mean BMI-SDS of 1.03 ± 0.10). This is because the study was focused on cardiovascular risk factors in children. However, all the associations herein described were independent of BMI.
Another limitation of our study is the low r2 values obtained in multivariate models, thus meaning that TB and BTR are not the only parameters involved in the prediction of HbA1c levels. The anti-aging gene Sirtuin 1 could be a novel parameter that together with TB and BTR would predict glucose tolerance in healthy children. Indeed, the role of Sirtuin 1 is critical to glucose tolerance and the metabolic syndrome in children and Sirtuin 1 dysregulation is linked to diabetes and various chronic diseases (50–52). Sirtuin 1 controls beta cell insulin production and glucose regulation and is important to triglyceride metabolism and the prevention of NAFLD (53, 54). Bilirubin has been shown to regulate Sirtuin 1 expression with relevance to triglyceride accumulation and NAFLD (55). The role of bilirubin and Sirtuin 1 on the prediction of glucose tolerance in healthy children should be elucidated in future studies.
In summary, to the best or our knowledge, we show for the first time that bilirubin and the bilirubin-to-triglycerides ratio are independently associated with HbA1c and predict its changes over time in healthy children. Our results indicate that bilirubin and the bilirubin-to-triglycerides ratio may be useful parameters in studies of glucose tolerance in healthy children.
Data availability statement
The data analyzed in this study is subject to the following licenses/restrictions: The datasets generated and analyzed during the current study are available from the corresponding author on reasonable request. Requests to access these datasets should be directed to AL-B, YWxvcGV6YmVybWVqb0BpZGliZ2kub3Jn and/or JB, amJhc3NvbHNAaWRpYmdpLm9yZw==.
Ethics statement
The studies involving humans were approved by Institutional Review Board of Dr. Josep Trueta Hospital. The studies were conducted in accordance with the local legislation and institutional requirements. Written informed consent for participation in this study was provided by the participants’ legal guardians/next of kin.
Author contributions
EP-C: Conceptualization, Data curation, Formal Analysis, Validation, Writing – original draft, Writing – review & editing. SN-C: Formal Analysis, Writing – review & editing. BR-P: Formal Analysis, Writing – review & editing. BM-P: Data curation, Methodology, Writing – review & editing. AG-V: Data curation, Methodology, Writing – review & editing. GC-B: Conceptualization, Data curation, Formal Analysis, Writing – review & editing. MN: Data curation, Writing – review & editing, Methodology. AP-P: Writing – review & editing, Data curation. FZ: Conceptualization, Writing – review & editing. LI: Conceptualization, Writing – review & editing. JB: Conceptualization, Formal Analysis, Funding acquisition, Methodology, Supervision, Writing – original draft, Writing – review & editing. AL-B: Conceptualization, Formal Analysis, Funding acquisition, Methodology, Supervision, Writing – original draft, Writing – review & editing.
Funding
The author(s) declare financial support was received for the research, authorship, and/or publication of this article. EP-C is an Investigator of the Rio Hortega Fund (CM18/00236; National Institute of Health Carlos III, Spain), AG-V is a predoctoral Investigator of the pFIS Fund (FI18/00144; National Institute of Health Carlos III, Spain); BM-P is a predoctoral Investigator of the pFIS Fund (FI20/00138; National Institute of Health Carlos III, Spain). GC-B is an Investigator of the Sara Borrell Fund (CD19/00172; National Institute of Health Carlos III, Spain). FZ is a Clinical Investigator of the Clinical Research Council of the University Hospital Leuven, Belgium. LI is a Clinical Investigator of CIBERDEM (Centro de Investigación Biomédica en Red de Diabetes y Enfermedades Metabólicas Asociadas). JB is an Investigator of the Miguel Servet Fund (CPII17/00013; National Institute of Health Carlos III, Spain). AL-B is an Investigator of the I3 Fund for Scientific Research (Ministry of Science and Innovation, Spain). The study was supported by grants from the Ministerio de Ciencia e Innovación, Instituto de Salud Carlos III, Madrid, Spain (PI20/00399 to JB and PI19/00451 and PI22/00366 to AL-B), projects co-funded by FEDER (Fondo Europeo de Desarrollo Regional).
Acknowledgments
The authors are grateful to all the children and parents who took part of the study.
Conflict of interest
The authors declare that the research was conducted in the absence of any commercial or financial relationships that could be construed as a potential conflict of interest.
Publisher’s note
All claims expressed in this article are solely those of the authors and do not necessarily represent those of their affiliated organizations, or those of the publisher, the editors and the reviewers. Any product that may be evaluated in this article, or claim that may be made by its manufacturer, is not guaranteed or endorsed by the publisher.
Supplementary material
The Supplementary Material for this article can be found online at: https://www.frontiersin.org/articles/10.3389/fendo.2023.1303597/full#supplementary-material
References
1. Stocker R, Yamamoto Y, McDonagh AF, Glazer AN, Ames BN. Bilirubin is an antioxidant of possible physiological importance. Science (1987) 235(4792):1043–6.
2. Schwertner HA, Vítek L. Gilbert syndrome, UGT1A1*28 allele, and cardiovascular disease risk: possible protective effects and therapeutic applications of bilirubin. Atherosclerosis (2008) 198(1):1–11.
3. Oda E, Kawai R. Bilirubin is negatively associated with hemoglobin a(1c) independently of other cardiovascular risk factors in apparently healthy Japanese men and women. Circ J (2011) 75(1):190–5.
4. Choi SH, Yun KE, Choi HJ. Relationships between serum total bilirubin levels and metabolic syndrome in Korean adults. Nutr Metab Cardiovasc Dis (2013) 23(1):31–7.
5. Guzek M, Jakubowski Z, Bandosz P, Wyrzykowski B, Smoczyński M, Jabloiska A, et al. Inverse association of serum bilirubin with metabolic syndrome and insulin resistance in Polish population. Przegl Epidemiol. (2012) 66(3):495–501.
6. Liang C, Yu Z, Bai L, Hou W, Tang S, Zhang W, et al. Association of serum bilirubin with metabolic syndrome and non-alcoholic fatty liver disease: A systematic review and meta-analysis. Front Endocrinol (Lausanne). (2022) 13:869579.
7. Novák P, Jackson AO, Zhao GJ, Yin K. Bilirubin in metabolic syndrome and associated inflammatory diseases: New perspectives. Life Sci (2020) 257:118032.
8. Nano J, Muka T, Cepeda M, Voortman T, Dhana K, Brahimaj A, et al. Association of circulating total bilirubin with the metabolic syndrome and type 2 diabetes: A systematic review and meta-analysis of observational evidence. Diabetes Metab (2016) 42(6):389–97.
9. Han SS, Na KY, Chae DW, Kim YS, Kim S, Chin HJ. High serum bilirubin is associated with the reduced risk of diabetes mellitus and diabetic nephropathy. Tohoku J Exp Med (2010) 221(2):133–40.
10. Ohnaka K, Kono S, Inoguchi T, Yin G, Morita M, Adachi M, et al. Inverse associations of serum bilirubin with high sensitivity C-reactive protein, glycated hemoglobin, and prevalence of type 2 diabetes in middle-aged and elderly Japanese men and women. Diabetes Res Clin Pract (2010) 88(1):103–10.
11. Jung CH, Lee MJ, Kang YM, Hwang JY, Jang JE, Leem J, et al. Higher serum bilirubin level as a protective factor for the development of diabetes in healthy Korean men: a 4 year retrospective longitudinal study. Metabolism (2014) 63(1):87–93.
12. Chin HJ, Song YR, Kim HS, Park M, Yoon HJ, Na KY, et al. The bilirubin level is negatively correlated with the incidence of hypertension in normotensive korean population. J Korean Med Sci (2009) 24(Suppl 1):S50.
13. Schwertner HA, Jackson WG, Tolan G. Association of low serum concentration of bilirubin with increased risk of coronary artery disease. Clin Chem (1994) 40(1):18–23.
14. Suh S, Cho YR, Park MK, Kim DK, Cho NH, Lee MK. Relationship between serum bilirubin levels and cardiovascular disease. PloS One (2018) 13(2):e0193041.
15. Han T, Cheng Y, Tian S, Wang L, Liang X, Duan W, et al. Changes in triglycerides and high-density lipoprotein cholesterol may precede peripheral insulin resistance, with 2-h insulin partially mediating this unidirectional relationship: a prospective cohort study. Cardiovasc Diabetol (2016) 15(1):154–64.
16. Li N, Fu J, Koonen DP, Kuivenhoven JA, Snieder H, Hofker MH. Are hypertriglyceridemia and low HDL causal factors in the development of insulin resistance? Atherosclerosis (2014) 233(1):130–8.
17. Lin LY, Kuo HK, Hwang JJ, Lai LP, Chiang FT, Den TC, et al. Serum bilirubin is inversely associated with insulin resistance and metabolic syndrome among children and adolescents. Atherosclerosis (2009) 203(2):563–8.
18. Madhavan M, Wattigney WA, Srinivasan SR, Berenson GS. Serum bilirubin distribution and its relation to cardiovascular risk in children and young adults. Atherosclerosis (1997) 131(1):107–13.
19. Ullah A, Stankevic E, Holm LA, Stinson SE, Juel HB, Fonvig CE, et al. Genetics of plasma bilirubin and associations between bilirubin and cardiometabolic risk profiles in danish children and adolescents. Antioxidants (Basel Switzerland). (2023) 12(8):1613.
20. Bellarosa C, Bedogni G, Bianco A, Cicolini S, Caroli D, Tiribelli C, et al. Association of serum bilirubin level with metabolic syndrome and non-alcoholic fatty liver disease: A cross-sectional study of 1672 obese children. J Clin Med (2021) 10(13):2812.
21. Cho J, Hong H, Park S, Kim S, Kang H. Insulin resistance and its association with metabolic syndrome in korean children. BioMed Res Int (2017) 2017:8728017.
22. Hoffman RP. Increased fasting triglyceride levels are associated with hepatic insulin resistance in caucasian but not african-american adolescents. Diabetes Care (2006) 29(6):1402–4.
23. Lentferink YE, Elst MAJ, Knibbe CAJ, van der Vorst MMJ. Predictors of insulin resistance in children versus adolescents with obesity. J Obes (2017) 2017:3793868.
24. Weiss R, Dziura J, Burgert TS, Tamborlane WV, Taksali SE, Yeckel CW, et al. Obesity and the metabolic syndrome in children and adolescents. N Engl J Med (2004) 350(23):2362–74.
25. Carrascosa Lezcano A, Fernández García JM, Fernández Ramos C, Ferrández Longás A, López-Siguero JP, Sánchez González E, et al. Estudio transversal español de crecimiento 2008. Parte II: valores de talla, peso e índice de masa corporal desde el nacimiento a la talla adulta. Pediatría (2008) 68(6):552–69.
26. Marshall WA, Tanner JM. Variations in pattern of pubertal changes in girls. Arch Dis Child. (1969) 44(235):291–303.
27. Marshall WA, Tanner JM. Variations in the pattern of pubertal changes in boys. Arch Dis Child. (1970) 45(239):13.
28. Derakhshan A, Peeters RP, Taylor PN, Bliddal S, Carty DM, Meems M, et al. Association of maternal thyroid function with birthweight: a systematic review and individual-participant data meta-analysis. Lancet Diabetes Endocrinol (2020) 8(6):501–10.
29. Kawamoto R, Ninomiya D, Senzaki K, Kumagi T. Mildly elevated serum total bilirubin is negatively associated with hemoglobin A1c independently of confounding factors among community-dwelling middle-aged and elderly persons. J Circ Biomarkers. (2017) 6:1849454417726609.
30. Mianowska B, Kamińska A, Fendler W, Szadkowska A, Mlynarski W. Bilirubin is an independent factor inversely associated with glycated hemoglobin level in pediatric patients with type 1 diabetes. Pediatr Diabetes. (2014) 15(5):389–93.
31. Jo J, Yun JE, Lee H, Kimm H, Jee SH. Total, direct, and indirect serum bilirubin concentrations and metabolic syndrome among the Korean population. Endocrine (2011) 39(2):182–9.
32. Li XH, Lin HY, Guan LY, Peng H, Wen MM, Cao YQ, et al. Direct bilirubin levels and risk of metabolic syndrome in healthy chinese men. BioMed Res Int (2017) 2017:9621615–9621615.
33. Choi SW, Lee YH, Kweon SS, Song HR, Ahn HR, Rhee JA, et al. Association between total bilirubin and hemoglobin A1c in korean type 2 diabetic patients. J Korean Med Sci (2012) 27(10):1196.
34. Inoguchi T, Sasaki S, Kobayashi K, Takayanagi R, Yamada T. Relationship between Gilbert syndrome and prevalence of vascular complications in patients with diabetes. JAMA (2007) 298(12):1398–400.
35. Robertson AP. Chronic oxidative stress as a central mechanism for glucose toxicity in pancreatic islet beta cells in diabetes. J Biol Chem (2004) 279(41):42351–4.
36. Barañano DE, Rao M, Ferris CD, Snyder SH. Biliverdin reductase: a major physiologic cytoprotectant. Proc Natl Acad Sci USA (2002) 99(25):16093–8.
37. Li M, Kim DH, Tsenovoy PL, Peterson SJ, Rezzani R, Rodella LF, et al. Treatment of obese diabetic mice with a heme oxygenase inducer reduces visceral and subcutaneous adiposity, increases adiponectin levels, and improves insulin sensitivity and glucose tolerance. Diabetes (2008) 57(6):1526–35.
38. Ndisang JF, Lane N, Jadhav A. The heme oxygenase system abates hyperglycemia in Zucker diabetic fatty rats by potentiating insulin-sensitizing pathways. Endocrinology (2009) 150(5):2098–108.
39. Ikeda N, Inoguchi T, Sonoda N, Fujii M, Takei R, Hirata E, et al. Biliverdin protects against the deterioration of glucose tolerance in db/db mice. Diabetologia (2011) 54(8):2183–91.
40. Cohen G, Livovsky DM, Kapitulnik J, Sasson S. Bilirubin increases the expression of glucose transporter-1 and the rate of glucose uptake in vascular endothelial cells. Rev Diabetes Stud (2006) 3(3):127.
41. Lebovitz HE, Ludvik B, Yaniv I, Haddad W, Schwartz T, Aviv R. Fasting plasma triglycerides predict the glycaemic response to treatment of type 2 diabetes by gastric electrical stimulation. A novel lipotoxicity paradigm. Diabetes Med (2013) 30(6):687–93.
42. Giannini C, Santoro N, Caprio S, Kim G, Lartaud D, Shaw M, et al. The triglyceride-to-HDL cholesterol ratio: association with insulin resistance in obese youths of different ethnic backgrounds. Diabetes Care (2011) 34(8):1869–74.
43. Newbern D, Gumus Balikcioglu P, Balikcioglu M, Bain J, Muehlbauer M, Stevens R, et al. Sex differences in biomarkers associated with insulin resistance in obese adolescents: metabolomic profiling and principal components analysis. J Clin Endocrinol Metab (2014) 99(12):4730–9.
44. Jachthuber Trub C, Balikcioglu M, Freemark M, Bain J, Muehlbauer M, Ilkayeva O, et al. Impact of lifestyle Intervention on branched-chain amino acid catabolism and insulin sensitivity in adolescents with obesity. Endocrinol Diabetes Metab (2021) 4(3):e00250.
45. Gumus Balikcioglu P, Jachthuber Trub C, Balikcioglu M, Ilkayeva O, White PJ, Muehlbauer M, et al. Branched-chain α-keto acids and glutamate/glutamine: Biomarkers of insulin resistance in childhood obesity. Endocrinol Diabetes Metab (2023) 6(1):e388.
46. Dong H, Huang H, Yun X, Kim DS, Yue Y, Wu H, et al. Bilirubin increases insulin sensitivity in leptin-receptor deficient and diet-induced obese mice through suppression of ER stress and chronic inflammation. Endocrinology (2014) 155(3):818–28.
47. Zhang F, Guan W, Fu Z, Zhou L, Guo W, Ma Y, et al. Relationship between serum indirect bilirubin level and insulin sensitivity: results from two independent cohorts of obese patients with impaired glucose regulation and type 2 diabetes mellitus in China. Int J Endocrinol (2020) 2020:5681296.
48. Peplies J, Jiménez-Pavón D, Savva SC, Buck C, Günther K, Fraterman A, et al. Percentiles of fasting serum insulin, glucose, hba1c and homa-ir in pre-pubertal normal weight european children from the idefics cohort. Int J Obes (2014) 38:S39–47.
49. Bonora E, Tuomilehto J. The pros and cons of diagnosing diabetes with A1C. Diabetes Care (2011) 34(Suppl 2):S184–90.
50. Martins IJ. Anti-aging genes improve appetite regulation and reverse cell senescence and apoptosis in global populations. Adv Aging Res (2016) 5:9–26.
51. Martins IJ. Single gene inactivation with implications to diabetes and multiple organ dysfunction syndrome. J Clin Epigenet. (2017) 3:24.
52. Martins IJ, Calderón de la Barca AM. Diet and Nutrition reverse Type 3 Diabetes and Accelerated Aging linked to Global chronic diseases. J Diabetes Res Ther (2016) 2(2):1–6.
53. Martins IJ. Sirtuin 1, a diagnostic protein marker and its relevance to chronic disease and therapeutic drug interventions. EC Pharmacol Toxicol (2018) 6(4):209–15.
54. Farghali H, Kemelo MK, Canová NK. SIRT1 modulators in experimentally induced liver injury. Oxid Med Cell Longev (2019) 2019:8765954.
Keywords: bilirubin, triglycerides, glycated hemoglobin, children, pediatrics
Citation: Puerto-Carranza E, Nuevo-Casals S, Roca-Portella B, Mas-Parés B, Gómez-Vilarrubla A, Carreras-Badosa G, Niubó M, Prats-Puig A, de Zegher F, Ibáñez L, Bassols J and López-Bermejo A (2023) Total bilirubin and bilirubin-to-triglycerides ratio predict changes in glycated hemoglobin in healthy children. Front. Endocrinol. 14:1303597. doi: 10.3389/fendo.2023.1303597
Received: 28 September 2023; Accepted: 16 November 2023;
Published: 01 December 2023.
Edited by:
Michael Freemark, Duke University, United StatesReviewed by:
Pinar Gumus Balikcioglu, Duke University, United StatesIan James Martins, University of Western Australia, Australia
Copyright © 2023 Puerto-Carranza, Nuevo-Casals, Roca-Portella, Mas-Parés, Gómez-Vilarrubla, Carreras-Badosa, Niubó, Prats-Puig, de Zegher, Ibáñez, Bassols and López-Bermejo. This is an open-access article distributed under the terms of the Creative Commons Attribution License (CC BY). The use, distribution or reproduction in other forums is permitted, provided the original author(s) and the copyright owner(s) are credited and that the original publication in this journal is cited, in accordance with accepted academic practice. No use, distribution or reproduction is permitted which does not comply with these terms.
*Correspondence: Abel López-Bermejo, YWxvcGV6YmVybWVqb0BpZGliZ2kub3Jn; Judit Bassols, amJhc3NvbHNAaWRpYmdpLm9yZw==
†These authors share senior authorship