- 1Department of Cardiology, The Affiliated Changzhou No.2 People’s Hospital of Nanjing Medical University, Changzhou, Jiangsu, China
- 2Department of Geriatrics, Nanjing Tongren Hospital, School of Medicine, Southeast University, Nanjing, China
- 3Department of Cardiology, The First Affiliated Hospital of Zhengzhou University, Zhengzhou, China
- 4Department of Thoracic and Cardiac Surgery, The Affiliated Changzhou No.2 People’s Hospital of Nanjing Medical University, Changzhou, Jiangsu, China
- 5Medical Research Center, The Affiliated Changzhou No.2 People’s Hospital of Nanjing Medical University, Changzhou, Jiangsu, China
Objective: To investigate the association of serum uric acid (SUA) with all-cause and cardiovascular death in individuals with coronary heart disease (CHD).
Methods: In this prospective cohort study, 1556 individuals from the National Health and Nutrition Examination Survey (1999-2015) were included in the analysis. Multivariate COX regression analysis, restricted cubic spline plot (RCS) and threshold effect were used to investigate the association between SUA and all-cause and cardiovascular death in individuals with CHD.
Results: In the fully adjusted model, when SUA was regarded as a continuous variable, it was closely associated with the risk of all-cause and cardiovascular death (P < 0.01). When all participants were divided into four groups according to the quartile of SUA, compared with Q1 group, only individuals in Q4 group had higher risk of all-cause and cardiovascular death (P = 0.002 and 0.034). The following subgroup analysis showed that the association between SUA and all-cause death risk was still statistically significant in individuals over 60 years old, male, with hypertension, without diabetes and with chronic kidney disease, while the association with cardiovascular death risk only persisted in individuals over 60 years old and male (P < 0.05). Further sensitivity analysis showed that SUA was still closely associated with all-cause and cardiovascular death, whether as a continuous variable or a classified variable (P = 0.007 and 0.044). RCS analysis revealed that SUA had a nonlinear association with all-cause and cardiovascular death risk (P for nonlinearity < 0.01). Threshold effect analysis showed that SUA below 345 umol/L was negatively associated with all-cause and cardiovascular death risk (P < 0.05), while SUA above 345 umol/L was positively associated with all-cause and cardiovascular death risk (P < 0.001), and the 2-piecewise regression model was better than the 1-line regression model (P for likelihood ratio test < 0.05).
Conclusion: SUA had a nonlinear association with all-cause and cardiovascular death risk in individuals with CHD.
1 Introduction
Serum uric acid (SUA), as an end product of purine metabolism mainly excreted by kidney, has been recognized as a risk factor for gout, gouty arthritis and kidney calculi (1–4). In addition, the current research background has also confirmed that SUA is closely related to the prevalence and incidence of metabolic syndrome, cardiovascular disease, kidney disease and cancer (5–7). Of course, these diseases mainly occur in patients with high levels of SUA. However, its correlation with mortality has not been agreed, among which all-cause death and cardiovascular death are the most concerned. Some studies show that higher levels of SUA are related to higher risk of all-cause death or cardiovascular death (8, 9), while others suggest that lower levels of SUA are related to higher risk of all-cause death or cardiovascular death, and some studies have even found that SUA levels are not associated with the risk of all-cause or cardiovascular death (10–12). Nevertheless, most studies tend to show an approximately U-shaped correlation between SUA and the risk of all-cause death or cardiovascular death.
However, the current research mainly focuses on the relationship between SUA and the death risk of the general population or healthy population, and does not explore the population with coronary heart disease (CHD) too much. Therefore, this study aimed at exploring the correlation between SUA and all-cause death and cardiovascular death for individuals with CHD from the National Health and Nutrition Examination Survey (NHANES).
2 Materials and methods
2.1 Study population
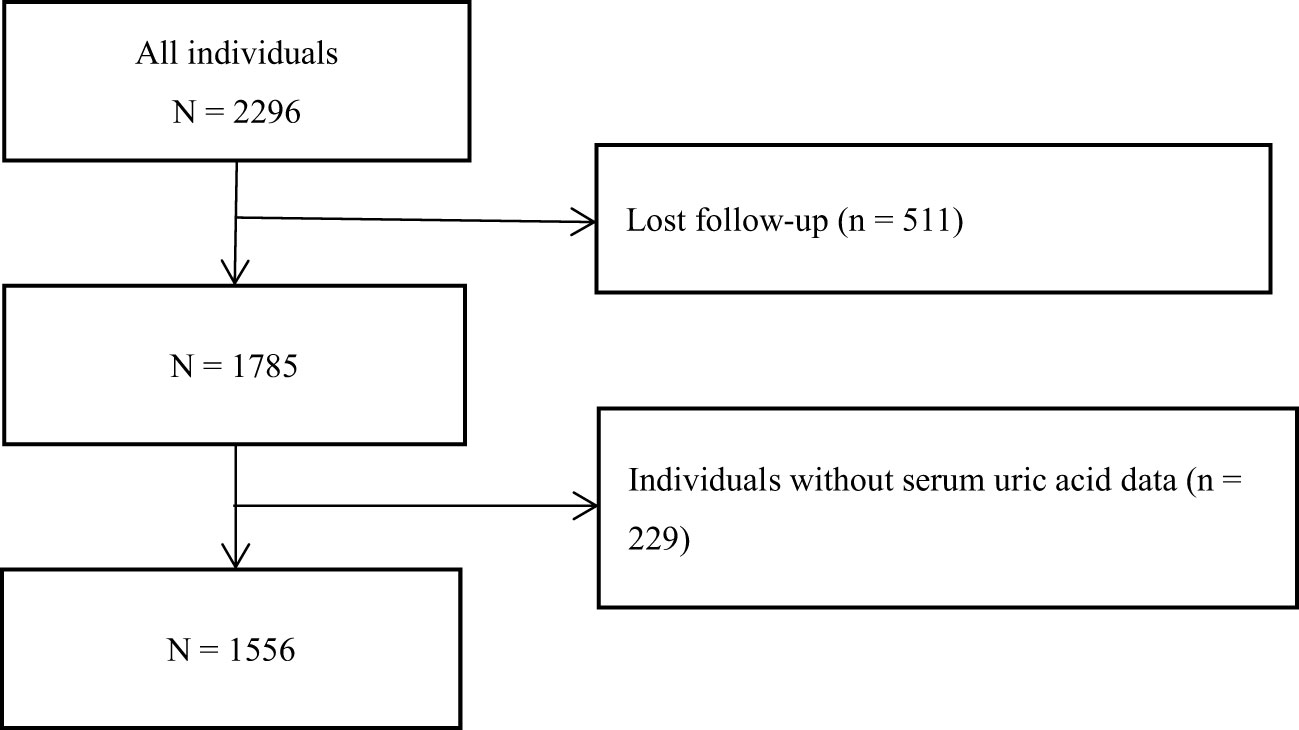
All participants in this study came from the NHANES from 1999 to 2015. As shown in Figure 1, after excluding the individuals who lost their visits and did not have SUA data, 1556 individuals were finally included in this study for the following statistical analysis. The research scheme was approved by the National Center for Health Statistics of the Center for Disease Control and Prevention Institutional Review Board. Participants have signed the informed consent form. The research program and content were in line with the Declaration of Helsinki.
2.2 Data collection and definitions
In this prospective cohort study, we collected some baseline data according to the design of the research scheme, such as demographic data, physical measurement data, complications and drug treatment data and biomarker data. In this study, smoking was defined as a binary variable according to the current smoking situation: yes or no. The definition of drug treatment data was the same as above. Hypertension was defined as hypertension diagnosed by doctors or current systolic blood pressure (SBP)/diastolic blood pressure (DBP) ≥ 140/90 mmHg or taking antihypertensive drugs. Diabetes was defined as diabetes diagnosed by doctors or current fasting plasma glucose (FPG) ≥ 7.0 mmol/L or hemoglobin A1c (HbA1c) ≥ 6.5% or being treated with hypoglycemic drugs. Hypercholesterolemia was defined as a medical history diagnosed by a doctor or currently being treated with cholesterol-lowering drugs. Stroke was defined as a self-reported history of stroke. Chronic kidney disease (CKD) was defined as estimated glomerular filtration rate (eGFR) < 60 ml/min/1.73m2, in which eGFR was estimated according to published literature (13).
All participants were followed up from the date of NHANES interview to December 31, 2015, and the outcomes included all-cause death and cardiovascular death defined by ICD-10 codes.
2.3 Statistical analysis
In this study, we divided all participants into four groups according to the quartile of SUA: Q1 ≤ 297.4 umol/L, 297.4 umol/L< Q2 ≤ 356.9 umol/L, 356.9 umol/L< Q3 ≤ 422.3 umol/L, Q4 ≥ 422.3 umol/L. One-way ANOVA or Kruskal-Wallis H analysis were used to test the differences of each continuous variable between groups. Chi-square test was used to analyze the differences of each classified variable between groups. Kaplan-Meier survival analysis was used to test the cumulative incidence of all-cause death and cardiovascular death among the four groups of SUA. COX regression analysis was used to test the correlation between SUA and all-cause death and cardiovascular death. Subgroup analysis and sensitivity analysis were used to test the stability of the correlation between SUA and all-cause death and cardiovascular death. Restricted cubic spline plot (RCS) and threshold effect analysis were used to test the potential nonlinear correlation, threshold effect and saturation effect between SUA and all-cause death and cardiovascular death. The above statistical tests were conducted by SPSS 26.0 or R 4.1.3, and a two-tailed P value < 0.05 was considered statistically significant.
3 Results
3.1 Baseline characteristics
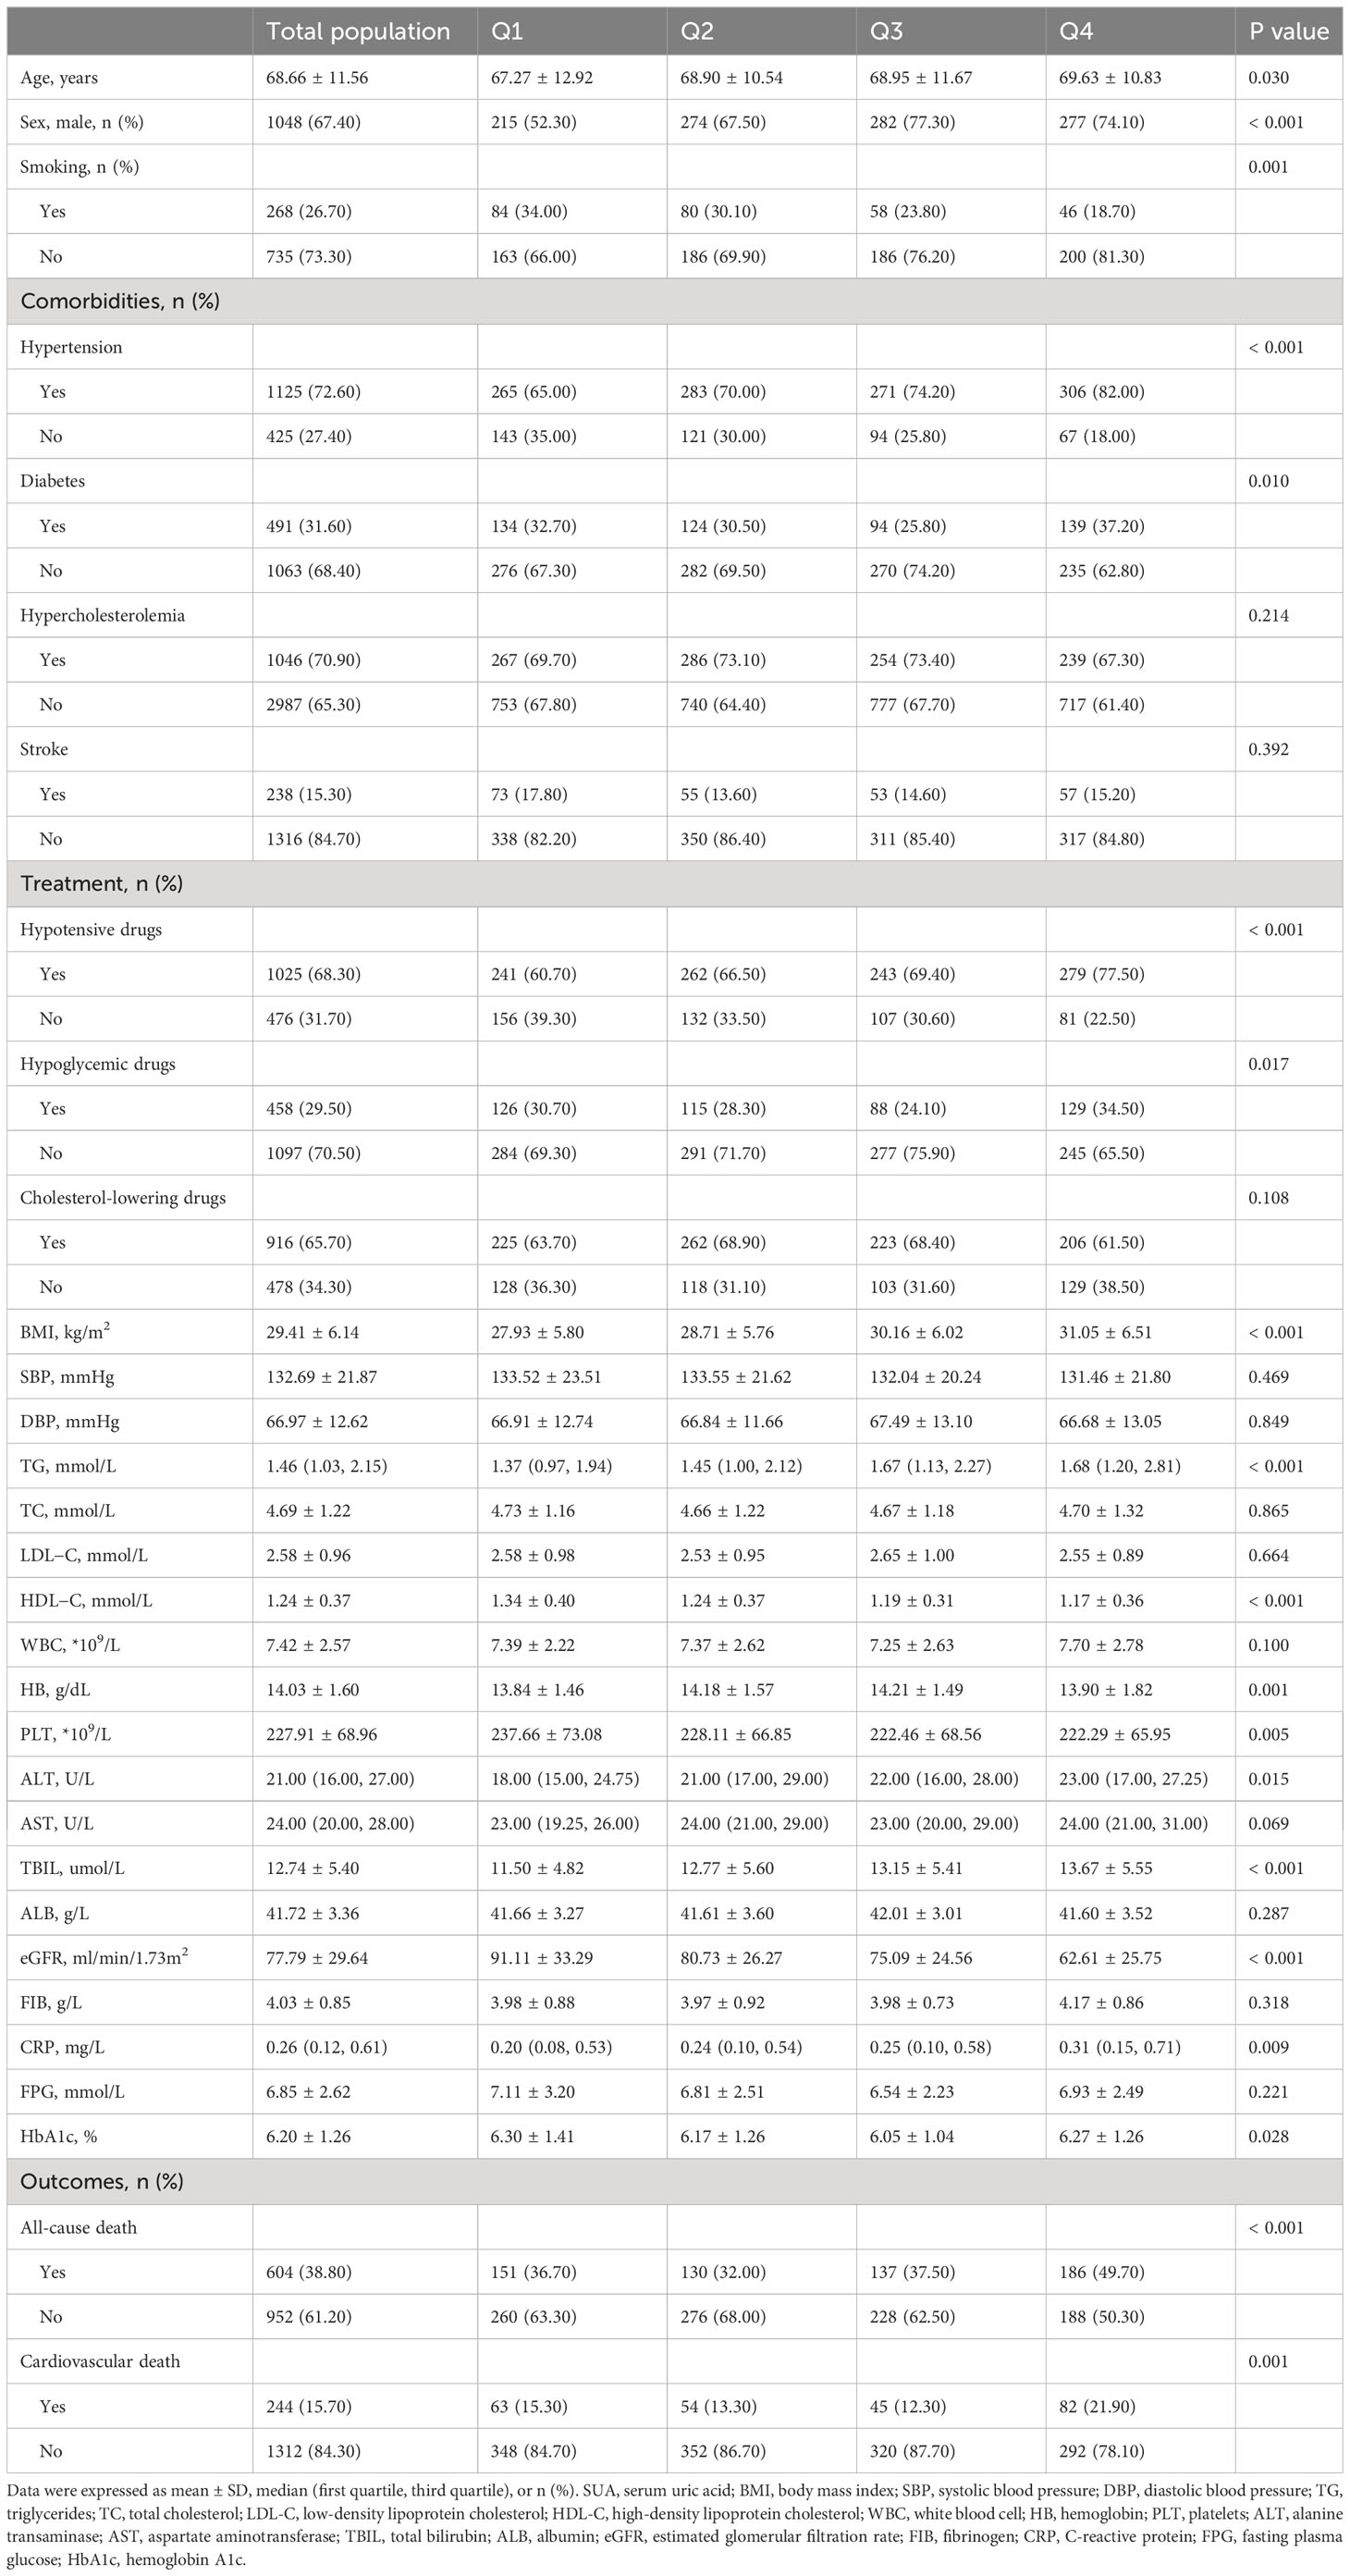
As shown in Table 1, the levels or probabilities of variables such as age, sex, smoking, hypertension, diabetes, hypotensive drugs, hypoglycemic drugs, BMI, TG, HDL-C, HB, PLT, ALT, TBIL, eGFR, CRP, HbA1c, all-cause death and cardiovascular death were significantly different among the four groups of SUA. And the proportion and cumulative incidence of all-cause and cardiovascular death in Q4 group were higher than that in Q1 group (P < 0.05) (Table 1; Figure 2).
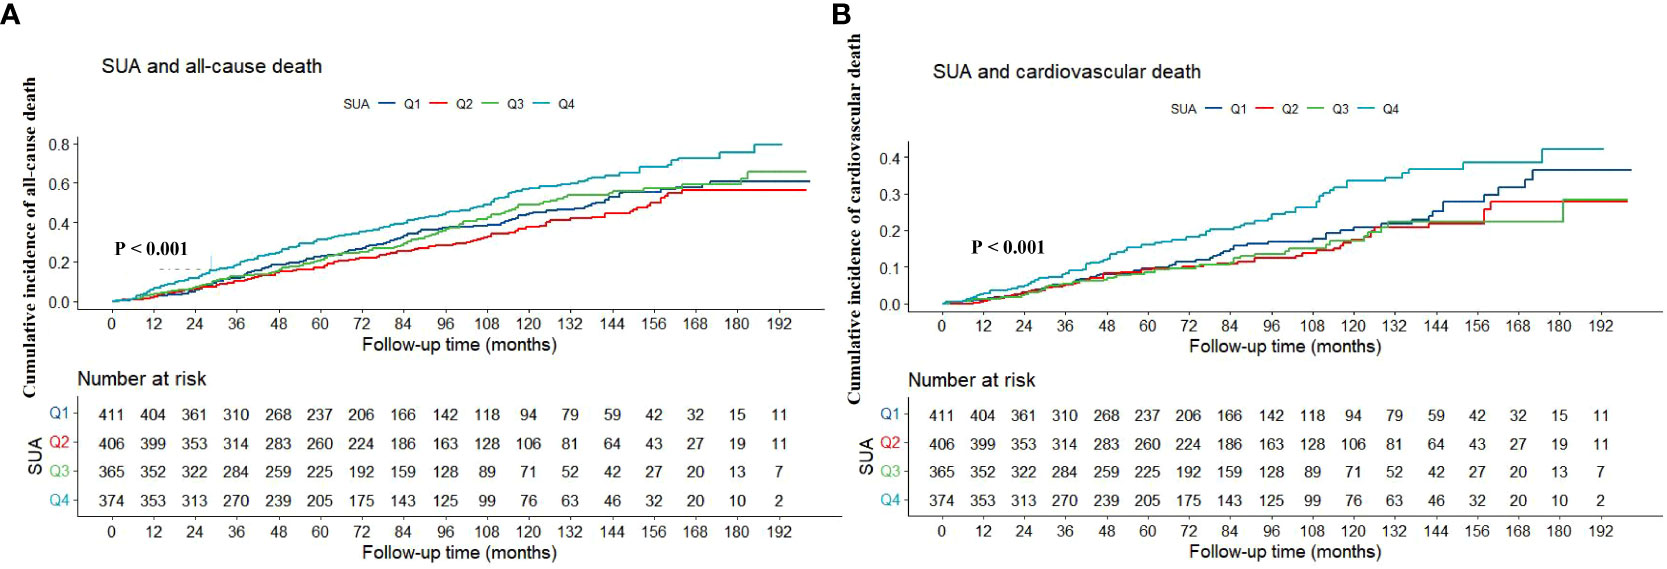
Figure 2 Kaplan-Meier survival curve of association between SUA with all-cause (A) and cardiovascular death (B). SUA, serum uric acid.
3.2 Association of SUA with all-cause and cardiovascular death
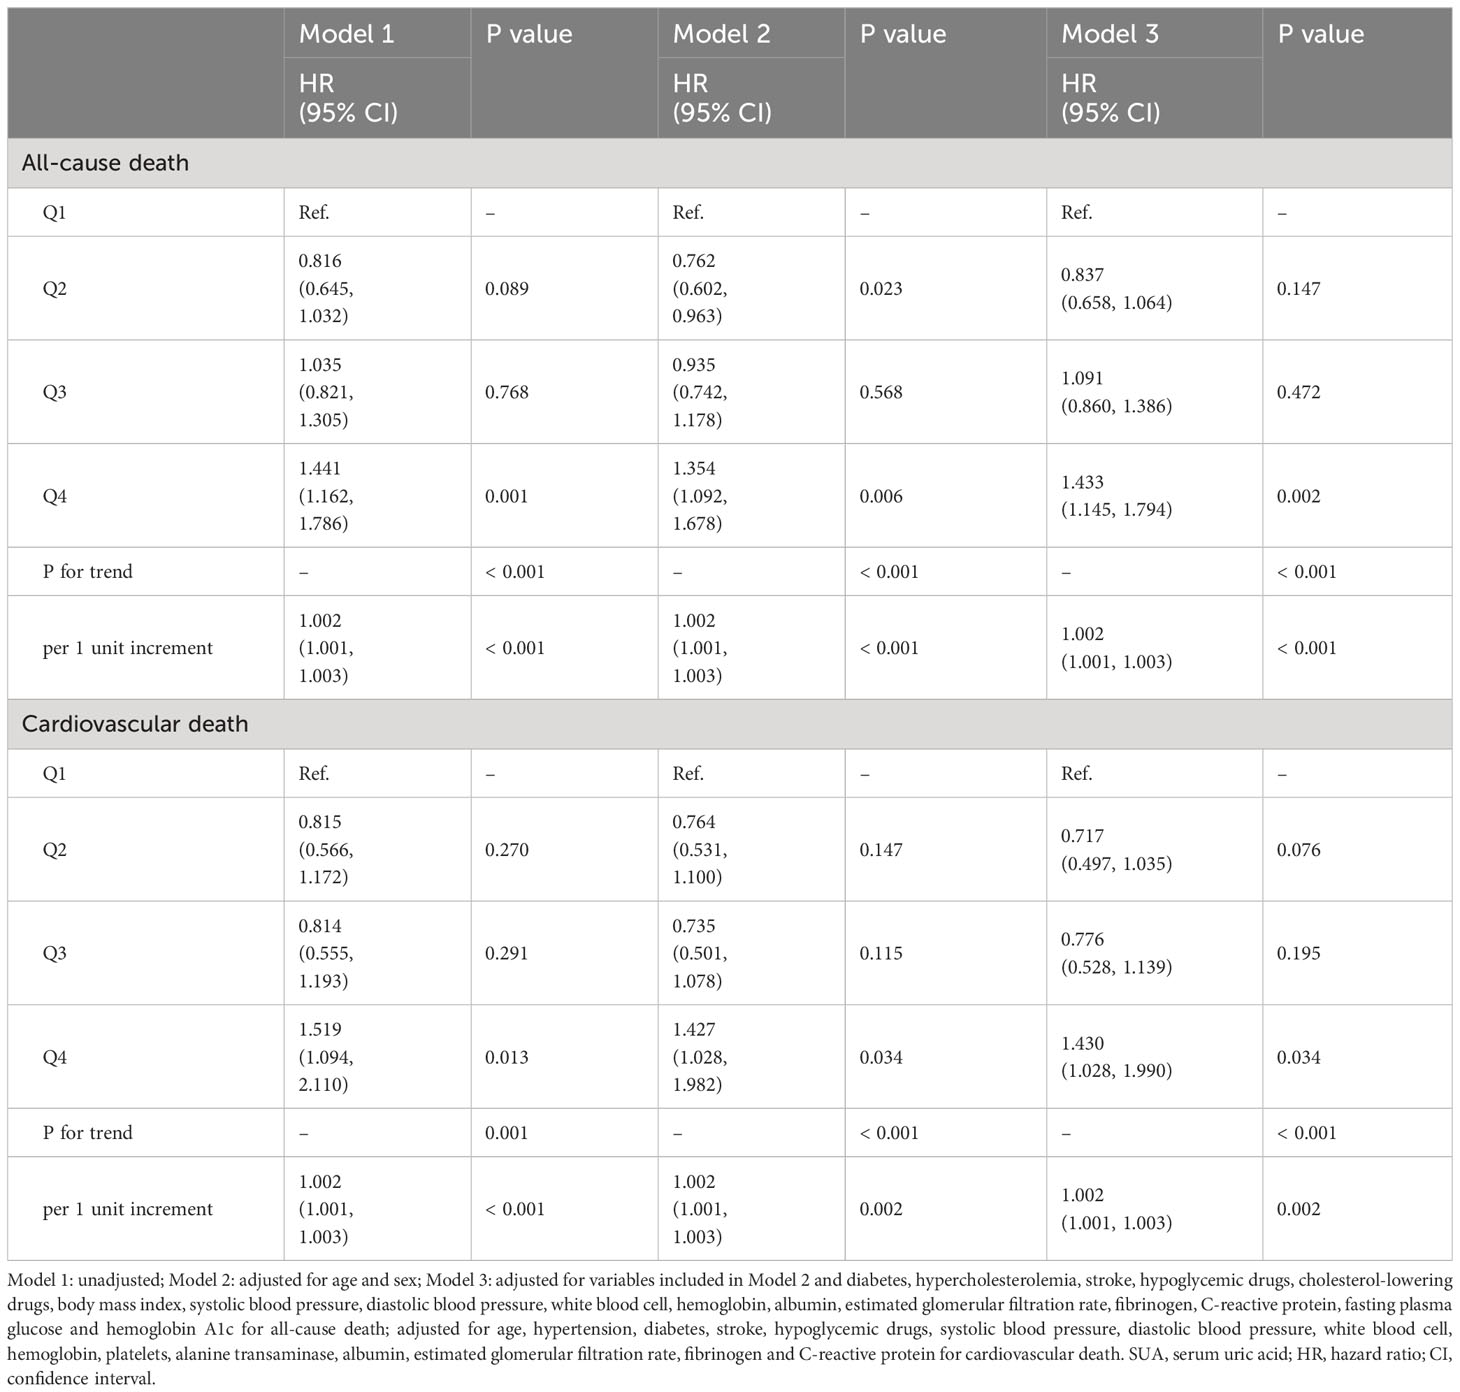
During the median follow-up period of 73 months, a total of 604 people died, of which 244 died of cardiovascular causes. As shown in Table 2. In the fully adjusted model (Model 3), when SUA was regarded as a continuous variable, it was closely associated with the risk of all-cause and cardiovascular death (HR: 1.002, 95% CI: 1.001-1.003, P < 0.001; HR: 1.002, 95% CI: 1.001-1.003, P = 0.002). When all participants were divided into four groups according to the quartile of SUA, compared with Q1 group, only individuals in Q4 group had higher risk of all-cause and cardiovascular death (HR: 1.433, 95% CI: 1.145-1.794, P = 0.002; HR: 1.430, 95% CI: 1.028-1.990, P = 0.034).
3.3 Subgroup analysis and sensitivity analysis
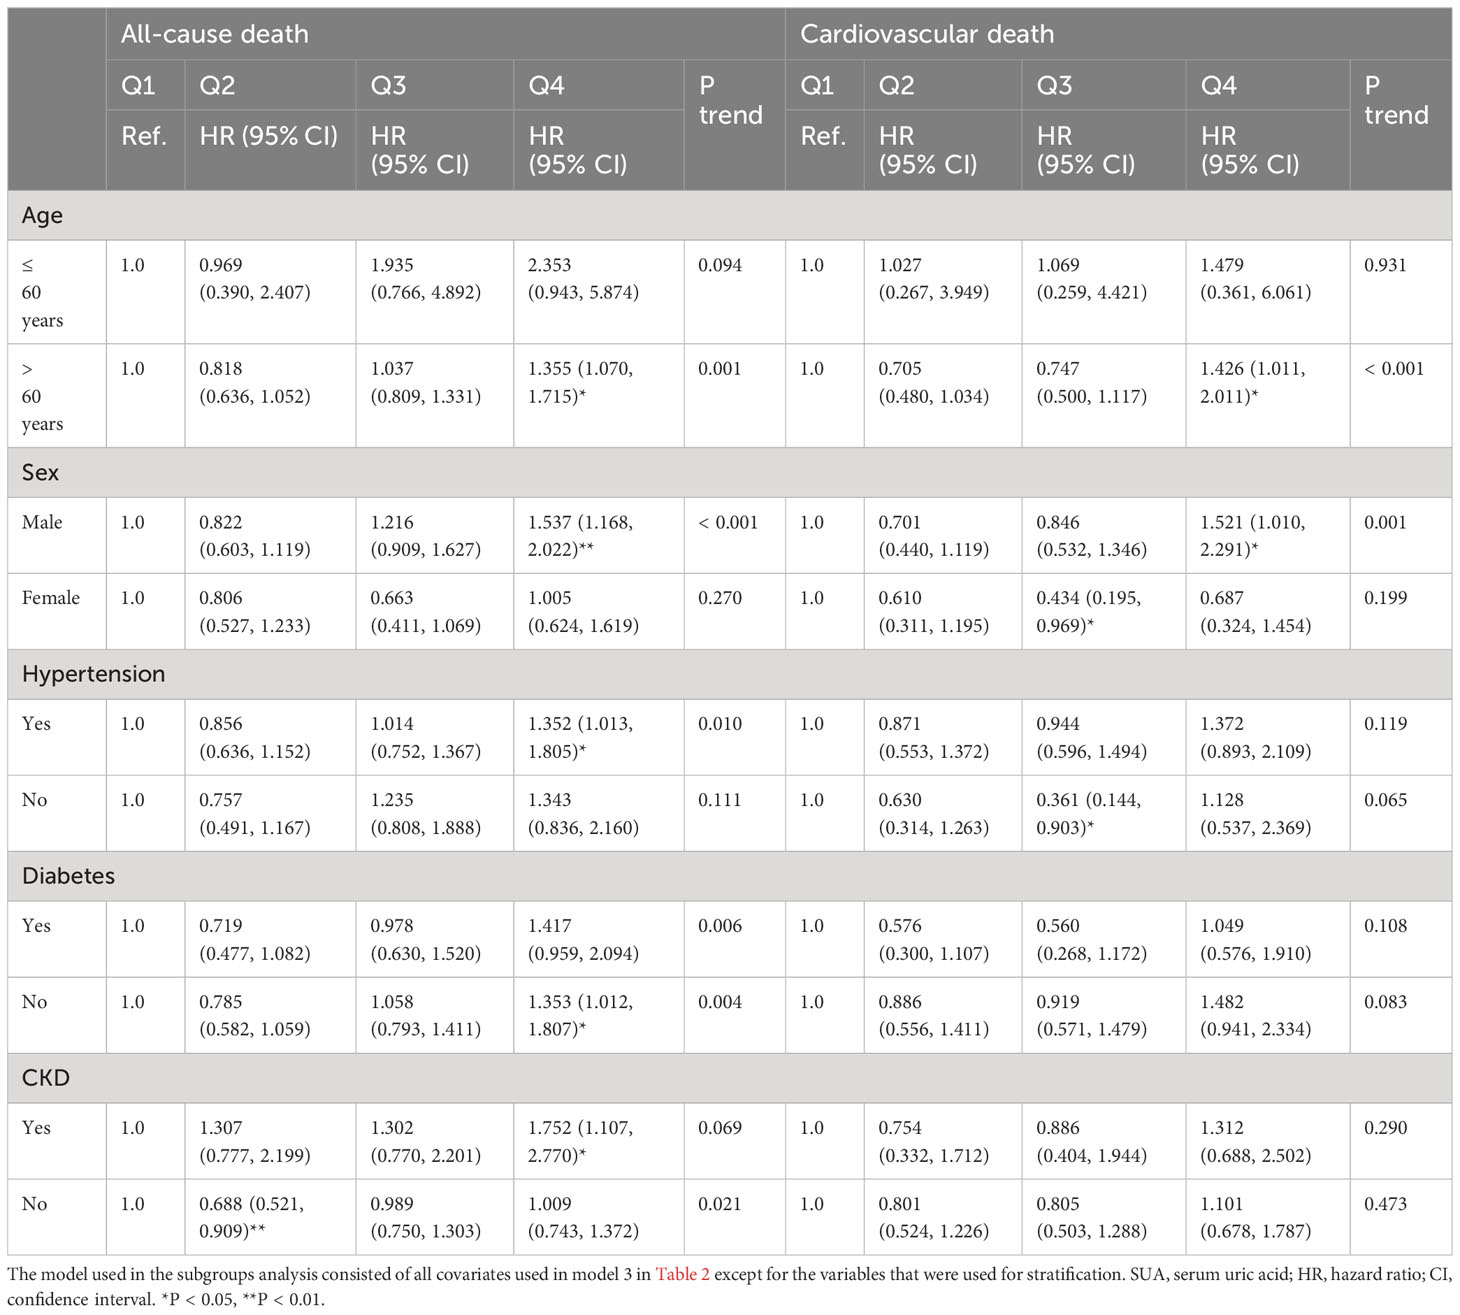
As shown in Table 3. Subgroup analysis showed that the association between SUA and all-cause death risk was still statistically significant in individuals over 60 years old, male, with hypertension, without diabetes and with CKD (P < 0.05), while the association with cardiovascular death risk only persisted in individuals over 60 years old and male (P < 0.05). As shown in Table 4, further sensitivity analysis showed that SUA was still closely associated with all-cause and cardiovascular death, whether as a continuous variable or a classified variable (Model 3, as a continuous variable, HR: 1.002, 95% CI: 1.001-1.003, P = 0.001; HR: 1.002, 95% CI: 1.000-1.003, P = 0.015; as a classified variable, HR: 1.381, 95% CI: 1.091-1.748, P = 0.007; HR: 1.430, 95% CI: 1.010-2.025, P = 0.044).
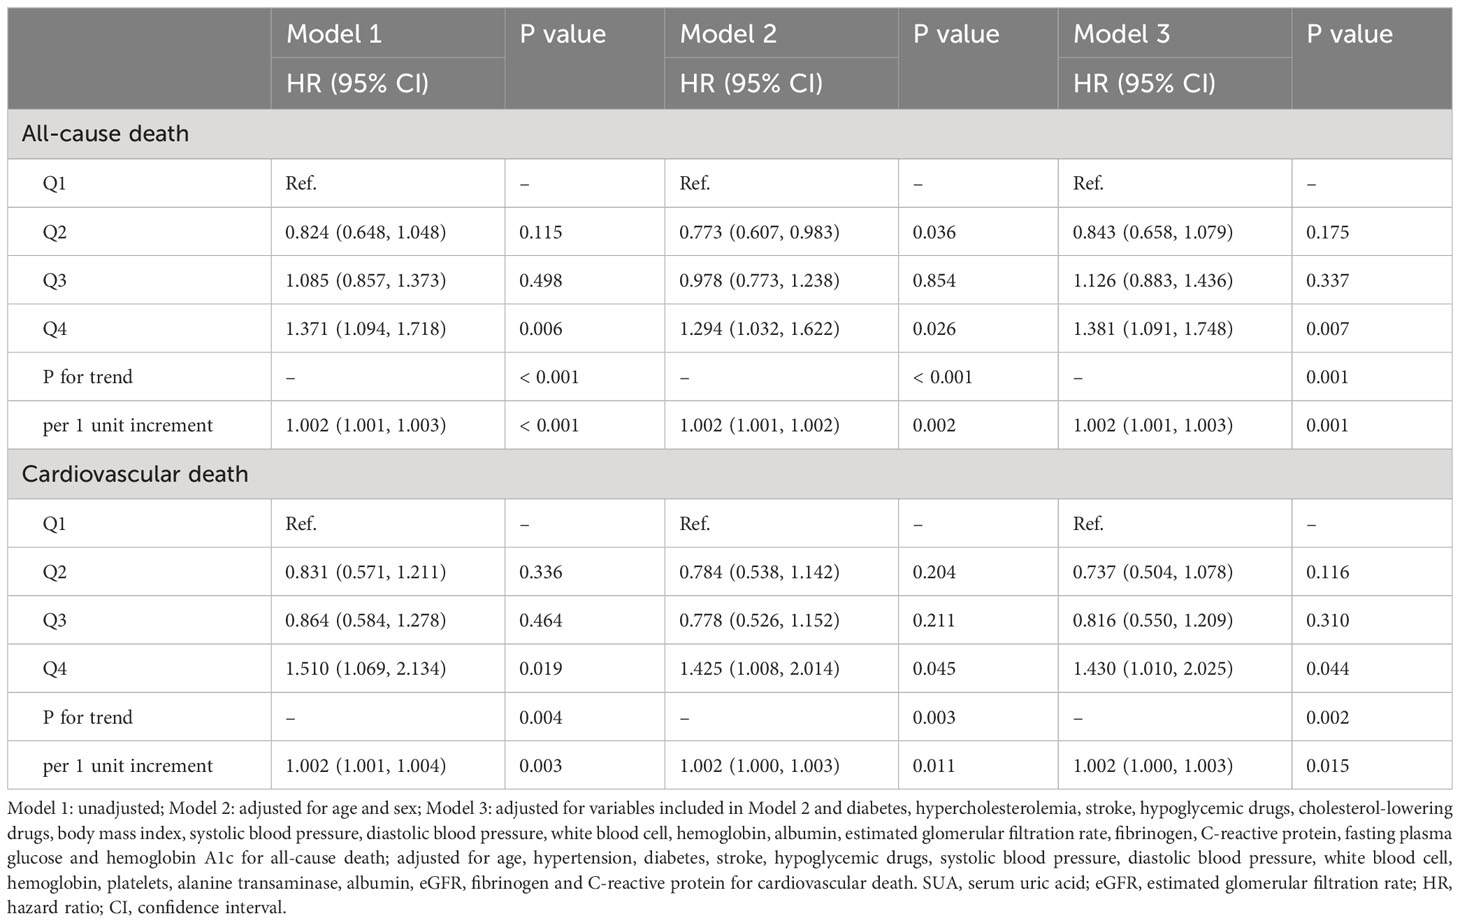
Table 4 Association between SUA with all-cause and cardiovascular death after excluding individuals with eGFR < 30 ml/min/1.73m2.
3.4 RCS and threshold effect analysis
As shown in Figure 3. RCS analysis revealed that SUA had a nonlinear association with all-cause and cardiovascular death risk (P for nonlinearity < 0.01). As shown in Table 5, threshold effect analysis showed that SUA below 345 umol/L was negatively associated with all-cause and cardiovascular death risk (HR: 0.997, 95% CI: 0.995-0.999, P = 0.016; HR: 0.996, 95% CI: 0.993-1.000, P = 0.040), while SUA above 345 umol/L was positively associated with all-cause and cardiovascular death risk (HR: 1.003, 95% CI: 1.002-1.004, P < 0.001; HR: 1.003, 95% CI: 1.002-1.005, P < 0.001), and the 2-piecewise regression model was better than the 1-line regression model (P for likelihood ratio test < 0.05).

Figure 3 RCS analysis of association of SUA with all-cause (A) and cardiovascular death (B). RCS, restricted cubic spline; SUA, serum uric acid; HR, hazard ratio; CI, confidence interval.
4 Discussion
In this prospective cohort study based on population survey data, we not only found that the association between SUA and all-cause and cardiovascular death was statistically significant in the analysis of the total population and several subgroups, but also found that there was a U-shaped nonlinear association between SUA and the risk of all-cause and cardiovascular death, which deserved us to pay more attention to the influence of different levels of SUA on individuals with CHD.
Current studies have shown that SUA is closely related to many metabolic-related diseases. For example, Li et al. confirmed that a higher level of SUA had an exact causal relationship with a higher risk of gout and kidney calculi after a general review of the evidence from observational studies, randomized controlled trials and Mendelian randomized studies (14). In addition, Hong et al. also found in a Mendelian randomized study that the increased SUA level was closely related to the higher risk of atrial fibrillation (15). Besides, Weng et al. revealed a positive causal relationship between SUA and venous thromboembolism in a cohort and Mendelian randomized study (16). And the correlation between SUA and cardiovascular events, especially sudden cardiac death, was subsequently confirmed (17). However, the correlation between SUA and all-cause death and cardiovascular death has not been reached. Several studies have shown that SUA level is positively correlated with the risk of all-cause death or cardiovascular death. For example, after 985 peritoneal dialysis patients were followed up for a median of 25.3 months, Xia et al. found that the increase of baseline SUA level was an independent risk factor for all-cause death and cardiovascular death (18). In another small sample study, Feng et al. also found that a higher level of SUA was related to the increase of all-cause mortality in peritoneal dialysis patients (19). In addition, Wang et al. also reached a conclusion in a meta-analysis, that is, for every 1 mg/mL increase in SUA, the cardiovascular mortality and all-cause mortality increased by 12% and 20% respectively (8). Nevertheless, another study showed that higher levels of SUA were associated with lower mortality. For example, Latif et al. unexpectedly found that higher SUA levels were closely related to lower risk of all-cause death and cardiovascular death in a large prospective cohort study involving 4637 hemodialysis patients, so they thought that this unusual research result should be the subject of further research (12). Furthermore, higher levels of SUA in hemodialysis patients may represent stronger antioxidant capacity and better nutritional status, which can be confirmed by the conclusion that SUA is positively correlated with blood phosphorus levels, which also reflects the existence of SUA paradox in hemodialysis patients (12). Similar to this study, our study showed that SUA was not associated with the risk of cardiovascular death in patients with CKD, suggesting that high levels of SUA might have a cardiovascular protective effect in dialysis or CKD patients. However, low levels of SUA may increase the risk of cardiovascular death through low antioxidant capacity or low nutritional status. In addition, even some studies have not found the correlation between SUA and all-cause death or cardiovascular death (10, 11). At present, the conclusion accepted by most people is that there is a nonlinear U-shaped relationship between SUA and all-cause death and cardiovascular death. For example, in a follow-up cohort of 2060721.9 person-years, Cho et al. confirmed the U-shaped correlation between SUA level and death risk, that is, lower or higher SUA was closely related to higher death risk (20). Another cohort study also showed that both lower and higher SUA levels were associated with increased all-cause and cardiovascular mortality, which further supported the U-shaped correlation between SUA and mortality (21). However, the above studies did not explore the relationship between SUA and the risk of death in people with CHD, while our study just made up for this. In this study, we not only found the significant correlation between SUA and all-cause death and cardiovascular death of individuals with CHD, but also further found that these correlations existed stably in various subgroups, and even revealed the approximate U-shaped nonlinear correlation and threshold effect between SUA and all-cause and cardiovascular death, which laid the foundation for future multi-center studies. Moreover, because the circulation levels of SUA in patients with eGFR < 30ml/min/1.73m2 are very different from that of other people, severe renal dysfunction has a great impact on the levels of SUA. Therefore, in order to prevent the main results of the study from being affected by renal failure, we excluded patients with eGFR < 30ml/min/1.73m2 from sensitivity analysis to re-verify the correlation between SUA and all-cause and cardiovascular death risk in patients with CHD, and the results showed that higher levels of SUA were still closely associated with higher risk of all-cause and cardiovascular death, suggesting that this correlation might not be mediated by severe renal dysfunction. In addition, our study was similar to the conclusions of the above two studies, that is, we also found an approximate U-shaped nonlinear association between SUA and all-cause and cardiovascular death. However, Cho et al. did not further explore the threshold effects between SUA and all-cause and cardiovascular death (20). Although Hu et al. continued to explore this point, they conducted the analysis in the general population, and they found that the inflection point of threshold effect was 339 umo/L and that SUA was both positively associated with all-cause and cardiovascular death at higher than 339 umo/L, whereas it was negatively associated with all-cause death only at lower than 339 umo/L, which was not entirely consistent with our findings (21). In our study, we confirmed that the inflection point of threshold effect between SUA and all-cause and cardiovascular death in people with CHD was 345 umo/L, and that SUA lower than 345 umo/L was negatively correlated with all-cause and cardiovascular death, while SUA higher than 345 umo/L was positively correlated with all-cause and cardiovascular death.
Although we have confirmed the correlation between SUA and all-cause and cardiovascular death in people with CHD, the mechanism driving these associations is still unclear. For a high level of SUA, it can lead to the occurrence and progress of some metabolic related diseases, which are closely related to the risk of death, so we guessed that SUA could indirectly increase the risk of death through these diseases. In addition, several studies have shown that high levels of SUA can activate oxidative stress and inflammatory stress, such as activation and enhancement of interleukin-1 β, cyclooxygenase-2, reactive oxygen species and renin-angiotensin system, thus promoting endothelial dysfunction, which may eventually lead to an increase in the risk of death (22, 23). For the lower levels of SUA, some studies show that it can reflect the nutritional status and antioxidant capacity of individuals. The lower levels of SUA often represent malnutrition and weak antioxidant capacity, so these people may lack some vitamins at the same time (such as vitamin C and vitamin D), which may induce oxidative stress and endothelial function damage, and eventually lead to the occurrence of some metabolic diseases and increased risk of death (24–30). Nevertheless, we can’t say exactly that this is the potential mechanism, and more research is needed to further explore.
In this cohort study, we have gained some research results, but several shortcomings of this study were inevitable. Firstly, this was a study based on population survey data, which was somewhat different from the data of hospitalized patients with CHD, so the conclusion need to be verified in hospitalized patients with CHD before extrapolation. Secondly, because the baseline data came from population survey, although the data of blood markers were comprehensive, there was a lack of echocardiography and coronary angiography data. Thirdly, the causal association cannot be determined by observational research, so genetic association research is needed to further confirm their relationship. Fourthly, because in this study, we only excluded individuals who lacked baseline SUA data as well as those who were lost to follow-up, and these data did not include data on gout and drugs that might affect SUA levels, so we were not sure whether patients with gout or patients using drugs that affected SUA levels were included, but we speculated that there might be some gout patients among these participants, and there might also be some participants who were using drugs that affected SUA levels. However, it is not clear whether these conditions will affect the main results, so we will make up for these defects and further improve the research design in future research to make the results more generalizable.
5 Conclusions
In this prospective cohort study, we found that SUA had a U-shaped nonlinear association with all-cause and cardiovascular death risk in individuals with CHD, which indicated that too high or too low SUA had an impact on premature death and excessive mortality of individuals with CHD, which also provided a reference for formulating treatment strategies and precise treatment that matched different populations.
Data availability statement
The original contributions presented in the study are included in the article/supplementary material. Further inquiries can be directed to the corresponding authors.
Ethics statement
The studies involving humans were approved by the National Center for Health Statistics of the Center for Disease Control and Prevention Institutional Review Board. The patients/participants provided their written informed consent to participate in this study. The studies were conducted in accordance with the Declaration of Helsinki.
Author contributions
XJY: Data curation, Writing - original draft, Writing - review & editing. JG: Data curation, Writing - original draft, Writing - review & editing. ZWW: Data curation, Writing - original draft, Writing - review & editing, Conceptualization, Methodology, Software, Formal analysis, Visualization. QYW: Writing - review & editing, Conceptualization, Validation, Funding acquisition, Project administration, Supervision. CJQ: Writing - review & editing, Conceptualization, Validation, Funding acquisition, Project administration, Supervision. FFW: Writing - review & editing, Conceptualization, Validation, Funding acquisition, Project administration, Supervision.
Funding
The author(s) declare financial support was received for the research, authorship, and/or publication of this article. This work was supported by the National Natural Science Foundation of China (No. 81900453), 2020 Postdoctoral Research Funding Program of Jiangsu Province (No. 2020Z089), 2021 China Postdoctoral Science Funding Program (No. 2021M690480), and Major Science and Technology Projects of Changzhou Science and Technology Bureau (No. CE20205047).
Acknowledgments
We thank the investigators, the staff, and the participants of the NHANES for their valuable contributions.
Conflict of interest
The authors declare that the research was conducted in the absence of any commercial or financial relationships that could be construed as a potential conflict of interest.
Publisher’s note
All claims expressed in this article are solely those of the authors and do not necessarily represent those of their affiliated organizations, or those of the publisher, the editors and the reviewers. Any product that may be evaluated in this article, or claim that may be made by its manufacturer, is not guaranteed or endorsed by the publisher.
References
1. Wu XW, Muzny DM, Lee CC, Caskey CT. Two independent mutational events in the loss of urate oxidase during hominoid evolution. J Mol Evol (1992) 34(1):78–84. doi: 10.1007/BF00163854
2. Shiozawa A, Szabo SM, Bolzani A, Cheung A, Choi HK. Serum uric acid and the risk of incident and recurrent gout: A systematic review. J Rheumatol (2017) 44(3):388–96. doi: 10.3899/jrheum.160452
3. Wilson L, Saseen JJ. Gouty arthritis: A review of acute management and prevention. Pharmacotherapy (2016) 36(8):906–22. doi: 10.1002/phar.1788
4. Ferraro PM, Curhan GC. Serum uric acid and risk of kidney stones. Am J Kidney Dis (2017) 70(2):158–9. doi: 10.1053/j.ajkd.2017.05.004
5. Copur S, Demiray A, Kanbay M. Uric acid in metabolic syndrome: Does uric acid have a definitive role? Eur J Intern Med (2022) 103:4–12. doi: 10.1016/j.ejim.2022.04.022
6. Borghi C, Rosei EA, Bardin T, Dawson J, Dominiczak A, Kielstein JT, et al. Serum uric acid and the risk of cardiovascular and renal disease. J Hypertens (2015) 33(9):1729–41. doi: 10.1097/HJH.0000000000000701
7. Deng Y, Huang J, Wong MCS. Association between serum uric acid and prostate cancer risk in East Asian populations: a Mendelian randomization study. Eur J Nutr (2023) 62(3):1323–9. doi: 10.1007/s00394-022-03076-7
8. Wang R, Song Y, Yan Y, Ding Z. Elevated serum uric acid and risk of cardiovascular or all-cause mortality in people with suspected or definite coronary artery disease: A meta-analysis. Atherosclerosis (2016) 254:193–9. doi: 10.1016/j.atherosclerosis.2016.10.006
9. Zhao G, Huang L, Song M, Song Y. Baseline serum uric acid level as a predictor of cardiovascular disease related mortality and all-cause mortality: a meta-analysis of prospective studies. Atherosclerosis (2013) 231(1):61–8. doi: 10.1016/j.atherosclerosis.2013.08.023
10. Cheong E, Ryu S, Lee JY, Lee SH, Sung JW, Cho DS, et al. Association between serum uric acid and cardiovascular mortality and all-cause mortality: a cohort study. J Hypertens (2017) 35(Suppl 1):S3–9. doi: 10.1097/HJH.0000000000001330
11. Ong G, Davis WA, Davis TM. Serum uric acid does not predict cardiovascular or all-cause mortality in type 2 diabetes: the Fremantle Diabetes Study. Diabetologia (2010) 53(7):1288–94. doi: 10.1007/s00125-010-1735-7
12. Latif W, Karaboyas A, Tong L, Winchester JF, Arrington CJ, Pisoni RL, et al. Uric acid levels and all-cause and cardiovascular mortality in the hemodialysis population. Clin J Am Soc Nephrol (2011) 6(10):2470–7. doi: 10.2215/CJN.00670111
13. Levey AS, Bosch JP, Lewis JB, Greene T, Rogers N, Roth D. A more accurate method to estimate glomerular filtration rate from serum creatinine: a new prediction equation. Modification of Diet in Renal Disease Study Group. Ann Intern Med (1999) 130(6):461–70. doi: 10.7326/0003-4819-130-6-199903160-00002
14. Li X, Meng X, Timofeeva M, Tzoulaki I, Tsilidis KK, Ioannidis JP, et al. Serum uric acid levels and multiple health outcomes: umbrella review of evidence from observational studies, randomised controlled trials, and Mendelian randomisation studies [published correction appears in BMJ. 2017 Aug 8;358:j3799]. BMJ (2017) 357:j2376. doi: 10.1136/bmj.j2376
15. Hong M, Park JW, Yang PS, Hwang I, Kim TH, Yu HT, et al. A mendelian randomization analysis: The causal association between serum uric acid and atrial fibrillation. Eur J Clin Invest (2020) 50(10):e13300. doi: 10.1111/eci.13300
16. Weng H, Li H, Zhang Z, Zhang Y, Xi L, Zhang D, et al. Association between uric acid and risk of venous thromboembolism in East Asian populations: a cohort and Mendelian randomization study. Lancet Reg Health West Pac (2023) 39:100848. doi: 10.1016/j.lanwpc.2023.100848
17. Kleber ME, Delgado G, Grammer TB, Silbernagel G, Huang J, Krämer BK, et al. Uric acid and cardiovascular events: A mendelian randomization study. J Am Soc Nephrol (2015) 26(11):2831–8. doi: 10.1681/ASN.2014070660
18. Xia X, He F, Wu X, Peng F, Huang F, Yu X. Relationship between serum uric acid and all-cause and cardiovascular mortality in patients treated with peritoneal dialysis. Am J Kidney Dis (2014) 64(2):257–64. doi: 10.1053/j.ajkd.2013.08.027
19. Feng S, Jiang L, Shi Y, Shen H, Shi X, Jin D, et al. Uric acid levels and all-cause mortality in peritoneal dialysis patients. Kidney Blood Press Res (2013) 37(2-3):181–9. doi: 10.1159/000350143
20. Cho SK, Chang Y, Kim I, Ryu S. U-shaped association between serum uric acid level and risk of mortality: A cohort study. Arthritis Rheumatol (2018) 70(7):1122–32. doi: 10.1002/art.40472
21. Hu L, Hu G, Xu BP, Zhu L, Zhou W, Wang T, et al. U-shaped association of serum uric acid with all-cause and cause-specific mortality in US adults: A cohort study. J Clin Endocrinol Metab (2020) 105(1):dgz068. doi: 10.1210/clinem/dgz068
22. Braga TT, Forni MF, Correa-Costa M, Ramos RN, Barbuto JA, Branco P, et al. Soluble uric acid activates the NLRP3 inflammasome. Sci Rep (2017) 7:39884. doi: 10.1038/srep39884
23. Yu MA, Sánchez-Lozada LG, Johnson RJ, Kang DH. Oxidative stress with an activation of the renin-angiotensin system in human vascular endothelial cells as a novel mechanism of uric acid-induced endothelial dysfunction. J Hypertens (2010) 28(6):1234–42. doi: 10.1097/HJH.0b013e328337da1d
24. Cutler RG. Urate and ascorbate: their possible roles as antioxidants in determining longevity of mammalian species. Arch Gerontol Geriatr (1984) 3(4):321–48. doi: 10.1016/0167-4943(84)90033-5
25. Stiburkova B, Stekrova J, Nakamura M, Ichida K. Hereditary renal hypouricemia type 1 and autosomal dominant polycystic kidney disease. Am J Med Sci (2015) 350(4):268–71. doi: 10.1097/MAJ.0000000000000550
26. Wakasugi M, Kazama JJ, Narita I, Konta T, Fujimoto S, Iseki K, et al. Association between hypouricemia and reduced kidney function: a cross-sectional population-based study in Japan. Am J Nephrol (2015) 41(2):138–46. doi: 10.1159/000381106
27. Choi HK, Liu S, Curhan G. Intake of purine-rich foods, protein, and dairy products and relationship to serum levels of uric acid: the Third National Health and Nutrition Examination Survey. Arthritis Rheum (2005) 52(1):283–9. doi: 10.1002/art.20761
28. Beberashvili I, Sinuani I, Azar A, Shapiro G, Feldman L, Stav K, et al. Serum uric acid as a clinically useful nutritional marker and predictor of outcome in maintenance hemodialysis patients. Nutrition (2015) 31(1):138–47. doi: 10.1016/j.nut.2014.06.012
29. Davies KJ, Sevanian A, Muakkassah-Kelly SF, Hochstein P. Uric acid-iron ion complexes. A new aspect of the antioxidant functions of uric acid. Biochem J (1986) 235(3):747–54. doi: 10.1042/bj2350747
Keywords: uric acid, coronary heart disease, all-cause death, cardiovascular death, mortality
Citation: Yan X, Gong J, Wang Z, Wu Q, Qi C and Wang F (2023) Serum uric acid was non-linearly associated with the risk of all-cause and cardiovascular death in individuals with coronary heart disease: a large prospective cohort study. Front. Endocrinol. 14:1278595. doi: 10.3389/fendo.2023.1278595
Received: 16 August 2023; Accepted: 17 November 2023;
Published: 13 December 2023.
Edited by:
Yalcin Solak, Sakarya University, TürkiyeReviewed by:
Giulio Romano, University of Udine, ItalyAbdülmecit Yıldız, Bursa Uludağ University, Türkiye
Copyright © 2023 Yan, Gong, Wang, Wu, Qi and Wang. This is an open-access article distributed under the terms of the Creative Commons Attribution License (CC BY). The use, distribution or reproduction in other forums is permitted, provided the original author(s) and the copyright owner(s) are credited and that the original publication in this journal is cited, in accordance with accepted academic practice. No use, distribution or reproduction is permitted which does not comply with these terms.
*Correspondence: Qiyong Wu, d3F5eHljeHlAYWxpeXVuLmNvbQ==; Chunjian Qi, cWljaHVuamlhbkBuam11LmVkdS5jbg==; Fangfang Wang, bGlnaHR5ZWFyd2ZmQDE2My5jb20=
†These authors have contributed equally to this work
 Xuejiao Yan1†
 Zhenwei Wang
 Chunjian Qi