 Hao Liang
 Hai-Bo Mu
 Fei-Hu Zhang
 Wen-Qiang Li
 Guo-Chen Li
 Wen-Dong Li
 Min Liang
 Zeng-Lin He
95% of researchers rate our articles as excellent or good
Learn more about the work of our research integrity team to safeguard the quality of each article we publish.
Find out more
ORIGINAL RESEARCH article
Front. Endocrinol. , 21 November 2023
Sec. Clinical Diabetes
Volume 14 - 2023 | https://doi.org/10.3389/fendo.2023.1277153
Objective: To investigate the causal relationships between linoleic acid and type 2 diabetes, and between linoleic acid and glycemic traits in European populations.
Methods: This study employed a two-sample Mendelian randomization approach to infer causality between linoleic acid and type 2 diabetes, as well as between linoleic acid and glycemic traits, leveraging genetic variations. Data were sourced from genome-wide association study summary datasets. Random-effects inverse-variance weighted, weighted median, and MR-Egger methods were used for the two-sample Mendelian randomization analyses. Results were presented as odds ratios with a 95% confidence interval. Multiple sensitivity analyses were conducted to assess result robustness.
Results: MR findings indicated a correlation between linoleic acid levels and the risk of type 2 diabetes, fasting blood glucose, and glycated hemoglobin (HbA1c), but not with fasting insulin. Specifically: type 2 diabetes (OR: 0.811, 95% CI: 0.688–0.956, P=0.013<0.05),fasting blood glucose (β_IVW): -0.056, 95% CI: (-0.091,-0.021), P=0.002< 0.0125), glycated hemoglobin (β_IVW: -0.032, 95% CI: (-0.048,-0.015), P=0.0002< 0.0125) and Fasting insulin (β_IVW: -0.024, 95% CI: (-0.056,-0.008), P=0.136 >0.05).Reverse MR analyses showed a correlation between type 2 diabetes and reduced levels of linoleic acid (β_IVW: -0.033, 95% CI: (-0.059,-0.006), P=0.014<0.05). Multiple sensitivity analyses also detected study heterogeneity but found no evidence of horizontal pleiotropy.
Conclusion: High levels linoleic acid can reduce the risk of type 2 diabetes, fasting blood glucose, and glycated hemoglobin, but has no significant relation with fasting insulin. Type 2 diabetes can lower linoleic acid levels; however, no significant causal relationship was observed between the three glycemic traits and reduced levels of linoleic acid.
Diabetes mellitus is a prevalent chronic metabolic disorder characterized by elevated blood glucose levels (1). Globally, the incidence of Type 2 Diabetes (T2D) has been on the rise. According to the International Diabetes Federation (IDF), as of 2021, an astonishing 536.6 million individuals, or 10.5% of the global population, were living with diabetes. This number is projected to soar to 783.2 million by 2045 (2). The global health burden imposed by diabetes has seen a significant uptick from 1990 to 2019 (3). T2D is a multifactorial condition marked by impaired pancreatic β-cell function and the onset of peripheral tissue insulin resistance, culminating in clinical manifestations (4). The etiology and causal associations of T2D may involve intricate interactions among genetic, behavioral, and environmental factors. These include sedentary lifestyles, poor dietary patterns, obesity, familial predisposition, advancing age, and even racial or ethnic attributes (5). T2D increases the risk for an array of diabetes-related complications such as cardiovascular diseases, renal anomalies, ocular abnormalities, microvascular disorders (6), and premature mortality (7). Consequently, a deep understanding of factors related to the genesis of T2D becomes pivotal to devise proactive strategies aiming to prevent and mitigate the adverse outcomes of this ailment.
Linoleic Acid (LA) is the predominant Ω-6 polyunsaturated fatty acid (PUFA), constituting about 80-90% of the overall dietary PUFA composition (8). The relationship between LA and T2D has sparked an ongoing discourse, encompassing diverse perspectives and academic debates. A meta-analysis synthesizing multiple cohort studies has corroborated the intimate association between LA and T2D (9). Various meta-analyses have probed into the pivotal role of LA in the pathogenesis of T2D. Consolidated findings elucidate a strong association between increased dietary LA intake and elevated physiological levels of LA, both of which are inversely correlated with the incidence of T2D. These compelling outcomes suggest that LA could potentially serve as a crucial protective factor against this metabolic disorder (10, 11). Nonetheless, the current evidence falls short of offering ample validation to endorse significant alterations in the intake of long-chain Ω-3 fatty acids, α-LA, Ω-6 fats, or overall PUFAs concerning their impact on glucose metabolism or diabetes risk (12). It’s hypothesized that Ω-6 PUFAs have a tight nexus with the onset of hyperinsulinemia, positioning Ω-6 PUFA as a distinguishable biomarker for hyperinsulinemia rather than exerting protective or detrimental effects on T2D (13). Moreover, certain studies have also indicated a correlation between LA and enhanced susceptibility to T2D (14). At present, most studies delving into the causal relationship between LA and T2D are grounded in observational and cohort research. However, to establish a definitive causality, rigorous randomized controlled trials are warranted. It’s noteworthy that executing such trials could be cost-prohibitive or unfeasible.
In Mendelian randomization(MR) studies, genetic variation adheres to the principle of random gene assortment, analogous to randomized controlled trials. MR serves as a potent tool in epidemiological research, leveraging genetic variants as instruments to elucidate causal associations between exposures and outcomes. By effectively sidestepping pitfalls of reverse causation and confounding factors, this methodological approach preserves the integrity of study findings, ensuring robust causal inferences (15). In traditional observational studies, describing causal relationships is challenging due to the potential presence of confounders and reverse causation. However, using genetic variants as instrumental variables (IVs), Mendelian randomization analysis offers a precise avenue to scrutinize and quantify these causal links.To ensure the reliability of such analyses, three fundamental assumptions must be satisfied: (1) IVs robustly correlate with the exposure, (2) they remain unaffected by confounders that could disrupt the relationship between exposure and outcome, and (3) they influence the outcome solely through their direct impact on exposure. In a comprehensive investigation of the effects of linoleic acid in the context of T2D, this study employed a two-sample MR analysis using data from genome-wide association study (GWAS). The primary objective was to discern the intricate causal relationship between LA levels in the blood and T2D, along with its associated glycemic traits.
This study employed a complex and academic research design, incorporating two-sample MR analyses, to meticulously investigate the intricate causal relationships among circulating LA concentrations and T2D, fasting blood glucose, fasting insulin, and glycated hemoglobin (HbA1c). The study rigorously scrutinized three key assumptions: (1) a profound and highly significant correlation exists between the IVs and circulating LA levels, (2) the IVs are unrelated to confounding factors, and (3) the IVs have no effect on T2D, fasting blood glucose, fasting insulin, and HbA1c, influencing the outcomes solely through its impact on LA. The primary MR investigated the causal relationship between circulating LA as the exposure variable and T2D along with its glycemic traits as outcome variables. Simultaneously, reverse causal relationships were explored by treating T2D and glycemic traits as exposure variables and circulating LA levels as the outcome variable (see Figure 1).
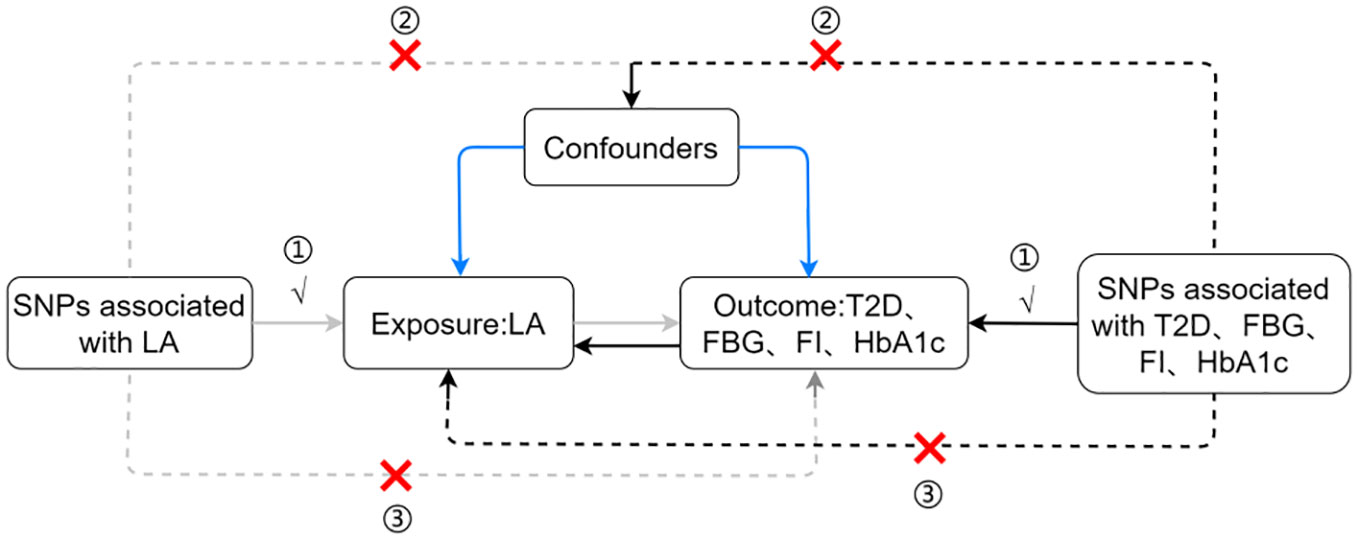
Figure 1 Assumptions and study design flowchart of the MR study. LA, linoleic acid; T2D, Type 2 Diabetes; FBG, fasting blood glucose; FI, fasting insulin.
The GWAS data used in this study were sourced from the IEU OpenGWAS database, which provides an extensive range of comprehensive genetic information. A thorough exposition of this can be found in Supplementary Table 1, where a detailed narrative is provided.
We implemented a series of comprehensive quality control procedures to ensure the inclusion of reliable and robust genetic IVs. First, we identified single nucleotide polymorphisms (SNPs) associated with the exposure using the established genome-wide significance threshold (P< 5 × 10^(-8)), based on the original GWAS data. Subsequently, we clumped linkage disequilibrium, grounding our approach in European ancestry referential data (1000 Genomes Project, r2 = 0.001, clump window = 10,000 kb). This step ensured the independence of all selected SNPs while effectively mitigating potential confounding from linkage disequilibrium. To alleviate the impact of weak instrument bias, we applied an F-statistic threshold () (16) greater than 10 for all exposure factors. To exclude any distortions caused by strand or allele coding, palindromic SNPs were carefully excluded from the analysis. To circumvent potential pleiotropic effects, we utilized the PhenoScanner database (http://www.phenoscanner.medschl.cam.ac.uk/) as a tool to screen for IVs associated with confounding factors or risk factors.
We executed complex two-sample MR analyses in the R version 4.2.2 environment, using the TwoSampleMR 0.5.6 package, including inverse variance weighted (IVW) (17), weighted median (18), and MR-Egger (19). The primary method employed in the MR analysis was IVW, as results derived from the IVW method are generally considered the most robust when all IVs are valid (20). Additionally, the Weighted Median and MR-Egger served as secondary analysis methods for reference in our study. For continuous outcome variables, we represented the results with β and 95% confidence intervals(CI). For binary outcome variables, we transformed the effect estimates into odds ratios (OR), serving as evaluation metrics describing the causal relationships among variables. The OR values, along with their precisely calculated 95% confidence intervals (CI), endowed our study results with scientific rigor and robustness, thereby enhancing the overall quality and reliability of the research. Horizontal pleiotropic effects may occur when IVs associated with the exposure have effects on the outcomes beyond the direct scope of the exposure. To assess the presence of horizontal pleiotropy, we used the MR-Egger intercept test, where a significance threshold (P< 0.05) detection indicates potential pleiotropic influences, emphasizing the necessity for cautious interpretation of the obtained results. Furthermore, we employed Cochran’s Q statistic to investigate heterogeneity, with statistically significant heterogeneity (P< 0.05) detected among the included studies indicating their heterogeneity. To visually display these results, we used funnel plots. When adopting the “leave-one-out” approach (21), we sequentially excluded each independent IV and calculated the combined effect of the remaining IVs to verify result reliability. To address the issue of multiple comparisons among the four groups, we implemented Bonferroni correction (corrected P-value: 0.05/4 = 0.0125). A calculated P-value less than 0.0125 was classified as statistically significant, considering the adjustment for multiple comparisons. Furthermore, P-values between 0.0125 and 0.05 were considered suggestive of a causal relationship.
The characteristics of carefully selected SNPs are elaborated in Supplementary Tables 2–9. Each selected SNP perfectly meets the selection criteria specified in the methods section. Furthermore, the IVs strength tests unequivocally demonstrate that there is no vulnerability to biased results, as all SNPs displayed an F-statistic value exceeding the threshold of 10.
The genetic predictive results for LA on T2D and glycemic traits are presented Supplementary Figure 1. Using IVW as the primary analysis method, the results reveal that linoleic acid is associated with a risk of T2D occurrence [OR: 0.811, 95% CI: 0.688–0.956, P=0.013] and fasting blood glucose concentration [β_IVW: -0.056, 95% CI: (-0.091,-0.021), P=0.002], with both the Weighed median and MR-Egger demonstrating the same causal relationship. However, MR-Egger did not find similar results; the results indicate that glycated hemoglobin [β_IVW: -0.032, 95% CI: (-0.048,-0.015), P=0.0002] exhibits a negative correlation, with both Weighed median and MR-Egger showing the same causal relationship. The results also demonstrate that linoleic acid has no significant causal relationship with fasting insulin [β_IVW: -0.024, 95% CI: (-0.056,-0.008), P=0.136], with MR-Egger and Weighed median similarly reflecting the same causal relationship, as shown in Supplementary Figure 2.
The genetic prediction results of LA for T2D and glycemic traits are shown in Supplementary Figure 3. Analysis mainly conducted using IVW method indicates that T2D is associated with reduced concentrations of LA [β_IVW: -0.033, 95% CI: (-0.059,-0.006), P=0.014]. The findings are consistent with weighted median, although not significant in MR-Egger analysis, as seen in Supplementary Figure 4. There were no significant associations between fasting plasma glucose, fasting insulin, and glycated hemoglobin with levels of LA (Supplementary Figure 3), including fasting blood glucose [β_IVW: -0.077, 95% CI: (-0.249,-0.094), P=0.375], fasting insulin [β_IVW: -0.16, 95% CI: (-0.394,0.074), P=0.181], and HbA1c [β_IVW: 0.136, 95% CI: (-0.075,0.347), P=0.207]. The results are in agreement with the remaining weighted median and MR-Egger, although the weighted median method for glycated hemoglobin and LA levels shows a significant association between the two [β_IVW:0.213, 95% CI: (0.097,-0.330), P=0.0003], as depicted in Supplementary Figure 4.
We conducted heterogeneity tests and horizontal pleiotropy tests on the results of MR analysis and reverse MR analysis for two sets of samples. Cochran’s Q test revealed significant heterogeneity across all study outcomes (P<0.05) (see Table 1; Supplementary Figures 5, 6). Therefore, a random effects model was utilized in the MR analysis to ensure the reliability of the results. Tests for horizontal pleiotropy showed no apparent trend toward zero for MR-Egger intercept term, and all study P-values were greater than 0.05 (see Table 1), indicating no underlying horizontal pleiotropy. Additionally, by employing a “leave-one-out” sensitivity analysis, where each SNP was excluded one by one and the MR analysis was repeated, the results obtained were consistent with the analysis including all SNPs. As illustrated in Supplementary Figures 7, 8, the determined causal relationships did not exhibit significant differences.

Table 1 Summary of Sensitivity Analysis Results.
Numerous previous studies have employed MR to determine the causal relationship between LA and various diseases, including but not limited to cardiovascular diseases, sleep apnea, and sepsis (22–24). However, current evidence regarding linoleic acid and T2D primarily stems from cohort studies, with results and views exhibiting evident contradictions and conflicts (10–14). Thus, a thorough exploration of the explicit association between the two will assist in early identification of potential patients, and this work becomes especially crucial for early monitoring and effective prevention and treatment.
This study is the first to apply bidirectional MR analysis to deeply investigate the impact of LA on the occurrence of T2D and glycemic traits. It aims to reveal the causal relationships among LA, T2D, and glycemic traits. The evidence obtained clearly indicates significant correlations between LA and T2D prevalence, along with various glycemic traits. High levels LA not only reduces the incidence of T2D but effectively lowers fasting blood glucose and glycated hemoglobin levels. Simultaneously, reverse MR analysis suggests a correlation between T2D and reduced levels of LA, but no substantive association exists between fasting glucose, fasting insulin, and glycated hemoglobin with circulating LA levels.
Meta-analysis from prospective cohort studies undeniably demonstrates a close correlation between increased dietary intake of LA and increased body concentration of LA, significantly reducing the likelihood of contracting T2D (11). A comprehensive integrated analysis covering 20 prospective longitudinal studies (10) clearly shows that, compared to arachidonic acid, increased LA concentration is strongly associated with reduced susceptibility to T2D, consistent with MR causal inference results. Additionally, this research reveals that high levels of LA can improve glucose and insulin resistance, fully aligning with causal inference results: first, glycated hemoglobin can be used as an indicator to assess average plasma glucose levels over the previous three months (25); second, the Homeostatic Model Assessment for Insulin Resistance (HOMA-IR) index is used to assess insulin resistance, calculated as fasting insulin (μU/mL) × fasting blood glucose (mmol/L)/22.5 (26), and we can deduce that LA may improve insulin resistance. In reverse causal inference analysis, we found a correlation between T2D and reduced levels of LA, a view consistent with previous research (27).
Although the exact causal mechanism by which LA levels reduce the risk of developing T2D occurrence risk has not been fully elucidated, scholars have proposed several explanations. LA, a vital component of cell membranes, can alter membrane fluidity and regulate insulin sensitivity when integrated into phospholipids (28). High levels of LA can increase total and High Molecular Weight (HMW) adiponectin concentrations (29), A recent study showed a positive correlation between lipocalin levels and insulin sensitivity, lipocalin improves insulin sensitivity through its upregulation of IRS-2 in the liver and can lower blood glucose (30, 31). This may be a mechanism by which LA reduces the risk of developing T2D.Additionally, LA is considered a PUFA in most Western diets, found in plant oils, nuts, and seeds (32). LA is metabolized in various tissues by delta-6 desaturase to form gamma-linolenic acid (GLA), which is then rapidly elongated to dihomo-gamma-linolenic acid (DGLA). DGLA can be further desaturated by delta-5 desaturase to form arachidonic acid (AA). However, human delta-5 desaturase activity is limited, with only a portion of DGLA being converted to AA (33, 34). Metabolites of DGLA, such as prostaglandin E1, can enhance insulin action (35). AA is also a precursor to various important bioactive lipid mediators, including series 2 prostaglandins (such as PGE2, PGD2, PGF2α, and PGI2) (36). PGE2 not only enhances insulin sensitivity but also increases muscle glycolysis (37). PGD2 also regulates insulin, with PGD2 in white adipose tissue primarily produced by hematopoietic PGD synthase in macrophages, causing macrophages to polarize from an inflammatory M1 state to an anti-inflammatory M2 state. This polarization of macrophages correlates positively with adipose insulin sensitivity (38). These results suggest that LA metabolites PGE1 and PGE2 may improve adipose insulin resistance by enhancing insulin sensitivity, and PGD2 may do so by regulating macrophage polarization, thereby reducing the risk of T2D. As for the mechanism of T2D reducing LA levels, it’s not entirely clear, but possible mechanisms include a significant increase in the abundance of Lactobacillus in the gut microbiome of T2D patients (39). In the gastrointestinal tract, Lactobacillus promotes the transformation of LA, thus reducing the gastrointestinal uptake of LA and lowering circulating LA levels. This phenomenon may explain a potential mechanism for reduced LA concentration in T2D patients.
These findings presented in this study may hold significant clinical implications. The prevalence of T2D is experiencing a sharp increase globally (2), underscoring the necessity for extensive preventive and therapeutic measures. We found that maintaining high levels LA might benefit in reducing the risk of T2D onset. In all major guidelines, diet is the cornerstone of prevention and treatment (40). Therefore, from a healthcare professional perspective, it may be worth considering recommending more LA-rich foods or supplements to high-risk populations for T2D, especially those with genetic susceptibility. However, it should be noted that these findings are solely based on genetic analysis, so further research is needed to validate the clinical efficacy of these recommendations.
This MR study exhibits the following advantages. Firstly, it employs genetic variations as IVs to infer the causal relationships between LA and T2D occurrence risk and glycemic traits. This approach significantly minimizes the potential influences of confounding factors and reverse causality, both of which are common challenges in traditional observational studies (41–43). Secondly, the study leverages large-scale genomic data provided by the IEU summary database, notably enhancing the applicability and robustness of the research findings. Thirdly, the utilization of public datasets and open-source software further bolsters the transparency and reproducibility of the study. Fourthly, this method allows for the assessment of the degree of causal effects, the results of which may have substantial and lasting impacts on clinical and public health decisions. Overall, this MR study offers vital insights into the causal relationships between LA and the risk of T2D onset and glycemic traits.
Despite our study’s strengths, there are certain acknowledged limitations. Firstly, our reliance on GWAS data involving only European ancestry populations hampers the generalizability of our findings to other groups, imposing a constraint on the study in terms of population diversity. Secondly, our research lacks adequate sensitivity analysis to assess the possibility of horizontal pleiotropy, even though we used the MR-Egger intercept test and found no clear evidence of horizontal pleiotropy in our statistical analysis. Thirdly, we observed some heterogeneity in the results. Nevertheless, the random-effects IVW remains the primary analytical method, effectively controlling for the influence of summary data heterogeneity. Fourthly, our sole reliance on genetic-level evidence limits further observational studies and mediation analyses to validate the specific regulatory mechanisms of the causal relationship between LA, T2D, and glycemic traits. Fifthly, we only studied linear causal relationships, as LA levels were treated as a continuous variable. Therefore, future research needs to encompass broader, more diverse populations, spanning different ancestries and cultures, and further conduct non-linear MR analysis to delve into the potential non-linear effects of LA levels on T2D and glycemic traits.
Overall, our study is groundbreaking, employing a bidirectional sample MR analysis to explore the causal relationships between LA, T2D, and glycemic traits. The results of this MR study validate the existence of a bidirectional causal link between glycemic traits and T2D. We found a significant negative correlation between high levels LA and susceptibility to T2D, and the occurrence of T2D seems to lead to a decrease in LA levels. Additionally, we observed a negative correlation between high levels LA and fasting blood glucose, as well as glycated hemoglobin levels. However, the complex relationship between LA and T2D, the association between LA and glycemic traits, and the potential mechanisms governing these relationships, require further in-depth exploration through original research. Considering the adverse consequences associated with T2D and the causal relationships identified in our study, we recommend increasing LA intake as a primary preventive measure for T2D.
The original contributions presented in the study are included in the article/Supplementary Material. Further inquiries can be directed to the corresponding author.
HL: Data curation, Formal Analysis, Software, Visualization, Writing – original draft, Writing – review & editing. H-BM: Data curation, Writing – original draft and Writing – review & editing. F-HZ: Writing – review & editing. W-QL: Funding acquisition, Methodology, Writing – review & editing. G-CL: Funding acquisition, Writing – review & editing. W-DL: Validation, Writing – review & editing. ML: Supervision, Writing – review & editing. Z-LH: Writing – review & editing.
The author(s) declare financial support was received for the research, authorship, and/or publication of this article. This study was funded by the National Natural Science Foundation Youth Project (82204876), the Shandong Province Natural Science Foundation (ZR2020MH347), and the Traditional Chinese Medicine Emergency Special Project for Novel Coronavirus Infection (2023ZYLCY J02-12).
The authors declare that the research was conducted in the absence of any commercial or financial relationships that could be construed as a potential conflict of interest.
All claims expressed in this article are solely those of the authors and do not necessarily represent those of their affiliated organizations, or those of the publisher, the editors and the reviewers. Any product that may be evaluated in this article, or claim that may be made by its manufacturer, is not guaranteed or endorsed by the publisher.
The Supplementary Material for this article can be found online at: https://www.frontiersin.org/articles/10.3389/fendo.2023.1277153/full#supplementary-material
1. Cao Z, Huang D, Tang C, Lu Y, Huang S, Peng C, et al. Pyroptosis in diabetes and diabetic nephropathy. Clin Chim Acta (2022) 531:188–96. doi: 10.1016/j.cca.2022.04.011
2. Sun H, Saeedi P, Karuranga S, Pinkepank M, Ogurtsova K, Duncan BB, et al. IDF Diabetes Atlas: Global, regional and country-level diabetes prevalence estimates for 2021 and projections for 2045. Diabetes Res Clin Pract (2022) 183:109119. doi: 10.1016/j.diabres.2021.109119
3. Sun J, Hu W, Ye S, Deng D, Chen M. The description and prediction of incidence, prevalence, mortality, disability-adjusted life years cases, and corresponding age-standardized rates for global diabetes. J Epidemiol Glob Health (2023) 13(3):566–76. doi: 10.1007/s44197-023-00138-9
4. Kasuga M. Insulin resistance and pancreatic beta cell failure. J Clin Invest (2006) 116(7):1756–60. doi: 10.1172/JCI29189
5. American Diabetes Association. 2. Classification and diagnosis of diabetes: standards of medical care in diabetes-2021. Diabetes Care (2021) 44(Suppl 1):S15–33. doi: 10.2337/dc21-S002
6. Angi A, Chiarelli F. Obesity and diabetes: A sword of damocles for future generations. Biomedicines (2020) 8(11):478. doi: 10.3390/biomedicines8110478
7. GBD 2016 Causes of Death Collaborators. Global, regional, and national age-sex specific mortality for 264 causes of death, 1980-2016: a systematic analysis for the Global Burden of Disease Study 2016. Lancet (2017) 390(10100):1151–210. doi: 10.1016/S0140-6736(17)32152-9
8. Wang XM, Gao Y, Eriksson JG, Chen W, Chong YS, Tan KH, et al. Metabolic signatures in the conversion from gestational diabetes mellitus to postpartum abnormal glucose metabolism: a pilot study in Asian women. Sci Rep (2021) 11(1):16435. doi: 10.1038/s41598-021-95903-w
9. Hu M, Fang Z, Zhang T, Chen Y. Polyunsaturated fatty acid intake and incidence of type 2 diabetes in adults: a dose response meta-analysis of cohort studies. Diabetol Metab Syndr (2022) 14(1):34. doi: 10.1186/s13098-022-00804-1
10. Wu JHY, Marklund M, Imamura F, Tintle N, Ardisson Korat AV, de Goede J, et al. Omega-6 fatty acid biomarkers and incident type 2 diabetes: pooled analysis of individual-level data for 39 740 adults from 20 prospective cohort studies. Lancet Diabetes Endocrinol (2017) 5(12):965–74. doi: 10.1016/S2213-8587(17)30307-8
11. Mousavi SM, Jalilpiran Y, Karimi E, Aune D, Larijani B, Mozaffarian D, et al. Dietary intake of linoleic acid, its concentrations, and the risk of type 2 diabetes: A systematic review and dose-response meta-analysis of prospective cohort studies. Diabetes Care (2021) 44(9):2173–81. doi: 10.2337/dc21-0438
12. Brown TJ, Brainard J, Song F, Wang X, Abdelhamid A, Hooper L, et al. Omega-3, omega-6, and total dietary polyunsaturated fat for prevention and treatment of type 2 diabetes mellitus: systematic review and meta-analysis of randomised controlled trials. BMJ (2019) 366:l4697. doi: 10.1136/bmj.l4697
13. Weir NL, Nomura SO, Steffen BT, Guan W, Karger AB, Klein R, et al. Associations between omega-6 polyunsaturated fatty acids, hyperinsulinemia and incident diabetes by race/ethnicity: The Multi-Ethnic Study of Atherosclerosis. Clin Nutr (2020) 39(10):3031–41. doi: 10.1016/j.clnu.2020.01.003
14. Sun Y, Gao HY, Fan ZY, He Y, Yan YX. Metabolomics signatures in type 2 diabetes: A systematic review and integrative analysis. J Clin Endocrinol Metab (2020) 105(4):dgz240. doi: 10.1210/clinem/dgz240
15. Davey Smith G, Hemani G. Mendelian randomization: genetic anchors for causal inference in epidemiological studies. Hum Mol Genet (2014) 23(R1):R89–98. doi: 10.1093/hmg/ddu328
16. Burgess S, Butterworth A, Thompson SG. Mendelian randomization analysis with multiple genetic variants using summarized data. Genet Epidemiol (2013) 37(7):658–65. doi: 10.1002/gepi.21758
17. Luo J, Xu Z, Noordam R, van Heemst D, Li-Gao R. Depression and inflammatory bowel disease: A bidirectional two-sample mendelian randomization study. J Crohns Colitis (2022) 16(4):633–42. doi: 10.1093/ecco-jcc/jjab191
18. Bowden J, Davey Smith G, Haycock PC, Burgess S. Consistent estimation in mendelian randomization with some invalid instruments using a weighted median estimator. Genet Epidemiol (2016) 40(4):304–14. doi: 10.1002/gepi.21965
19. Bowden J, Davey Smith G, Burgess S. Mendelian randomization with invalid instruments: effect estimation and bias detection through Egger regression. Int J Epidemiol (2015) 44(2):512–25. doi: 10.1093/ije/dyv080
20. Lawlor DA, Harbord RM, Sterne JA, Timpson N, Davey Smith G. Mendelian randomization: using genes as instruments for making causal inferences in epidemiology. Stat Med (2008) 27(8):1133–63. doi: 10.1002/sim.3034
21. Hemani G, Zheng J, Elsworth B, Wade KH, Haberland V, Baird D, et al. The MR-Base platform supports systematic causal inference across the human phenome. Elife (2018) 7:e34408. doi: 10.7554/eLife.34408
22. Borges MC, Haycock PC, Zheng J, Hemani G, Holmes MV, Davey Smith G, et al. Role of circulating polyunsaturated fatty acids on cardiovascular diseases risk: analysis using Mendelian randomization and fatty acid genetic association data from over 114,000 UK Biobank participants. BMC Med (2022) 20(1):210. doi: 10.1186/s12916-022-02399-w
23. Wang J, Huang Y, Yang H, Lin Z, Campos AI, Rentería ME, et al. Plasma polyunsaturated fatty acid concentrations and sleep apnea risk: A two-sample Mendelian randomization study. Front Nutr (2022) 9:956900. doi: 10.3389/fnut.2022.956900
24. Lei P, Xu W, Wang C, Lin G, Yu S, Guo Y. Mendelian randomization analysis reveals causal associations of polyunsaturated fatty acids with sepsis and mortality risk. Infect Dis Ther (2023) 12(7):1797–808. doi: 10.1007/s40121-023-00831-z
25. Luethi N, Cioccari L, Tanaka A, Kar P, Giersch E, Deane AM, et al. Glycated hemoglobin A1c levels are not affected by critical illness. Crit Care Med (2016) 44(9):1692–4. doi: 10.1097/CCM.0000000000001656
26. Lee SB, Ahn CW, Lee BK, Kang S, Nam JS, You JH, et al. Association between triglyceride glucose index and arterial stiffness in Korean adults. Cardiovasc Diabetol (2018) 17(1):41. doi: 10.1186/s12933-018-0692-1
27. Kolb LN, Othman A, Rohrer L, Krützfeldt J, von Eckardstein A. Altered distribution of unesterified cholesterol among lipoprotein subfractions of patients with diabetes mellitus type 2. Biomolecules (2023) 13(3):497. doi: 10.3390/biom13030497
28. Kröger J, Jacobs S, Jansen EH, Fritsche A, Boeing H, Schulze MB. Erythrocyte membrane fatty acid fluidity and risk of type 2 diabetes in the EPIC-Potsdam study. Diabetologia (2015) 58(2):282–9. doi: 10.1007/s00125-014-3421-7
29. Cole RM, Puchala S, Ke JY, Abdel-Rasoul M, Harlow K, O'Donnell B, et al. Linoleic acid-rich oil supplementation increases total and high-molecular-weight adiponectin and alters plasma oxylipins in postmenopausal women with metabolic syndrome. Curr Dev Nutr (2020) 4(9):nzaa136. doi: 10.1093/cdn/nzaa136
30. Zusi C, Csermely A, Rinaldi E, Bertoldo K, Bonetti S, Boselli ML, et al. Crosstalk between genetic variability of adiponectin and leptin, glucose-insulin system and subclinical atherosclerosis in patients with newly diagnosed type 2 diabetes. The Verona Newly Diagnosed Type 2 Diabetes Study 14. Diabetes Obes Metab (2023) 25(9):2650–8. doi: 10.1111/dom.15152
31. Awazawa M, Ueki K, Inabe K, Yamauchi T, Kubota N, Kaneko K, et al. Adiponectin enhances insulin sensitivity by increasing hepatic IRS-2 expression via a macrophage-derived IL-6-dependent pathway. Cell Metab (2011) 13(4):401–12. doi: 10.1016/j.cmet.2011.02.010
32. Innes JK, Calder PC. Omega-6 fatty acids and inflammation. Prostaglandins Leukot Essent Fatty Acids (2018) 132:41–8. doi: 10.1016/j.plefa.2018.03.004
33. de Goede J, Verschuren WM, Boer JM, Kromhout D, Geleijnse JM. Alpha-linolenic acid intake and 10-year incidence of coronary heart disease and stroke in 20,000 middle-aged men and women in the Netherlands. PloS One (2011) 6(3):e17967. doi: 10.1371/journal.pone.0017967
34. Bolton-Smith C, Woodward M, Tavendale R. Evidence for age-related differences in the fatty acid composition of human adipose tissue, independent of diet. Eur J Clin Nutr (1997) 51(9):619–24. doi: 10.1038/sj.ejcn.1600455
35. Horrobin DF, Cunnane SC. Interactions between zinc, essential fatty acids and prostaglandins: relevance to acrodermatitis enteropathica, total parenteral nutrition, the glucagonoma syndrome, diabetes, anorexia nervosa and sickle cell anaemia. Med Hypotheses (1980) 6(3):277–96. doi: 10.1016/0306-9877(80)90125-5
36. Sonnweber T, Pizzini A, Nairz M, Nairz M, Weiss G, Tancevski I, et al. Arachidonic acid metabolites in cardiovascular and metabolic diseases. Int J Mol Sci (2018) 19(11):3285. doi: 10.3390/ijms19113285
37. Leighton B, Budohoski L, Lozeman FJ, Challiss RA, Newsholme EA. The effect of prostaglandins E1, E2 and F2 alpha and indomethacin on the sensitivity of glycolysis and glycogen synthesis to insulin in stripped soleus muscles of the rat. Biochem J (1985) 227(1):337–40. doi: 10.1042/bj2270337
38. Virtue S, Masoodi M, de Weijer BA, van Eijk M, Mok CY, Eiden M, et al. Prostaglandin profiling reveals a role for haematopoietic prostaglandin D synthase in adipose tissue macrophage polarisation in mice and humans. Int J Obes (Lond) (2015) 39(7):1151–60. doi: 10.1038/ijo.2015.34
39. Chen PC, Chien YW, Yang SC. The alteration of gut microbiota in newly diagnosed type 2 diabetic patients. Nutrition (2019) 63-64:51–6. doi: 10.1016/j.nut.2018.11.019
40. Evert AB, Boucher JL, Cypress M, Dunbar SA, Franz MJ, Mayer-Davis EJ, et al. Nutrition therapy recommendations for the management of adults with diabetes. Diabetes Care (2013) 36(11):3821–42. doi: 10.2337/dc13-2042
41. Bowden J, Holmes MV. Meta-analysis and Mendelian randomization: A review. Res Synth Methods (2019) 10(4):486–96. doi: 10.1002/jrsm.1346
42. Mukamal KJ, Stampfer MJ, Rimm EB. Genetic instrumental variable analysis: time to call mendelian randomization what it is. The example of alcohol and cardiovascular disease. Eur J Epidemiol (2020) 35(2):93–7. doi: 10.1007/s10654-019-00578-3
Keywords: linoleic acid, type 2 diabetes, glycemic traits, causal relationship, Mendelian randomization
Citation: Liang H, Mu H-B, Zhang F-H, Li W-Q, Li G-C, Li W-D, Liang M and He Z-L (2023) Causal relationship between linoleic acid and type 2 diabetes and glycemic traits: a bidirectional Mendelian randomization study. Front. Endocrinol. 14:1277153. doi: 10.3389/fendo.2023.1277153
Received: 14 August 2023; Accepted: 30 October 2023;
Published: 21 November 2023.
Edited by:
Åke Sjöholm, Gävle Hospital, SwedenReviewed by:
Jerzy Beltowski, Medical University of Lublin, PolandCopyright © 2023 Liang, Mu, Zhang, Li, Li, Li, Liang and He. This is an open-access article distributed under the terms of the Creative Commons Attribution License (CC BY). The use, distribution or reproduction in other forums is permitted, provided the original author(s) and the copyright owner(s) are credited and that the original publication in this journal is cited, in accordance with accepted academic practice. No use, distribution or reproduction is permitted which does not comply with these terms.
*Correspondence: Wen-Qiang Li, YW1vc2xlZTEyMEAxNjMuY29t
†These authors have contributed equally to this work and share first authorship
Disclaimer: All claims expressed in this article are solely those of the authors and do not necessarily represent those of their affiliated organizations, or those of the publisher, the editors and the reviewers. Any product that may be evaluated in this article or claim that may be made by its manufacturer is not guaranteed or endorsed by the publisher.
Research integrity at Frontiers
Learn more about the work of our research integrity team to safeguard the quality of each article we publish.