 Andrea Benzi1*
 Markus Heine2
 Sonia Spinelli3
 Annalisa Salis1Anna Worthmann2Björn Diercks2Cecilia Astigiano1Raúl Pérez Mato1Adela Memushaj1
 Laura Sturla1Valerio Vellone4,5Gianluca Damonte1
 Michelle Y. Jaeckstein2
 Friedrich Koch-Nolte6
 Hans-Willi Mittrücker6
 Andreas H. Guse2Antonio De Flora1
 Joerg Heeren2†
 Santina Bruzzone1,7†
- 1Department of Experimental Medicine-Section of Biochemistry, University of Genova, Genova, Italy
- 2Department of Biochemistry and Molecular Cell Biology, University Medical Center Hamburg-Eppendorf, Hamburg, Germany
- 3Laboratory of Molecular Nephrology, IRCCS Istituto Giannina Gaslini, Genova, Italy
- 4Department of Surgical Sciences and Integrated Diagnostics (DISC), University of Genoa, Genova, Italy
- 5Pathology Unit, IRCCS Istituto Giannina Gaslini, Genova, Italy
- 6Institute of Immunology, University Medical Center Hamburg-Eppendorf, Hamburg, Germany
- 7IRCCS Ospedale Policlinico San Martino, Genova, Italy
Introduction: During thermogenesis, adipose tissue (AT) becomes more active and enhances oxidative metabolism. The promotion of this process in white AT (WAT) is called “browning” and, together with the brown AT (BAT) activation, is considered as a promising approach to counteract obesity and metabolic diseases. Transient receptor potential cation channel, subfamily M, member 2 (TRPM2), is an ion channel that allows extracellular Ca2+ influx into the cytosol, and is gated by adenosine diphosphate ribose (ADPR), produced from NAD+ degradation. The aim of this study was to investigate the relevance of TRPM2 in the regulation of energy metabolism in BAT, WAT, and liver during thermogenesis.
Methods: Wild type (WT) and Trpm2-/- mice were exposed to 6°C and BAT, WAT and liver were collected to evaluate mRNA, protein levels and ADPR content. Furthermore, O2 consumption, CO2 production and energy expenditure were measured in these mice upon thermogenic stimulation. Finally, the effect of the pharmacological inhibition of TRPM2 was assessed in primary adipocytes, evaluating the response upon stimulation with the β-adrenergic receptor agonist CL316,243.
Results: Trpm2-/- mice displayed lower expression of browning markers in AT and lower energy expenditure in response to thermogenic stimulus, compared to WT animals. Trpm2 gene overexpression was observed in WAT, BAT and liver upon cold exposure. In addition, ADPR levels and mono/poly-ADPR hydrolases expression were higher in mice exposed to cold, compared to control mice, likely mediating ADPR generation.
Discussion: Our data indicate TRPM2 as a fundamental player in BAT activation and WAT browning. TRPM2 agonists may represent new pharmacological strategies to fight obesity.
1 Introduction
Adipose tissue is important for energy balance, glucose and lipid homeostasis and thermogenesis. Excessive nutrient-derived energy is mainly stored in white adipose tissue (WAT) and leads to the expansion of total body mass. Obesity is a consequence of altered energy balance and develops when energy intake exceeds total energy expenditure, which is dictated by the basal metabolic rate, physical activity, and thermogenesis. Obese subjects are at high risk for developing complications such as type 2 diabetes (T2D), cardiovascular disease, and the metabolic syndrome (1). Brown adipose tissue (BAT) is the second main type of adipose tissue. The brown adipose cell contains multilocular small lipid droplets and a high number of mitochondria. Indeed, BAT does not store lipids as much as it oxidizes them. Thus, at least in rodents, BAT is one of the major thermogenic sites of the organism, expressing Uncoupling Protein 1 (UCP1), the protein proton carrier needed for heat production (2). BAT activation is promoted by a number of stimuli, including norepinephrine, thyroid hormones, fibroblast growth factor 21 (FGF21) and bile acids (2–6).
Beige adipocytes, sharing metabolic and morphologic features both with white and brown adipocytes (7), increase during the so-called WAT “browning”, which is triggered by the same stimuli needed to promote thermogenesis in BAT (6). However, induction of browning in WAT is reversible, thus the cells can differentiate again to white adipocytes. To counteract T2D and other obesity-related metabolic disorders, activation of thermogenic activity in WAT and/or BAT has been shown to protect from diet-induced obesity and insulin resistance in many rodent models (8, 9). A number of studies suggest that browning might represent a promising strategy to alleviate metabolic disturbances also in humans (9): (i) BAT activity improves insulin sensitivity (10) and has a negative correlation with BMI (11); (ii) beige adipocytes in WAT are essential to maintain whole-body metabolic homeostasis during catabolic conditions (12, 13); (iii) subjects with an active BAT exhibit improved metabolic health compared with subjects with reduced BAT (14, 15). At present, there are no browning-inducing methods that could be appropriate as therapies and the identification of mechanisms, able to induce long-lasting WAT browning, is highly demanded (9, 15, 16).
The transient receptor potential melastatin 2 (TRPM2) is a nonvoltage-activated ion channel that mediates influx of monovalent and divalent cations including Ca2+ from the extracellular space towards the cytosol. The main agonists discovered so far are ADPR, the ADPR-related molecule 2′-deoxyadenosine 5′-diphosphoribose (2dADPR), and H2O2 (17, 18). It is still unclear whether TRPM2 activation by H2O2 is direct or indirect (19–21), but it was shown that H2O2 is able to evoke a rise in 2dADPR levels, which subsequently induce a TRPM2-mediated calcium response in Jurkat T cells (18). Beside these three agonists, cyclic ADPR (cADPR) and NAADP have been described to act as TRPM2 activators, although with only a weak and controversial effect. A recent study seems to conclusively exclude the possibility that cADPR can act as an agonist for TRPM2 (22).
In the context of metabolism and thermogenesis, TRPM2 has not been studied in detail. For instance, TRPM2 was found to be essential in insulin release from pancreatic β-cells. Insulin release requires intracellular Ca2+ increase, that involves ATP-sensitive K+ channels and TRPM2. Thus, insulin release is hampered in pancreas lacking TRPM2 expression, causing hyperglycemia and T2D (23). Conversely, another study showed that TRPM2 deletion caused a higher glucose metabolism in peripheral tissues, which was associated with higher insulin sensitivity. In addition, mice lacking TRPM2 displayed protection to diet-induced obesity, that was explained by a higher energy expenditure and a lower adipose tissue inflammation in Trpm2-/- compared to wild type (WT) controls (24). Moreover, pharmacological TRPM2 inhibition was shown to improve insulin sensitivity in adipose tissue during angiotensin II-induced hypertension, suggesting that targeting TRPM2 may be a novel therapeutic strategy to treat hypertension-associated insulin resistance (25). Thus, from the literature, TRPM2 can likely play distinct roles, by regulating both the endocrine system and metabolism in peripheral tissues. Regarding liver, TRPM2 has been shown to be relevant in oxidative stress conditions (26) and in hepatic Ischemia-Reperfusion injury (27). However, as mentioned above, the role played by TRPM2 in adipogenesis and thermogenic response has not been established yet; nevertheless, TRPM2 expression in both BAT and WAT has been documented (28). More data on browning and BAT activation are available regarding the involvement of another member of the TRP channels, TRPM8, expressed by WAT and BAT and representing the cold-sensing receptor in these cells, whose activation induces a rise in the intracellular Ca2+ concentration ([Ca2+]i) and UCP1 expression (29).
Given that the multifunctional ectoenzyme CD38 utilizes NAD+ to produce TRPM2 ligands and based on our observation that CD38 is downregulated in activated BAT (30), we aimed to investigate whether the CD38-TRPM2 axis is modulated during cold-induced BAT activation and WAT browning. Our results demonstrate that CD38 and TRPM2 are modulated in opposite directions during thermogenesis and that TRPM2 is involved in adaptive thermogenic responses in BAT and WAT.
2 Materials and methods
2.1 Materials
CL316,243 (CL) was obtained from Adipogen Life Sciences, San Diego, CA; Flufenamic acid (FFA), Clotrimazole (CLOT) and insulin were from Merk Millipore, Burlington, MA; rosiglitazone was purchased from MedChemExpress, Monmouth Junction, NJ.
2.2 In vivo experiments
All in vivo experiments were conducted in accordance with the laws and institutional guidelines for animal care and were performed with permission of the Animal Welfare Officers at University Medical Center Hamburg-Eppendorf. Mice were housed in temperature- and light-controlled conditions (22°C, 12-h light cycle) with food and water ad libitum. Trpm2-/- mice were kindly provided by Dr. Yasuo Mori (31) and Cd38-/- mice by Prof Francis Lund (The University of Alabama at Birmingham, Birmingham, AL). Three months old male WT, Cd38-/- and Trpm2-/- mice were used for this study (7–8 animals/group). Three groups (the two knockout and WT mice, used as control) were kept for 7 days at 30°C; three groups were kept at 22°C and for the last 24 h at 6°C. Mice were fasted during the last 4 h before the end of the experiments and were euthanized: interscapular BAT (iBAT), inguinal WAT (iWAT) and liver were collected, and flash frozen in liquid nitrogen for future investigations.
2.3 qPCR analyses
RNA was isolated from tissues using peqGOLD TriFast (Peqlab), by homogenizing tissues with TissueLyser (Qiagen, Milan, Italy) and purifying RNA by NucleoSpin RNAII Kit (Macherey-Nagel). Afterwards, cDNA was prepared with High-Capacity cDNA Archive Kit (Applied Biosystems). The cDNA was used as template for real-time PCR analysis: reactions were performed in an iQ5 real-time PCR detection system (Bio-Rad) following the experimental conditions described before (32). The used specific primers were described in (30, 33). The following primers were designed through Beacon Designer 2.0 Software (Bio-Rad): Trpm2 (fw 5’-CCAATCTCCGACGAAGCAATAGC-3’; rv 5’-CATATTGGTGTGCGTGTGTGATGG-3’); MacroD1 (fw 5’-TGAGCACCTCCACCGACT-3’, rv 5’-TGTTCCTCTCTCTGCTTGTCAC-3’) MacroD2 (fw 5’-AGCTGAAGTCCACAAAGATGAA-3’, rv 5’-TTGGGAAGTTCTTGGTCACACA-3’); Oard1 (fw 5’-TGGAGGCCATGAAGTCCCAT-3’; rv 5’-CCGATCCAGACCACATCCAA-3’); Adprs (fw 5’-TCCTGAGTCACGTCGAGAGC-3’, rv 5’-TGGCAGTGTCATCTGTGTAGT-3’); MT-ND1 (fw 5’-CCACGCTTCCGTTACGATCA-3’, rv 5’-GTATGGTGGTACTCCCGCTG-3’). The primers for the housekeeping genes were as follows: Tbp (fw 5’-GAAGCTGCGGTACAATTCCAG-3’, rv 5’-CCCCTTGTACCCTTCACCAAT-3’); Hprt1 (fw CCCTGGTTAAGCATACAGCCCC-3’, rv AGTCTGGCCTGTATCCAACACTTCG-3’).
Total DNA was extracted from iWAT, iBAT and liver of mice (approximately 10 mg) using the QIAamp DNA Micro Kit (Qiagen), according to the manufacturer’s protocol. The purity and quantity of DNA were evaluated with the NanoDrop 1000 (Thermo Fisher Scientific, Waltham, MA). The mitochondrial/genomic DNA ratio was determined using specific primers for mitochondrial tRNALeu (MT-DNA) and genomic/nuclear Hprt1 by qPCR analysis. The following primers were used: MT-DNA (fw 5’-CCGTCACCCTCCTCAAATTA-3’, rv 5’-GGGCTAGGATTAGTTCAGAGTG-3’); Hprt1 (fw 5’-ATGAAGGAGATGGGAGGCCA-3’, rv 5’-TCCAGCAGGTCAGCAAAGAA-3’).
Statistical analysis of the qPCR was performed using the iQ5 Optical System Software version 1.0 (Bio-Rad) based on the 2−ΔΔCt method (34). The dissociation curve for each amplification was analyzed to confirm absence of not specific PCR products.
2.4 Western blot analysis
Samples from iBAT and iWAT for Western blot analyses were prepared as in (30). Tissue homogenates (30 μg of protein) were loaded on a 10% polyacrylamide gel and proteins were separated by SDS-PAGE and transferred to nitrocellulose membranes. Detection was performed using primary antibodies (anti-Vinculin and anti-Akt, Cell Signaling Technology, Danvers, MA; anti-UCP1, Novus biologicals, Centennial, CO; anti-Poly ADP-ribose, Merck Millipore; anti-phospho-Akt, Santa Cruz Biotechnology, Dallas, TX), following incubation with the appropriate Horseradish Peroxidase (HRP)-conjugated secondary antibodies and Enhanced Chemiluminescence (ECL) detection (GE Healthcare, Milan, Italy). Band intensity was quantified with the ChemiDoc imaging system (Bio-Rad, Milan, Italy).
2.5 Immunohistochemistry and histology
For immunohistochemistry, sections of paraffin-embedded adipose tissues were mounted on Superfrost™ Plus adhesion slides, then deparaffinized and rehydrated. Antigen retrieval was performed by boiling the slides in citrate buffer (10 mM sodium citrate, 0.05% Tween 20, pH 6) in a water bath for 30 min. Slides were rinsed with PBS and incubated with blocking buffer (3% BSA in PBS) for 1 h at room temperature in a humidity chamber. The slides were incubated with an antibody detecting UCP1 (ab10983, Abcam) diluted 1:1000 in 1% BSA in PBS overnight at 4°C. After primary antibody incubation, the slides were washed with PBS for 3x 10 min and then incubated with anti-rabbit Cy3 secondary antibody (711-166-152, Jackson) at a 1:500 dilution for 1 h at room temperature. For histology, adipose tissues were fixed in 3.6% formalin in phosphate-buffered saline. Hematoxylin/Eosin (HE) staining was performed on sections of paraffin-embedded tissues using standard procedures. Images were taken using a NikonA1 Ti microscope equipped with a DS-Fi-U3 brightfield camera.
2.6 Isolation of mature brown adipocytes from cold-exposed mice
Mature brown adipocytes were obtained from cold-exposed or control WT mice, as described in (30).
2.7 Mass spectrometry
BAT and WAT samples from WT and Cd38-/- mice were deproteinized by mincing them in 0.6 M PCA. Mature brown adipocytes, isolated as in Section 2.6, were incubated with 1 μM CL316,243 for 4 h in Hank’s Balanced Salt Solution. At the end of the incubation, cells were sonicated: one aliquot was used for protein content determination, and 0.6 M PCA was added to the remaining part. The acidic extracts were neutralized with 2 M K2CO3 and ADPR quantification was performed by HPLC/MS, using a reverse-phase XBridge C18 column (Waters, 150 × 1 mm, 3 μm). Standards and samples were analyzed using a mobile phase consisting of water/methanol (95:5, v/v), containing 4 mM dibutylamine acetate (eluent A) and water/acetonitrile (25:75, v/v; eluent B). The mobile phase started with 0% B, and then increased to 80% B over 10 min and finally to 100% over the next 5 min. The mobile phase was held at 100% B for 5 min and then re-equilibrated to 0% B for 15 min. The flow rate was 30 μl/min. A diverter valve was employed to reduce the introduction of matrix components in the spectrometer. The mass spectra were acquired using electrospray ionization in negative-ion mode in the 100–800 m/z range, and ion charged control with a target ion value of 100,000 and an accumulation time of 300 ms. MS and MS/MS were used for the specific detection of each analyte. The settings of the ESI source were as follows: capillary voltage of 3300 V, nebulizer pressure of 15 psi, drying gas of 8 l/min, dry temperature of 325°C, and 2 rolling averages (averages: 5) were the parameters set for the MS detection. MS/MS analysis was conducted using an amplitude optimized time by time for each compound (35).
2.8 Isolation, culture and differentiation of primary adipocytes
Samples of iBAT and iWAT, collected from WT mice, were used to isolate cells from the stromal vascular fraction (SVF) as described (36). In brief, collected AT pieces were washed with 0.9% NaCl solution, minced using scissors and digested at 37°C for 30 min (WAT) or 40 min (BAT) using an “isolation buffer” (123 mM NaCl, 5 mM KCl, 1.3 mM CaCl2, 5 mM glucose, 100 mM HEPES, pH 7.4) with the addition, immediately before use, of collagenase II (600 U/ml) and BSA 1.5%. The obtained preparations were passed through a sterile 100 µm filter in a falcon tube, kept on ice for 30 min; subsequently, the middle layer was collected, while the lower layer (debris of tissue) and the upper one (mature adipocytes) were discarded. A second filtration was performed using a 40 µm filter and the product was centrifuged for 10 min at 800xg: the supernatant was discarded and the pellet was resuspended in culture medium (DMEM Glutamax-I). Cells were cultured at 37°C, in a humidified atmosphere containing 5% CO2 and were differentiated by adding fetal bovine serum (FBS)/newborn calf serum (NCS) (10%), Pen/Strep (1%), Anti-Anti (1%), insulin (2.4 nM), and rosiglitazone (1 μM for brown adipocytes, 100 nM for white/beige adipocytes).
2.9 Ca2+ imaging in primary brown adipocytes of WT and Trpm2-/- mice
Primary brown adipocytes from WT and Trpm2-/- mice were isolated from iBAT as described in 2.8. For Ca2+ measurements, isolated cells were seeded in culture medium (DMEM Glutamax-I) on glass bottom Microwell dishes (Mattek P35G-0-20-C) and differentiated in these dishes for 9 days by adding FBS/NCS (10%), Pen/Strep (1%), Anti-Anti (1%), insulin (2.4 nM), and rosiglitazone (1 µM). Medium was replaced every other day and cells were cultured at 37°C, in a humidified atmosphere containing 5% CO2. On the day of Ca2+ measurements, culture medium was removed and brown adipocytes were incubated in RPMI medium containing 4 μM Fura2-AM for 30 min at 37°C, during which 4 mL of fresh medium were added after 15 min of incubation. Afterwards, cells were carefully rinsed twice and resuspended in Ca2+ buffer (140 mM NaCl, 5 mM KCl, 1 mM MgCl2, 1 mM CaCl2·6H2O, 20 mM Hepes, pH 7.4, 1 mM NaCl, 5 mM glucose). The Fura2-loaded adipocytes were imaged on a Leica IRBE microscope using a 40× objective, frames were acquired with an electron-multiplying charge-coupled device camera (EM-CCD; C9100-13, Hamamatsu), and a Sutter DG-4 with the following filter set was used as a light source: excitation (ex), HC 340/26 nm and HC 387/11 nm; beam splitter (bs), 400DCLP; emission (em), 510/84 nm. At 1 min after the start of acquisition, 10 µL Ca2+ buffer was added as negative control and the stimulation was achieved by adding 1 µM CL after 2 min. The free cytosolic Ca2+ concentration ([Ca2+]i), was calculated by the Grynkiewicz equation. In brief, Rmin [using the lowest ratio (R) and fluorescence (F) after EGTA chelation] and Rmax [using the highest R and F after Ionomycin incubation] of Fura2 in single-cell measurements were determined. The area under the curve was determined with a baseline of 214 nM Ca2+ and the mean peak was calculated using the timepoint of the mean maximum peak (WT = 196 s; Trpm2-/- = 158 s).
2.10 Ca2+ measurements in primary hepatocytes
Hepatocytes were isolated from WT mice, following the protocol described in (37). Briefly, liver was dissociated in digestion buffer (DMEM high glucose, 1% Penicillin/Streptomycin, 1 mg/mL Collagenase IV, 10 µg/mL HEPES and 10% FBS) and washed once in plating media (DMEM high glucose, 2 mM Glutamax, 2% Penicillin/Streptomycin, 2 mM Sodium Pyruvate, 1 µM Dexamethasone, 0.1 mM Insulin and 10% FBS). The homogenate was passed through a 70 µm strainer and the resulting cell suspension was centrifugated at 50xg for 5 min. To eliminate the red blood cells, an additional centrifuge (20xg for 3 min) was performed and the remaining supernatant was removed. Hepatocytes were then isolated from the non-viable and parenchymal cells using a 90% Percoll (GE healthcare) solution. Cell suspension was centrifuged at 1000xg for 10 min and washed twice with plating media to remove Percoll. Isolated hepatocytes were counted using trypan blue and seeded in poly-lysine-coated, glass bottom cell culture dishes (Greiner Bio-One, Frickenhausen, Germany). Four hours later, the plating medium was replaced with complete medium (DMEM high glucose, 2 mM Glutamax, 2% Penicillin/Streptomycin, 2 mM Sodium Pyruvate, 1 µM Dexamethasone, 0.1 mM Insulin and 0.2% BSA). After 18 hours, hepatocytes were incubated in complete medium with 10 μM Fura2-AM for 40 min at 37°C and washed with Hanks’ balanced salt solution (HBSS). [Ca2+]i measurements and calibrations (using the Grynkiewicz equation) were performed with a microfluorimetric system (Cairn Research, Faversham, Kent, UK).
2.11 Indirect calorimetry and body temperature measurements
Indirect calorimetric measurements were performed using a Promethion Sable System. WT and Trpm2-/- mice were transferred to the measurement chamber in new cages without additional nesting material one day before the measurements started. During the experiments, mice were maintained at a 12-h light–dark rhythm with free access to a standard chow diet and water. Oxygen and carbon dioxide levels in each cage were measured every 15 min. Energy expenditure (EE) was calculated using a modified Weir equation (38). For gradual cold exposure studies, mice were acclimated at 30°C and gradually exposed to 5°C, for 6 days starting at 7:00 am. At the end of the experiment, mice were acclimated at 30°C for 24 h and then injected with CL316,243 (1 mg/kg body weight).
2.12 Statistical analyses
Groups were compared by an unpaired Student’s t test, or by one way ANOVA followed by Tukey’s Test, using GraphPad software. Values of p < 0.05 were considered significant.
3 Results
3.1 Trpm2-/- mice display reduced upregulation of thermogenic markers in WAT and BAT after cold exposure
To unveil the role of TRPM2 during thermogenesis in adipose tissues, the gene expression levels of Pgc1-α and Ucp1, two thermogenic markers, were measured in iBAT and iWAT, harvested from WT and Trpm2-/- mice, housed for 6 days at 22°C and a final day at 6°C, or 7 days at 30°C, as control condition. As expected, an upregulation of these genes was observed in iBAT and iWAT from WT mice exposed to 6°C, in comparison with the control temperature (Figures 1A-D). Notably, the cold-induced upregulation of Pgc1-α and Ucp1 levels was significantly attenuated in iWAT and iBAT from Trpm2-/- mice (Figures 1A-D). In agreement with the gene study evaluations, Western blot analyses on iBAT of WT and Trpm2-/- mice confirmed that a proper Ucp1 upregulation is hampered in knockout mice exposed to cold (Figure 1E). Analyses in immunohistochemistry confirmed a reduced upregulation of UCP1 in both BAT and WAT in Trpm2-/- mice in response to cold, compared to controls (Figure 1F). Importantly, histology showed that BAT activation and the presence of beige cells in WAT are reduced in Trpm2-/- mice, compared to controls, as revealed by the morphological appearance (including lipid droplet sizes) upon H&E staining (Figure 1G).

Figure 1 Lack of TRPM2 impairs cold exposure-induced iBAT activation and iWAT browning. iBAT and iWAT were collected from WT and Trpm2−/− mice kept at 30°C (black bars), or at 6°C (blue bars). qPCR analyses were performed to measure mRNA levels of: Pgc-1α in iBAT (A) and iWAT (B); Ucp1 in iBAT (C) and iWAT (D). Results are mean ± SD of determinations on tissues from different animals (n= 4). (E), Western blot analyses were performed in iBAT of WT and Trpm2-/- mice to evaluate UCP1 protein levels (n= 3): values were normalized on the respective Vinculin levels and mean ± SD of the ratios are shown. (F) Sections of paraffin-embedded iBAT and iWAT, processed as described in Material and Methods, were stained with the anti-UCP1 antibody, followed by the anti-rabbit Cy3 secondary antibody. (G) Hematoxylin/Eosin (HE) staining was performed on sections of paraffin-embedded tissues using standard procedures. Representative images are shown in F and G. Data were analyzed by ANOVA followed by Tukey’s test: *, p<0.05, **, p<0.01, ***, p<0.001, ****, p<0.0001; #, p<0.05, ##, p<0.01, ###, p<0.001, compared with the corresponding WT.
Recently, TRPM2 has been demonstrated to regulate the expression of CREB in an acute myeloid leukemia cell line (39). CREB is a well-known gene master regulator, whose transcription is regulated by Ca2+ levels (40), that promotes expression of several genes, including Pgc1-α and Ucp1 (41, 42). Therefore, Creb1 mRNA levels were evaluated in both iWAT and iBAT of WT and Trpm2-/- mice. As expected, upon cold exposure Creb1 expression increased in iWAT (by approximately 7 folds), and in iBAT (by approximately 9 folds) of WT mice, in comparison to mice kept at control temperature (Figures 2A, B). On the other hand, Creb1 mRNA upregulation was greatly reduced in iBAT and iWAT from Trpm2-/- mice: Creb1 expression increased only by 2 and 1.5 folds in iBAT and iWAT, respectively, when compared with the corresponding adipose tissues from Trpm2-/- mice at 30°C (Figures 2A, B). As Akt is an important mediator of the cold-induced response, the level of Akt phosphorylation was compared in the different conditions: as shown in Figures 2C, D, the cold-induced increase in Akt phosphorylation was abrogated in the absence of TRPM2, in both iBAT and iWAT (Figures 2C, D).
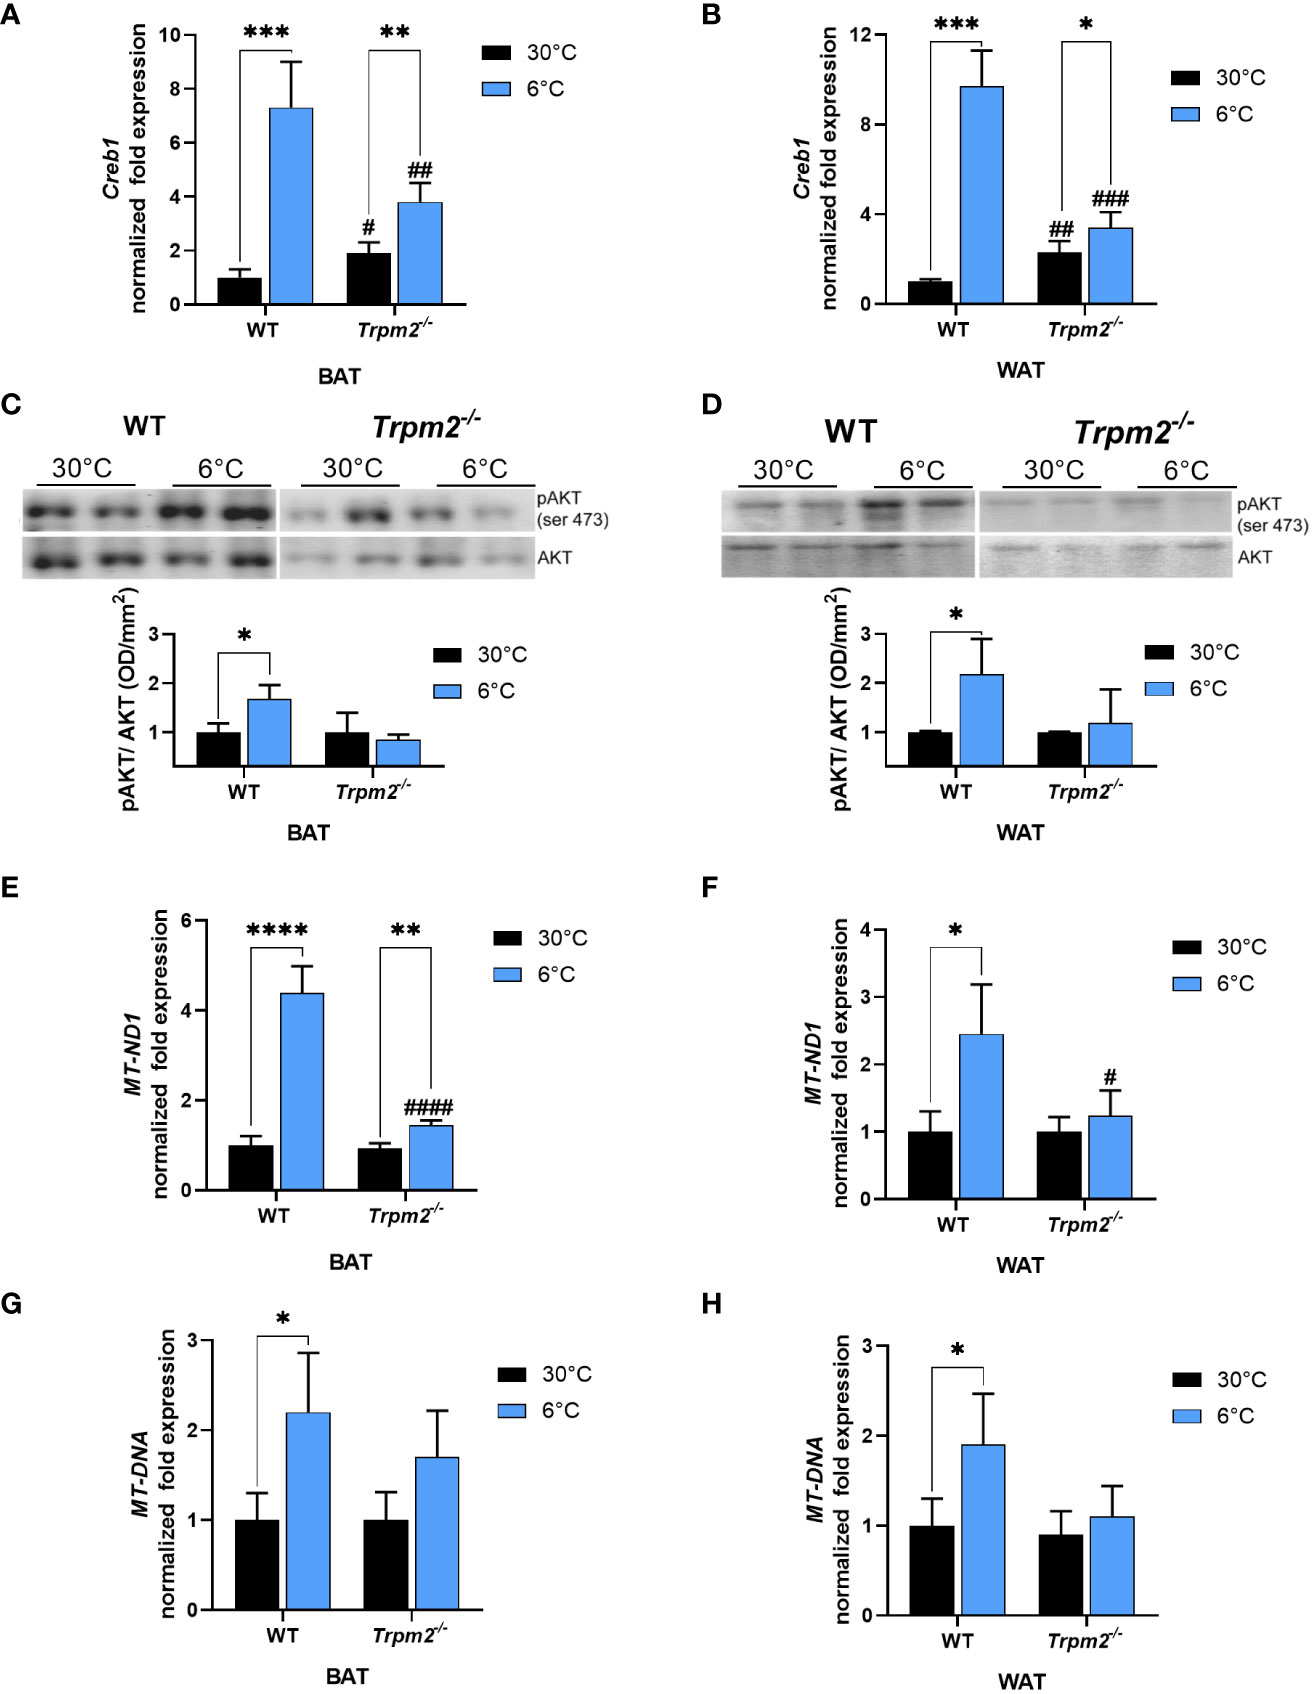
Figure 2 Lack of TRPM2 impairs Creb1 expression, Akt activation and mitochondriogenesis in response to cold in adipose tissues. iBAT and iWAT were collected from WT and Trpm2−/− mice kept at 30°C (black bars), or at 6°C (blue bars). qPCR analyses were performed to measure mRNA levels of: Creb1 in iBAT (A) and iWAT (B); MT-ND1 in iBAT (E) and in iWAT (F). The mitochondrial/nuclear DNA ratio was evaluated by qPCR in iBAT (G) and iWAT (H). (C, D), Western blot analyses were performed in iBAT and iWAT of WT and Trpm2-/- mice to evaluate level of phosphorylated Akt (n = 3): values were normalized on the respective Akt levels and mean ± SD of the ratios are shown. Data were by ANOVA followed by Tukey’s test: *, p<0.05, **, p<0.01, ***, p<0.001, ****, p<0.0001; #, p<0.05, ##, p<0.01, ###, p<0.001, ####, p<0.0001, compared with the corresponding WT.
Being Ucp1, Pgc1-α and Creb1 related to the mitochondrial metabolism, the expression level of MT-ND1, the gene encoding for NADH:ubiquinone oxidoreductase core subunit 1, forming the mitochondrial complex 1 in the OXPHOS process, was evaluated: MT-ND1 gene levels in BAT underwent a 4-fold upregulation upon cold stimulation in WT mice, and only a 1.5-fold upregulation in Trpm2-/- mice, indicating a reduced OXPHOS function during thermogenesis in mice lacking TRPM2 channel (Figure 2E). Regarding MT-ND1 expression, similar results were obtained in WAT (Figure 2F). The mitochondrial/nuclear DNA ratio confirmed that the absence of TRPM2 hampered the increase in mitochondrial content, upon cold exposure in both BAT and WAT (Figures 2G, H). Taken together, these data indicate that TRPM2 channels are involved in iWAT browning and in iBAT activation in response to cold.
3.2 Trpm2 expression and ADPR levels are higher in adipose tissue during cold exposure
Since our data suggested an important role for TRPM2 in iWAT browning and iBAT activation (Figure 1), Trpm2 expression was investigated in adipose tissue in response to cold exposure. Importantly, and in line with TRPM2 being pivotal for an appropriate thermogenic response, Trpm2 was significantly higher in both iBAT and iWAT of WT mice exposed to cold (by 2 and 5 folds, respectively) in comparison with mice housed at control temperature (Figure 3A). Recently, we demonstrated that in mice lacking Cd38, the induction of thermogenic markers at cold temperature was more pronounced than in WT mice (30). Trpm2 expression level increased in response to cold in iBAT and iWAT of Cd38-/- mice (for iBAT even to a greater extent compared to WT mice) (Figures 3A, B). To verify whether Trpm2 expression levels were regulated in adipocytes or in other cell types present in the adipose tissue, mature brown adipocytes were isolated from iBAT harvested from mice exposed to 30°C or 6°C. Similar to the in vivo situation, a 12-fold higher Trpm2 expression was detected in brown adipocytes of cold-exposed compared to warm-housed mice (Figure 3C). Likewise, a 5-fold Creb1 overexpression was detected in these cells (Figure 3C).
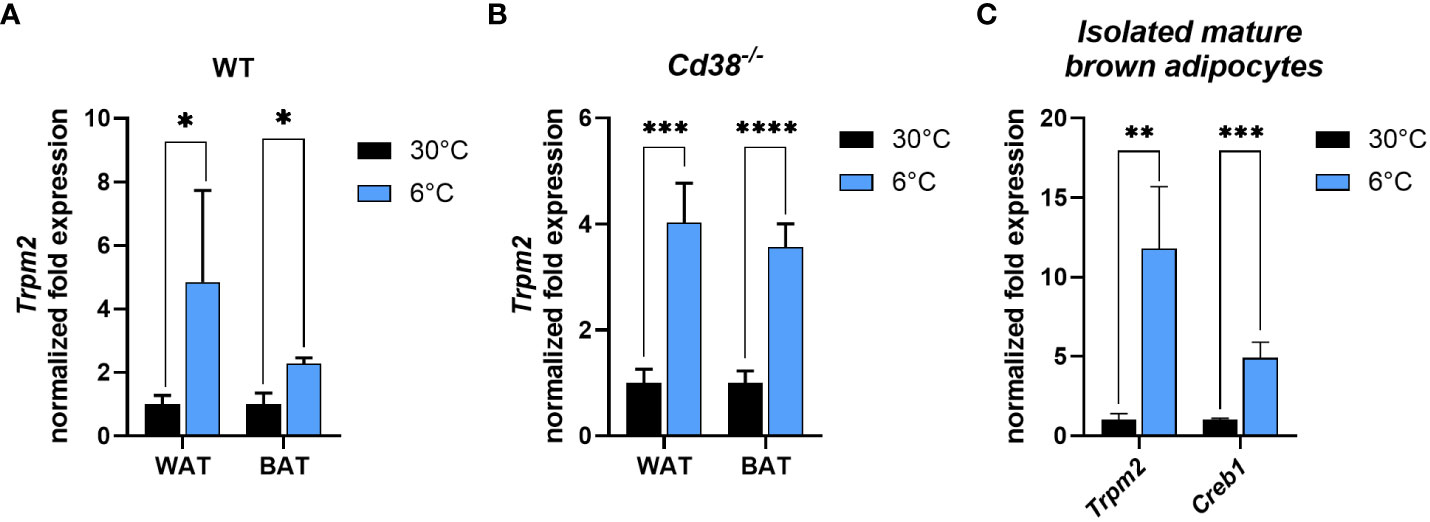
Figure 3 Cold exposure determines the increase in Trpm2 and Creb1 in adipocytes. (A, B), qPCR were performed on iBAT and iWAT collected from WT (A) and Cd38−/− (B) mice kept at 30°C (black bars), or at 6°C (blue bars) and Trpm2 mRNA levels were evaluated. (C), Trpm2 and Creb1 expression were measured by qPCR on mature brown adipocytes freshly isolated from iBAT of WT mice kept at 30°C (black bars), or at 6°C (blue bars). Results are mean ± SD of determinations on tissues from different animals (n = 4). Data were analyzed by ANOVA followed by Tukey’s test: *, p<0.5, **, p<0.01, ***, p<0.001, ****, p<0.0001.
ADPR is the main TRPM2 agonist produced by NAD+ degradation in a number of enzymatic reactions, including those pathways involving CD38, sirtuins and the (poly)ADP-ribosylating/degrading processes (30, 43–45). CD38 is considered the major ADPR-producing enzyme, and its expression and activity are often linked to intracellular Ca2+ signaling. CD38 expression is down-regulated in iBAT and iWAT when mice are exposed to cold (30), whereas TRPM2 expression is up-regulated (Figure 3). Thus, we evaluated whether ADPR levels are modulated during thermogenesis. To this purpose, mass spectrometry analyses were performed on lysates of iBAT from WT and Cd38-/- mice exposed to cold or warm ambient temperatures. Despite the fact that CD38 was downregulated during thermogenesis, ADPR levels were approximately 2 fold higher in iBAT from WT mice upon cold exposure (Figure 4A). Furthermore, compared to warm housing conditions, ADPR was increased by 1.6 fold even in BAT from cold-exposed Cd38-/- mice (Figure 4A). Nevertheless, basal ADPR levels were significantly lower in Cd38-/- compared to WT mice (Figure 4A), indicating that ADPR is produced by CD38-dependent and independent pathways in BAT in response to cold-induced thermogenesis. ADPR levels were increased from 19 ± 4 to 28 ± 9 pmol/mg tissue in iWAT from mice housed at 30°C or 6°C, respectively (n=6, p<0.05; Figure 4A); ADPR levels were not detectable (nd) in WAT from Cd38-/- mice, suggesting that CD38 has a prominent role in ADPR generation in this tissue (Figure 4A). Finally, isolated, mature brown adipocytes were incubated in the presence of 1 μM CL for 4 h: β-adrenergic stimulation determined a significant increase in ADPR content (Figure 4B).
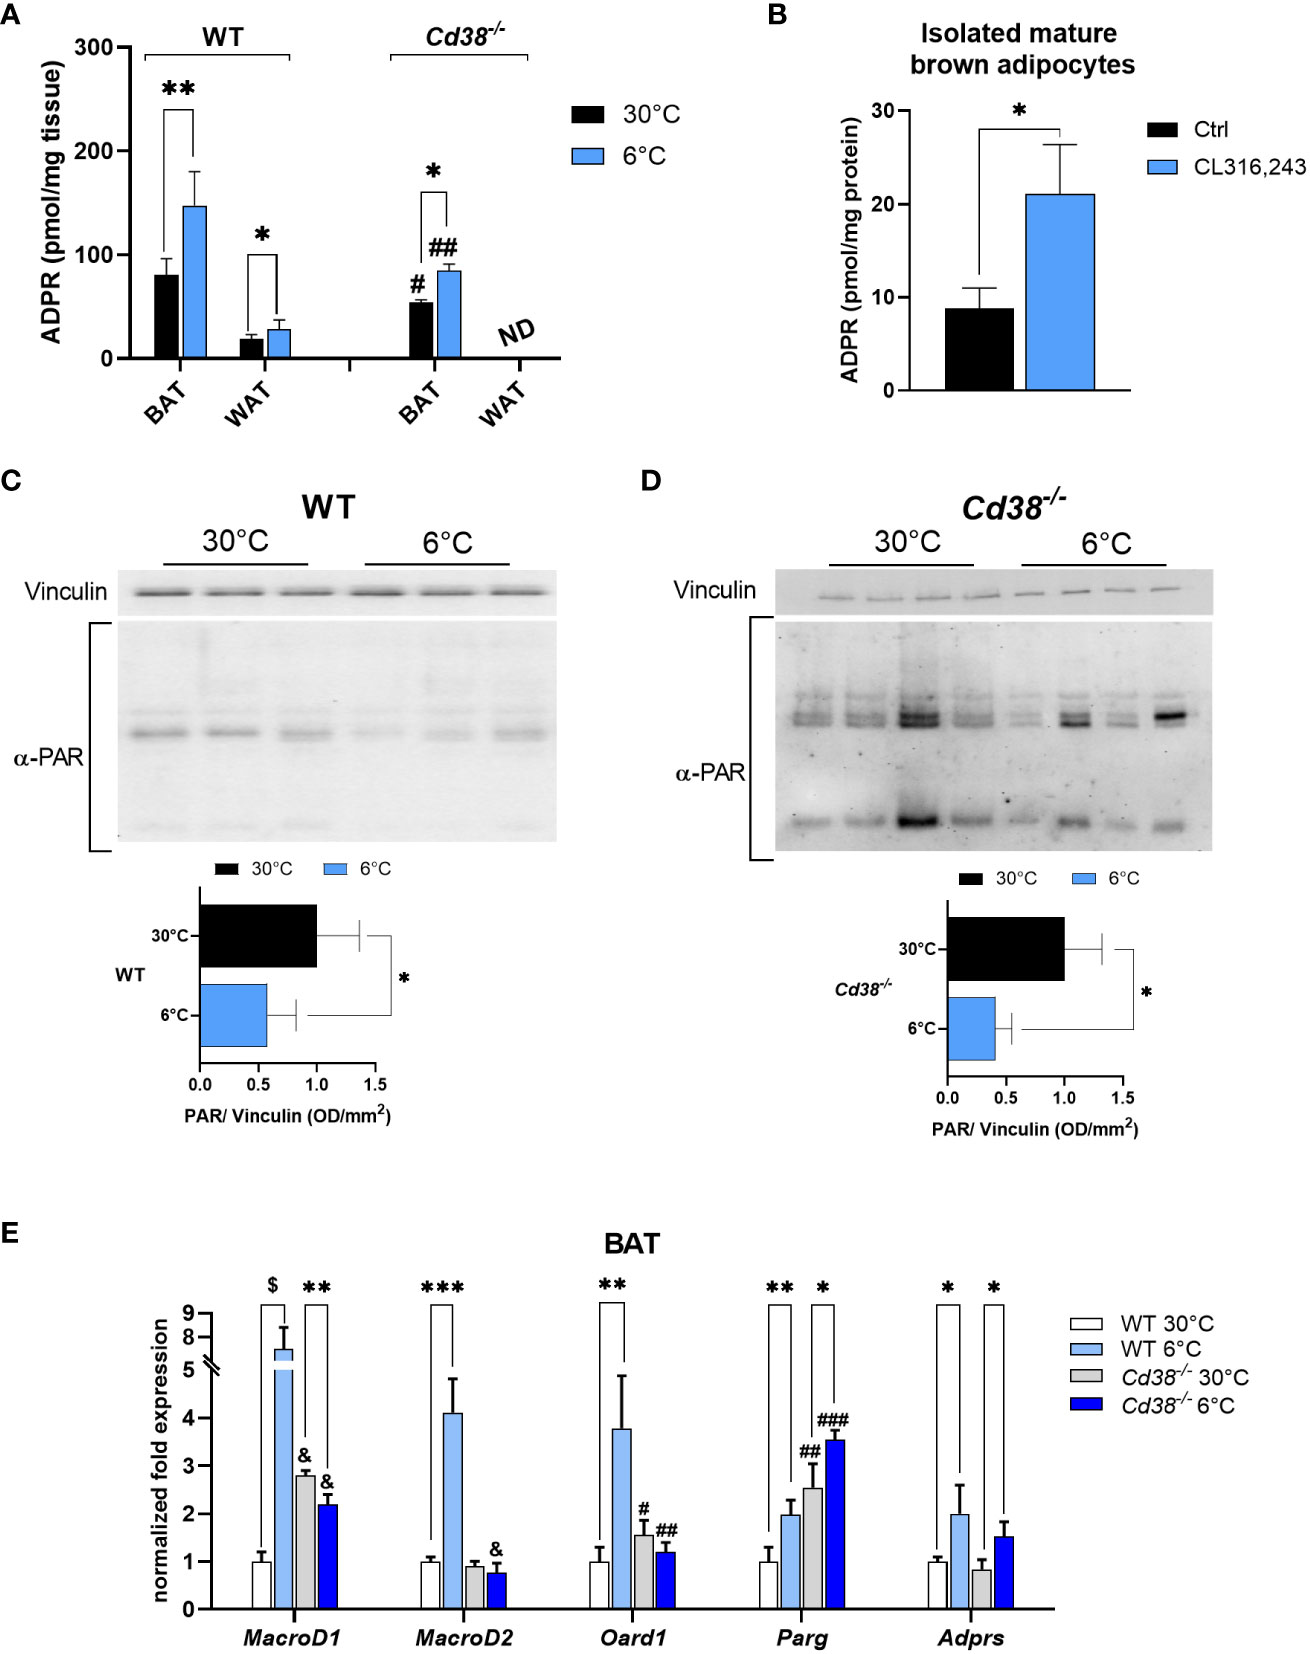
Figure 4 Enhanced degradation of PAR polymers is a source of ADPR during cold exposure in WT and Cd38-/- mice. ADPR levels were measured by mass spectrometry analyses: (A), on iBAT and iWAT of WT and Cd38-/- mice kept at thermoneutrality (30°C, black bars), and mice exposed to cold temperature (6°C, blue bars) and results are mean ± SD of determinations on tissues from different animals (n = 6); (B) on mature brown adipocytes isolated from WT mice, and exposed to 1 μM CL for 4 h. (C, D), Levels of PARylated proteins revealed by Western blot analyses performed in iBAT of WT (C) and Cd38-/- (D) mice housed at 30°C (black bars) or at 6°C (blue bars) using an antibody against ADPR polymers; values were normalized on the respective Vinculin and presented as mean ± SD (n=3). (E), Expression level of the genes encoding for the main cellular mono/poly-ADPR hydrolases (MacroD1, MacroD2, Oard1, Parg, Adprs) was measured by qPCR on iBAT of WT and Cd38-/-. Results are mean ± SD of determinations on tissues from different animals (n=4). Data were analyzed by ANOVA followed by Tukey’s test: *, p<0.5, **, p<0.01, ***, p<0.001, $, p<0.00001; #, p<0.05, ##, p<0.01, ###, p<0.001, &, p<0.00001 compared with the corresponding WT.
3.3 Enhanced poly(ADPR) polymer degradation in WAT and BAT of cold-exposed mice
Poly(ADPR) polymerases (PARPs) are enzymes using NAD+ to build poly(ADPR) (PAR) polymers on amino acid residues, influencing protein localization and activity. The process of PAR polymer degradation results in a release of ADPR monomers (44, 45). To identify the pathway responsible for the observed ADPR increase (Figure 4A), Western blot analyses were performed on iBAT from WT and Cd38-/- mice, using an antibody against PAR polymers. Interestingly, the amount of PAR polymers was greatly reduced when mice were exposed to cold in comparison with controls (by 50 and 60% in WT and Cd38-/- mice, respectively; Figures 4C, D). Thus, during the thermogenic response, PAR polymers were reduced. Therefore, it is reasonable to suppose that increased ADPR levels in cold-exposed mice are due to an accelerated degradation of PAR polymers.
Next, qPCR analyses were performed to follow the expression of the major (poly)ADP-ribosyl hydrolases, i.e. MacroD1, MacroD2, Oard1, Parg and Adprs [encoding, respectively, for: MACRO domain-containing protein 1, MACRO domain-containing protein 2, Terminal ADP-ribose protein glycohydrolase 1 (TARG1), Poly(ADP-ribose) glycohydrolase, ADP-ribose glycohydrolase (ARH3)). Gene expression measurements unveiled a marked upregulation of all these enzymes in iBAT, when WT mice were exposed to cold temperature (Figure 4E; white vs light blue bars). Parg and Adprs were also significantly upregulated upon cold exposure in BAT from Cd38-/- mice (Figure 4E; grey vs blue bars). Parg, Oard1 and MacroD1 were more expressed in iBAT from Cd38-/- mice compared with WT controls, housed at the thermoneutral temperature (Figure 4E; white vs grey bars). Altogether, these data suggest that ADPR may be generated mainly by PARG and ARH3 activities during cold exposure.
3.4 Pharmacological inhibition of TRPM2 impairs thermogenic gene expression in white and brown adipocytes
To evaluate the impact of TRPM2 pharmacological inhibition on thermogenic adipocytes in a cell-autonomous manner, stromal vascular fraction (SVF)-derived cells were collected from iBAT and iWAT of WT mice and then differentiated to mature adipocytes. Then, adipocytes were activated using the β-3-adrenergic receptor agonist CL. To assess whether the impaired expression of thermogenic genes observed in Trpm2-deficient mice is ascribable to adipocyte dysfunctions, FFA and CLOT, two known TRPM2 inhibitors (46) were added to differentiated cells prior to CL treatment. Ucp1 expression levels were increased in brown and white adipocytes in response to CL treatment (Figures 5A, B), as expected. However, Ucp1 induction was substantially lower in adipocytes pretreated with TRPM2 inhibitors. In brown adipocytes, Ucp1 induction was attenuated by approximately 80 and 74% in FFA- or CLOT-pre-treated cells, respectively; in white adipocytes, Ucp1 expression was reduced by approximately 71 and 27% in FFA- or CLOT-pre-treated cells compared to control conditions, respectively (Figures 5A, B). Similar results as for Ucp1 were obtained by measuring Creb1 expression (Figures 5C, D). Moreover, in line with the Trpm2 induction in cold-exposed WT mice (Figure 3), CL treatment caused a marked upregulation of Trpm2 expression in both brown and white adipocytes (by 7.7 and 11.1 folds, respectively; Figure 5E). Changes in the [Ca2+]i were compared in brown adipocytes, differentiated from the SVF obtained from WT or Trpm2-/- mice: the global CL-induced Ca2+ response was reduced in Trpm2-/- cells (Figures 5F, H), although the first peak of Ca2+ increase was not significantly different (Figures 5F, G). These data further confirm that TRPM2 must be considered of pivotal relevance during the thermogenic response in adipose tissues.
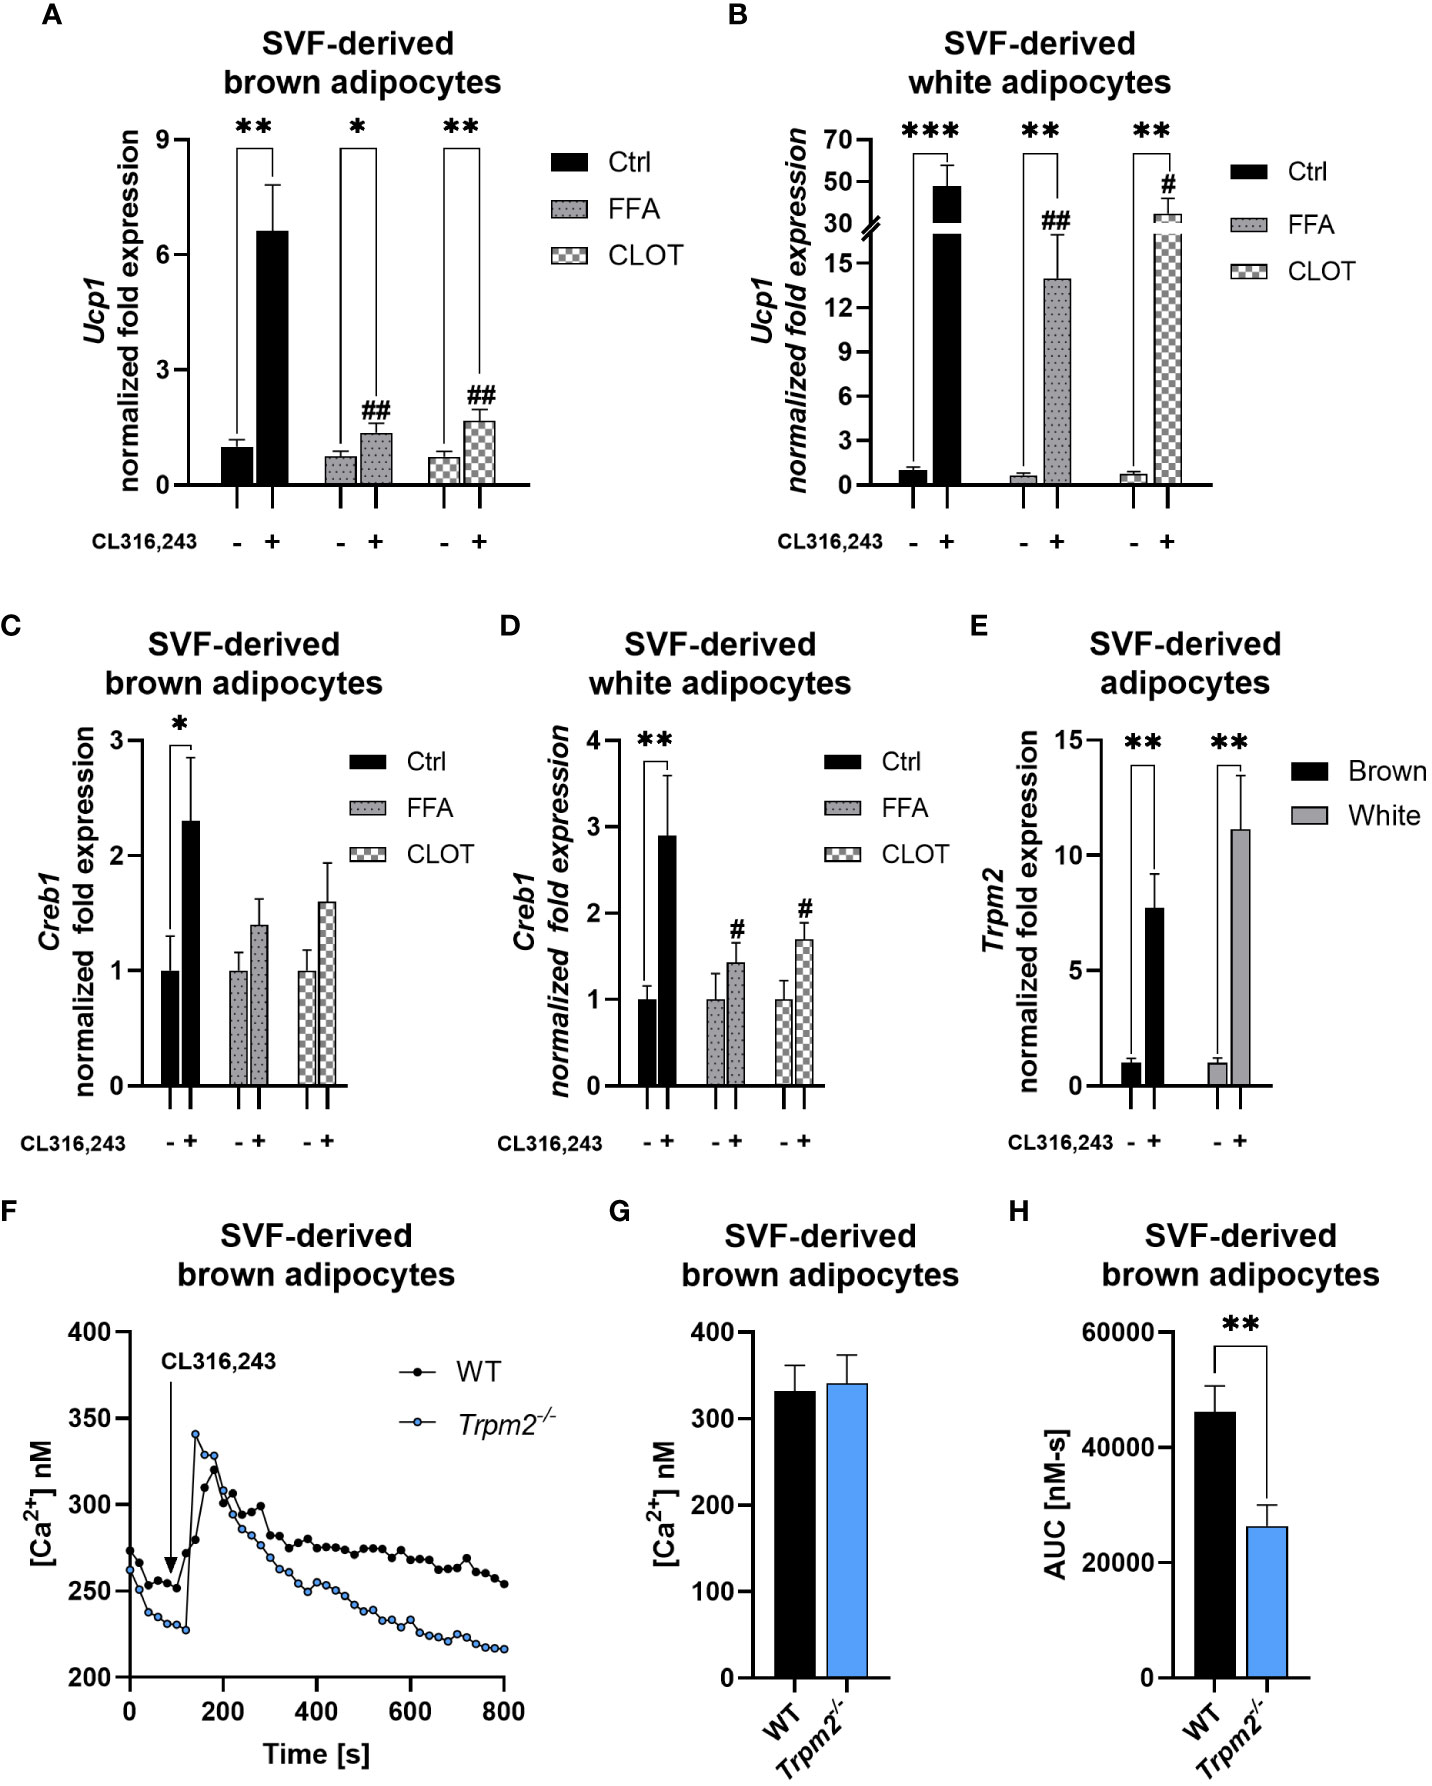
Figure 5 TRPM2 inhibitors hampered thermogenic response in CL316,243-treated primary adipocytes. SVF-derived cells were isolated from iBAT and iWAT and differentiated using a specific differentiation cocktail: mature adipocytes were stimulated (or not) with 100 nM CL316,243, in presence or absence of TRPM2 inhibitors. (A-D), qPCR analyses of Ucp1 (A, B) and Creb1 (C, D) expression in brown (A, C) and white (B, D) primary adipocytes pre-treated with 200 μM flufenamic acid (FFA), 100 μM clotrimazole (CLOT) or vehicle, prior to CL treatment. (E), Trpm2 expression in white and brown adipocytes upon CL treatment. Results are mean ± SD of at least 4 determinations. (F-H), SVF-derived brown adipocytes from WT and Trpm2-/- mice were loaded with Fura2, rinsed twice and a Ca2+-containing buffer was added. The Fura2-loaded adipocytes were imaged on a Leica IRBE microscope and stimulated with 1 µM CL. The mean trace (F) is shown (n=49 for WT, n = 40 Trpm2-/-), together with the calculated mean peak (G) and the area under the curve (H). Data were analyzed by ANOVA followed by Tukey’s test: *, p<0.5, **, p<0.01, ***, p<0.001; #, p<0.05, ##, p<0.01 compared with the corresponding WT.
3.5 Trpm2 deletion does not affect the hepatic glycolysis/glucose release regulation during thermogenesis
Liver, as BAT and WAT, is a relevant organ governing thermogenesis, both by providing energy sources and by releasing stimulatory factors that affect peripheral tissues (33). We recently demonstrated that in cold-exposed Cd38-/- mice, the hepatic cross-regulation between glycolysis and glucose release was lost (33). To investigate whether TRPM2 is relevant in this process, the impact of Trpm2 depletion on hepatic metabolism during thermogenesis was evaluated. Glycolytic genes (Pfk1, Gapdh, Pk1, encoding respectively for Phosphofructokinase 1, Glyceraldehyde-3-Phosphate Dehydrogenase and Pyruvate Kinase) and Pyruvate Dehydrogenase (Pdha1) expression was down-regulated in WT mice exposed to cold in comparison with WT mice housed at control temperature (Figures 6A–D). On the other hand, hepatic glucose release to maintain systemic glucose homeostasis is increased in response to cold exposure, as indicated by higher Glucose 6-Phosphatase (G6pase) expression in cold- versus warm housed mice (Figure 6E). Notably, Trpm2 ablation did not seem to affect the pattern of glycolysis/glucose release regulation in liver (Figure 6).
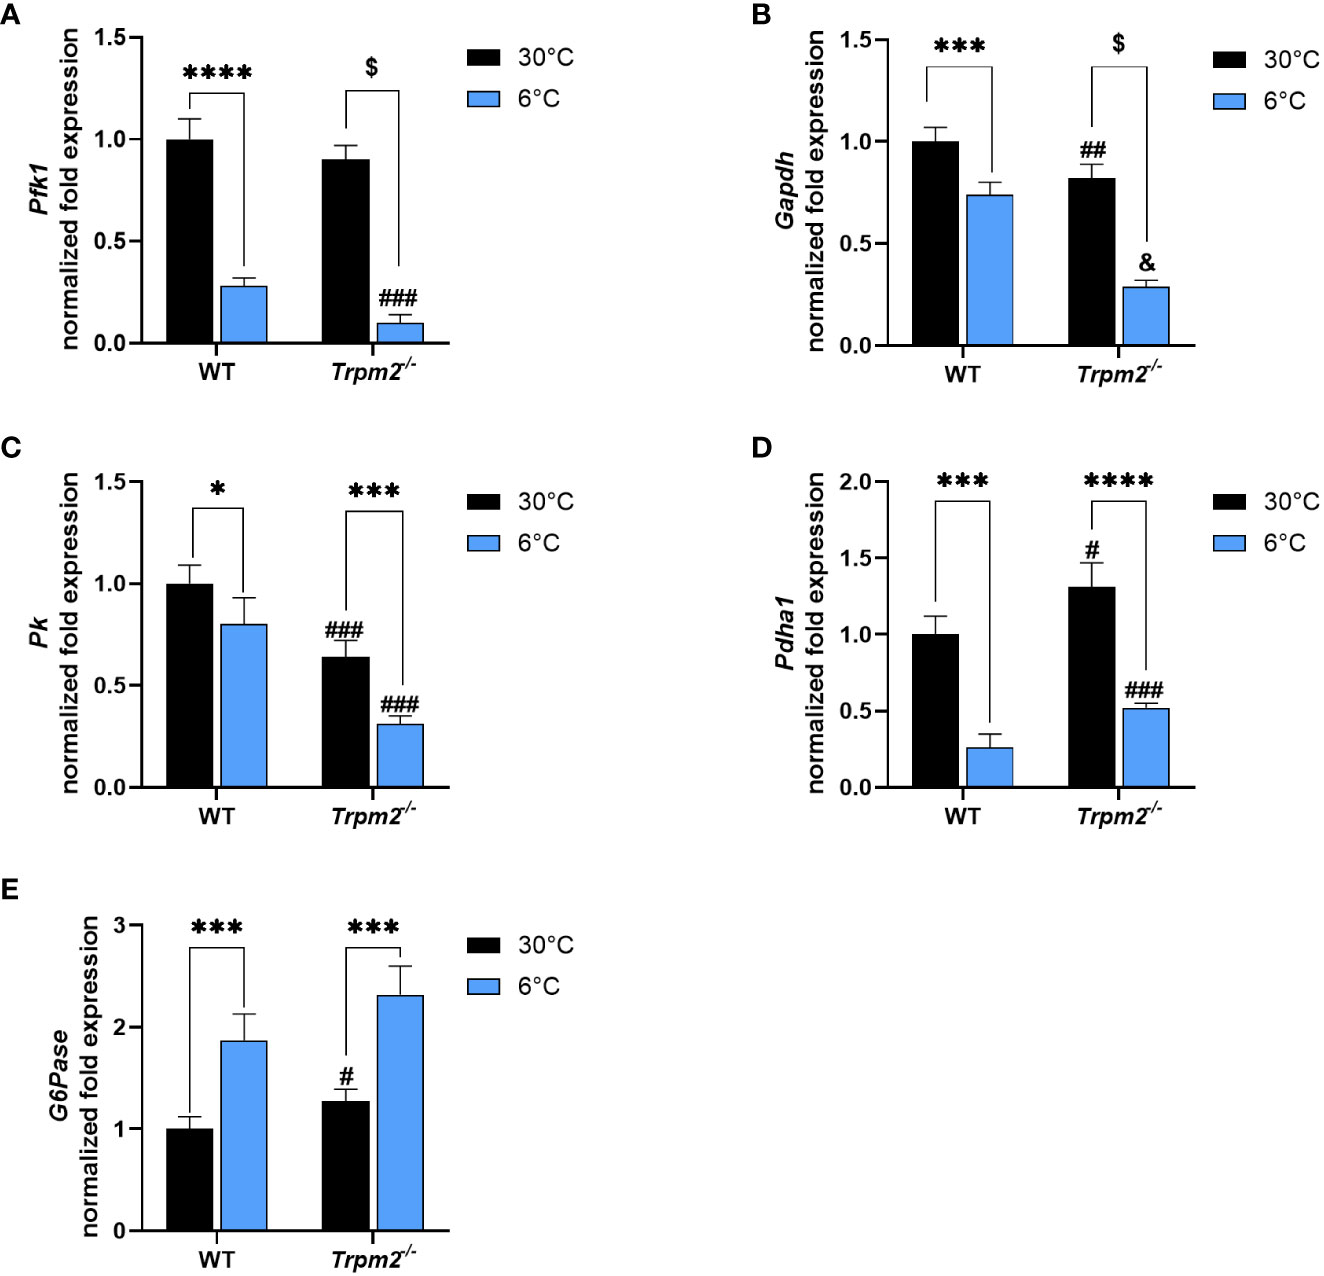
Figure 6 Trpm2 is dispensable in the downregulation of glycolysis and in the upregulation of glucose release occurring in liver upon cold-exposure. Livers were collected from WT and Trpm2-/- mice kept at 30°C (black bars) or 6°C (blue bars). Phosphofructokinase 1 (Pfk1, (A), Glyceraldehyde-3-Phosphate Dehydrogenase (Gapdh, (B), Pyruvate Kinase (Pk, (C), Pyruvate dehydrogenase (Pdha1, (D) and Glucose 6-Phosphatase (G6pase, (E) gene expression in WT and Trpm2-/- mice. Results are mean ± SD of determinations on tissues from different animals (n = 4). Data were analyzed by ANOVA followed by Tukey’s test: *, p<0.5, ***, p<0.001, ****, p<0.0001, $, p<0.00001; #, p<0.05, ##, p<0.01, ###, p<0.001, &, p<0.00001 compared with the corresponding WT.
3.6 Trpm2 expression and PAR polymer degradation occur also in liver and Fgf21 expression is affected by Trpm2 ablation during cold exposure
Trpm2 expression was measured by qPCR in liver of WT and Cd38-/- mice housed at 30 or at 6°C. Interestingly, a 5.5- and a 3.7-fold higher Trpm2 expression was detected in livers of cold-exposed WT and Cd38-/- mice, respectively (Figure 7A). Moreover, hepatic MacroD1 and Parg gene expression were upregulated in WT mice exposed to cold, approximately by 7 and 2 folds, respectively, in comparison to control mice (Figure 7B). Thus, the hepatic regulation of Trpm2, MacroD1 and Parg expression is similar to that occurring in iBAT.
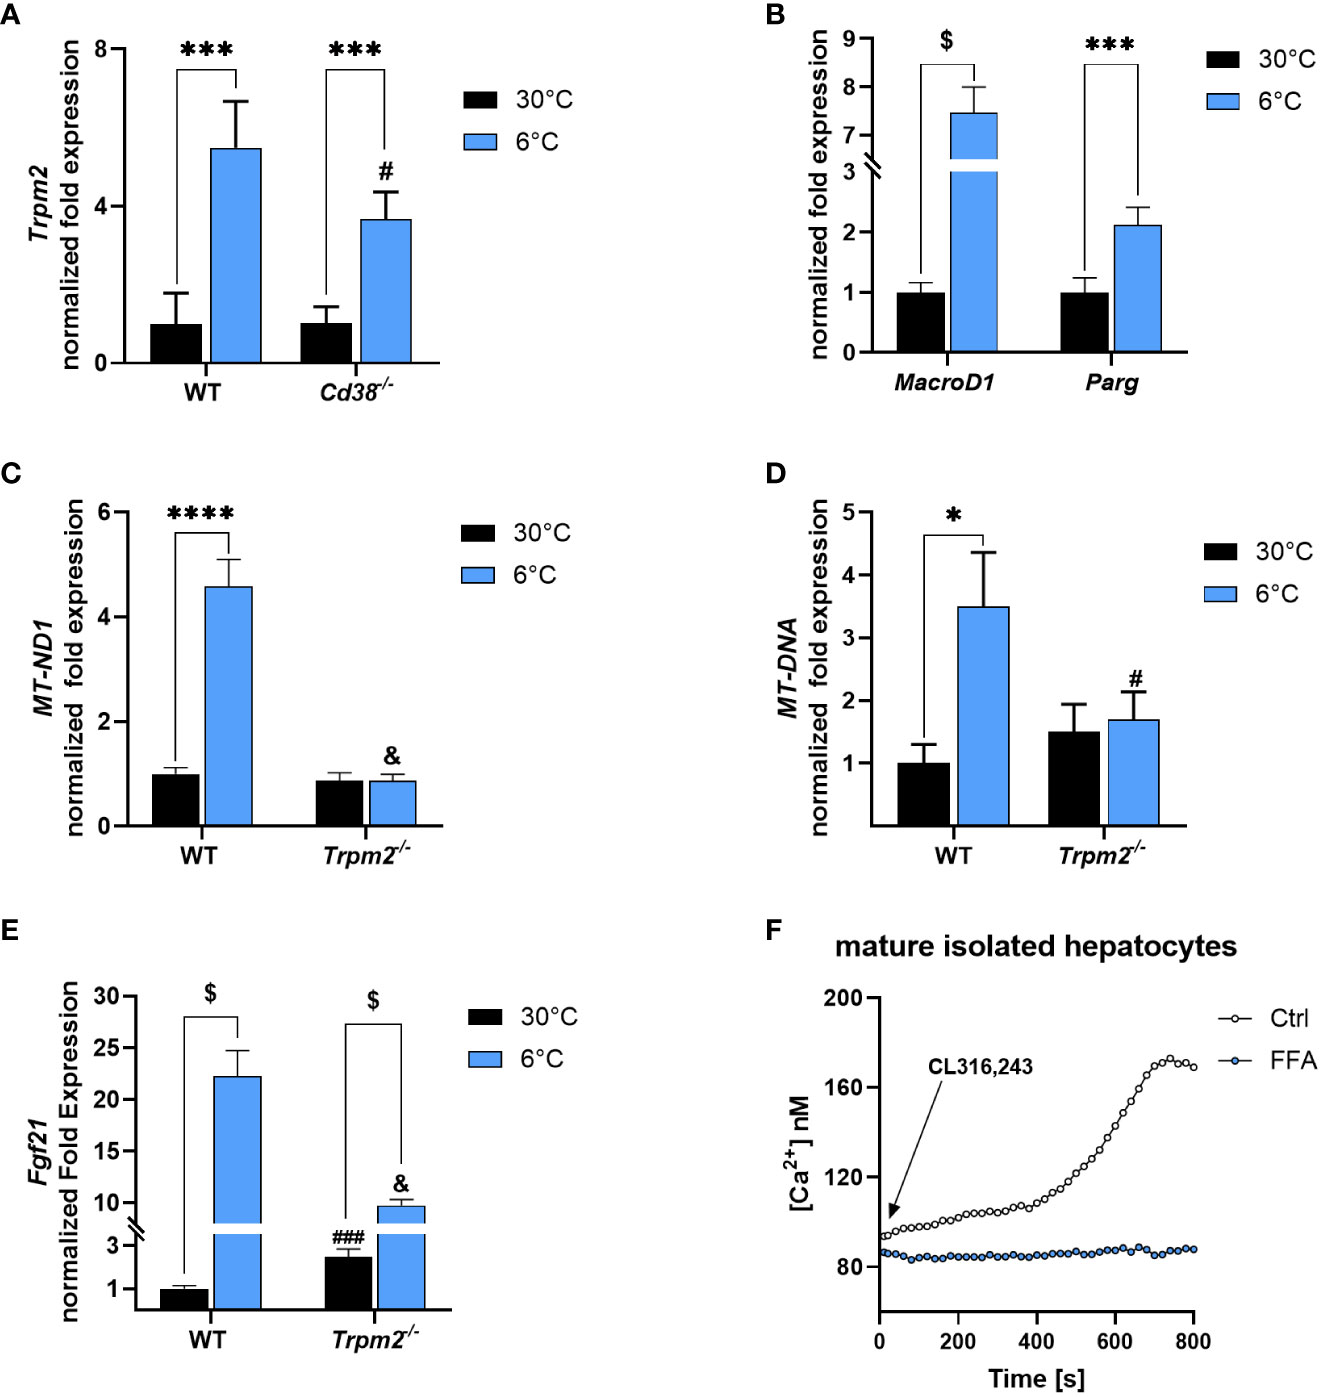
Figure 7 Trpm2 in liver during thermogenesis. Livers were collected from WT, Cd38−/− and Trpm2-/- mice kept at 30°C (black bars) or 6°C (blue bars). (A), Trpm2 gene expression was evaluated in WT and Cd38−/− by qPCR. (B, C, E), MacroD1 and Parg (B), MT-ND1 (C) and Fibroblast growth factor 21 (Fgf21, E) gene expression was evaluated in WT and Trpm2-/- mice by qPCR. (D) The mitochondrial/nuclear DNA ratio was evaluated by qPCR. (F) Hepatocytes were isolated from WT mice and loaded with Fura2. Cells were pre-incubated (or not) for 10 min with 200 μM FFA and [Ca2+]i measurements, upon 1 μM CL316,243 stimulation, were performed with a microfluorimetric system (Cairn Research, Faversham, Kent, UK). Results are mean ± SD of determinations on tissues from different animals (n = 4). Data analyzed by ANOVA followed by Tukey’s test: *, p<0.5, ***, p<0.001, ****, p<0.0001, $, p<0.00001; #, p<0.05, ###, p<0.0001, &, p<0.00001 compared with the corresponding WT.
The absence of Trpm2 hampered the promotion of mitochondrial metabolism occurring during thermogenesis (4.6-fold higher MT-ND1 expression, the gene encoding for NADH : Ubiquinone Oxidoreductase Core Subunit 1, in WT mice exposed to 6°C compared to control mice; Figure 7C). Moreover, the mitochondrial/nuclear DNA ratio confirmed that, also in liver, the absence of TRPM2 hampered the increase in mitochondrial content, upon cold exposure (Figure 7D). Hepatic Fgf21 gene expression was increased in WT mice exposed to cold (by 22 times). However, this effect was greatly attenuated in liver of Trpm2-/- mice exposed to cold (Figure 7E). Overall, these data suggest that mitochondrial activity in response to cold exposure and the production of FGF21, processes that could contribute to systemic energy expenditure and heat production, may be impaired in TRPM2-deficient mice. Finally, the use of the TRPM2 inhibitor FFA reduced the Ca2+ increase induced by CL in isolated hepatocytes (Figure 7F), in line with previous reports demonstrating that, in hepatocytes, the epinephrine-induced Ca2+ rise was abolished by EGTA (chelating the extracellular Ca2+) and by 2-APB (47), which has been reported to act as a TRPM2 antagonist (48). The steady and slow Ca2+ increase induced by CL in hepatocytes was very different than the Ca2+ rise observed in adipocytes (Figure 5F): this is possibly due to the different contribution of the various components determining to the global Ca2+ rise (49). Nevertheless, it is noteworthy to remark that the role for TRPM2 in the CL-induced Ca2+ increase seems to be more relevant in a “not rapid” phase.
3.7 Trpm2-/- mice exhibit lower respiration and energy expenditure
To investigate in vivo the consequences of Trpm2 ablation in mice during cold exposure and adrenergic signaling, two sets of experiments were performed using indirect calorimetry to monitor O2 consumption and CO2 production. These values were used to calculate energy expenditure (EE) in WT and TRPM2-deficient mice in a so-called Scholander experiment, where a stepwise decrease in the ambient temperature results in increased EE to maintain a constant body core temperature. As expected, both O2 consumption and CO2 production increased at day (Figures 8A, B) and at night (Figures 8C, D). In line with these data, a substantial increase in EE was observed when the ambient temperature was reduced at daytime (Figure 8E) and at night (Figure 8F). In Trpm2-/- mice, O2 consumption and by trend CO2 production were lower at colder temperatures, which compared to WT resulting in significantly lower EE. Next, to investigate the total thermogenic capacity of BAT, mice housed at thermoneutrality were injected with CL to specifically activate thermogenesis in BAT (Figures 8G-J). As expected, CL treatment caused a substantial increase in O2 consumption, CO2 production and EE in mice (Figures 8G-J). Notably, Trpm2-/- mice exhibited attenuated thermogenic response when compared to WT mice, exhibiting lower O2 consumption, CO2 production and EE in comparison with WT treated mice (Figures 8G-J). Overall, these data indicate that TRPM2 plays an important role in adaptive thermogenesis and energy homeostasis in response to cold and β3-adrenergic receptor activation.
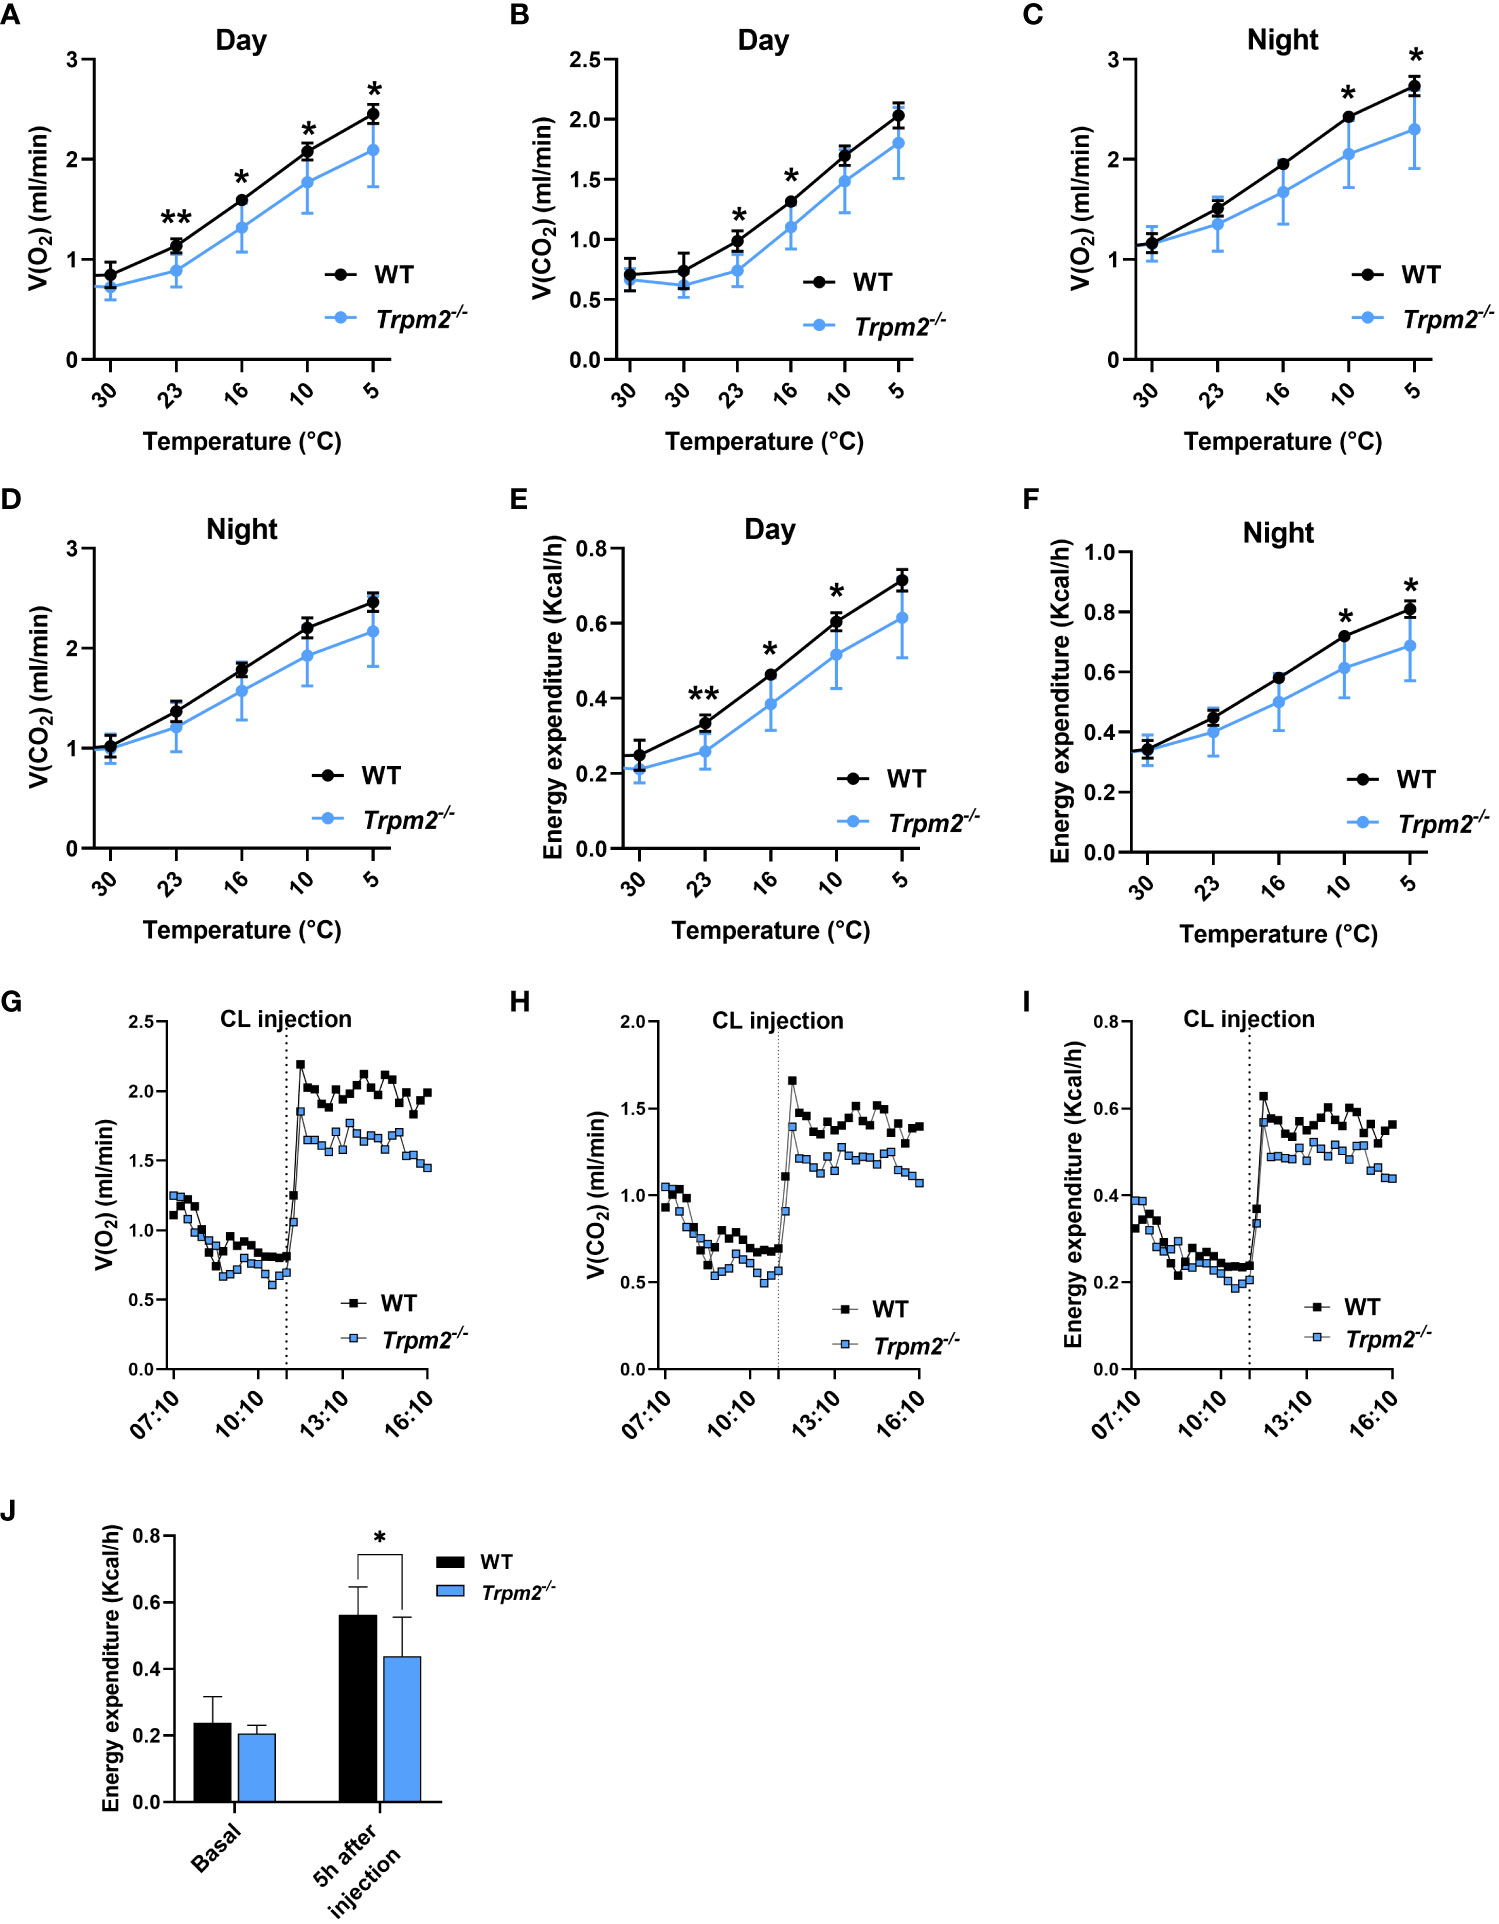
Figure 8 Trpm2 deficiency reduced the thermogenic capacity in response to cold acclimation and adrenergic stimulation. (A-D), In vivo measurements (O2 consumption and CO2 production) performed on WT (black lines) and Trpm2-/- mice (blue lines) housed for 5 days to decreasing temperatures (from 30°C to 5°C) during the light time (Day; (A, B) and the dark time (Night; (C, D); mean ± SD (n=6 mice per group). (E, F), calculated EE at Day (E) and Night (F); mean ± SD (n=6 mice per group). (G), O2 consumption, (H), CO2 production, and (I), EE in WT (black lines) and Trpm2-/- mice (blue lines) mice housed at thermoneutrality upon CL administration. Monitoring started approximately 4 h before the treatment and stopped 5 h after the injection of CL; mean traces from n=6 mice per group are shown. (J), EE: mean ± SD (n=6) of calculated values at 1 h before and 5 h after CL injection in WT (black bars) and Trpm2-/- mice (blue bars). * p ≤ 0.05 and ** p ≤ 0.01 by two-tailed unpaired Student’s t test.
4 Discussion
The aim of the present study was to evaluate the role of TRPM2 in WAT, BAT and liver during thermogenesis. We had previously demonstrated that the expression of CD38 is downregulated in response to cold exposure, which modulates the content of NAD(P)(H) in adipose tissues (30). CD38 and TRPM2 are usually considered as sequentially linked in a shared signaling axis, impacting on the intracellular levels of the third messenger Ca2+ as CD38 generates ADPR, the main TRPM2 agonist.
The role of various TRPs channels in adipose tissue metabolism has been extensively studied in the last two decades. TRPV1 is a calcium channel activated by capsaicin and, when activated by agonists, prevents obesity induced by HFD: the effect was abolished in mice lacking this channel (50). In addition, dietary TRPV1 activators are involved in adrenaline secretion from the nervous system, thus enhancing WAT browning and in turn, energy expenditure (51). On the contrary, TRPV4 seems to play a negative role in thermogenesis. Indeed, the expression of the browning markers PGC1-α and UCP1 is promoted upon TRPV4 suppression (52). In addition, mice lacking TRPV4 are resistant to HFD-induced obesity (53). The most studied TRP channel in the context of adipose tissue biology and thermogenesis is TRPM8. As a thermoreceptor, this channel is activated not only by cold-mimicking compounds (such as menthol and icilin), but also by cold temperature (54). Different studies reported that TRPM8 activation through menthol administration in vitro enhances UCP1 expression, mitochondrial activation and heat production, and thus promotes WAT browning and BAT activation (55–59). Furthermore, in vivo dietary menthol supplementation reduces insulin resistance and ameliorates HFD-induced obesity (55, 57).
Mice lacking Cd38 exhibit enhanced thermogenesis, as measured by the expression of the two main browning markers (30). Through the use of mice lacking Trpm2, we thus aimed at clarifying whether the results obtained from Cd38-/- mice in adipose tissue are a consequence, not only of an altered NAD+ consumption, but also of a modified activation of the TRPM2 channel. If CD38 effect were due to the lack of ADPR for TRPM2 gating, it would be reasonable to hypothesize that ADPR-induced TRPM2 signaling could be detrimental for thermogenesis in adipose tissue. Instead, the obtained data unequivocally demonstrate that the absence or inhibition of TRPM2 significantly reduce the response to thermogenic stimuli. Indeed, mice lacking Trpm2 exhibit lower respiration rate and reduced energy expenditure when thermogenesis is stimulated both by cold temperature and by β3-adrenergic receptor activation (Figure 8). In addition, gene expression analyses confirmed that the browning process is reduced in WAT and BAT (Figure 1) in Trpm2-/- mice upon cold exposure. Finally, TRPM2 pharmacological inhibition hampered Ucp1 expression in white and brown primary adipocytes (Figures 5A, B).
Furthermore, the increased expression of Trpm2 in WAT and BAT (specifically in brown adipocytes within BAT) upon short-term cold exposure (Figures 3A-C), and in primary adipocytes stimulated with CL (Figure 5E) confirm that TRPM2 plays a pivotal role in thermogenesis. Notably, Trpm2 induction also occurs in mice lacking Cd38, at similar levels in WAT, and even at higher levels in BAT (Figures 3A, B), suggesting that: a) the Trpm2 transcription occurs independently of CD38-mediated signaling pathways; b) a higher expression of Trpm2 may be associated to an improved BAT activation, as occurring in Cd38-/- mice (30). Admittedly, the exact mechanism regulating Trpm2 transcription has not been defined and will represent an interesting new area of investigation.
As mentioned above, TRPM2 activation is considered to be due to the CD38-mediated production of ADPR. Instead, in thermogenesis, CD38 and TRPM2 are regulated in opposite directions: Trpm2 is overexpressed (Figure 3), whereas CD38 is downregulated (30). Being CD38 one of the major ADPR producers, its reduced expression could be associated with reduced ADPR levels and, as a consequence, lower TRPM2 activation. Instead, we observed that ADPR levels rise in WAT and BAT (Figure 4A) when WT mice are exposed to cold, i.e. when CD38 is down-regulated (30). Moreover, ADPR levels were increased also in BAT of Cd38-/- mice (Figure 4A), in line with the conclusion that CD38 cannot represent the source of ADPR during cold exposure, and that the CD38-mediated ADPR production does not impact BAT activation. In this respect, a possible detrimental role for cyclic ADP-ribose (activating ryanodine receptors), which would not be produced in the absence/downregulation of CD38, cannot be ruled out at present. However, an enhanced Ca2+ cycling, upon activation of α1/β3-adrenergic receptors or the SERCA2b-ryanodine receptor 2 pathway, stimulates UCP1-independent thermogenesis in beige adipocytes (60), suggesting that reduced production of cyclic ADP-ribose is unlikely to represent the reason for an improved thermogenesis in Cd38-/- mice (30).
Altogether, our findings unveil for the first time that ADPR is likely pivotal in the activation of the thermogenic program in WAT and BAT, possibly by regulating cytosolic Ca2+ levels (Figure 5F), and that enzymes other than CD38 are responsible for ADPR generation in thermogenic adipose tissues in response to cold exposure. The hydrolysis of mono-ADP-ribosyl (MAR) and/or poly-ADP-ribosyl groups may represent a pathway that provides free ADPR to sustain TRPM2 activation (Figure 4). Our data suggest that PAR hydrolysis could contribute to ADPR generation during cold exposure, since: a) the expression of Parg and Adprs (acting on PAR) is up-regulated also in Cd38-/- mice (Figure 4E); b) Parg is one of the most expressed enzymes among the MAR and PAR hydrolases tested; c) the level of PARylated proteins is significantly reduced upon cold exposure (Figures 4C, D).
Previous studies reported alternative TRPM2 activation pathways that do not involve CD38 activity: 2’-O-Acetyl-ADPR (OAADPR) generated by SIRT2 and SIRT3 is able to mediate TRPM2 gating (61); OAADPR and/or ADPR produced by SIRT6 regulates TRPM2 gating that, in turn, promotes the release of pro-inflammatory cytokines and pancreatic cell migration (43). Park and colleagues suggested the role of PARPs in TRPM2 activation during high oxidative stress and investigated this mechanism in the context of Alzheimer disease. They showed that amyloid-beta-induced oxidative stress determines a neurovascular dysfunction through TRPM2 overactivation, suggesting that TRPM2 inhibition could be a therapeutic target for this neurodegenerative disease (62).
Regarding the role of PARPs in adipose tissue, PARP1 and 2 inhibition showed a positive effect on energy metabolism, being PARP1 suppression associated to higher SIRT1 activity, leading to higher energy expenditure and increased mitochondrial activity (63). In line with this, Parp2 genetic ablation increased energy expenditure in mice and promoted mitochondrial biogenesis in different tissues, including liver. This is due to the negative effect exerted by PARP2 on Sirt1 promoters, that suppress its expression (64).
To the best of our knowledge, our study is the first one reporting an induction of PAR, as well as MAR hydrolases, in association to WAT browning and BAT activation, revealing ADPR increase and higher TRPM2 expression in response to cold. It is of note that CD38 plays a crucial role in the cross-regulation of glycolysis and gluconeogenesis in liver in response to cold-induced thermogenesis (33), which is in line with the importance of CD38-mediated cADPR production and Ca2+ signaling in glucagon-induced stimulation of gluconeogenesis (65). Conversely, the ADPR-TRPM2 axis does not seem to be relevant in the regulation of glycolysis and gluconeogenesis, at least during thermogenesis, since Trpm2-/- ablation does not affect the down-regulation of glycolytic genes and the upregulation of G6P phosphatase (Figure 6). Instead, the lack of Trpm2 seems to impair mitochondrial function and reduce FGF21 secretion by the liver (Figures 7C-E), which both could contribute to the systemic hampered thermogenic response. Importantly, it has been recently demonstrated that the β-adrenergic-dependent increase in circulating FGF21 (which derives mainly from liver) occurs through an indirect mechanism: adipocyte-derived fatty acids stimulate FGF21 expression in liver (66). Thus, the reduced levels of FGF21 in Trpm2-/- mice is likely a consequence of the hampered response to cold in adipose tissue, although a role for hepatic TRPM2 in mediating Fgf21 production cannot be excluded.
Overall, in adipocytes, TRPM2 may be activated downstream of β-adrenergic receptors’ stimulation, through multiple pathways: a) increased ADPR content, as a consequence of increased PAR degradation (Figure 4); b) cAMP increase, which-may activate TRPM2 both through the activation of PKA and/or EPAC, as reported to occur in other cell types (67, 68); c) increased mitochondrial activity in BAT during cold exposure is accompanied by the production of ROS (69), known TRPM2 agonists (17, 18).
Our data indicate that TRPM2 activation regulates CREB expression level and Akt phosphorylation: a) the increase in CREB levels were lower in Trpm2-/- BAT and WAT from mice exposed to cold and in isolated mature brown adipocytes collected from mice exposed to cold (Figures 2A, B); b) the CL-induced increase in CREB expression was reduced in SVF-derived adipocytes upon TRPM2 pharmacological inhibition (Figures 5C, D); c) in Trpm2-/- BAT and WAT, the cold-induced increase in phosphorylation of Akt was reduced (Figures 2C, D). CREB has been reported to be downstream of TRPM2 activation in neuroblastoma cells (70) and in AML cells (39). In addition, the fact that CREB expression is downstream of Ca2+ increase has been well documented (40). Akt activation is known to lie downstream of TRPM2 activation in different models, including gastric cancer cell and aortic smooth muscle cells (71, 72).
Intriguingly, TRPM2 has been recently demonstrated to play an important role in body temperature regulation acting as a temperature sensor in a subpopulation of hypothalamic neurons (73) and the homeostatic body-response to warm temperature was hampered in Trpm2-/- mice (74). From the result presented in our study, a role for hypothalamic TRPM2 in the detection of cold temperatures cannot be ruled out. Nevertheless, in Brandt’s voles, TRPM2 expression was strongly up-regulated in BAT upon cold-exposure, in line with our findings, whereas TRPM2 expression was not modified in the hypothalamus (75).
In conclusion, our results demonstrate that increased NAD+ levels, obtained through physiological downregulation of CD38 in response to cold (as during thermogenesis; 30, 33), or following CD38 pharmacological inhibition, are not impacting TRPM2 activity through a hampered CD38-dependent production of ADPR. This is of great interest in the field of chronic inflammatory diseases, given the numerous efforts of the research community to increase intracellular NAD+ levels for the treatment of various pathological conditions. The fact that cold-induced thermogenesis leads to a lower NAD+ degradation in adipose tissue and liver may uncover a further benefit of this approach, which is under investigation for the amelioration of several metabolic disturbances. Moreover, since Cd38-/- mice are able to sustain an enhanced BAT activation and WAT browning upon cold stimulation, NAD+ availability seems to be a factor limiting these processes. Indeed, the phenotype we observed in Cd38-/- mice upon cold stimulation, is not to be ascribed to the impaired activation of TRPM2 channel, since the lack of TRPM2 leads to a reduced WAT browning and BAT activation.
Further studies are required to investigate whether pharmacological TRPM2 activation may represent a new therapeutic strategy for the treatment of metabolic diseases, aimed at improving thermogenic capacity and activity of WAT and BAT.
Data availability statement
The datasets presented in this study can be found in online repositories. The names of the repository/repositories and accession number(s) can be found below: not applicable.
Ethics statement
The animal studies were approved by Animal Welfare Officers at University Medical Center Hamburg-Eppendorf. The studies were conducted in accordance with the local legislation and institutional requirements. Written informed consent was obtained from the owners for the participation of their animals in this study.
Author contributions
Conceptualization, SB, AG, and JH. Conception and design of the study, AB, MH, JH, SB. Methodology and Investigation, AB, MH, SS, AS, AW, BD, CA, RPM, AM, MJ, VV. Resources, FK-N and H-WM. Data Curation, AB and SB. Writing Original Draft Preparation, AB and SB. Writing Review and Editing, SB, H-WM, AF, JH. Supervision, LS, GD, JH, and SB. Funding Acquisition, FK-N, H-WM, AG, JH, and SB. All authors contributed to the article and approved the submitted version.
Funding
The author(s) declare financial support was received for the research, authorship, and/or publication of this article. FK-N, H-WM, AG, and JH were supported by DFG grants (project-ID: 335447727-SFB 1328). SB was granted by a Faculty Research Visit Grant from the DAAD (German Academic Exchange Service) for this project. SB was also supported by the University of Genova, by the Italian Ministry of Education, University and Research (PRIN2017Z5LR5Z_003), and by Compagnia di San Paolo. This work was also supported by the European Union’s Horizon 2020 research and innovation programme [Marie Skłodowska -Curie, GAP 101073251; NADIS, to SB; RM, Doctoral candidate within NADIS).
Acknowledgments
We thank Dr. Yasuo Mori for providing Trpm2-/- mice and Dr. Barbara De Giovanni (RCCS Istituto Giannina Gaslini), Prof Anna Pittaluga and Dr Alessandra Roggeri for technical support.
Conflict of interest
The authors declare that the research was conducted in the absence of any commercial or financial relationships that could be construed as a potential conflict of interest.
Publisher’s note
All claims expressed in this article are solely those of the authors and do not necessarily represent those of their affiliated organizations, or those of the publisher, the editors and the reviewers. Any product that may be evaluated in this article, or claim that may be made by its manufacturer, is not guaranteed or endorsed by the publisher.
References
1. Fenzl A, Kiefer FW. Brown adipose tissue and thermogenesis. Horm. Mol Biol Clin Investig (2014) 19:25–37. doi: 10.1515/hmbci-2014-0022
2. Martínez-Sánchez N. There and back again: leptin actions in white adipose tissue. Int J Mol Sci (2020) 21:6039. doi: 10.3390/ijms21176039
3. Hondares E, Iglesias R, Giralt A, Gonzalez FJ, Giralt M, Mampel T, et al. Thermogenic activation induces FGF21 expression and release in brown adipose tissue. J Biol Chem (2011) 286:12983–90. doi: 10.1074/jbc.M110.215889
4. Worthmann A, John C, Rühlemann MC, Baguhl M, Heinsen FA, Schaltenberg N, et al. Cold-induced conversion of cholesterol to bile acids in mice shapes the gut microbiome and promotes adaptive thermogenesis. Nat Med (2017) 23:839–49. doi: 10.1038/nm.4357
5. Hankir MK, Klingenspor M. Brown adipocyte glucose metabolism: a heated subject. EMBO Rep (2018) 19:e46404. doi: 10.15252/embr.201846404
6. Jung SM, Sanchez-Gurmaches J, Guertin DA. Brown adipose tissue development and metabolism. Handb. Exp Pharmacol (2019) 251:3–36. doi: 10.1007/164_2018_168
7. Giralt M, Villarroya F. White, brown, beige/brite: different adipose cells for different functions? Endocrinology (2013) 154:2992–3000. doi: 10.1210/en.2013-1403
8. Bartelt A, Heeren J. Adipose tissue browning and metabolic health. Nat Rev Endocrinol (2014) 10:24–36. doi: 10.1038/nrendo.2013.204
9. Lee JH, Park A, Oh KJ, Lee SC, Kim WK, Bae KH. The role of adipose tissue mitochondria: regulation of mitochondrial function for the treatment of metabolic diseases. Int J Mol Sci (2019) 20:4924. doi: 10.3390/ijms20194924
10. Lee P, Smith S, Linderman J, Courville AB, Brychta RJ, Dieckmann W, et al. Temperature-acclimated brown adipose tissue modulates insulin sensitivity in humans. Diabetes (2014) 63:3686–98. doi: 10.2337/db14-0513
11. van Marken Lichtenbelt WD, Vanhommerig JW, Smulders NM, Drossaerts JM, Kemerink GJ, Bouvy ND, et al. Cold-activated brown adipose tissue in healthy men. N Engl J Med (2009) 360:1500–8. doi: 10.1056/NEJMoa0808718
12. Rabiee A. Beige fat maintenance; toward a sustained metabolic health. Front Endocrinol (2020) 11:634. doi: 10.3389/fendo.2020.00634
13. Brandão BB, Poojari A, Rabiee A. Thermogenic fat: development, physiological function, and therapeutic potential. Int J Mol Sci (2021) 22:5906. doi: 10.3390/ijms22115906
14. Becher T, Palanisamy S, Kramer DJ, Eljalby M, Marx SJ, Wibmer AG. Brown adipose tissue is associated with cardiometabolic health. Nat Med (2021) 27:58–65. doi: 10.1038/s41591-020-1126-7
15. Suchacki KJ, Stimson RH. Nutritional regulation of human brown adipose tissue. Nutrients (2021) 13:1748. doi: 10.3390/nu13061748
16. Chait A, den Hartigh LJ. Adipose tissue distribution, inflammation and its metabolic consequences, including diabetes and cardiovascular disease. Front Cardiovasc Med (2020) 7:22. doi: 10.3389/fcvm.2020.00022
17. Sumoza-Toledo A, Penner R. TRPM2: a multifunctional ion channel for calcium signalling. J Physiol (2011) 589:1515–25. doi: 10.1113/jphysiol.2010.201855
18. Fliegert R, Bauche A, Wolf Pérez AM, Watt JM, Rozewitz MD, Winzer R, et al. 2'-Deoxyadenosine 5'-diphosphoribose is an endogenous TRPM2 superagonist. Nat Chem Biol (2017) 13:1036–44. doi: 10.1038/nchembio.2415
19. Wehage E, Eisfeld J, Heiner I, Jüngling E, Zitt C, Lückhoff A. Activation of the cation channel long transient receptor potential channel 2 (LTRPC2) by hydrogen peroxide. A splice variant reveals a mode of activation independent of ADP-ribose. J Biol Chem (2002) 277:23150–6. doi: 10.1074/jbc.M112096200
20. Kühn FJP, Lückhoff A. Sites of the NUDT9-H domain critical for ADP-ribose activation of the cation channel TRPM2. J Biol Chem (2004) 279:46431–7. doi: 10.1074/jbc.M407263200
21. Ishii M, Shimizu S, Hara Y, Hagiwara T, Miyazaki A, Mori Y, et al. Intracellular-produced hydroxyl radical mediates H2O2-induced Ca2+ influx and cell death in rat beta-cell line RIN-5F. Cell Calcium. (2006) 39:487–94. doi: 10.1016/j.ceca.2006.01.013
22. Riekehr WM, Sander S, Pick J, Tidow H, Bauche A, Guse AH, et al. cADPR does not activate TRPM2. Int J Mol Sci (2022) 23:3163. doi: 10.3390/ijms23063163
23. Kunitoshi U, Makoto T. The role of TRPM2 in pancreatic β-cells and the development of diabetes. Cell Calcium. (2014) 56:332–9. doi: 10.1016/j.ceca.2014.07.001
24. Zhang Z, Zhang W, Jung DY, Ko HJ, Lee Y, Friedline RH, et al. TRPM2 Ca2+ channel regulates energy balance and glucose metabolism. Am J Physiol Endocrinol Metab (2012) 302:E807–16. doi: 10.1152/ajpendo.00239.2011
25. Gao M, Du Y, Xie JW, Xue J, Wang YT, Qin L, et al. Redox signal-mediated TRPM2 promotes Ang II-induced adipocyte insulin resistance via Ca2+-dependent CaMKII/JNK cascade. Metabolism (2018) 85:313–24. doi: 10.1016/j.metabol.2018.05.005
26. Kheradpezhouh E, Zhou FH, Barritt GJ, Rychkov GY. Oxidative stress promotes redistribution of TRPM2 channels to the plasma membrane in hepatocytes. Biochem Biophys Res Commun (2018) 503:1891–6. doi: 10.1016/j.bbrc.2018.07.132
27. Zhong C, Yang J, Zhang Y, Fan X, Fan Y, Hua N, et al. TRPM2 Mediates Hepatic Ischemia-Reperfusion Injury via Ca2+-Induced Mitochondrial Lipid Peroxidation through Increasing ALOX12 Expression. Res (Wash DC) (2023) 6:159. doi: 10.34133/research.0159
28. Sun W, Li C, Zhang Y, Jiang C, Zhai M, Zhou Q, et al. Gene expression changes of thermo-sensitive transient receptor potential channels in obese mice. Cell Biol Int (2017) 41:908–13. doi: 10.1002/cbin.10783
29. Fonfria E, Murdock PR, Cusdin FS, Benham CD, Kelsell RE, McNulty S. Tissue distribution profiles of the human TRPM cation channel family. J Recept. Signal Transduction Res (2006) 26:159–78. doi: 10.1080/10799890600637506
30. Benzi A, Sturla L, Heine M, Fischer AW, Spinelli S, Magnone M, et al. CD38 downregulation modulates NAD+ and NADP(H) levels in thermogenic adipose tissues. Biochim Biophys Acta Mol Cell Biol Lipids. (2021) 1866:158819. doi: 10.1016/j.bbalip.2020.158819
31. Yamamoto S, Shimizu S, Kiyonaka S, Takahashi N, Wajima T, Hara Y, et al. TRPM2-mediated ca2+ Influx induces chemokine production in monocytes that aggravates inflammatory neutrophil infiltration. Nat Med (2008) 14:738–47. doi: 10.1038/nm1758
32. Sturla L, Fresia C, Guida L, Bruzzone S, Scarfi S, Usai C, et al. LANCL2 is necessary for abscisic acid binding and signaling in human granulocytes and in rat insulinoma cells. J Biol Chem (2009) 284:28045–57. doi: 10.1074/jbc.M109.035329
33. Benzi A, Spinelli S, Sturla L, Heine M, Fischer AW, Koch-Nolte F, et al. Role of liver CD38 in the regulation of metabolic pathways during cold-induced thermogenesis in mice. Cells (2022) 11:3812. doi: 10.3390/cells11233812
34. Livak KJ, Schmittgen TD. Analysis of relative gene expression data using realtime quantitative PCR and the 2–ΔΔCt method. Methods (2001) 25:402–8. doi: 10.1006/meth.2001.1262
35. Fu X, Deja S, Kucejova B, Duarte JAG, McDonald JG, Burgess SC. Targeted determination of tissue energy status by LC-MS/MS. Anal Chem (2019) 91:5881–7. doi: 10.1080/10799890600637506
36. Fischer AW, Jaeckstein MY, Gottschling K, Heine M, Sass F, Mangels N, et al. Lysosomal lipoprotein processing in endothelial cells stimulates adipose tissue thermogenic adaptation. Cell Metab (2021) 33:547–564.e7. doi: 10.1016/j.cmet.2020.12.001
37. Jung Y, Zhao M, Svensson KJ. Isolation, culture, and functional analysis of hepatocytes from mice with fatty liver disease. STAR Protoc (2020) 1:100222. doi: 10.1016/j.xpro.2020.100222
38. Weir JB. New methods for calculating metabolic rate with special reference to protein metabolism. J Physiol (1949) 109:1–9. doi: 10.1113/jphysiol.1949.sp004363
39. Chen SJ, Bao L, Keefer K, Shanmughapriya S, Chen L, Lee J, et al. Transient receptor potential ion channel TRPM2 promotes AML proliferation and survival through modulation of mitochondrial function, ROS, and autophagy. Cell Death. Dis (2020) 11:247. doi: 10.1038/s41419-020-2454-8
40. Thiel G, Schmidt T, Rössler OG. Ca2+ Microdomains, calcineurin and the regulation of gene transcription. Cells (2021) 10:875. doi: 10.3390/cells10040875
41. Tabuchi C, Sul HS. Signaling pathways regulating thermogenesis. Front Endocrinol (Lausanne). (2021) 12:698619. doi: 10.3389/fendo.2021.698619
42. Zhang Z, Yang D, Xiang J, Zhou J, Cao H, Che Q, et al. Non-shivering thermogenesis signalling regulation and potential therapeutic applications of brown adipose tissue. Int J Biol Sci (2021) 17:2853–70. doi: 10.7150/ijbs.60354
43. Bauer I, Grozio A, Lasigliè D, Basile G, Sturla L, Magnone M, et al. The NAD+-dependent histone deacetylase SIRT6 promotes cytokine production and migration in pancreatic cancer cells by regulating Ca2+ responses. J Biol Chem (2012) 287:40924– 37. doi: 10.1074/jbc.M112.405837
44. Barkauskaite E, Brassington A, Tan ES, Warwicker J, Dunstan MS, Banos B, et al. Visualization of poly(ADP-ribose) bound to PARG reveals inherent balance between exo- and endo-glycohydrolase activities. Nat Commun (2013) 4:2164. doi: 10.1038/ncomms3164
45. Mashimo M, Kato J, Moss J. Structure and function of the ARH family of ADP-ribosyl-acceptor hydrolases. DNA Repair (Amst). (2014) 23:88–94. doi: 10.1016/j.dnarep.2014.03.005
46. Hill K, McNulty S, Randall AD. Inhibition of TRPM2 channels by the antifungal agents clotrimazole and econazole. Naunyn Schmiedebergs. Arch Pharmacol (2004) 370:227–37. doi: 10.1007/s00210-004-0981-y
47. Gregory RB, Barritt GJ. Evidence that Ca2+-release-activated Ca2+ channels in rat hepatocytes are required for the maintenance of hormone-induced Ca2+ oscillations. Biochem J (2003) 370:695–702. doi: 10.1042/BJ20021671
48. Togashi K, Inada H, Tominaga M. Inhibition of the transient receptor potential cation channel TRPM2 by 2-aminoethoxydiphenyl borate (2-APB). Br J Pharmacol (2008) 153:1324–30. doi: 10.1038/sj.bjp.0707675
49. Hayato R, Higure Y, Kuba M, Nagai H, Yamashita H, Kuba K. β3-Adrenergic activation of sequential Ca(2+) release from mitochondria and the endoplasmic reticulum and the subsequent Ca(2+) entry in rodent brown adipocytes. Cell Calcium. (2011) 49:400–14. doi: 10.1016/j.ceca.2011.02.011
50. Lee E, Jung DY, Kim JH, Patel PR, Hu X, Lee Y, et al. Transient receptor potential vanilloid type-1 channel regulates diet-induced obesity, insulin resistance, and leptin resistance. FASEB J (2015) 29:3182–92. doi: 10.1096/fj.14-268300
51. Ohyama K, Nogusa Y, Shinoda K, Suzuki K, Bannai M, Kajimura S, et al. A synergistic antiobesity effect by a combination of capsinoids and cold temperature through promoting beige adipocyte biogenesis. Diabetes (2016) 65:1410–23. doi: 10.2337/db15-0662
52. Ye L, Kleiner S, Wu J, Sah R, Gupta RK, Banks AS, et al. TRPV4 is a regulator of adipose oxidative metabolism, inflammation, and energy homeostasis. Cell (2012) 151:96–110. doi: 10.1016/j.cell.2012.08.034
53. Kusudo T, Wang Z, Mizuno A, Suzuki M, Yamashita H. TRPV4 deficiency increases skeletal muscle metabolic capacity and resistance against diet-induced obesity. J Appl Physiol (1985) 112:1223–32. doi: 10.1152/japplphysiol.01070.2011
54. Liu Y, Mikrani R, He Y, Faran Ashraf Baig MM, Abbas M, Naveed M, et al. TRPM8 channels: A review of distribution and clinical role. Eur J Pharmacol (2020) 882:173312. doi: 10.1016/j.ejphar.2020.173312
55. Ma S, Yu H, Zhao Z, Luo Z, Chen J, Ni Y, et al. Activation of the cold-sensing TRPM8 channel triggers UCP1-dependent thermogenesis and prevents obesity. J Mol Cell Biol (2012) 4:88–96. doi: 10.1093/jmcb/mjs001
56. Rossato M, Granzotto M, Macchi V, Porzionato A, Petrelli L, Calcagno A, et al. Human white adipocytes express the cold receptor TRPM8 which activation induces UCP1 expression, mitochondrial activation and heat production. Mol Cell Endocrinol (2014) 383:137–46. doi: 10.1016/j.mce.2013.12.005
57. Jiang C, Zhai M, Yan D, Li D, Li C, Zhang Y, et al. Dietary menthol-induced TRPM8 activation enhances WAT "browning" and ameliorates diet-induced obesity. Oncotarget (2017) 8:75114–26. doi: 10.18632/oncotarget.20540
58. Khare P, Mangal P, Baboota RK, Jagtap S, Kumar V, Singh DP, et al. Involvement of glucagon in preventive effect of menthol against high fat diet induced obesity in mice. Front Pharmacol (2018) 9:1244. doi: 10.3389/fphar.2018.01244
59. Sanders OD, Rajagopal JA, Rajagopal L. Menthol to induce non-shivering thermogenesis via TRPM8/PKA signaling for treatment of obesity. J Obes Metab Syndr (2021) 30:4–11. doi: 10.7570/jomes20038
60. Ikeda K, Kang Q, Yoneshiro T, Camporez JP, Maki H, Homma M, et al. UCP1-independent signaling involving SERCA2b-mediated calcium cycling regulates beige fat thermogenesis and systemic glucose homeostasis. Nat Med (2017) 23:1454–65. doi: 10.1038/nm.4429
61. Grubisha O, Rafty LA, Takanishi CL, Xu X, Tong L, Perraud AL, et al. Metabolite of SIR2 reaction modulates TRPM2 ion channel. J Biol Chem (2006) 281:14057–65. doi: 10.1074/jbc.M513741200
62. Park L, Wang G, Moore J, Girouard H, Zhou P, Anrather J, et al. The key role of transient receptor potential melastatin-2 channels in amyloid-beta-induced neurovascular dysfunction. Nat Commun (2014) 5:5318. doi: 10.1038/ncomms6318
63. Bai P, Canto C, Brunyánszki A, Huber A, Szántó M, Cen Y, et al. PARP-2 regulates SIRT1 expression and whole-body energy expenditure. Cell Metab (2011) 13:450–60. doi: 10.1016/j.cmet.2011.03.013
64. Bai P, Cantó C, Oudart H, Brunyánszki A, Cen Y, Thomas C, et al. PARP-1 inhibition increases mitochondrial metabolism through SIRT1 activation. Cell Metab (2011) 13:461–8. doi: 10.1016/j.cmet.2011.03.004
65. Rah SY, Kim UH. CD38-mediated Ca(2+) signaling contributes to glucagon-induced hepatic gluconeogenesis. Sci Rep (2015) 5:10741. doi: 10.1038/srep10741
66. Abu-Odeh M, Zhang Y, Reilly SM, Ebadat N, Keinan O, Valentine JM, et al. FGF21 promotes thermogenic gene expression as an autocrine factor in adipocytes. Cell Rep (2021) 35:109331. doi: 10.1016/j.celrep.2021.109331
67. Togashi K, Hara Y, Tominaga T, Higashi T, Konishi Y, Mori Y, et al. TRPM2 activation by cyclic ADP-ribose at body temperature is involved in insulin secretion. EMBO J (2006) 25:1804–15. doi: 10.1038/sj.emboj.7601083
68. Yosida M, Dezaki K, Uchida K, Kodera S, Lam NV, Ito K, et al. Involvement of cAMP/EPAC/TRPM2 activation in glucose- and incretin-induced insulin secretion. Diabetes (2014) 63(10):3394–403. doi: 10.2337/db13-1868
69. Chouchani ET, Kazak L, Spiegelman BM. Mitochondrial reactive oxygen species and adipose tissue thermogenesis: Bridging physiology and mechanisms. J Biol Chem (2017) 292:16810–6. doi: 10.1074/jbc.R117.789628
70. Hirschler-Laszkiewicz I, Chen SJ, Bao L, Wang J, Zhang XQ, Shanmughapriya S, et al. The human ion channel TRPM2 modulates neuroblastoma cell survival and mitochondrial function through Pyk2, CREB, and MCU activation. Am J Physiol Cell Physiol (2018) 315:C571–86. doi: 10.1152/ajpcell.00098.2018
71. Ru X, Zheng C, Zhao Q, Lan HY, Huang Y, Wan S, et al. Transient receptor potential channel M2 contributes to neointimal hyperplasia in vascular walls. Biochim Biophys Acta (2015) 1852:1360–71. doi: 10.1016/j.bbadis.2015.03.014
72. Almasi S, Sterea AM, Fernando W, Clements DR, Marcato P, Hoskin DW, et al. TRPM2 ion channel promotes gastric cancer migration, invasion and tumor growth through the AKT signaling pathway. Sci Rep (2019) 9:4182. doi: 10.1038/s41598-019-40330-1
73. Song K, Wang H, Kamm GB, Pohle J, Reis FC, Heppenstall P, et al. The TRPM2 channel is a hypothalamic heat sensor that limits fever and can drive hypothermia. Science (2016) 353:1393–8. doi: 10.1126/science.aaf7537
74. Kamm GB, Boffi JC, Zuza K, Nencini S, Campos J, Schrenk-Siemens K, et al. A synaptic temperature sensor for body cooling. Neuron (2021) 109:3283.e11–3297.e11. doi: 10.1016/j.neuron.2021.10.001
Keywords: TRPM2, ADPr, white adipose tissue, brown adipose tissue, thermogenesis, cold exposure, browning
Citation: Benzi A, Heine M, Spinelli S, Salis A, Worthmann A, Diercks B, Astigiano C, Pérez Mato R, Memushaj A, Sturla L, Vellone V, Damonte G, Jaeckstein MY, Koch-Nolte F, Mittrücker H-W, Guse AH, De Flora A, Heeren J and Bruzzone S (2024) The TRPM2 ion channel regulates metabolic and thermogenic adaptations in adipose tissue of cold-exposed mice. Front. Endocrinol. 14:1251351. doi: 10.3389/fendo.2023.1251351
Received: 01 July 2023; Accepted: 16 November 2023;
Published: 06 February 2024.
Edited by:
Endre Károly Kristóf, University of Debrecen, HungaryReviewed by:
Martina Schweiger, University of Graz, AustriaKazuki Harada, The University of Tokyo, Japan
Copyright © 2024 Benzi, Heine, Spinelli, Salis, Worthmann, Diercks, Astigiano, Pérez Mato, Memushaj, Sturla, Vellone, Damonte, Jaeckstein, Koch-Nolte, Mittrücker, Guse, De Flora, Heeren and Bruzzone. This is an open-access article distributed under the terms of the Creative Commons Attribution License (CC BY). The use, distribution or reproduction in other forums is permitted, provided the original author(s) and the copyright owner(s) are credited and that the original publication in this journal is cited, in accordance with accepted academic practice. No use, distribution or reproduction is permitted which does not comply with these terms.
*Correspondence: Andrea Benzi, YW5kcmVhLmJlbnppQGVkdS51bmlnZS5pdA==
†These authors have contributed equally to this work