 Xiaoyin Huang1†
 Yuchen Zeng2†
 Mingyang Ma1†Liangguang Xiang3Qingdan Liu1Ling Xiao1
 Ruimei Feng4Wanxin Li1Xiaoling Zhang2Moufeng Lin5
 Zhijian Hu1
 Hongwei Zhao6
 Shanshan Du1*
 Weimin Ye1,7*
- 1Department of Epidemiology and Health Statistics, School of Public Health, Fujian Medical University, Fuzhou, China
- 2Department of Ultrasonography, The Affiliated Fuqing Hospital of Fujian Medical University, Fuqing, China
- 3Department of General Surgery, The Affiliated Fuqing Hospital of Fujian Medical University, Fuqing, China
- 4Department of Epidemiology, School of Public Health, Shanxi Medical University, Taiyuan, China
- 5Department of Public Health, The Fifth Hospital of Fuqing City, Fuqing, China
- 6Department of Epidemiology and Biostatistics, School of Public Health, Texas A&M University, College Station, TX, United States
- 7Department of Medical Epidemiology and Biostatistics, Karolinska Institutet, Stockholm, Sweden
Background: It is currently unclear whether and how the association between body composition and hypertension varies based on the presence and severity of fatty liver disease (FLD).
Methods: FLD was diagnosed using ultrasonography among 6,358 participants. The association between body composition and hypertension was analyzed separately in the whole population, as well as in subgroups of non-FLD, mild FLD, and moderate/severe FLD populations, respectively. The mediation effect of FLD in their association was explored.
Results: Fat-related anthropometric measurements and lipid metabolism indicators were positively associated with hypertension in both the whole population and the non-FLD subgroup. The strength of this association was slightly reduced in the mild FLD subgroup. Notably, only waist-to-hip ratio and waist-to-height ratio showed significant associations with hypertension in the moderate/severe FLD subgroup. Furthermore, FLD accounted for 17.26% to 38.90% of the association between multiple body composition indicators and the risk of hypertension.
Conclusions: The association between body composition and hypertension becomes gradually weaker as FLD becomes more severe. FLD plays a significant mediating role in their association.
Introduction
Body mass index (BMI), Quetelet’s normalization of body weight (kg) by height squared (m2), a traditional diagnosis and understanding of the pathophysiology of obesity, is still widely applied today in quantitative studies on the effects of body mass on health (1, 2). However, with the prevailing notions of obese phenotypes, such as normal-weight obese, metabolically obese with normal weight, metabolically healthy obese, and metabolically unhealthy obese, BMI shows apparent limitations in our comprehensive understanding of obesity-associated metabolic disturbances (3–5). Body composition, the quantitative and qualitative analysis of lean and adipose tissue compartments, has been suggested to provide insight into both nutritional status and functional capacity of the whole body (1, 6, 7).
With the increasing body weight and aging worldwide, a great variation can be observed in body composition. More and more attention has been paid to its association with multiple metabolic disorders (8). A more precise assessment of body mass is essential for the more effective management of the obesity epidemic. Currently, BMI and body fat have been evidenced to be independent risk factors for hypertension, and a few studies have also reported positive associations between body fat, central obesity (9, 10), skeletal muscle, and hypertension (11, 12). However, the systemic description of body composition on hypertension risk is limited, and the characteristic body composition indicators in hypertension risk are still ambiguous, especially in Asia, where the population has a lower BMI (13) but shows a comparable or higher risk of multiple metabolic diseases compared with European and American populations (14, 15).
In addition, obesity is also a confirmed risk factor of fatty liver disease (FLD) (16), and FLD has been reported to be an independent risk factor and an important driving force in the development and progression of hypertension (17). On the other hand, previous studies have reported different risks of cardiovascular diseases in normal-weight and overweight/obese non-FLD and FLD patients (18–20). Yet, it needs further exploration to clarify whether FLD affects the association between body composition characteristics and hypertension.
Therefore, we conducted a cross-sectional study among the general population in southeast China and aimed to explore the characteristic body composition profile of hypertensive patients and further investigate whether and how the association between body composition and hypertension varied with the presence and severity of FLD, trying to provide clues on the clinical application of body composition.
Materials and methods
Study design and population
The Fuqing Cohort Study is an ongoing, prospective population-based cohort study in Fuqing City, Fujian Province, located in a coastal area of southeast China. Local residents aged 35–75 years were recruited. The first wave of the cohort baseline enrolment was conducted in 2019. The second wave with more comprehensive data collection was initiated in July 2020 and will continue until 50,000 residents are recruited. In the current study, we included all participants (n = 7,662) from Gaoshan Town of Fuqing City from July 2020 to June 2021 in the baseline survey of the Fuqing Cohort Study. The study has been approved by the Ethics Review Committee of Fujian Medical University (approval numbers [2017-07] and [2020-58]), and the study protocol conforms to the ethical guidelines of the 1975 Declaration of Helsinki. Written informed consent was obtained from all participants.
Abdominal ultrasonography was conducted among all participants since the second wave. After excluding participants with missing data on abdominal ultrasonography, anthropometric measurement, blood metabolism indicators, demographic information, lifestyle variables, and outliers, we included 6,358 participants in the second wave of the Fuqing cohort eventually (Figure 1).
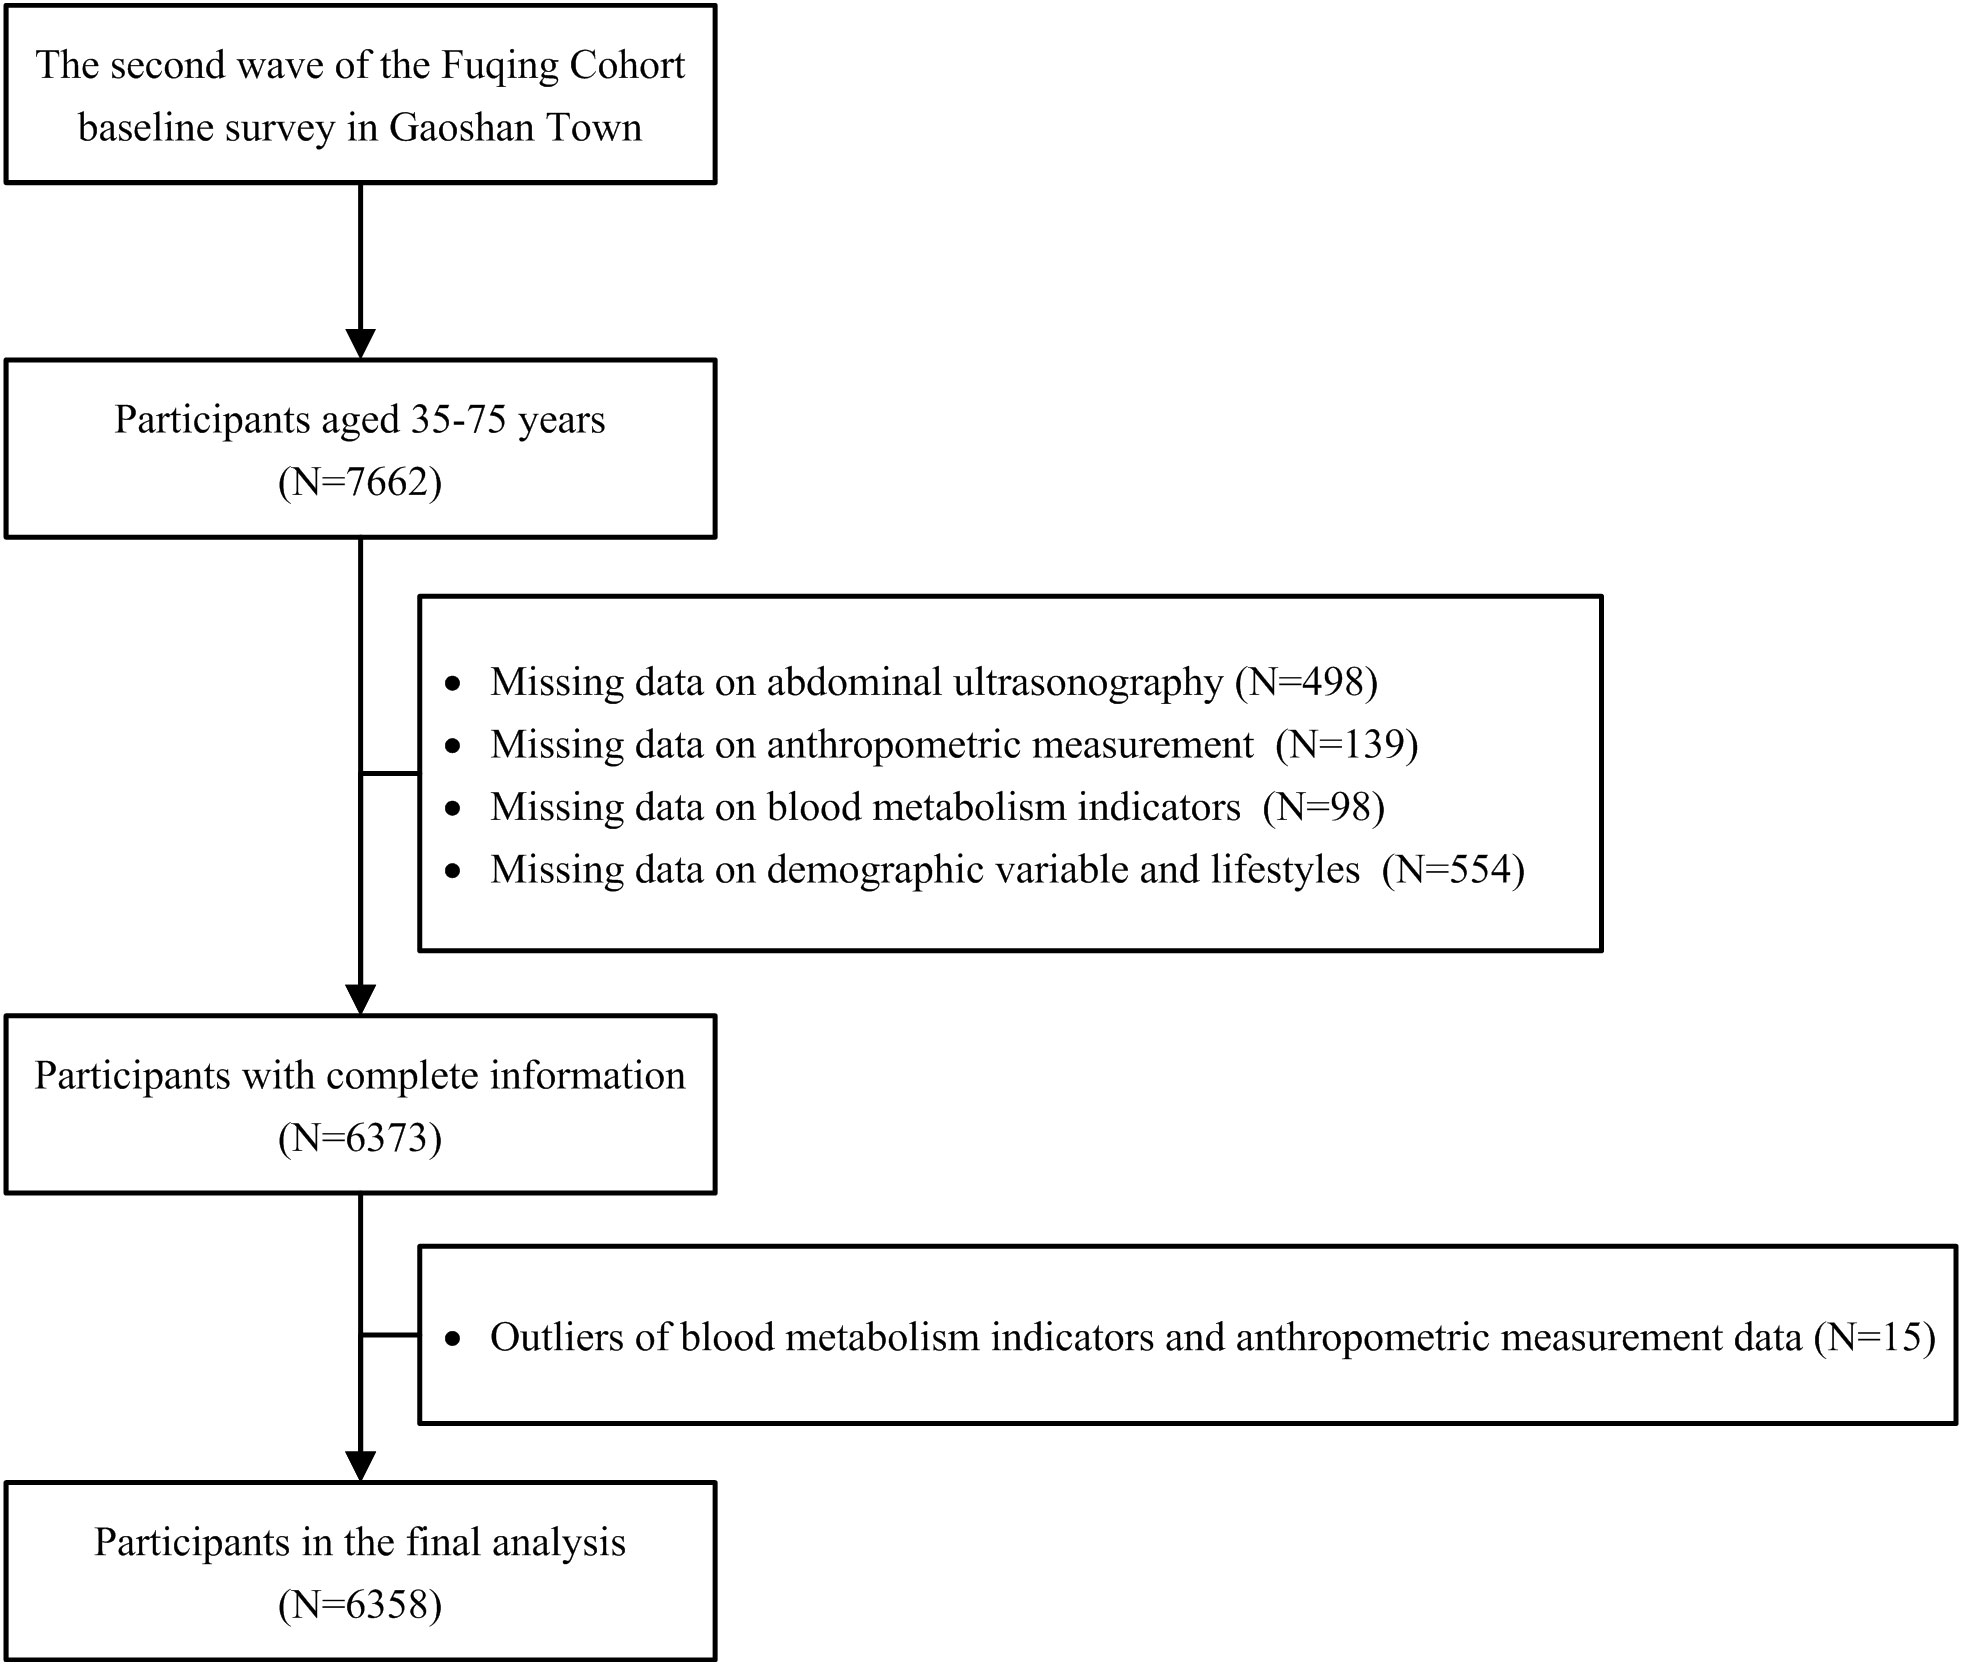
Figure 1 Flowchart of the selection of study participants.
Data collection
Each participant was invited to finish a face-to-face interview by trained and qualified interviewers using a computerized, structured questionnaire (https://cohort.fjmu.edu.cn/), and data on demographic and social–economical characteristics, history of disease and medication, and lifestyle information (tobacco use, alcohol drinking, and physical activity) were collected. Tobacco use was defined as smoking at least one cigarette per day for at least 6 months, and alcohol drinking was defined as at least once per week in the past year. The International Physical Activity Questionnaire-short form (IPAQ-SF) was applied, and physical metabolic equivalent (MET/day) was calculated according to the IPAQ scoring protocol to estimate total physical activity (21).
Venous blood samples were obtained from all participants after at least 8h of fasting, and serum was separated and used to determine the levels of fasting blood glucose (FBG), triglyceride (TG), total cholesterol (TC), high-density lipoprotein cholesterol (HDL-c), and low-density lipoprotein cholesterol (LDL-c), using standard laboratory procedures (Toshiba automatic biochemical analyzer, TBA-120FR, Japan). Fasting insulin level (FINS) was measured by electrochemiluminescence immunoassay (Roche Diagnostics, Cobas e 602, Germany).
Anthropometric measurements
All measurements were conducted by trained staff according to standard protocol, and all participants were asked to wear light clothing and stand upright barefoot. Height, waist, and hip circumferences (WC and HC) were measured using a standard stadiometer and a tape meter (0.1 cm precision). WC was taken at the midway between the lowest rib and the top of the iliac crest, and HC was taken at the largest circumference of the buttocks. Body weight and composition metrics, including body fat percentage (BFR), body moisture rate (BMR), skeletal muscle (SM), and bone weight, were measured by a digital scale (0.1 kg precision, Tanita bioimpedance analyzer, BC-601, Japan), which utilizes bioelectrical impedance technology. BMI was defined as the body weight in kilograms divided by the square of the body height in meters. The waist-to-hip ratio (WHR) was calculated by dividing the WC by HC, and the waist-to-height ratio (WHtR) was determined by dividing the WC by height. Fat tissue index (FTI) (22), visceral adiposity index (VAI) (23), lipid accumulation product (LAP) (24), cardiometabolic index (CMI) (25), and lean tissue index (LTI) (22) were calculated according to reported equations.
Systolic blood pressure (SBP) and diastolic blood pressure (DBP) were measured with an electronic sphygmomanometer (Omron Company, OMRON U30, Kyoto, Japan) on the right arm in a semi-flexed position at the heart level after 5 min of seated rest. Two measurements were recorded, and the third is recorded if the difference between the two measurements is higher than 5 mmHg. The average of the two closet readings was calculated for analysis.
Disease definitions
According to BMI criteria proposed for the Chinese population, under and normal weight (<24.0 kg/m2), overweight (24.0 to <28.0 kg/m2), and obesity (≥28.0 kg/m2) were defined.
Hypertension was defined as SBP ≥140 mmHg, DBP ≥90 mmHg, self-reported hypertension, or under antihypertensive treatment.
Ultrasonography was performed on all participants by experienced sonographers who were unaware of the clinical or laboratory data of the participants using ultrasound scanners (Hitachi Aloka Medical, ProSounda α7, Japan). FLD was diagnosed according to the standard criteria issued by the Fatty Liver Disease Study Group of the Chinese Liver Disease Association (26, 27).
Statistical analysis
Continuous variables are shown as mean ± standard deviation (SD). Categorical variables are shown as percentages, and the chi-squared test was used to compare the differences between groups. Logistic regression models were constructed in several steps, and odds ratios (ORs) and 95% confidence intervals (CIs) were estimated. First, a crude model was built between body composition indicators, FLD, and hypertension, respectively. Then, age and sex were adjusted in the model. Third, BMI, current alcohol drinking, current smoking, and physical activity were further adjusted.
Stratified analyses were conducted to explore potential age- and sex-related interaction effects. Stratified analyses were also applied to explore the potential effects of body composition indicators on hypertension risk by the presence and severity of FLD. First, all participants were grouped into non-FLD, mild FLD, and moderate/severe FLD groups, and multivariable-adjusted logistic regression models were constructed between body composition and hypertension. To fit trends between each indicator and the corrected risk of hypertension in each group, the multivariable-adjusted logistic regression models were constructed between body composition and hypertension with interactions. The predicted hypertension risks versus each body composition indicator were calculated after all confounding factors were fixed at their reference levels.
Then, all participants were regrouped according to the recommended cutoff or tertiles of body composition indicators to explore the association between FLD and hypertension in the context of levels of body composition indicators. Logistic regression models were constructed between FLD and hypertension.
We examined potential multiplicative interactions between FLD and body composition indicators. The presence of multiplicative interaction was explored by introducing a cross-product term in the regression model and the P-value was derived by the Wald test.
To explore the potential mediating effect of FLD on the relationship between each body composition indicator and hypertension, we performed a mediation analysis using the counterfactual framework method. The PARAMED module in Stata was used to estimate the total associations and natural direct and indirect associations. The proportion mediated was calculated log(natural indirect effect) /log(total effect). To fit the module, the FLD level was further classified as having FLD or not.
Previous studies have suggested that FLD is associated with cholecystectomy, and patients who underwent cholecystectomy were more than twice as likely to have fatty liver disease than those who had not undergone cholecystectomy (28). Therefore, we explored the association between cholecystectomy and FLD as well as hypertension and performed a sensitivity analysis by excluding participants who underwent cholecystectomy.
All analyses were performed with SAS 9.4 statistical software (SAS Institute Inc., Cary, NC, USA) and Stata/SE, version 16.0 statistical software (only for mediation analysis, StataCorp, TX, USA), and a two-tailed P <0.05 was considered statistically significant.
Results
Clinicodemographic characteristics of participants
A total of 6,358 individuals were enrolled in this analysis. The prevalence of hypertension was 46.7%, and the prevalence of mild FLD and moderate/severe FLD was 25.2% and 10.2%, respectively.
The clinicodemographic characteristics of the participants are presented in Table 1. The prevalence of hypertension in men was 50.8%, significantly higher than 44.4% in women. Compared with the normotensive, the characteristics of the hypertensive population included older age; higher BMI; lower education level; more alcohol drinker; higher central obesity and FLD severity; higher TC, TG, and LDL-c; and lower HDL-c.
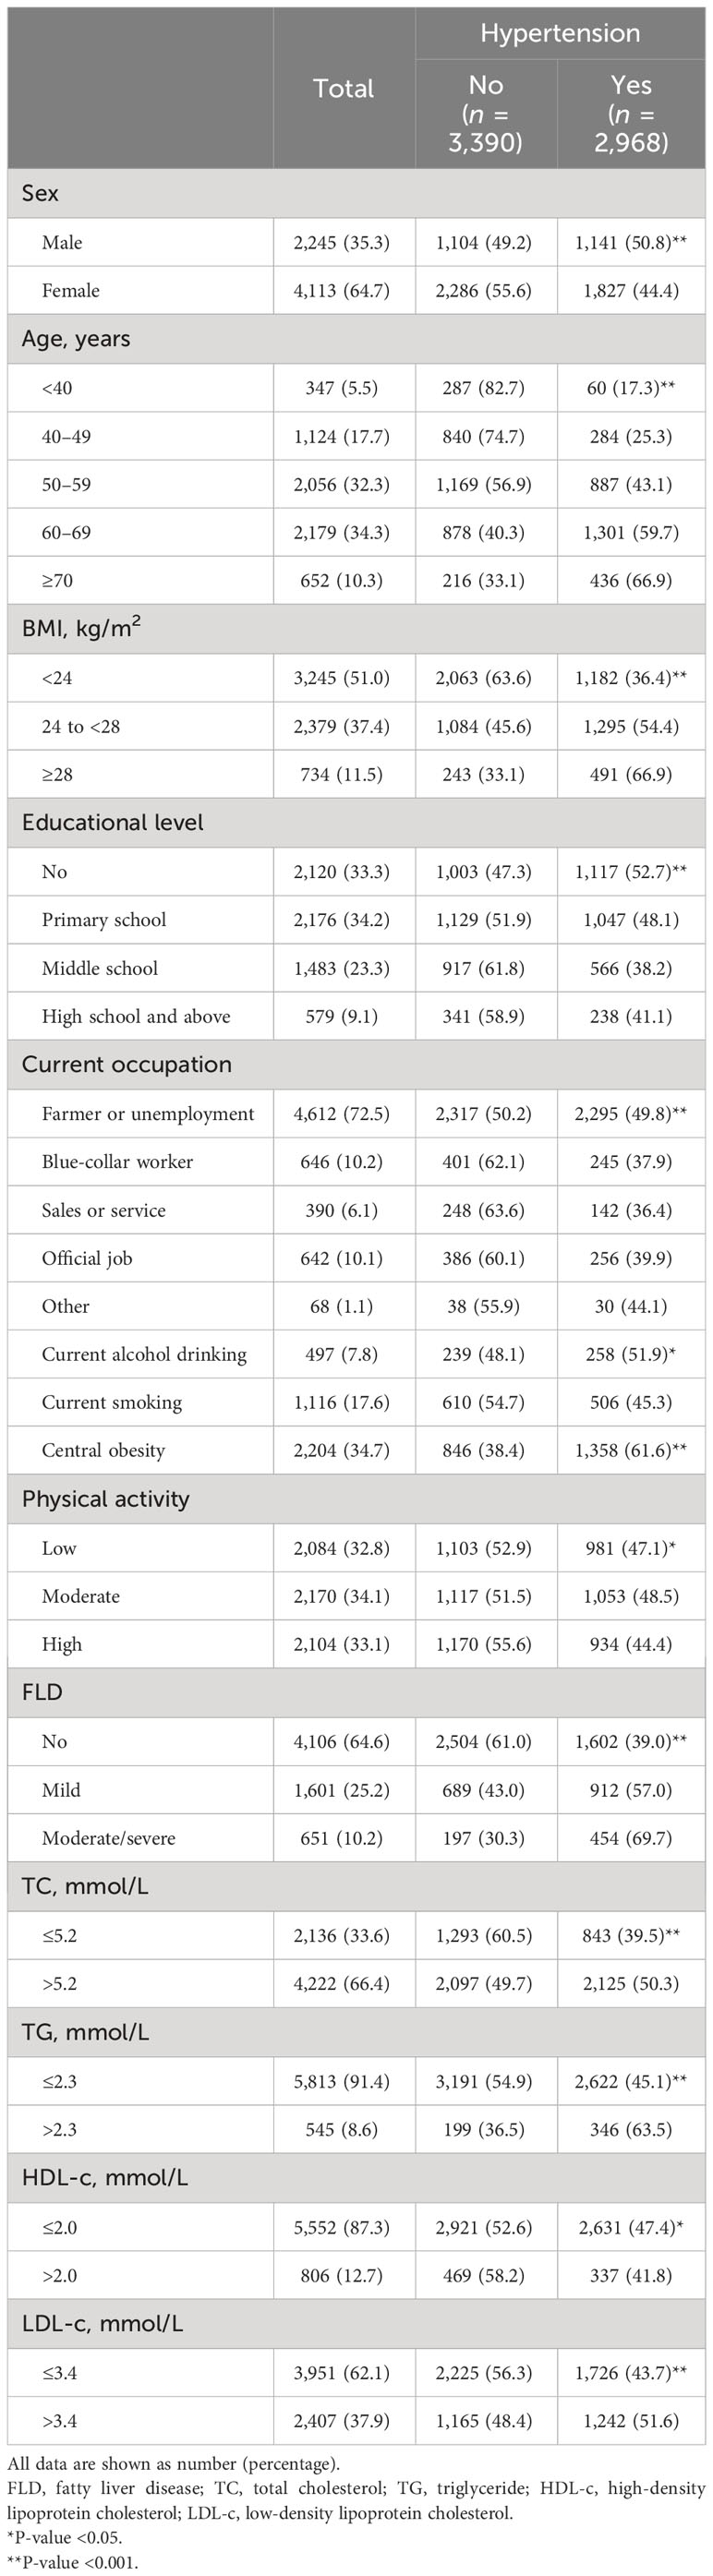
Table 1 The clinicodemographic characteristics of the population based on the presence of hypertension.
Association of hypertension with body composition
Table 2 shows the associations between body composition and hypertension. The hypertensive population had significantly higher levels of BMI, WHR, WHtR, BFR, TC, TG, LDL-c, FTI, VAI, LAP, CMI, SM, LTI, bone weight, FBG, and FINS, but lower HDL-c and BMR than the normotensive. Then, the associations between various body compositions and hypertension were analyzed by univariable and multivariable logistic regression models. After adjustment for the potential confounding factors, including age, sex, current alcohol drinking, current smoking, and physical activity, indicators of fat-related anthropometric measurements (BMI, WHR, WHtR, and BFR), lipid metabolism (TC, TG, LDL-c, FTI, VAI, LAP, and CMI), and glucose metabolism (FBG and FINS) were positively associated with hypertension risk, while BMR was inversely associated. No significant association was observed for HDL-c, SM, LTI, and bone weight.
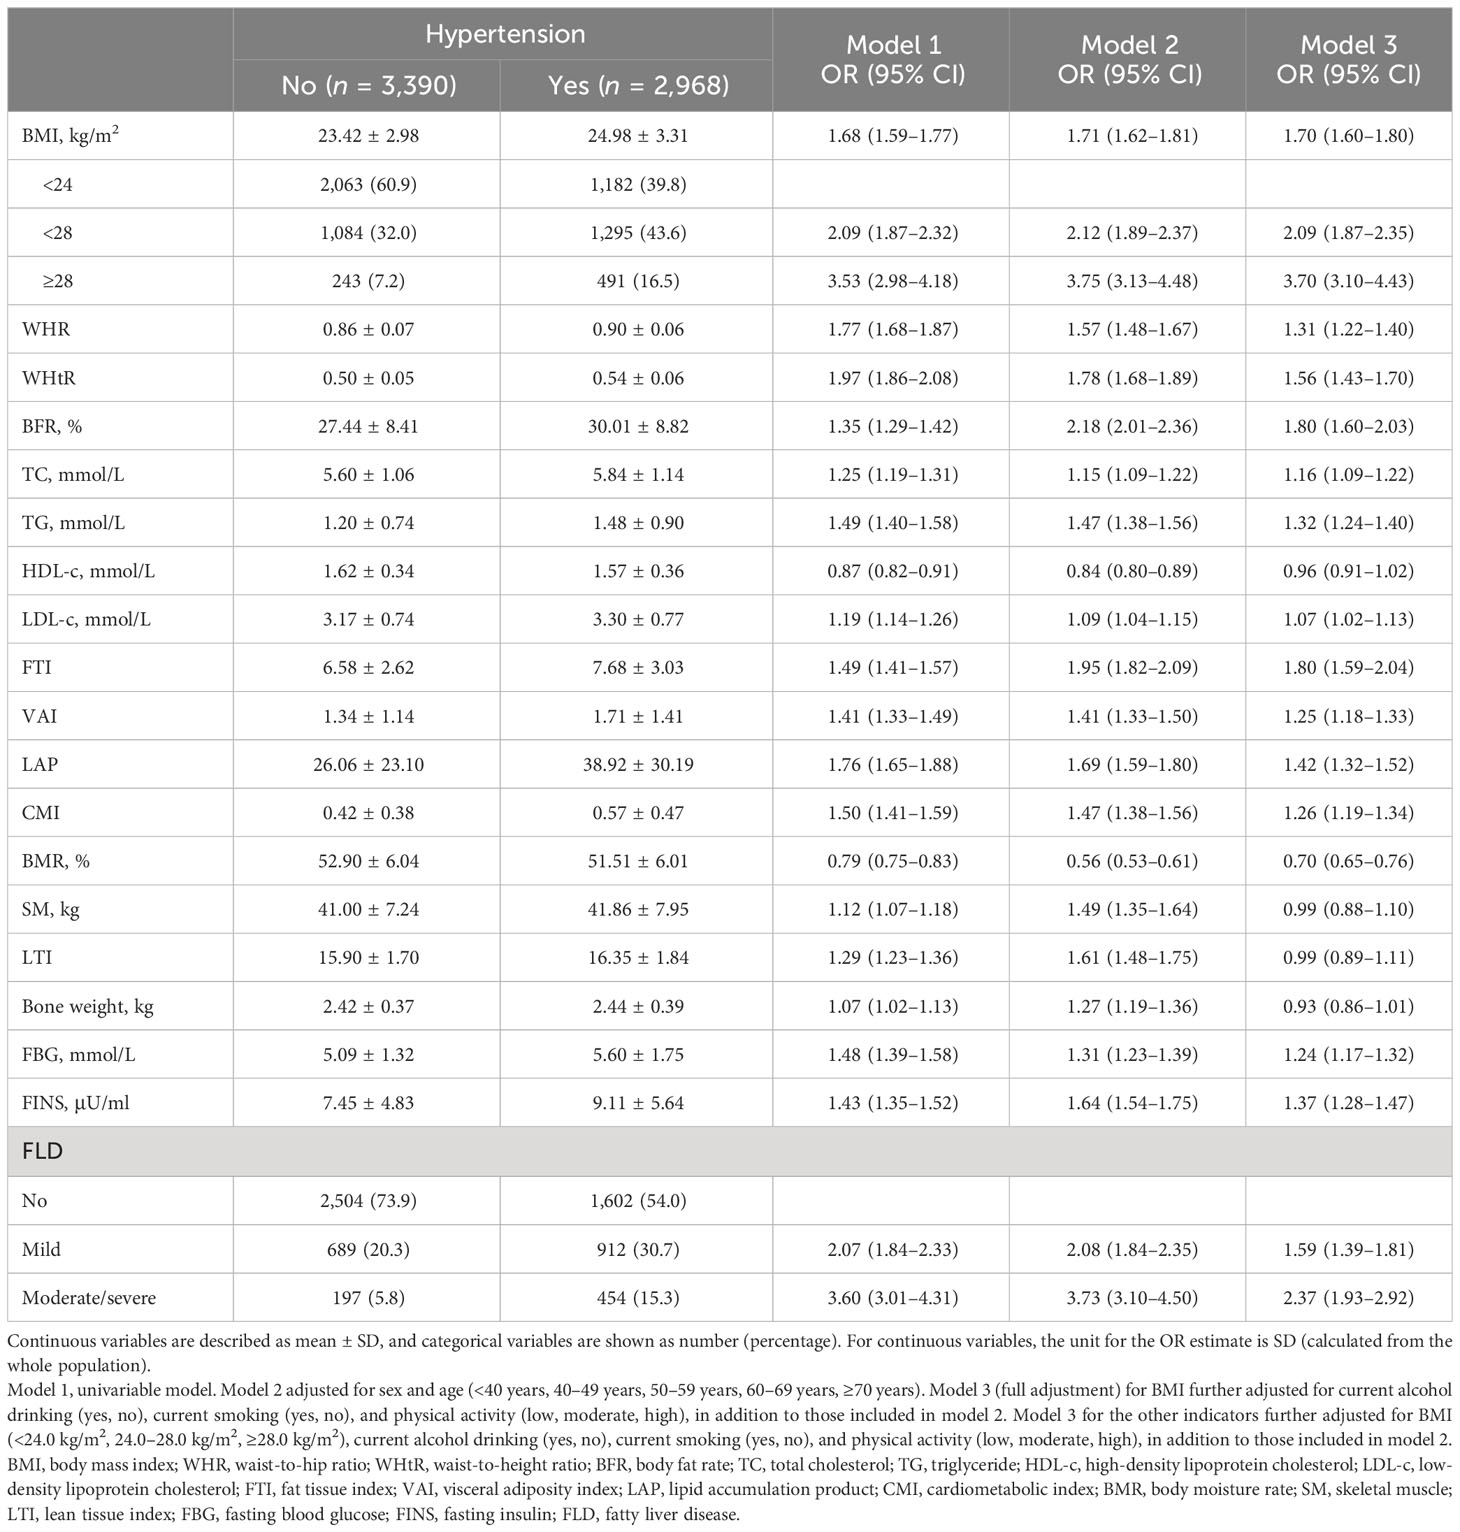
Table 2 The association between physical examination indicators, biochemical markers, and hypertension.
Association of hypertension with body composition by the phenotypes of FLD
In the multivariable logistic regression analysis, the ORs (95% CI) of the mild FLD and moderate/severe FLD groups with hypertension were 1.59 (1.39–1.81) and 2.37 (1.93–2.92), when compared with the non-FLD group, after adjusting age, sex, BMI, current alcohol drinking, current smoking, and physical activity (Table 2).
Then, we stratified all participants into non-FLD, mild FLD, and moderate/severe FLD populations and analyzed the association between body composition and hypertension in multivariable adjusted logistic regression models in each stratum (Table 3). In the non-FLD population, the ORs of anthropometric indicators (BMI, WHR, WHtR, and BFR) with hypertension were 1.56 (1.44–1.70), 1.21 (1.11–1.32), 1.45 (1.30–1.61), and 1.57 (1.36–1.81), respectively. The increase of lipid metabolism-related indicators (TC, TG, LDL-c, FTI, VAI, LAP, and CMI) was related to higher risks of hypertension with ORs ranging from 1.09 to 1.68, while BMR was associated with a decreased risk of hypertension (OR: 0.77, 95% CI: 0.70–0.85). For indicators related to glucose metabolism, both FBG and FINS levels were significantly and positively associated with the risk of hypertension, with ORs of 1.21 (1.10–1.33) and 1.30 (1.17–1.45), respectively.
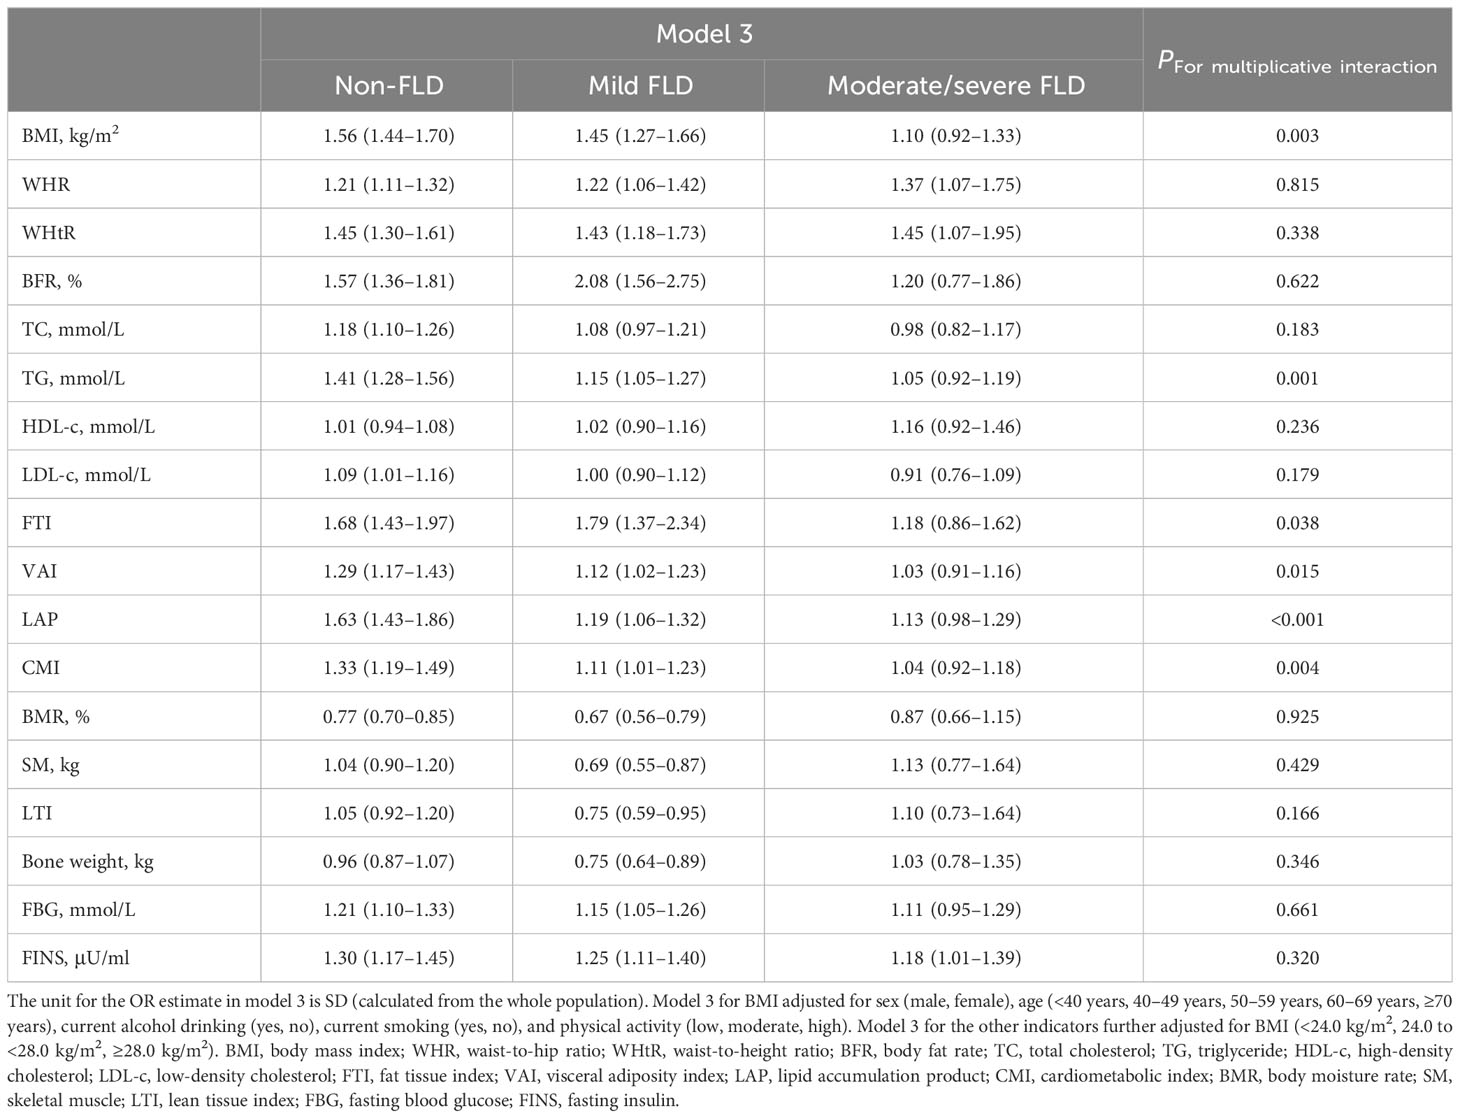
Table 3 Association between physical examination indicators, biochemical markers, and hypertension stratified by FLD grade.
In the mild FLD population, the significant ORs of WHR and WHtR for hypertension were similar to those of the non-FLD population, whereas the ORs of BMI, BFR, TG, FTI, VAI, LAP, CMI, FBG, and FINS were also significant, but the strengths of associations showed a certain decrease in seven of the nine indicators. In contrast to the non-FLD, the OR of TC was non-significant, while the ORs of BMR, SM, LTI, and bone weight were all statistically, significantly lower than 1.00. Only the ORs of WHR, WHtR, and FINS were still significant and similar to those in non-FLD and mild FLD in the moderate/severe FLD population. The ORs of BMI and all the other indicators in the body composition profile lost statistical significance (95% CIs included 1.00) (Table 3).
The interaction between sex, age, FLD, and body composition to hypertension risk
To investigate the combined effects of physical examination indicators, biochemical markers, and sex on hypertension risk, we applied multiplicative interaction analysis, and the results showed statistically significant multiplicative interactions between sex and BMI, BFR, SM, or bone weight (Table S2). The results of the interaction analysis between body composition and age to hypertension risk showed that WHR, BFR, TC, LDL-c, FTI, VAI, BMR, SM, LTI, and FINS all interacted significantly with age (Table S3).
Moreover, Table 3 shows that the antagonistic multiplicative interactions between FLD and BMI, TG, FTI, VAI, LAP, or CMI were statistically significant.
The trends in various body composition and hypertension risk in different FLD populations
To assess the adjusted trends in body composition and hypertension risk in different FLD populations, we calculated the predicted risks based on the multivariable adjusted logistic regression models. For the indicators significantly interacting with FLD, the associations between hypertension risk and various body composition indicators are plotted in Figure 2, and the trends for the other indicators are shown in Figure S1. For BMI, the predicted probability of hypertension increased sharply with greater BMI in the non-FLD population, increased less sharply in the mild FLD, but increased slightly in the moderate/severe FLD (Figure 2A). The trends for TG, FTI, VAI, LAP, and CMI (Figures 2B–F) varied among the different FLD populations. When these indicators were at low levels, participants with more severe FLD had a higher risk of hypertension. The risk of hypertension increased with these indicators, while the risk increased faster in the non-FLD population than in those with mild and moderate/severe FLD, and eventually, the risk of hypertension in the non-FLD population would even exceed that of those with moderate/severe FLD (Figures 2B–F). The trends for WHR, WHtR, and BFR in the non-FLD, mild FLD, and moderate/severe FLD populations were similar. They were positively associated with the predicted probability of hypertension, and the strengths of their associations were similar across the three populations (Figures S1A–C). The trend of hypertension risk with HDL-c varied in different populations. At the same HDL-c level, the risk of hypertension was consistently lower in the non-FLD group than in the mild FLD group. The risk was increasing in the moderate/severe FLD group, but there was little change or even a slight decrease in the risk in the mild FLD and non-FLD groups (Figure S1E). The predicted probability of hypertension decreased with higher BMR, SM, LTI, and bone weight (Figures S1G–J). The decrease was steepest in the non-FLD group, followed by the mild and moderate/severe FLD groups. The trends in hypertension risk for FBG and FINS varied across FLD populations, with a bit sharper increase in hypertension risk in the non-FLD population (Figures S1K, L).
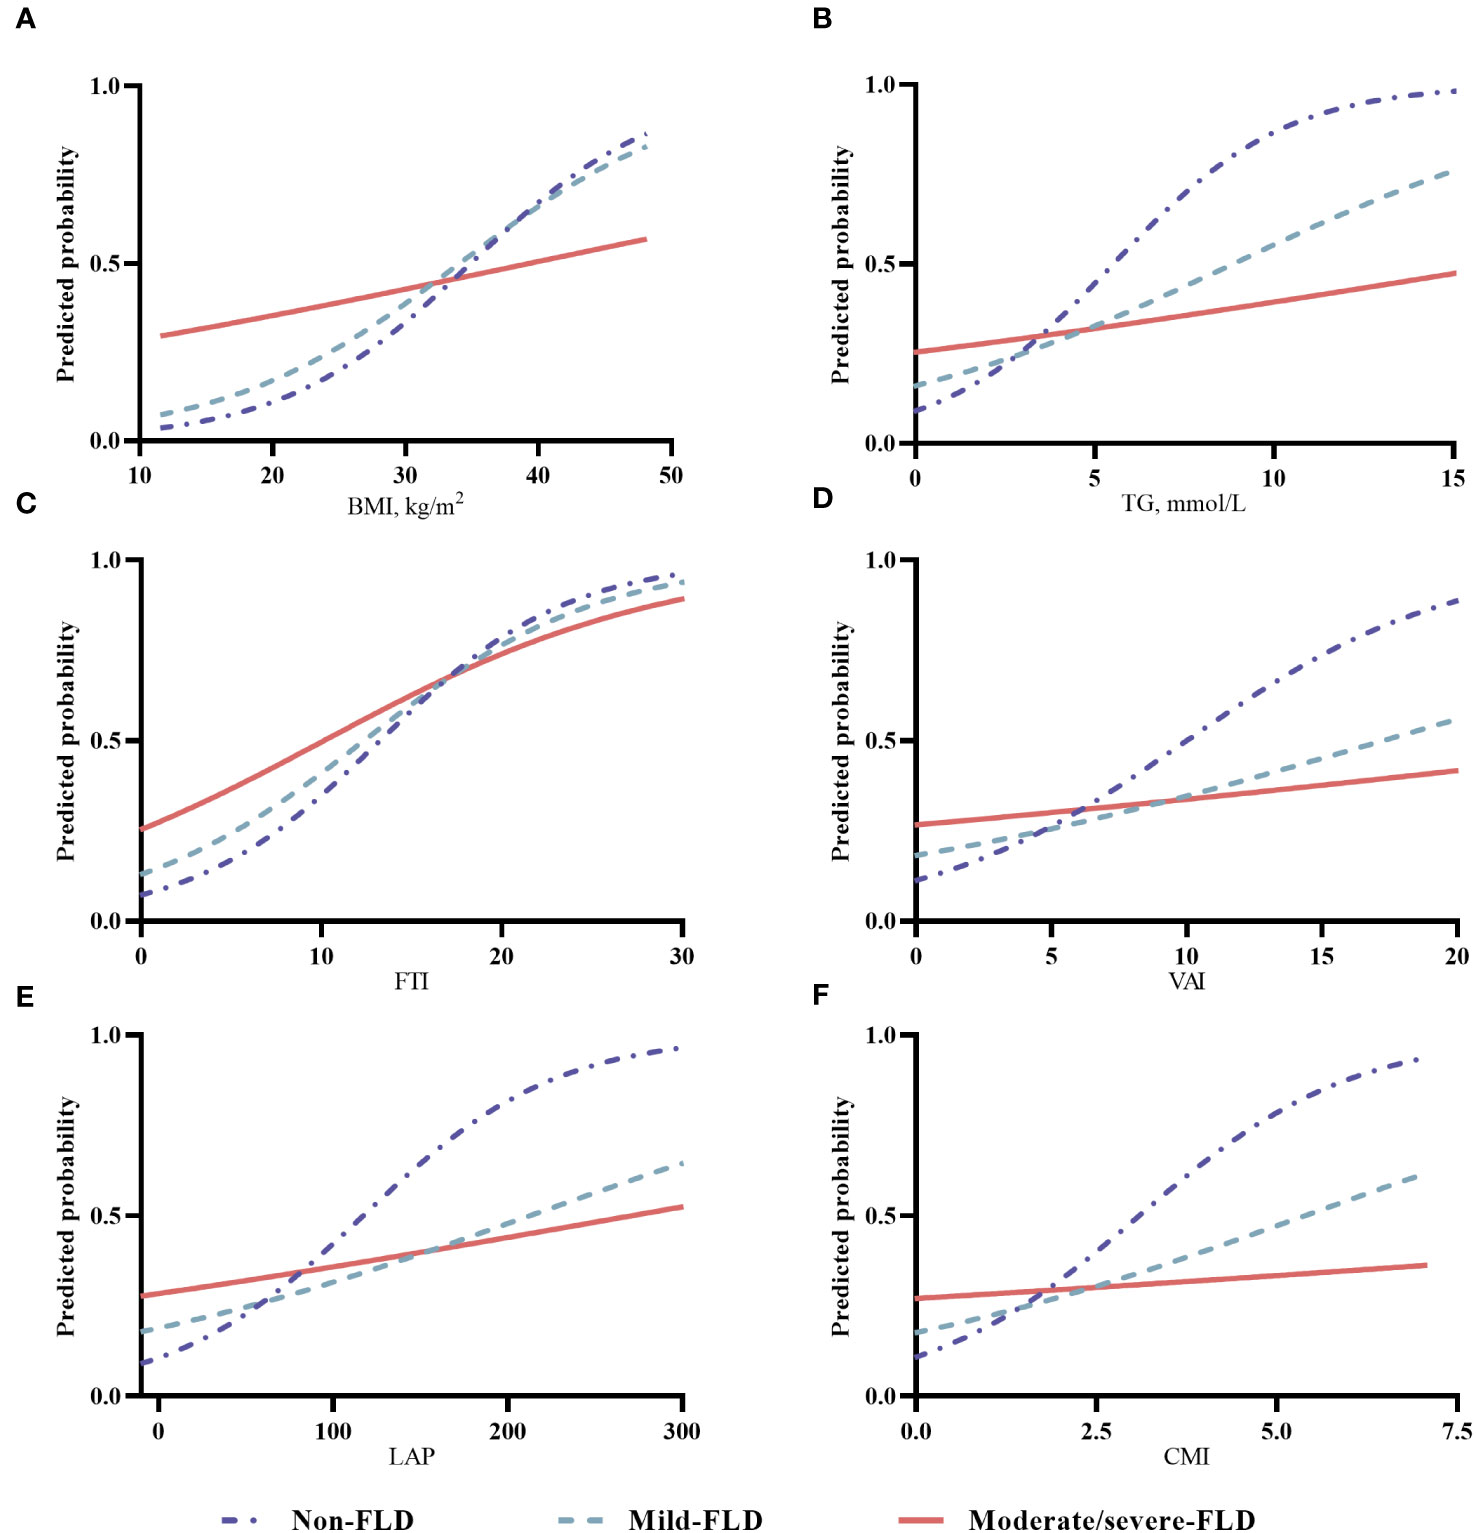
Figure 2 The trends in various body composition and hypertension risk in different FLD populations. (A) for BMI, body mass index; (B) for TG, triglyceride; (C) for FTI, fat tissue index; (D) for VAI, visceral adiposity index; (E) for LAP, lipid accumulation product; (F) for CMI, cardiometabolic index; (Notes: For BMI, the predicted probability of hypertension was adjusted for sex (male, female), age (<40, 40-49, 50-59, 60-69, ≥70 years), current alcohol drinking (yes, no), current smoking (yes, no), and physical activity (low, moderate, high). For other indicators, the predicted probability of hypertension was further adjusted for BMI (<24.0 kg/m2, 24.0-<28.0 kg/m2, ≥28.0 kg/m2).
Association of hypertension with FLD stratified by body composition indicators
Stratified analyses were performed to determine the effect of each body composition indicator on the relationship between FLD and hypertension. The ORs of moderate/severe FLD for hypertension in the lowest tertile of BMI, WHR, WHtR, LAP, CMI, and LTI were all higher than the ORs in their middle and highest tertiles. Moreover, the ORs of moderate/severe FLD for hypertension were higher in the highest tertile of BFR, FTI, FBG, and FINS than in their middle and lowest tertiles (Table S1).
The mediation effect of FLD in the association between body composition and hypertension
We performed a mediation analysis to evaluate the indirect effect of FLD in the association of each indicator of body composition with hypertension risk (Table 4). The indirect effect of FLD accounted for a non-negligible proportion (17.26%–38.90%) of the associations between the risk of hypertension and BMI, WHR, WHtR, BFR, TC, TG, LDL-c, FTI, VAI, LAP, CMI, BMR, FBG, and FINS.
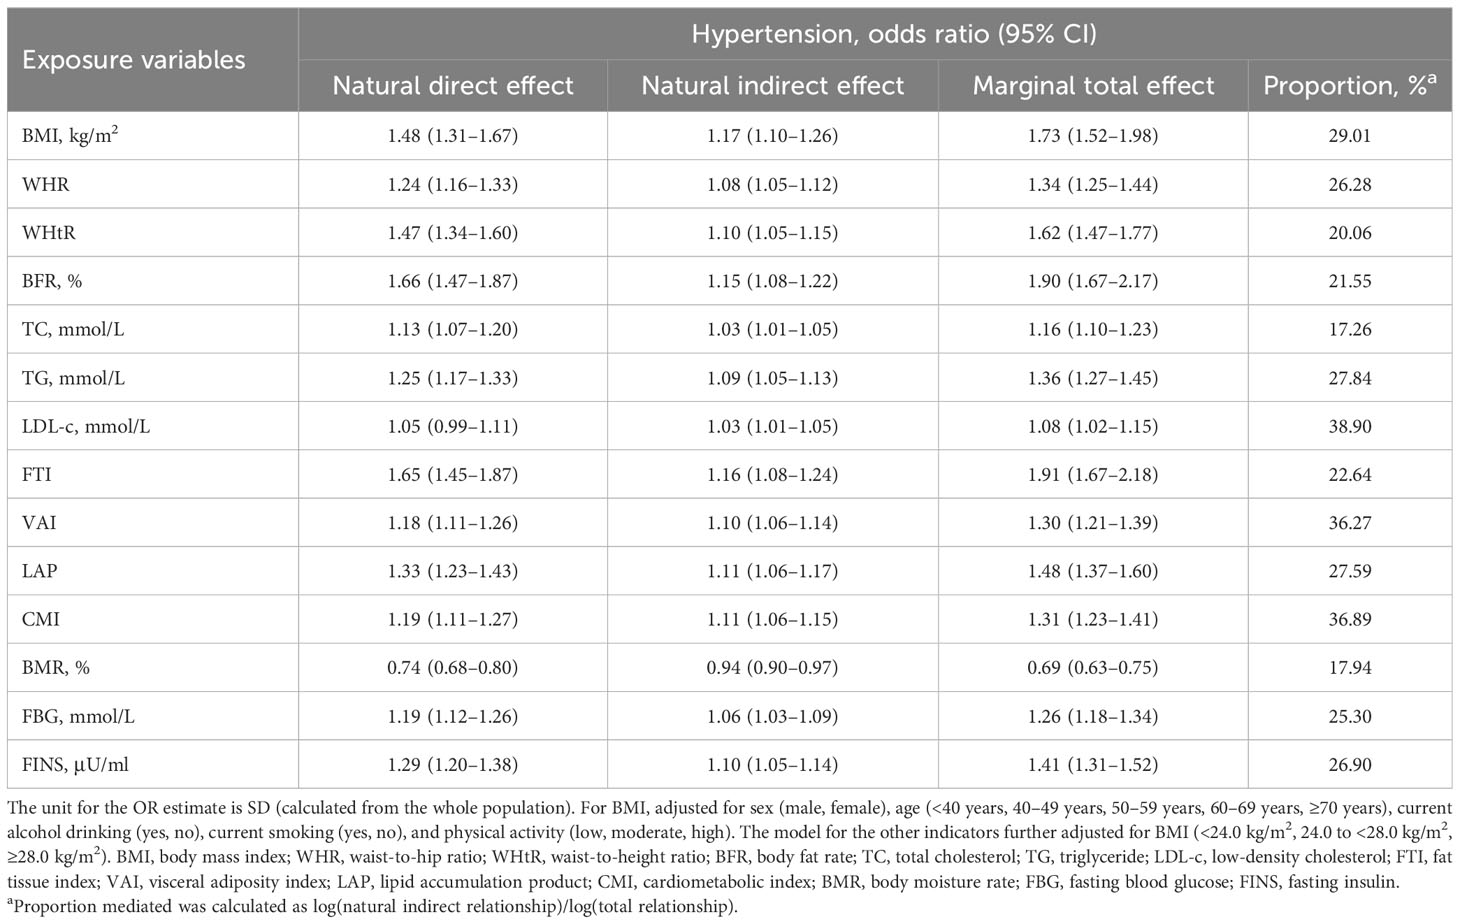
Table 4 Mediation analysis with FLD as a potential mediator between physical examination indicators, biochemical markers, and hypertension risk.
Sensitivity analysis
A total of 31 individuals in the population included in this study underwent cholecystectomy. The results in Table S2 indicate that there was no significant association between a history of cholecystectomy and FLD or hypertension. In addition, to minimize the influence of cholecystectomy history on the results, we performed a sensitivity analysis after excluding patients who underwent cholecystectomy. The results of the sensitivity analysis were highly consistent with those reported above (data not shown).
Discussion
In the current study, we found that the body composition profile of the hypertensive population was different from that of the normotensive population. Among them, WHR, WHtR, BFR, FTI, VAI, LAP, CMI, FBG, and FINS were positively associated with hypertension risk, while BMR was inversely associated with the risk. The strength of the associations between body composition indicators and hypertension gradually decreased with the presence and severity of FLD, which was an independent risk factor for hypertension. FLD was an important mediator in the association between body composition profile and hypertension.
In general, BFR and WHR were the most commonly used indicators when assessing body composition and fat distribution (1). A cohort study indicated that the increase of fat mass, WC, and WHR predicted a higher hypertension risk, while maintenance of fat mass showed a lower risk. Moreover, hypertensive patients at baseline whose BP decreased after 10 years of follow-up showed a profound decrease in fat mass, even an increase of relative fat-free mass (10). Recently, SM and fat-free mass have been proposed. Their inverse association with hypertension has been reported (11), and their loss could partly explain the aging-associated risk of cardiovascular diseases and mortality (29). Additionally, the underlying causal associations between glucose metabolism and the risk of hypertension have been uncovered by Mendelian randomization studies (30). However, previous studies often focused on a few indicators of body composition, and a more comprehensive examination is needed. In our current study, a full description of body composition was given, including basic anthropometric measurements, BFR, lipid metabolism-related indicators, BMR, SM, and glucose metabolism indicators. The hypertensive population had higher BMI, WHR, WHtR, BFR, lipid metabolism, and glucose metabolism but lower BMR than the normotensive, showing a significantly different body composition.
Furthermore, inflammation, insulin resistance, and renin–angiotensin system–sympathetic nervous system activation were all critical pathophysiological mechanisms in the association between obesity and hypertension (31). Similarly, they also exist in the risk of FLD for hypertension (32). It has been reported that approximately 50% of hypertensive patients had FLD, and FLD patients had a significantly higher prevalence of hypertension (33–35). Similarly, the strong association between the presence and severity of FLD with increased hypertension risk was also significant in the current study. However, how FLD acts in the association between body composition and hypertension has not been examined. Therefore, we stratified all participants according to FLD status and investigated the association between body composition and hypertension. In the non-FLD population, various body composition indicators were all strongly associated with hypertension risk. In contrast, SM, LTI, and bone weight all showed an inverse association with hypertension in the mild FLD population. Previous studies judged them as favorable body composition (2, 7), and they may contribute to lower all-cause mortality and better prognosis of CVDs (2, 7, 36, 37). Notably, too, among moderate/severe FLD patients, only WHR, WHtR, and FINS were still significantly associated with hypertension, while neither lipid metabolism, glucose, nor favorable body composition was significantly associated.
To further confirm the results, the predicted curves were plotted. For WHR and WHtR, the predicted probability of hypertension increased almost linearly with their levels, and the strengths of association in the non-FLD, mild FLD, and moderate/severe FLD groups were similar. Indicators on lipid metabolism and glucose metabolism were all positively associated with hypertension risk, across the non-FLD, mild FLD, and moderate/severe FLD groups, while BMR, SM, and bone weight were inversely associated. The changing trends of the association between these indicators and hypertension were different among the three groups. On the whole, the trend changed mostly in the non-FLD group, followed by the mild FLD and moderate/severe FLD groups. Synthesizing all the results from the logistic regression analyses, we conceived that the association between whole body composition profile and hypertension varied largely with the phenotypes of FLD. We inferred that the underlying mechanisms of body composition on hypertension risk may be distinct in the presence or different severity of FLD, given that inflammation, insulin resistance, and even the whole body metabolism change when FLD occurs (38), and these should be explored further. Moreover, abdominal fat deposition, reflected by WHR and WHtR, was always important for hypertension, whether FLD existed or not.
Aside from the main results, we found that FLD was independently associated with hypertension, regardless of obesity and body composition. In the stratified analysis across all indicators on body composition profile, the moderate/severe FLD population had the highest prevalence of hypertension, followed by the mild FLD, when compared with the non-FLD. This was supported by the result adjusting the confounding effect of BMI in previous studies (33, 39). Interestingly, the ORs of moderate/severe FLD for hypertension were the highest in the lowest level of BMI, WHR, WHtR, and indicators on lipid metabolism, the second highest in their middle level, and the lowest in the highest level. All these suggested that the moderate/severe FLD population at the generally considered normal-weight levels may suffer a higher risk for hypertension than those with commonly defined obesity. This was similar to the result in a previous study that lean FLD patients showed a higher risk of hypertension than overweight/obese FLD patients (34). However, this should be further verified through large-scale cohort studies.
Limitations
Our current study is subject to several limitations. First, this is a cross-sectional study that prohibits us from drawing causal associations between body composition, FLD, and hypertension. Second, all participants were recruited from local residents in southeast China, and the age and sex distribution of the current study were not possible to represent the natural population, which limited the generalizability of our results. Third, considering the practical feasibility, bioelectrical impedance technology using a convenient body composition meter was adopted in the measurement of the body composition profile. However, this method is limited by hydration status and is less accurate than whole-body scan using computed tomography or dual-energy X-ray absorptiometry equipment (40). Last, although multiple variables were adjusted in the regression models, the possibility of the existence of residual confounding and other unadjusted confounding factors cannot be excluded.
Conclusions
The body composition profile of the hypertensive population was different from that of the normotensive. With the presence and severity of FLD, the association between body composition and hypertension was highly variable, and the observed association weakened gradually from the non-FLD to mild FLD populations and was non-significant in the moderate/severe FLD population. Moreover, FLD may be an important risk factor for hypertension, independent of BMI and body composition. However, FLD was associated with a higher excess risk in the normal-weight population than in the obese. FLD plays an important mediation role in obesity-associated hypertension. Further large-scale cohort and experimental studies are needed to validate the results and explore the potential mechanism.
Data availability statement
The raw data supporting the conclusions of this article will be made available by the authors to any qualified researcher, without undue reservation.
Ethics statement
The study has been approved by the Ethics Review Committee of Fujian Medical University (approval number, [2017-07] and [2020-58]), and the study protocol conforms to the ethical guidelines of the 1975 Declaration of Helsinki. Written informed consent was obtained from all participants.
Author contributions
All authors were responsible for the study concept and design and contributed to the field investigation and data collection. WY and SD obtained the funding. WY, SD, and RF were responsible for data curation. XH did the statistical analysis. SD, XH, and YZ drafted the manuscript. All authors revised the manuscript for important intellectual content. All authors contributed to the article and approved the submitted version.
Funding
This study was jointly supported by the National Natural Science Foundation of China (grant number: 82103923); Natural Science Foundation of Fujian Province (grant number: 2022J01711); Government of Fuqing City (grant number: 2019B003); Fujian Provincial Department of Science and Technology, China (grant number: 2019Y9021); and High-Level Talents Research Start-up Project of Fujian Medical University (No. XRCZX2017035 and No. XRCZX2020034).
Acknowledgments
We thank the participants and investigators who contributed to the Fuqing Cohort Study.
Conflict of interest
The authors declare that the research was conducted in the absence of any commercial or financial relationships that could be construed as a potential conflict of interest.
Publisher’s note
All claims expressed in this article are solely those of the authors and do not necessarily represent those of their affiliated organizations, or those of the publisher, the editors and the reviewers. Any product that may be evaluated in this article, or claim that may be made by its manufacturer, is not guaranteed or endorsed by the publisher.
Supplementary material
The Supplementary Material for this article can be found online at: https://www.frontiersin.org/articles/10.3389/fendo.2023.1247110/full#supplementary-material
Supplementary Table 1 | Association between FLD and hypertension stratified by physical examination indicators and biochemical markers.
Supplementary Table 2 | Association between physical examination indicators, biochemical markers and hypertension stratified by sex.
Supplementary Table 3 | Association between physical examination indicators, biochemical markers and hypertension stratified by age.
Supplementary Table 4 | Association between history of cholecystectomy and hypertension as well as fatty liver disease (FLD).
Supplementary Figure 1 | The trends in various body composition and hypertension risk in different FLD populations.
Abbreviations
BFP, body fat percentage; BMI, body mass index; BMR, body moisture rate; CI, confidence interval; CMI, cardiometabolic index; DBP, diastolic blood pressure; FBG, fasting blood glucose; FINS, fasting insulin; FLD, fatty liver disease; FTI, fat tissue index; HC, hip circumference; HDL-c, high-density lipoprotein cholesterol; LAP, lipid accumulation product; LDL-c, low-density lipoprotein cholesterol; LTI, lean tissue index; OR, odds ratio; SBP, systolic blood pressure; SM, skeletal muscle; TC, total cholesterol; TG, triglycerides; VAI, visceral adiposity index; WC, waist circumference; WHR, waist-to-hip ratio; WHtR, waist-to-height ratio.
References
1. Bosy-Westphal A, Müller MJ. Diagnosis of obesity based on body composition-associated health risks—Time for a change in paradigm. Obes Rev (2021) 22:e13190. doi: 10.1111/obr.13190
2. Hainer V, Aldhoon-Hainerová I. Obesity paradox does exist. Diabetes Care (2013) 36(Supplement_2):S276–S81. doi: 10.2337/dcS13-2023
3. Avolio E, Gualtieri P, Romano L, Pecorella C, Ferraro S, Palma G, et al. Obesity and body composition in man and woman: associated diseases and the new role of gut microbiota. Curr medicinal Chem (2020) 27(2):216–29. doi: 10.2174/0929867326666190326113607
4. Radetti G, Fanolla A, Grugni G, Lupi F, Tamini S, Cicolini S, et al. The role of different indexes of adiposity and body composition for the identification of metabolic syndrome in women with obesity. J Clin Med (2021) 10(9):1975. doi: 10.3390/jcm10091975
5. Donini LM, Pinto A, Giusti AM, Lenzi A, Poggiogalle E. Obesity or bmi paradox? Beneath the tip of the iceberg. Front Nutr (2020) 7:53. doi: 10.3389/fnut.2020.00053
6. Elagizi A, Kachur S, Lavie CJ, Carbone S, Pandey A, Ortega FB, et al. An overview and update on obesity and the obesity paradox in cardiovascular diseases. Prog Cardiovasc Dis (2018) 61(2):142–50. doi: 10.1016/j.pcad.2018.07.003
7. Ward LC. Human body composition: yesterday, today, and tomorrow. Eur J Clin Nutr (2018) 72(9):1201–7. doi: 10.1038/s41430-018-0210-2
8. Tam BT, Morais JA, Santosa S. Obesity and ageing: two sides of the same coin. Obes Rev (2020) 21(4):e12991. doi: 10.1111/obr.12991
9. Ferreira H, Silva WO, Santos E, Bezerra M, Silva B, Horta BL. Body composition and hypertension: a comparative study involving women from maroon communities and from the general population of alagoas state, Brazil. Rev Nutrição (2013) 26:539–49. doi: 10.1590/S1415-52732013000500005
10. Markus MR, Stritzke J, Siewert U, Lieb W, Luchner A, Doring A, et al. Variation in body composition determines long-term blood pressure changes in pre-hypertension: the monica/kora (Monitoring trends and determinants on cardiovascular diseases/cooperative research in the region of augsburg) cohort study. J Am Coll Cardiol (2010) 56(1):65–76. doi: 10.1016/j.jacc.2010.01.056
11. Han TS, Al-Gindan YY, Govan L, Hankey CR, Lean MEJ. Associations of body fat and skeletal muscle with hypertension. J Clin Hypertens (Greenwich) (2019) 21(2):230–8. doi: 10.1111/jch.13456
12. Ye S, Zhu C, Wei C, Yang M, Zheng W, Gan D, et al. Associations of body composition with blood pressure and hypertension. Obes (Silver Spring) (2018) 26(10):1644–50. doi: 10.1002/oby.22291
13. Agbim U, Carr RM, Pickett-Blakely O, Dagogo-Jack S. Ethnic disparities in adiposity: focus on non-alcoholic fatty liver disease, visceral, and generalized obesity. Curr Obes Rep (2019) 8(3):243–54. doi: 10.1007/s13679-019-00349-x
14. Goh VH, Tain CF, Tong TY, Mok HP, Wong MT. Are bmi and other anthropometric measures appropriate as indices for obesity? A study in an asian population. J Lipid Res (2004) 45(10):1892–8. doi: 10.1194/jlr.M400159-JLR200
15. Zhang X, Zhang M, Zhao Z, Huang Z, Deng Q, Li Y, et al. Geographic variation in prevalence of adult obesity in China: results from the 2013-2014 national chronic disease and risk factor surveillance. Ann Intern Med (2020) 172(4):291–3. doi: 10.7326/M19-0477
16. Fan R, Wang J, Du J. Association between body mass index and fatty liver risk: A dose-response analysis. Sci Rep (2018) 8(1):1–7. doi: 10.1038/s41598-018-33419-6
17. Zhao YC, Zhao GJ, Chen Z, She ZG, Cai J, Li H. Nonalcoholic fatty liver disease: an emerging driver of hypertension. Hypertension (2020) 75(2):275–84. doi: 10.1161/HYPERTENSIONAHA.119.13419
18. Younes R, Bugianesi E. NASH in Lean Individuals. Semin Liver Dis (2019) 39(1):86–95. doi: 10.1055/s-0038-1677517
19. Sookoian S, Pirola CJ. Systematic review with meta-analysis: risk factors for non-alcoholic fatty liver disease suggest a shared altered metabolic and cardiovascular profile between lean and obese patients. Aliment Pharmacol Ther (2017) 46(2):85–95. doi: 10.1111/apt.14112
20. Cheng YM, Kao JH, Wang CC. The metabolic profiles and body composition of lean metabolic associated fatty liver disease. Hepatol Int (2021) 15(2):405–12. doi: 10.1007/s12072-021-10147-0
21. Lee PH, Macfarlane DJ, Lam TH, Stewart SM. Validity of the International Physical Activity Questionnaire Short Form (IPAQ-SF): a systematic review. Int J Behav Nutr Phys Act (2011) 8:115. doi: 10.1186/1479-5868-8-115
22. Lin TY, Peng CH, Hung SC, Tarng DC. Body composition is associated with clinical outcomes in patients with non-dialysis-dependent chronic kidney disease. Kidney Int (2018) 93(3):733–40. doi: 10.1016/j.kint.2017.08.025
23. Amato MC, Giordano C, Galia M, Criscimanna A, Vitabile S, Midiri M, et al. Visceral adiposity index: a reliable indicator of visceral fat function associated with cardiometabolic risk. Diabetes Care (2010) 33(4):920–2. doi: 10.2337/dc09-1825
24. Kahn HS. The "Lipid accumulation product" Performs better than the body mass index for recognizing cardiovascular risk: a population-based comparison. BMC Cardiovasc Disord (2005) 5:26. doi: 10.1186/1471-2261-5-26
25. Liu X, Wu Q, Yan G, Duan J, Chen Z, Yang P, et al. Cardiometabolic index: a new tool for screening the metabolically obese normal weight phenotype. J Endocrinol Invest (2021) 44(6):1253–61. doi: 10.1007/s40618-020-01417-z
26. Zeng MD, Fan JG, Lu LG, Li YM, Chen CW, Wang BY, et al. Guidelines for the diagnosis and treatment of nonalcoholic fatty liver diseases. J Dig Dis (2008) 9(2):108–12. doi: 10.1111/j.1751-2980.2008.00331.x
27. Fan JG, Jia JD, Li YM, Wang BY, Lu LG, Shi JP, et al. Guidelines for the diagnosis and management of nonalcoholic fatty liver disease: update 2010: (Published in chinese on chinese journal of hepatology 2010; 18:163-166). J Dig Dis (2011) 12(1):38–44. doi: 10.1111/j.1751-2980.2010.00476.x
28. Ruhl CE, Everhart JE. Relationship of non-alcoholic fatty liver disease with cholecystectomy in the us population. Am J Gastroenterol (2013) 108(6):952–8. doi: 10.1038/ajg.2013.70
29. Pischon T, Boeing H, Hoffmann K, Bergmann M, Schulze MB, Overvad K, et al. General and abdominal adiposity and risk of death in Europe. N Engl J Med (2008) 359(20):2105–20. doi: 10.1056/NEJMoa0801891
30. Huang M, Laina-Nicaise L-D, Zha L, Tang T, Cheng X. Causal association of type 2 diabetes mellitus and glycemic traits with cardiovascular diseases and lipid traits: a mendelian randomization study. Front Endocrinol (Lausanne) (2022) 13:840579. doi: 10.3389/fendo.2022.840579
31. Lonardo A, Nascimbeni F, Mantovani A, Targher G. Hypertension, diabetes, atherosclerosis and nash: cause or consequence? J Hepatol (2018) 68(2):335–52. doi: 10.1016/j.jhep.2017.09.021
32. Hall JE, do Carmo JM, da Silva AA, Wang Z, Hall ME. Obesity, kidney dysfunction and hypertension: mechanistic links. Nat Rev Nephrol (2019) 15(6):367–85. doi: 10.1038/s41581-019-0145-4
33. Lopez-Suarez A, Guerrero JM, Elvira-Gonzalez J, Beltran-Robles M, Canas-Hormigo F, Bascunana-Quirell A. Nonalcoholic fatty liver disease is associated with blood pressure in hypertensive and nonhypertensive individuals from the general population with normal levels of alanine aminotransferase. Eur J Gastroenterol Hepatol (2011) 23(11):1011–7. doi: 10.1097/MEG.0b013e32834b8d52
34. Feng RN, Du SS, Wang C, Li YC, Liu LY, Guo FC, et al. Lean-non-alcoholic fatty liver disease increases risk for metabolic disorders in a normal weight chinese population. World J Gastroenterol (2014) 20(47):17932–40. doi: 10.3748/wjg.v20.i47.17932
35. Lorbeer R, Bayerl C, Auweter S, Rospleszcz S, Lieb W, Meisinger C, et al. Association between mri-derived hepatic fat fraction and blood pressure in participants without history of cardiovascular disease. J Hypertens (2017) 35(4):737–44. doi: 10.1097/HJH.0000000000001245
36. Chen Y, Zhao X, Wu H. Arterial stiffness: a focus on vascular calcification and its link to bone mineralization. Arterioscler Thromb Vasc Biol (2020) 40(5):1078–93. doi: 10.1161/ATVBAHA.120.313131
37. Persy V, D'Haese P. Vascular calcification and bone disease: the calcification paradox. Trends Mol Med (2009) 15(9):405–16. doi: 10.1016/j.molmed.2009.07.001
38. Stefan N, Kantartzis K, Häring H-U. Causes and metabolic consequences of fatty liver. Endocrine Rev (2008) 29(7):939–60. doi: 10.1210/er.2008-0009
39. Ryoo JH, Suh YJ, Shin HC, Cho YK, Choi JM, Park SK. Clinical association between non-alcoholic fatty liver disease and the development of hypertension. J Gastroenterol Hepatol (2014) 29(11):1926–31. doi: 10.1111/jgh.12643
Keywords: hypertension, body composition, fatty liver disease, phenotype, obesity, lipid, mediation analysis, association
Citation: Huang X, Zeng Y, Ma M, Xiang L, Liu Q, Xiao L, Feng R, Li W, Zhang X, Lin M, Hu Z, Zhao H, Du S and Ye W (2023) Associations between body composition profile and hypertension in different fatty liver phenotypes. Front. Endocrinol. 14:1247110. doi: 10.3389/fendo.2023.1247110
Received: 25 June 2023; Accepted: 31 October 2023;
Published: 28 November 2023.
Edited by:
Karen Elizabeth Nava-Castro, National Autonomous University of Mexico, MexicoReviewed by:
Fabiola Sanchez Meza, National Autonomous University of Mexico, MexicoMajid Hajifaraji, National Nutrition and Food Technology Research Institute, Iran
Copyright © 2023 Huang, Zeng, Ma, Xiang, Liu, Xiao, Feng, Li, Zhang, Lin, Hu, Zhao, Du and Ye. This is an open-access article distributed under the terms of the Creative Commons Attribution License (CC BY). The use, distribution or reproduction in other forums is permitted, provided the original author(s) and the copyright owner(s) are credited and that the original publication in this journal is cited, in accordance with accepted academic practice. No use, distribution or reproduction is permitted which does not comply with these terms.
*Correspondence: Weimin Ye, eXdtQGZqbXUuZWR1LmNuMTYzLmNvbQ==; Shanshan Du, ZHVzaGFuc2hhbjEwMDdAMTYzLmNvbQ==
†These authors have contributed equally to this work and share first authorship