 Yu Liu
 Nana Liu2†
94% of researchers rate our articles as excellent or good
Learn more about the work of our research integrity team to safeguard the quality of each article we publish.
Find out more
ORIGINAL RESEARCH article
Front. Endocrinol., 09 October 2023
Sec. Cancer Endocrinology
Volume 14 - 2023 | https://doi.org/10.3389/fendo.2023.1245629
This article is part of the Research TopicMetabolic and Senescence Characteristics Associated with the Immune Microenvironment in Tumor CellsView all 18 articles
Background: Glucose metabolism (GM) plays a crucial role in cancer cell proliferation, tumor growth, and survival. However, the identification of glucose metabolism-related genes (GMRGs) for effective prediction of prognosis in head and neck squamous cell carcinoma (HNSC) is still lacking.
Methods: We conducted differential analysis between HNSC and Normal groups to identify differentially expressed genes (DEGs). Key module genes were obtained using weighted gene co-expression network analysis (WGCNA). Intersection analysis of DEGs, GMRGs, and key module genes identified GMRG-DEGs. Univariate and multivariate Cox regression analyses were performed to screen prognostic-associated genes. Independent prognostic analysis of clinical traits and risk scores was implemented using Cox regression. Gene set enrichment analysis (GSEA) was used to explore functional pathways and genes between high- and low-risk groups. Immune infiltration analysis compared immune cells between the two groups in HNSC samples. Drug prediction was performed using the Genomics of Drug Sensitivity in Cancer (GDSC) database. Quantitative real-time fluorescence PCR (qRT-PCR) validated the expression levels of prognosis-related genes in HNSC patients.
Results: We identified 4973 DEGs between HNSC and Normal samples. Key gene modules, represented by black and brown module genes, were identified. Intersection analysis revealed 76 GMRG-DEGs. Five prognosis-related genes (MTHFD2, CDKN2A, TPM2, MPZ, and DNMT1) were identified. A nomogram incorporating age, lymph node status (N), and risk score was constructed for survival prediction in HNSC patients. Immune infiltration analysis showed significant differences in five immune cell types (Macrophages M0, memory B cells, Monocytes, Macrophages M2, and Dendritic resting cells) between the high- and low-risk groups. GDSC database analysis identified 53 drugs with remarkable differences between the groups, including A.443654 and AG.014699. DNMT1 and MTHFD2 were up-regulated, while MPZ was down-regulated in HNSC.
Conclusion: Our study highlights the significant association of five prognosis-related genes (MTHFD2, CDKN2A, TPM2, MPZ, and DNMT1) with HNSC. These findings provide further evidence of the crucial role of GMRGs in HNSC.
Head and neck cancer is one of the most common malignant tumors, with the sixth highest incidence in the world, and the most common pathological type is squamous cell carcinoma (1). The global annual incidence and mortality of head and neck squamous cell carcinoma (HNSC) are estimated to be 900,000 and 450,000 deaths (2, 3), respectively. Since the early symptoms of HNSC are not obvious, most HNSC patients are diagnosed at an advanced stage, with a poor prognosis and a 5-year survival rate of less than 50% (4). Therefore, further research on the molecular mechanism of HNSC and the development of effective early screening, diagnosis and treatment methods are crucial to improve the prognosis of HNSC patients.
Changes in glucose metabolism (GM) are critical to the growth and progression of cancer (5), which mainly involve four aspects: tricarboxylic acid cycle, glycolysis, gluconeogenesis and glycogen synthesis (6). Traditionally, it is believed that cancer cells metabolize glucose mainly through glycolysis to produce sufficient energy and other key metabolites needed for survival. Glucose is processed through glycolysis to produce ATP and pyruvate, and then through the pentose phosphate pathway to produce ribose 5-phosphate and NADPH, or enter the tricarboxylic acid (TCA) cycle in the mitochondria. Glucose-derived citrate is converted to acetyl-CoA, oxaloacetic acid (OAA) or a-ketoglutaric acid (a KG). Glutamine is deaminated to form glutamate, which is processed to produce a KG for use in the TCA cycle (7). This classical type of metabolic change provides the substrates required for cancer cell proliferation and division (8), which are involved in tumor growth, metastatic progression and long-term survival. Studies have shown that the number of genes related to glycolysis is associated with tumor proliferation, invasion, angiogenesis, chemotherapy and radiotherapy resistance, and there is a correlation between glycolysis and clinical outcomes (9, 10). The glucose metabolism of cancer cells is mainly regulated by a series of transcription factors, including c-Myc, p53, HIF-1α, etc, under the interaction of signaling pathways dominated by Akt, PI3K, PTEN, mTOR, and AMPK (11, 12). So far, targeted drugs targeting tumor glucose metabolism have been released, such as GLUT-1 inhibitors, LDHA inhibitors, IDH2 mutation inhibitors, etc. (13). Although many prognostic models for HNSC have been constructed by researchers, the effectiveness and sensitivity need to be improved, so it is necessary to construct more accurate prognostic models to improve the prognosis of HNSC patients (14–18). Besides, in HNSC, there is still a lack of glucose metabolism related genes (GMRGs) signature to predict patient prognosis more effectively.
Machine learning offers significant advantages and impressive progress in identifying disease biomarkers (19–22). While traditional biomarker research usually takes a lot of time and resources, machine learning methods can efficiently extract key features from large-scale biological data and accelerate the biomarker discovery process (23–25). In addition, machine learning can integrate multiple data sources, such as genomics, transcriptomics and proteomics data, to reveal the molecular mechanisms of diseases at different levels and provide more reliable biomarkers for precision medicine (26–28). Overall, the advantages of machine learning in recognizing disease biomarkers lie in its efficient feature selection capability, its classification ability to adapt to complex data structures (29, 30), and its integration and mining of data from multiple sources, and these advances have brought new hope to the fields of disease diagnosis, treatment, and prognosis assessment (31–33). However, with the continuous development of technology, there are still many challenges and opportunities waiting to be explored and solved in our understanding and application of disease biomarkers.
In this study, based on genes related to glucose metabolism, a series of bioinformatics methods such as differential expression analysis, weighted gene co-expression network analysis (WGCNA), gene set enrichment analysis (GSEA) functional enrichment and immune infiltration analysis were used to establish a prognostic model of HNSC and explore its pathogenesis.
Clinical information data and RNA-sequencing (RNA-seq) were acquired from The Cancer Genome Atlas (TCGA) database. There were 500 head and neck squamous cell carcinoma (HNSC) and 44 Normal samples with clinical information in the TCGA database. External validation dataset GSE65858 of Gene Expression Omnibus (GEO) database has 270 patients with survival information. In the GeneCard database, 605 GMRGs were obtained by Relevance score ≥ 2.
Differentially expressed genes (DEGs) between 500 HNSC and 44 Normal samples were obtained by limma (version 3.42.2) package (|log2FC| >0.5 and p.value < 0.05) (34). Then, volcano and heat map were drawn by ggplot2 (version 3.3.2) and pheatmap (version 1.0.12) packages (35), respectively. In this study, to find out the genes associated with different traits, 544 samples in TCGA-HNSC were used as traits for WGCNA analysis. 500 HNSC and 44 Normal samples were employed in build a co-expression network by WGCNA (version v1.70-3) package (36). Firstly, samples clustered were performed on 500 HNSC and 44 Normal samples, and outlier samples were eliminated to secure the precision of the analysis. The soft threshold was resolved to ensure that the engagement between genes conforms to the scale-free distribution to the maximum extent. The module was divided by dynamic cut tree algorithm, and the parameter minModuleSize were set to 300. The key module was acquired by correlation analysis between module and HNSC.
DEGs between HNSC and Normal groups, genes in key module and 605 GMRGs were crossed to identify GMRG-DEGs. In addition, to assess whether GMRG-DEGs were significantly different from the survival of HNSC patients, we extracted GMRG-DEGs expression data from TCGA-HNSC samples expression data. Then, the TCGA-HNSC samples were stochastic divided into training set and test set in a ratio of 7: 3 (37). Furthermore, univariate and multivariate Cox regression analyses were performed in the training set to verify whether these genes were risk factors. Next, univariate Cox regression analysis was conducted on GMRG-DEGs expression profiles of the training set. Variables acquired by univariate Cox analysis were embraced in multivariate Cox analysis, followed by stepwise regression function (step). Moreover, we used the surviminer (0.4.6) package to calculate the cut-off value of continuous independent variables of survival data (train: 1.28; test: 1; GSE65858: 3.17), HNSC samples were separated into high-and low-risk groups based on cut-off values. For each patient, the risk score was calculated by combining the expression levels of these genes with their corresponding coefficients: Risk score = ExpressionmRNA1 × CoefmRNA1 + ExpressionmRNA2 × CoefmRNA2 + ExpressionmRNAn × CoefmRNAn. Based on the two groups, Kaplan-Meier (K-M) curve were plotted. Finally, to further assessment the effectiveness of the risk model, we plotted receiver operating characteristic (ROC) curves with 1-, 3- and 5-years as survival time nodes according to the risk model obtained by multivariate risk regression. After constructing the risk model, it was checked by TCGA test set and GSE65858 external verification set in turn. Subsequently, the risk curve, K-M curve of two groups and ROC curves were drawn for validation data.
To further study the clinicopathological features and prognosis of risk model, in the risk model, gender, stage, age, grade and TMN stage were included. Univariate and multivariate Cox independent prognostic analysis were performed using the survival (3.2-7) package (38–40). Then, based on the TCGA-HNSC training set of 316 samples with clinical information, a nomogram was constructed using rms (version 6.2-0) package to project the 1-, 3- and 5-year survival rate for HNSC patients. Moreover, calibration curves were drawn to evaluate the precise of the prediction.
GSEA on all genes in two groups were performed by GSEA software (v4.1.0). SIZE > 20 and NOM.p.val < 0.05 were set as significantly enriched pathways. Furthermore, to study immune cell infiltration in two groups, Cell type Identification By Estimating Relative Subsets Of RNA Transcripts (CIBERSORT) algorithm and LM22 gene set were used to calculate the proportion of 22 immune cells of all HNSC samples (high-risk = 96, low-risk = 254) in two groups, and excluding samples with p > 0.05 (remaining samples high-risk = 95, low-risk = 252). Then, according to the score of each immune cell in two groups, the score heat map of 22 immune cells was drawn. Differences in immune cells between two groups were compared by Wilcoxon test, and ggplot2 package was employed to draw violin plot. Subsequently, Spearman correlation analysis of immune cells and prognostic related genes were conducted. Immune score and matrix score of the TCGA-HNSC transcriptome data were calculated.
Firstly, we calculated tumor mutation burden (TMB) and microsatellite instability (MSI) for two groups. Then, Dysfunction, Exclusion and tumor immune dysfunction and exclusion (TIDE) for the two groups were estimated and analyzed. In addition, Pearson correlation analysis were performed on prognostic related genes and TIDE (39). Finally, according to the above HNSC samples in two groups of the Genomics of Drug Sensitivity in Cancer (GDSC) database, a ridge regression model was constructed to predict the half maximal inhibitory concentration (IC50) values of drugs by pRRophetic algorithm. Moreover, calculation of drug level of expression in two groups was performed by Wilcoxon test.
HNSC tumor and paracancerous tissue samples were obtained from HNSC patients with knowledge and consent from Chongqing general hospital, and this study was approved by the Chongqing general hospital ethics committee. Seven pairs of frozen tissue samples were divided into two groups, of which seven paracancerous tissue samples were Normal group and the other seven tumor tissue samples were HNSC group (Case). Then, total RNA of samples was isolated and purified by TRIzol (Ambion) reagent following the instruction manual. Then, the extracted RNA was tested for concentration by NanoPhotometer N50. Next, reverse transcription via SureScript-First-strand-cDNA-synthesis-kit (Servicebio) by an ordinary PCR instrument. Reverse transcription product cDNA was diluted 5-20 times with ddH2O (RNase/DNase free). Subsequently, polymerase chain reaction (PCR) amplification reaction was performed by CFX96 real-time quantitative PCR instrument. 1 min at 95 °C (pre-denaturation), followed by at 95 °C for 20 s (denaturation), 55 °C for 20 s (annealing) and 72 °C for 30 s (elongation). The above reactions were subjected to forty cycles. Primer sequences were showed in Table 1.
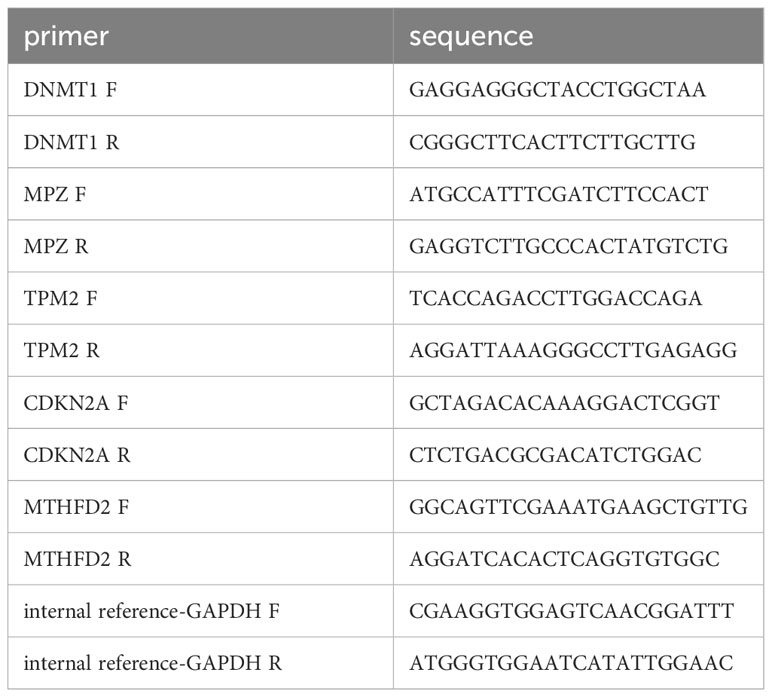
Table 1 Primer sequences used in the quantitative reverse transcriptase PCR (qRT-PCR).
The qPCR results were analyzed using GraphPad Prism Software (version 8.3.0). The data are presented as means ± standard deviation (SD) from three independent experiments and were analyzed by analysis of variance (ANOVA). A p-value less than 0.05 was considered statistically significant.
There were 4973 DEGs between HNSC and Normal groups (Figure 1A). Heat map showed the expression of up-regulated and down-regulated top 100 DEGs between HNSC and Normal groups (Figure 1B). Samples clustering result indicated there were 5 outlier samples. Therefore, the remaining of 539 samples were used for subsequent analysis (Figure 1C). When the soft threshold is 7, the network was closest to the distribution without network scale (Figure 1D). 12 modules were obtained by dynamic cut tree algorithm (Figure 1E). Black module gene (1590 genes) and brown module gene (3487 genes) were selected as key modules (Figure 1F).

Figure 1 Acquisition of differentially expressed genes (DEGs) and key module genes. (A) Volcano plot of DEGs between HNSC and Normal samples (|log2FC| >0.5 and p.value < 0.05). (B) Heatmap of Top100 DEGs between HNSC and Normal samples. (C) Sample clustering dendrogram to remove outliers and trait heatmap. (D) Analysis of the scale-free fit index (left) and the mean connectivity (right) for various soft-thresholding powers (Soft threshold = 7). (E) Cluster dendrogram of all DEGs under the clustering tree. (F) Correlations heatmap between modules and traits.
According to the intersection of DEGs between HNSC and Normal groups, genes in key module and 605 GMRGs, there were 76 GMRG-DEGs (Figure 2A, Table S1). 8 prognosis related genes (TP73, TXNDC9, MTHFD2, CDKN2A, TPM2, MPZ, DNMT1 and IGF2BP2) were obtained by univariate Cox regression analysis (Table 2). There were 5 prognosis related genes (MTHFD2, CDKN2A, TPM2, MPZ and DNMT1) based on multivariate Cox analysis (Figure 2B, Table 3). In the high-risk group, TPM2, MPZ and MTHFD2 were highly expressed, moreover, it was found that CDKN2A and DNMT1 had a higher expressed in low-risk group (Figure 2C). In two groups, there was a significant difference in the survival of HNSC patients between (p < 0.05), and in the high-risk group, it was found that the survival rate of HNSC patients was lower (Figure 2D). The area under curve (AUC) values of ROC curve were greater than 0.6, indicated that the risk model had better performance (Figure 2E).
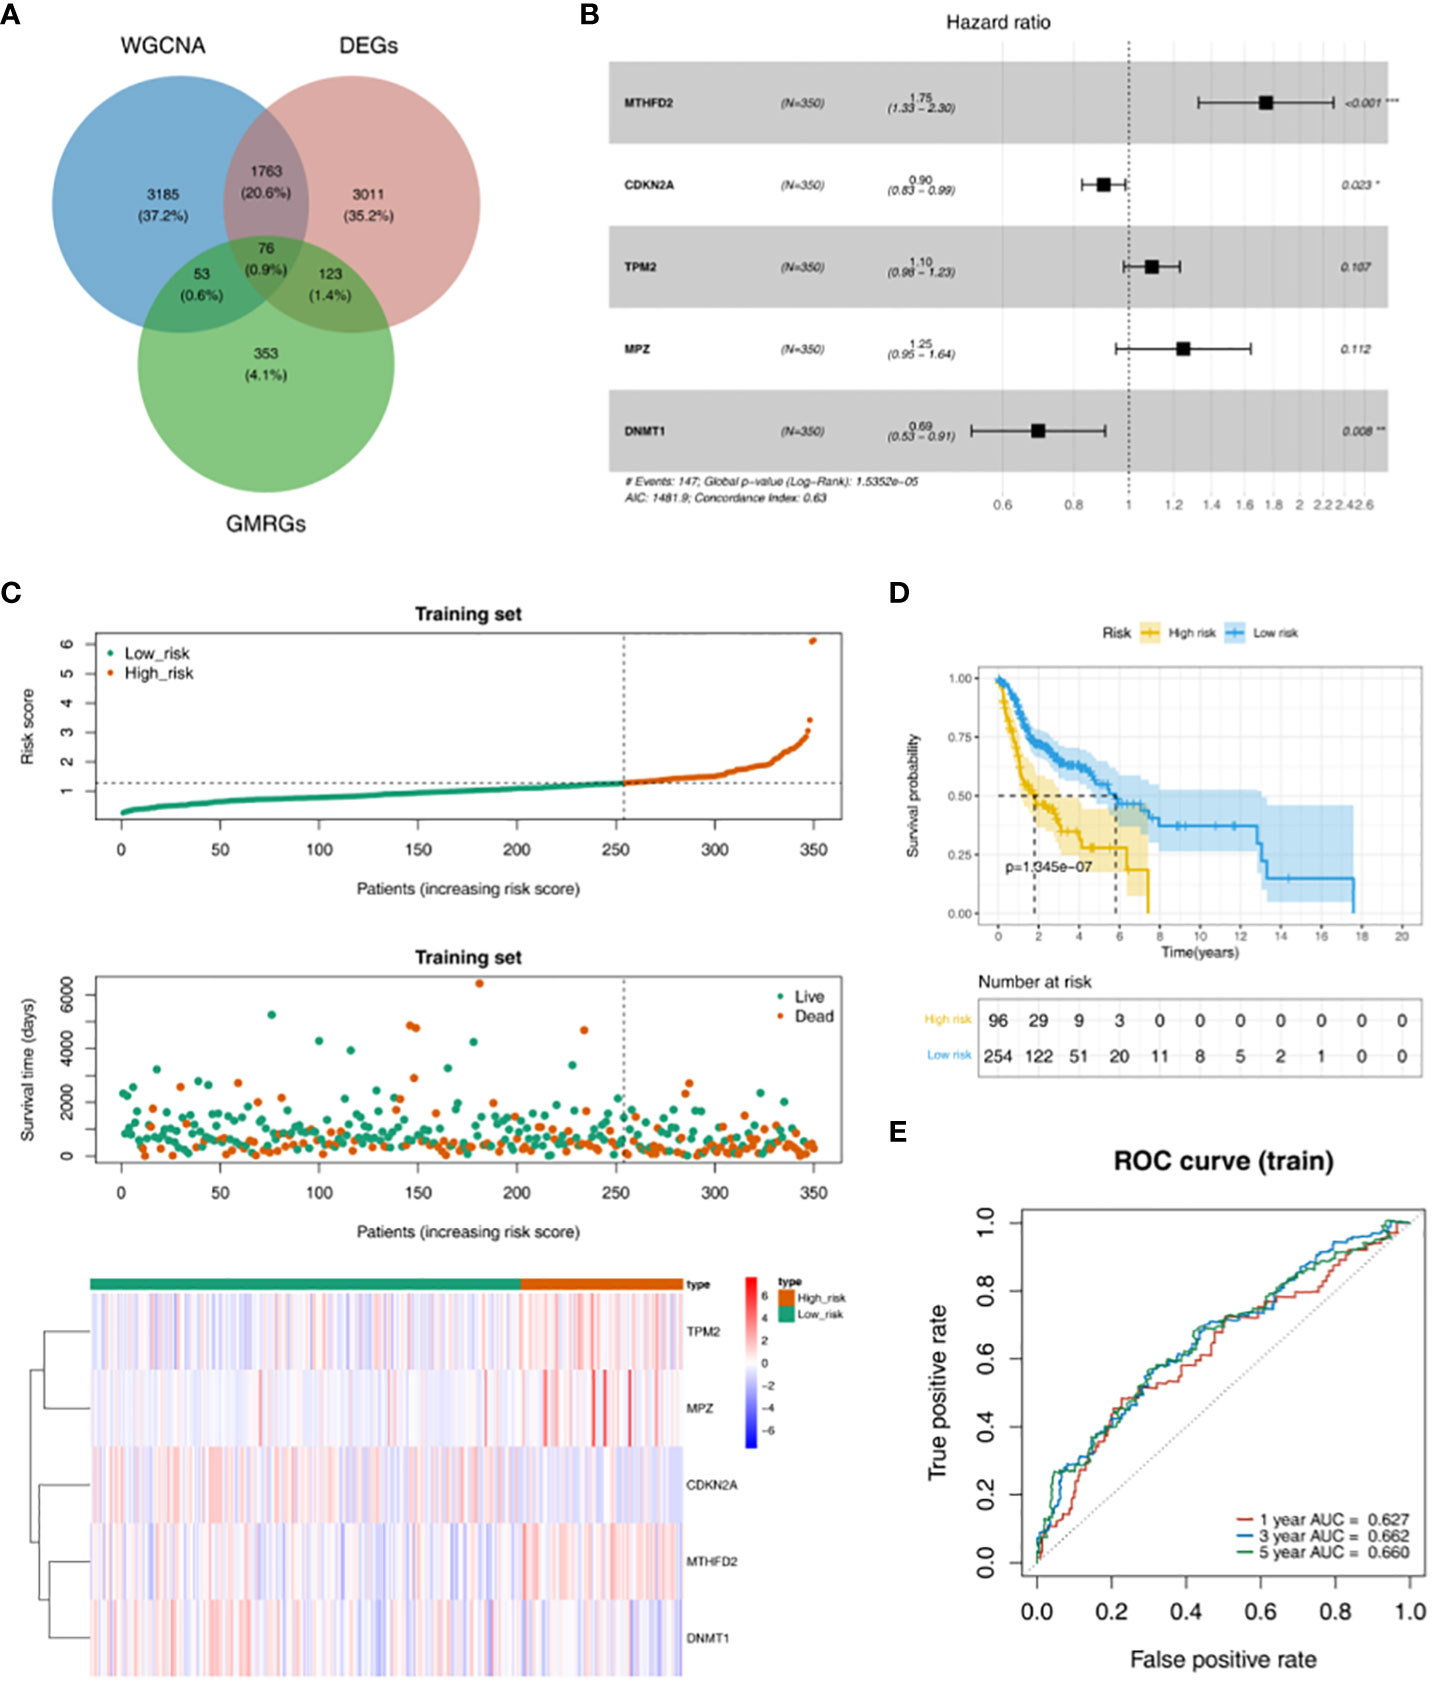
Figure 2 Obtaining GMRG-DEGs and evaluation of the prognostic risk model in training set. (A) Venn diagram of module genes, DEGs and glucose metabolism related genes (GMRGs) for screening GMRG-DEGs. (B) Forest plot of multivariate Cox regression analysis. (C) Distribution of risk scores, survival times gene expressions of high and low risk groups in the training set. (D) Survival curve of high- and low-risk groups in the training set. (E) ROC curves of 1-, 3-, and 5-year based on the training set.
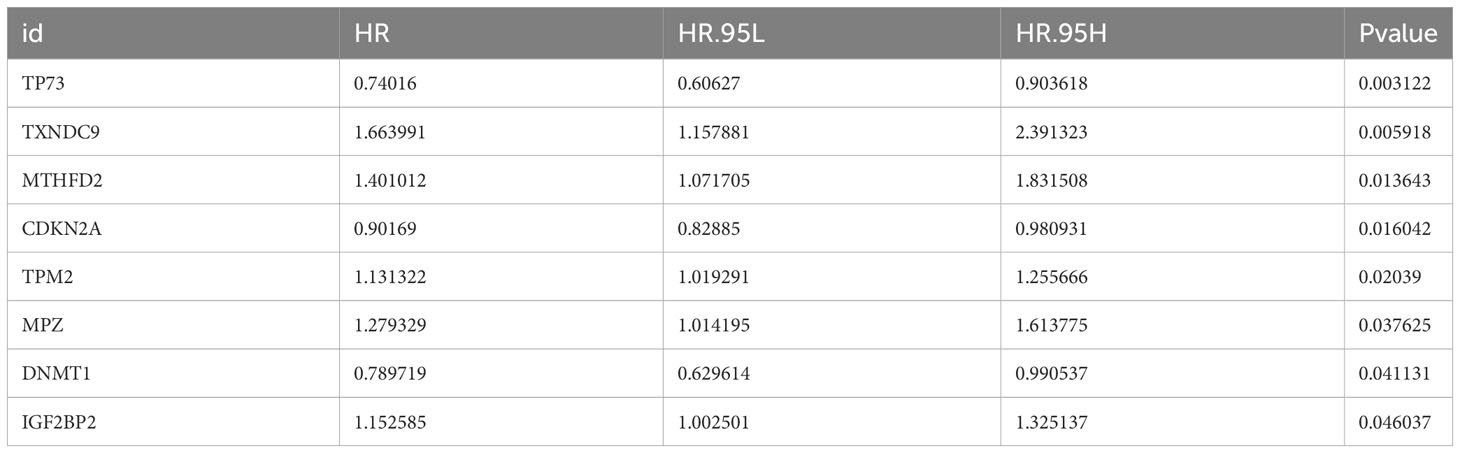
Table 2 Univariable Cox regression analysis results.

Table 3 Multivariate Cox regression analysis results.
TPM2, MPZ and MTHFD2 were highly expressed in the high-risk group of the TCGA test set, moreover, CDKN2A and DNMT1 had a higher expressed in the low-risk group (Figure 3A). The survival rate of the high-risk group in the validation data was lower (Figure 3B). AUC values were basically greater than 0.6, the result was basically consistent with the training set (Figure 3C). In addition, in the GSE65858 external verification set, it was found that TPM2, MPZ and MTHFD2 had a higher expressed in high-risk group, and we could see CDKN2A and DNMT1 had a higher expressed in the low-risk group (Figure 3D). In the GSE65858 dataset, K-M curve showed the survival rate was lower of the high-risk group (Figure 3E). Besides, it was found that the risk model was credible (Figure 3F).
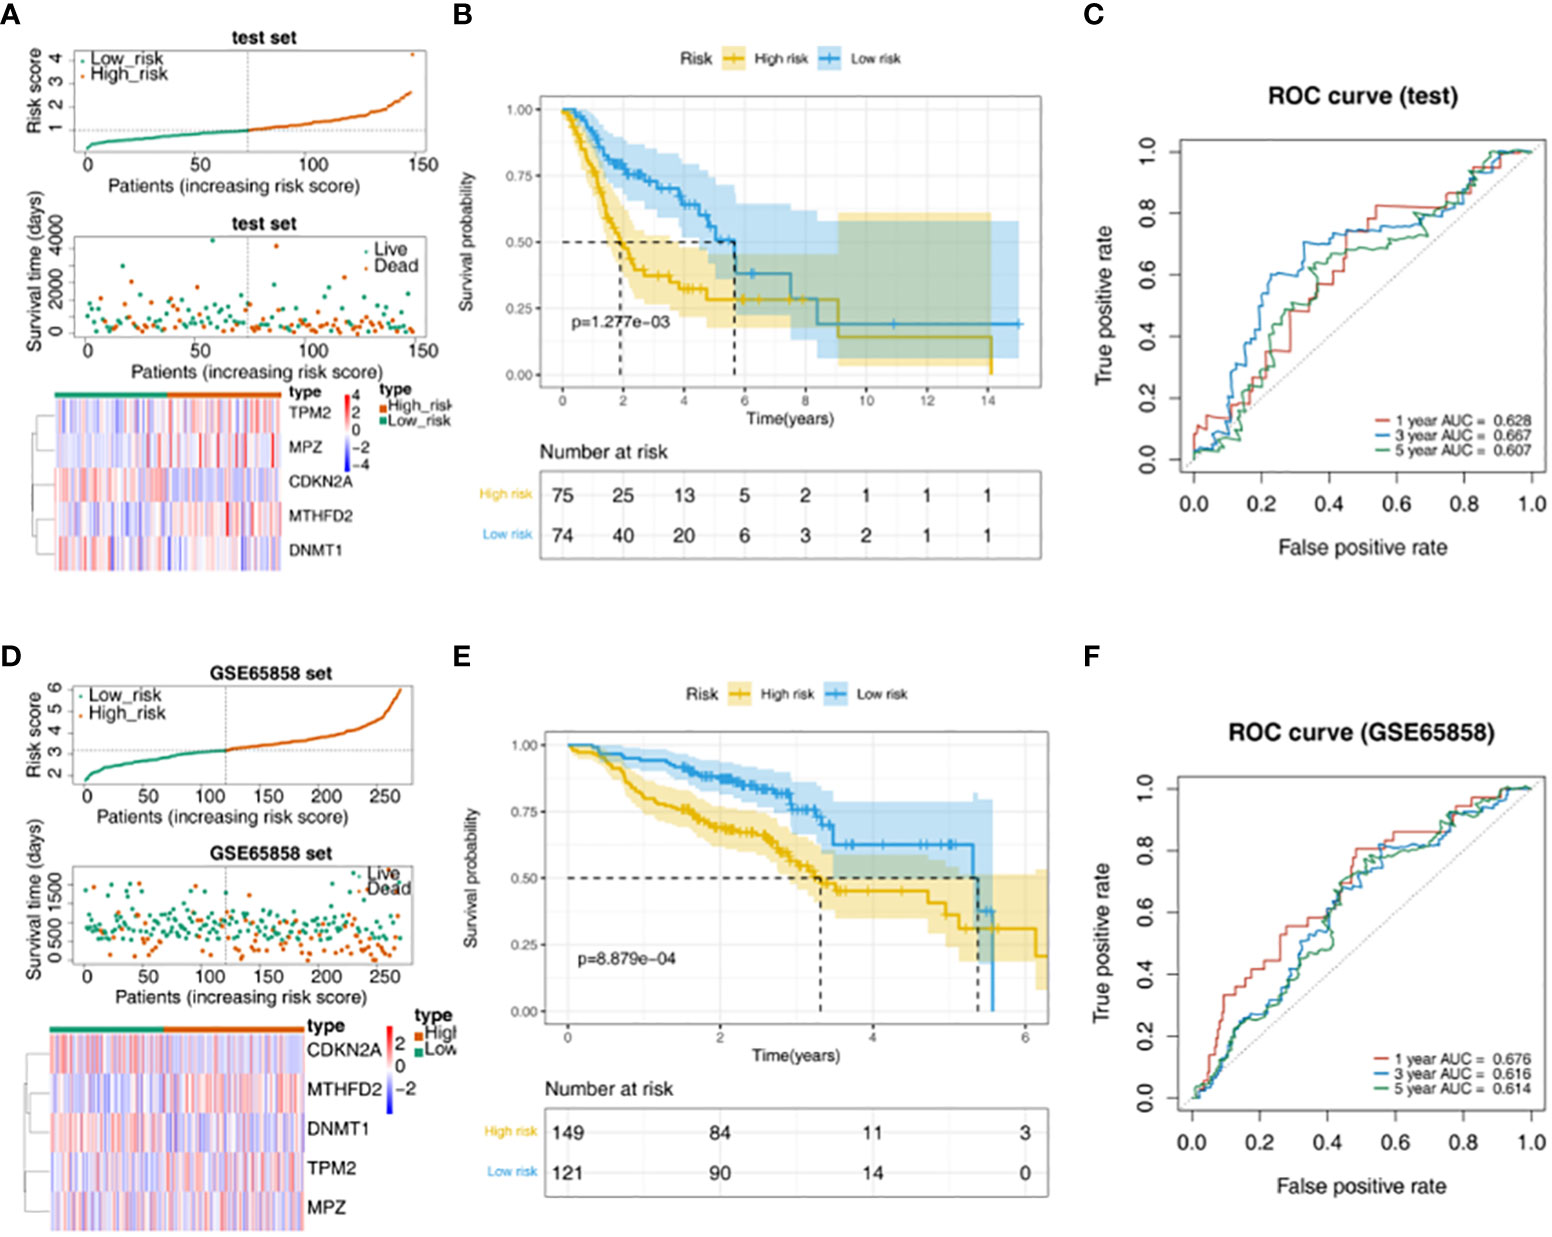
Figure 3 Validation of the risk model. (A) Distribution of risk scores, survival times gene expressions of high and low risk groups in the test set. (B) The survival curve of the high- and low-risk groups in the test set. (C) The ROC curve of 1-, 3-, and 5-year in the test set. (D) Distribution of risk scores, survival times gene expressions of high and low risk groups in GSE65858. (E) Survival curves for high- and low-risk groups in the GSE65858 dataset. (F) ROC curves for 1-, 3-, 5-year in the GSE65858 dataset.
In addition, univariate Cox independent prognostic results showed that the p.value for age, N, and riskScore was less than 0.05 (Figure 4A). According to the multivariate Cox independent prognostic analysis, it was found that the p.value for age, N, and riskScore were all less than 0.05. Therefore, age, N, and riskScore were considered as independent prognostic factors (Figure 4B). A nomogram for survival prediction in HNSC patients was constructed using age, N, and riskScore (Figure 4C). The calibration curve was plotted based on the above nomogram, and 3-year slope closest to 1 indicated that the prediction effect of the model could be used as an effective model (Figure 4D).
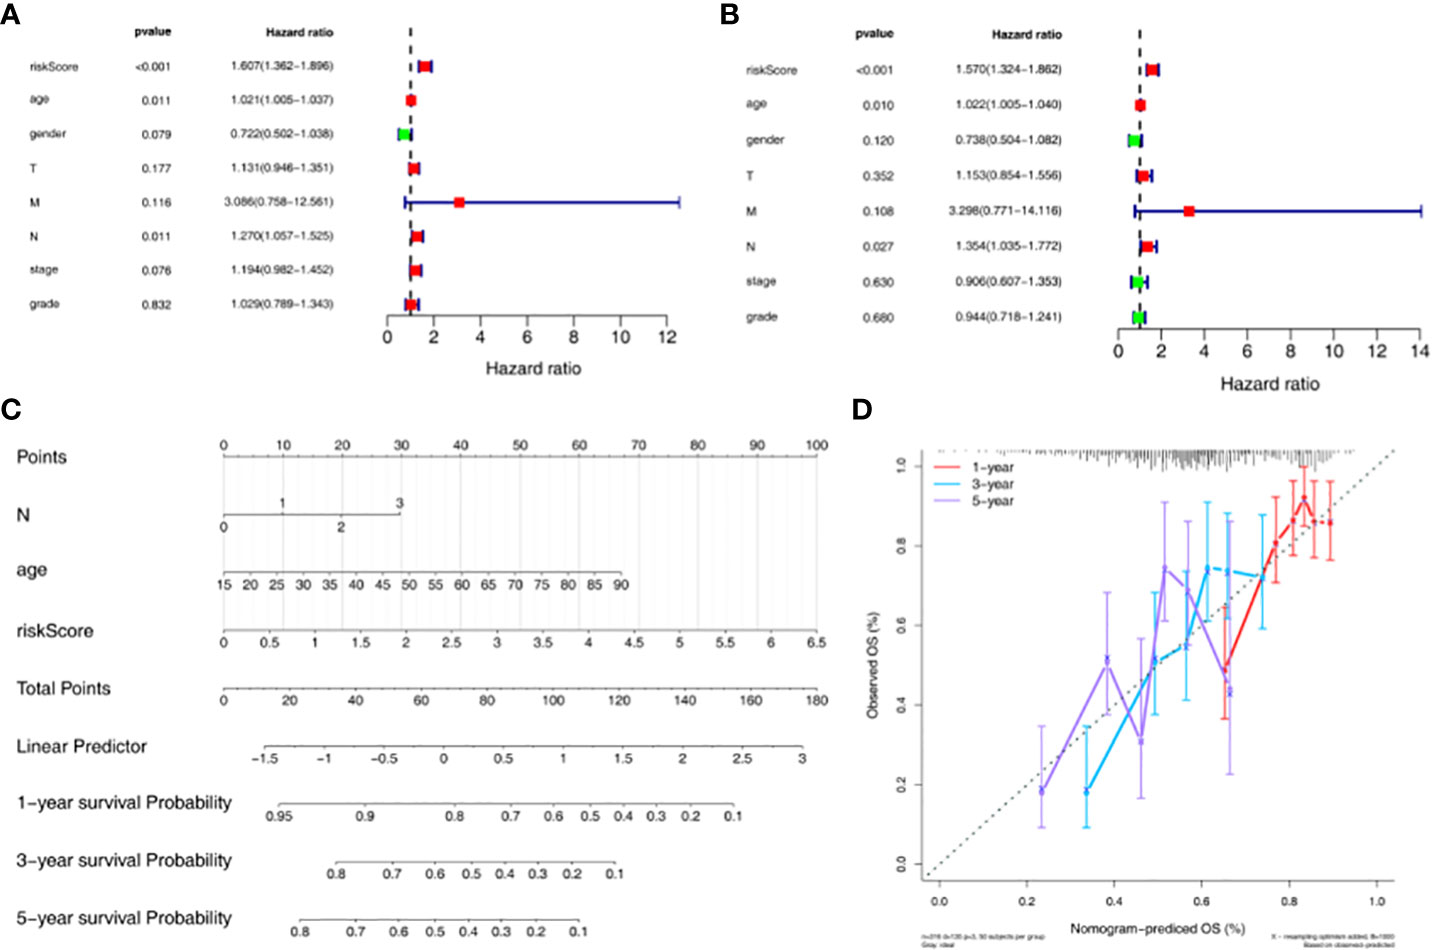
Figure 4 Construction and evaluation of nomogram based on independent prognostic risk models. (A) Univariate Cox analysis based on the training set. (B) Multivariate Cox analysis based on the training set. (C) Nomogram predicting 1-, 3-, and 5-year survival of HNSC patients. (D) Nomogram calibration curve.
GO functional enrichment analysis showed that genes in high-risk groups were mainly enriched in striated muscle cell development, sarcomere organization and muscle cell development, and in low-risk groups, genes were participated in epidermis development, keratinocyte differentiation and regulation of water loss via skin (Figure 5A). In the KEGG functional enrichment analysis, it was found that genes in high-risk groups were associated with oxidative phosphorylation, cardiac muscle contraction and ecm receptor interaction. Besides, genes in low-risk groups were involved in primary immunodeficiency, DNA replication and T cell receptor signaling pathway (Figure 5B). Each immune cell of scores in two groups were displayed in the heat map (Figure 5C). The result showed that there were 5 kinds of immune cells with significant difference (p < 0.05), including memory B cells, Macrophages M0, Macrophages M2, Monocytes and Dendritic resting cells (Figure 5D). TPM2 was positively associated with Macrophages M0 and Macrophages M2, and we also could see a remarkable negative correlation between MTHFD2 and Dendritic resting cells. In addition, it was found that DNMT1 had a significantly negative associated with Macrophages M2 and Dendritic resting cells (Figure 5E, Table S2). Moreover, we could found there were significant differences in Stromal, ESTIMATE and TumorPurity scores between high- and low-risk groups (p < 0.05) (Figure 5F, Table S3).
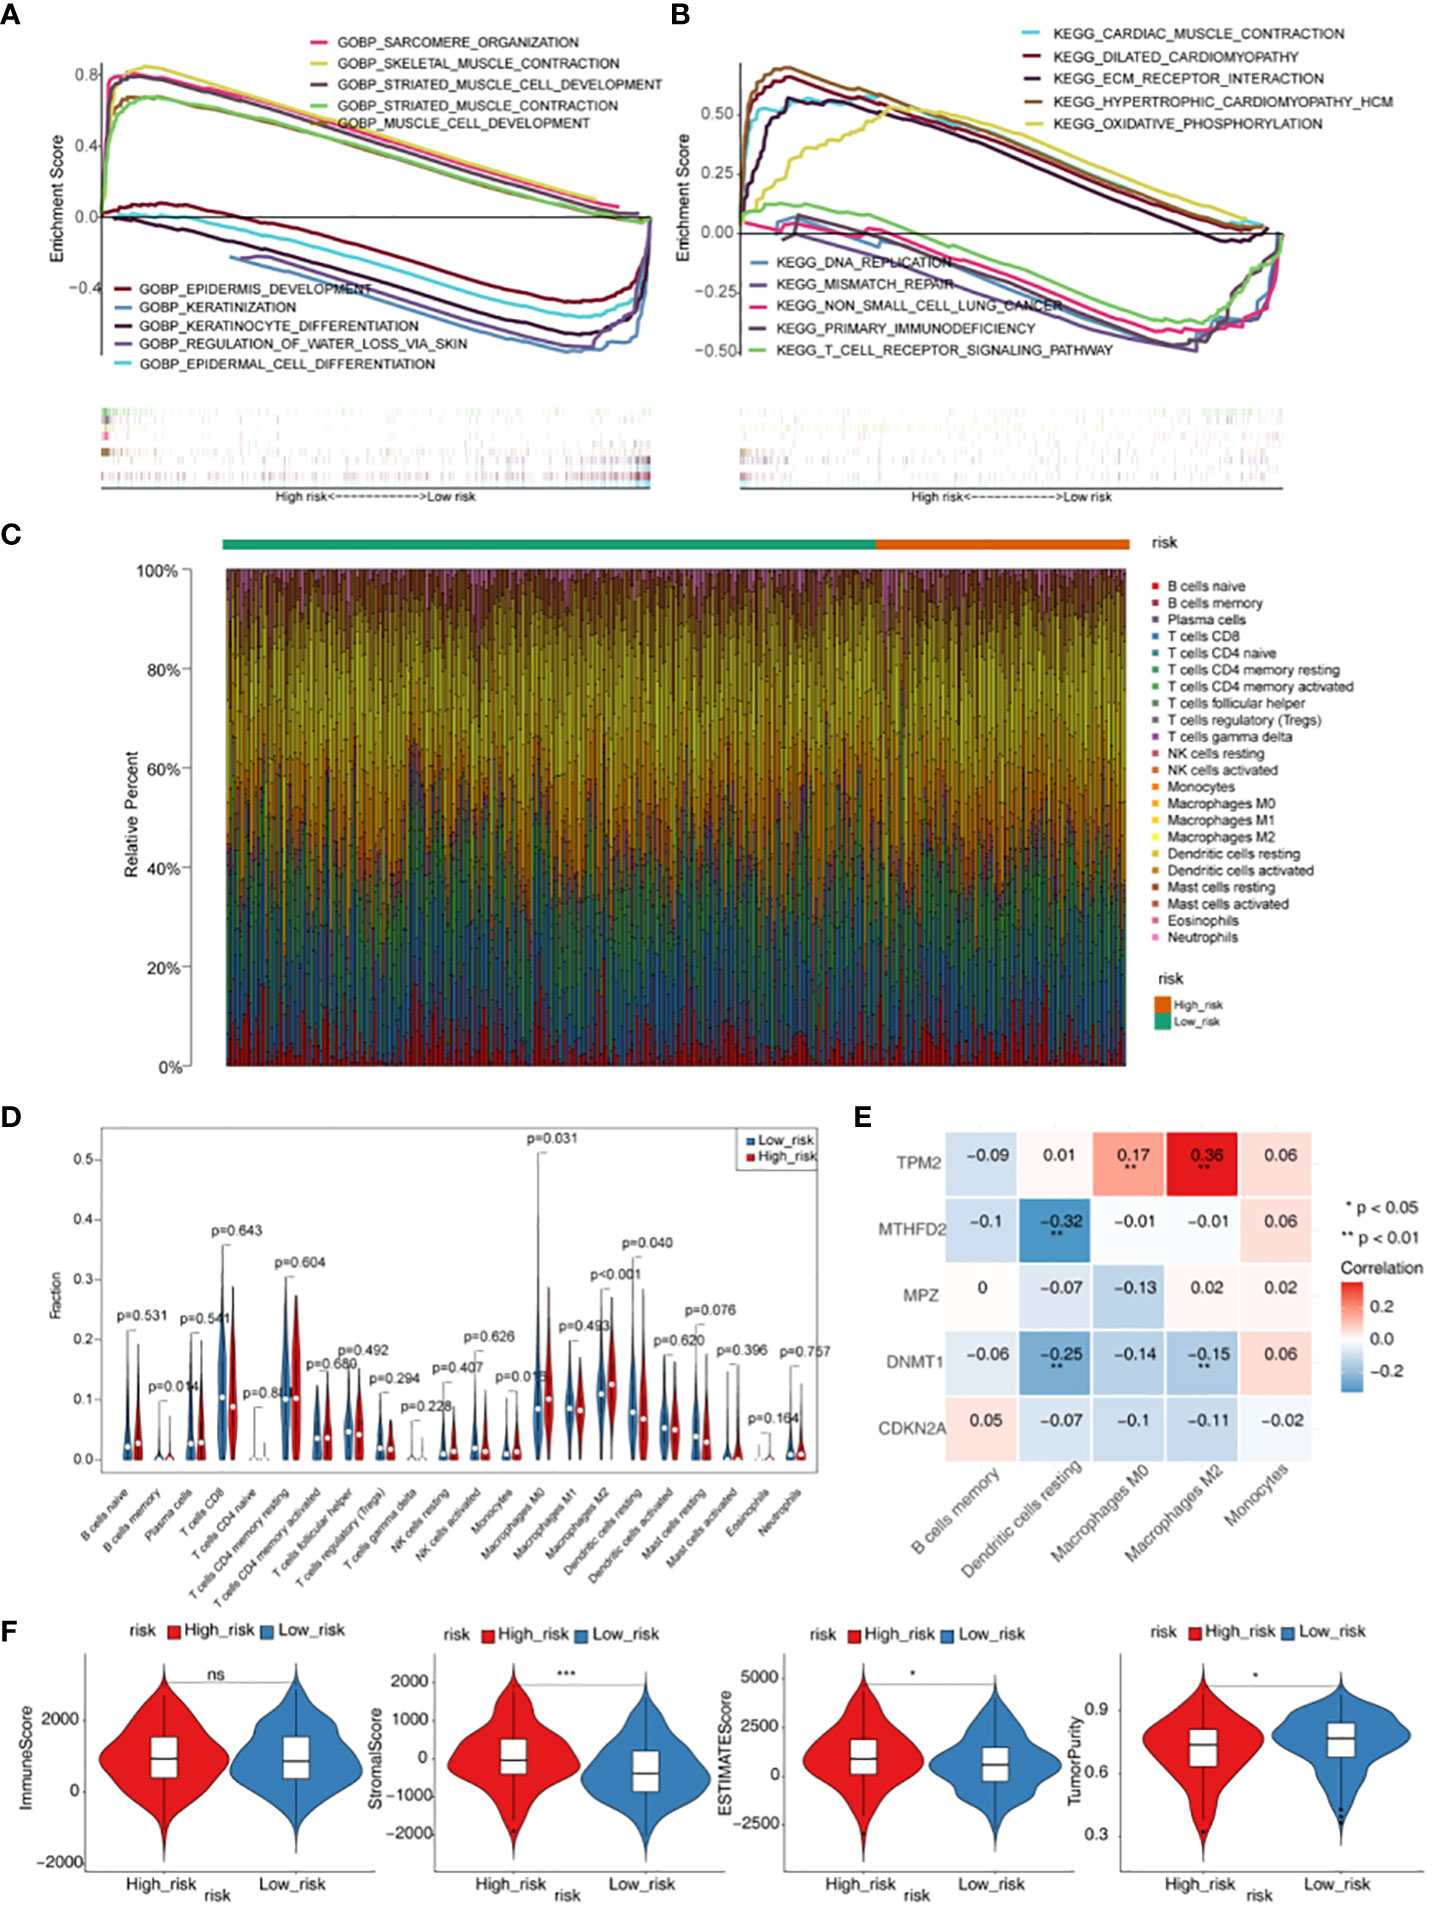
Figure 5 Gene set enrichment analysis (GSEA) and immune microenvironment analysis. (A) GO enrichment analysis of high- and low-risk groups. (B) KEGG enrichment analysis of high- and low-risk groups. (C) Heatmap of scores of 22 immune cell types in high- and low-risk groups. (D) Violin plot for the infiltration abundances of 22 immune cell between the high- and low-risk groups. (E) Heatmap of correlations between differential immune cells and five prognostic genes in the prognostic risk model. (F) Difference of immune score, stromal score, ESTIMATE score and tumor purity between high- and low- risk groups. * p < 0.05,*** p < 0.001. "ns" means no significance.
TMB and MSI were not significant difference in two groups (Figure 6A). The result showed that TIDE, Dysfunction and Exclusion were remarkable differential expression in two groups (p < 0.05) (Figure 6B). It was found that TPM2 and MPZ had a certain correlation with TIDE (Figure 6C). There were 53 drugs significantly different between two groups, such as A.443654 and AG.014699 (Figure 7, Supplementary Figure 1, Table S4).
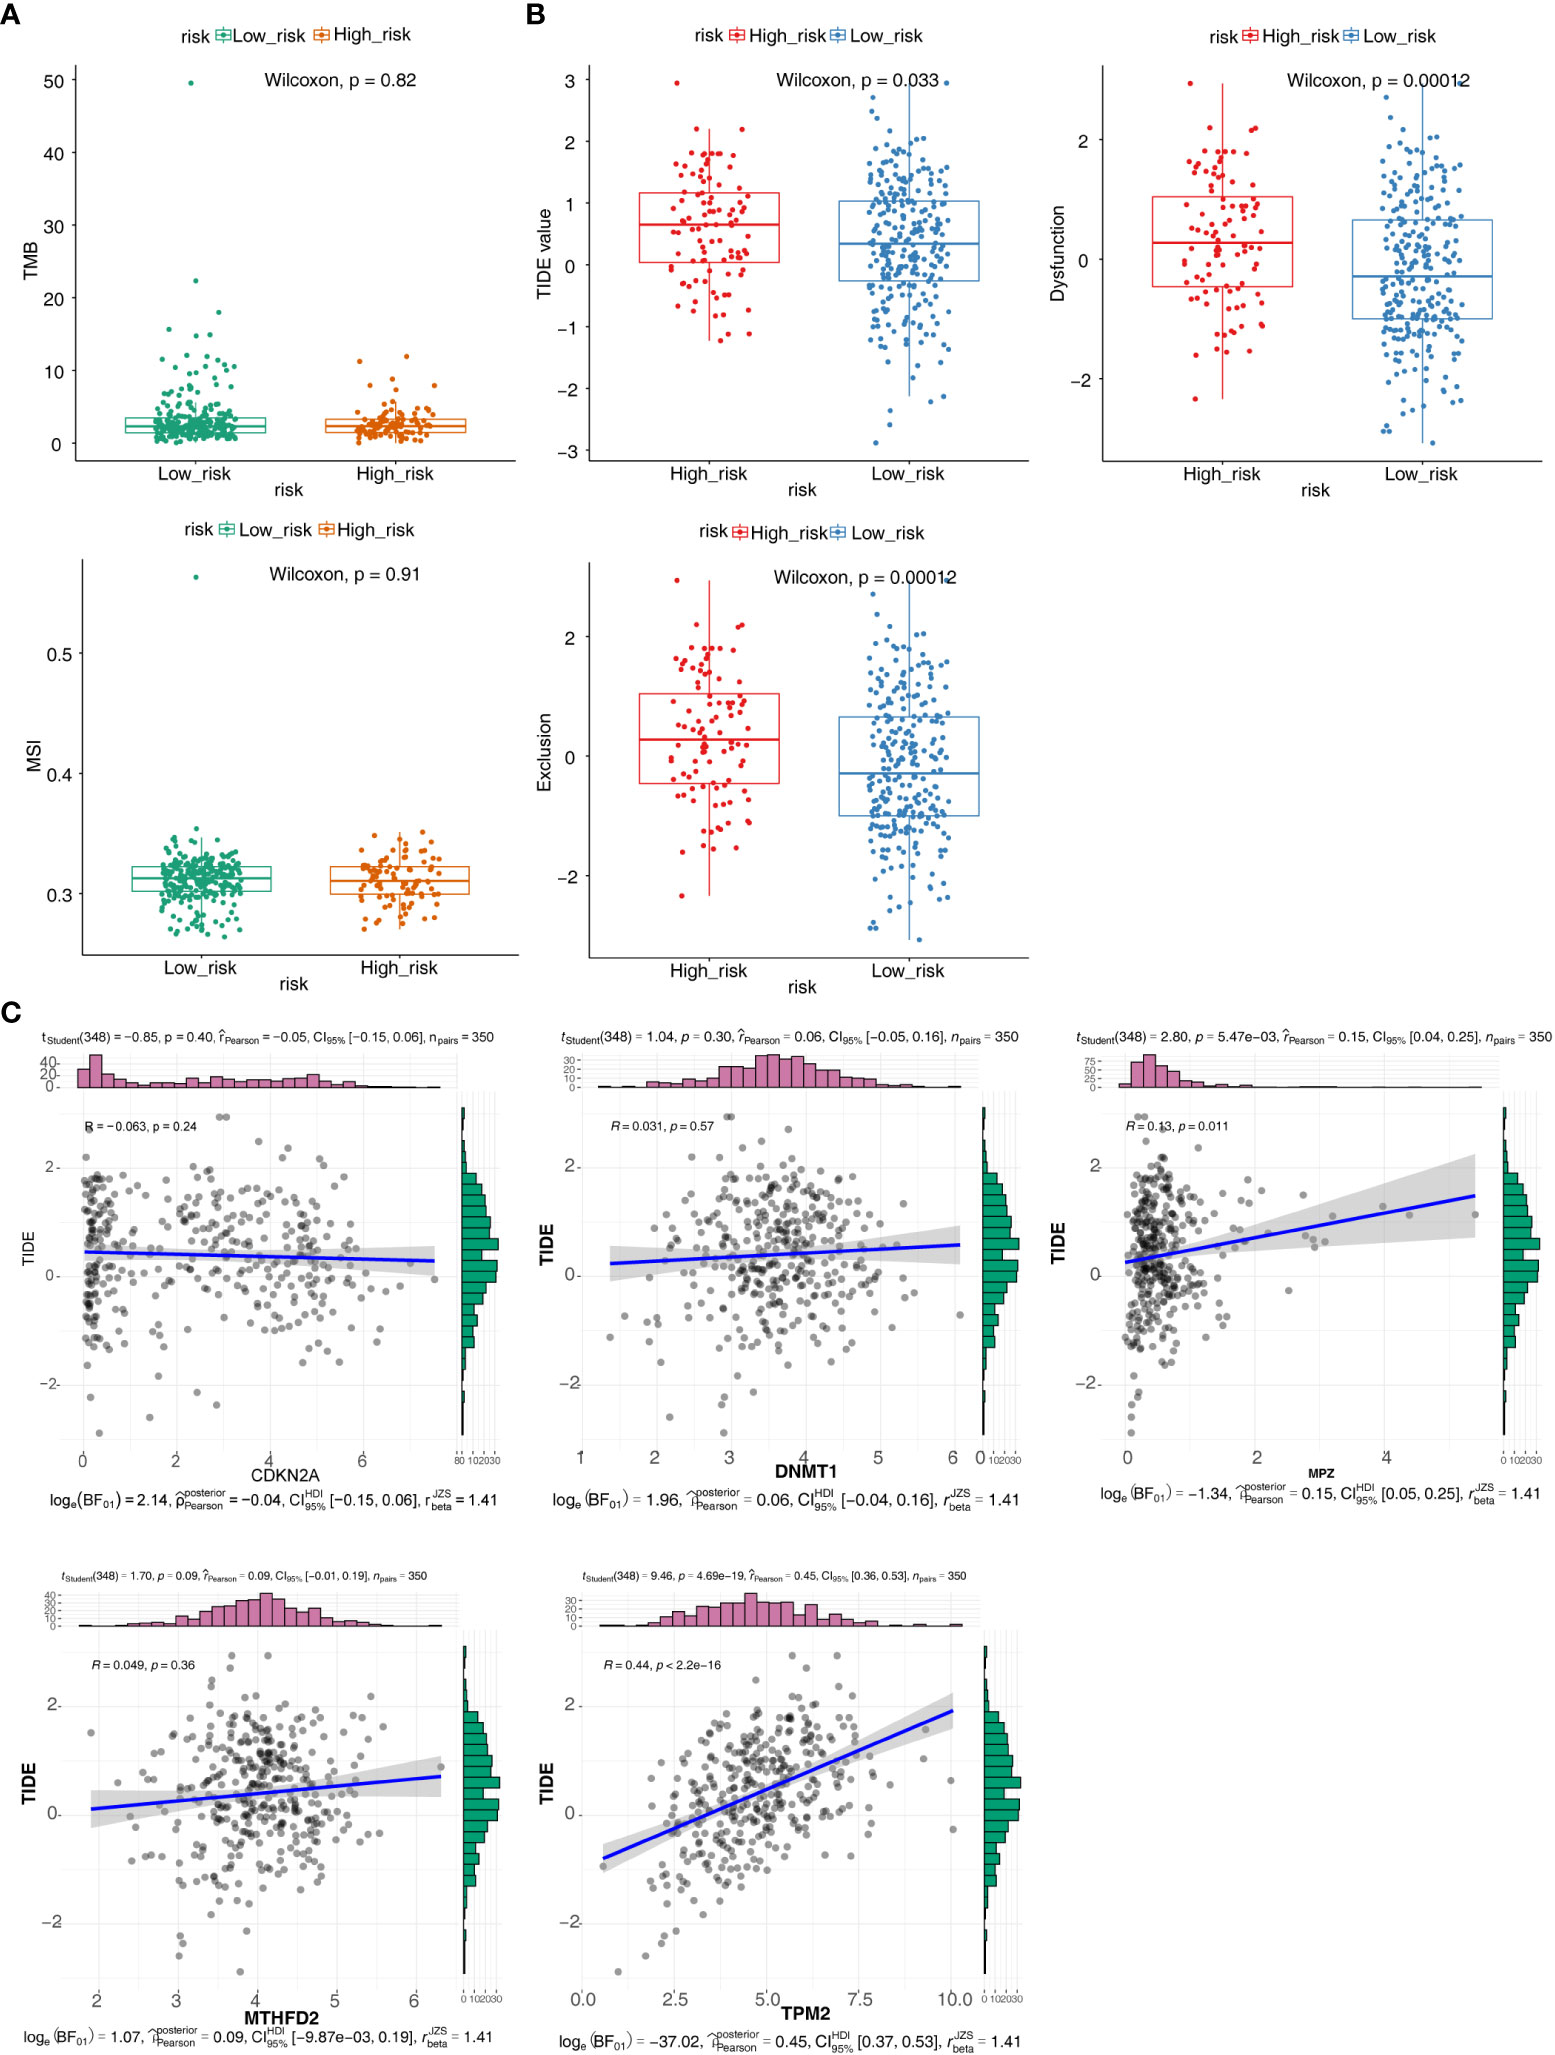
Figure 6 Immunotherapy responsiveness analysis. (A) Box plots for differences of the TMB and MSI values in high- and low-risk groups. (B) Box plots for differences of TIDE values, Dysfunction values and Exclusion scores in high- and low-risk groups. (C) Correlation scatter plots of TIDE scores with different prognostic risk model genes.
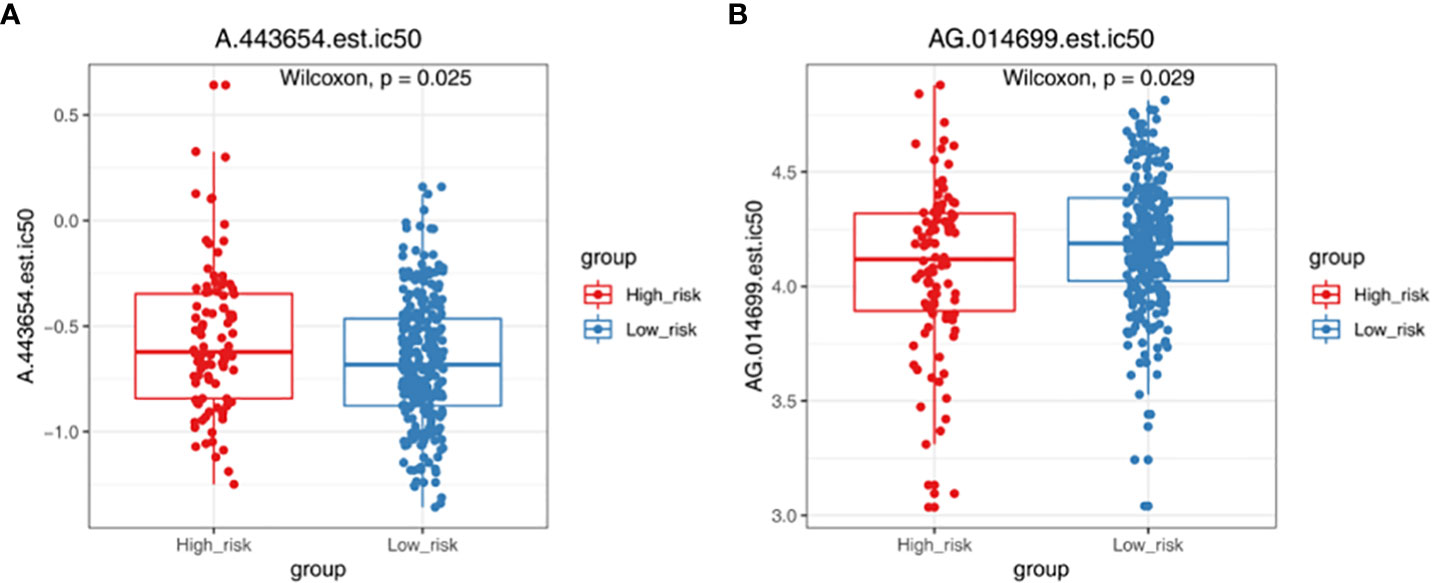
Figure 7 Chemotherapy responsiveness analysis. Box plots demonstrating the half maximal inhibitory concentration (IC50) values of A.443654 (A) and AG.014699 (B) in high- and low-risk groups.
Based on the qPCR verification results, it can be seen that DNMT1 and MTHFD2 were up-regulated in Case (HNSC). Besides, we could see that MPZ was down-regulated in Case, and the validation results are consistent with the above analysis (Figure 8, Table 4).
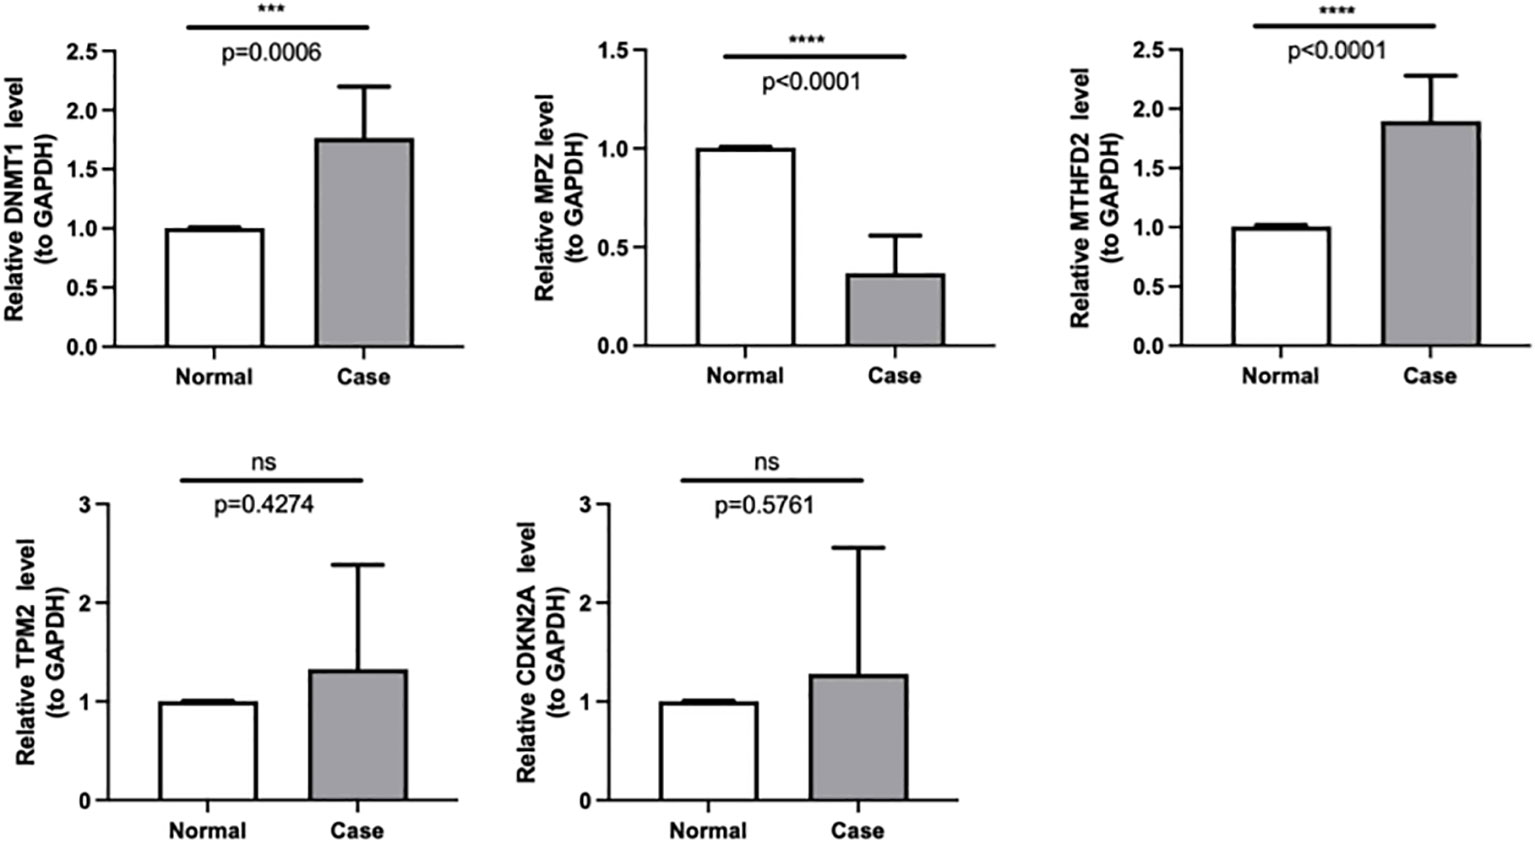
Figure 8 The expressions of DNMT1, MPZ, TPM2, CDKN2A and MTHFD2 were identified by quantitative real-time PCR in case and normal samples. *** p < 0.001,**** p < 0.0001. "ns" means no significance.
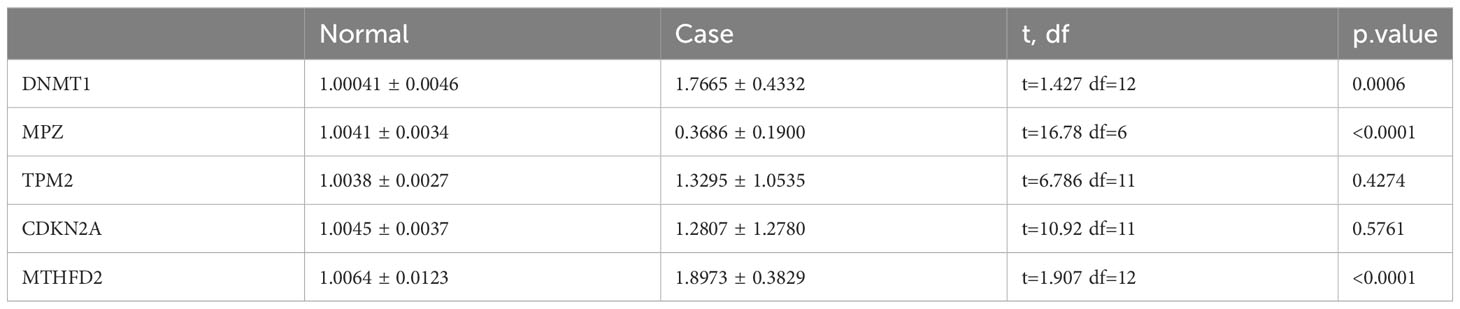
Table 4 Results for the expressions of DNMT1, MPZ, TPM2, CDKN2A and MTHFD2 in qRT-PCR.
In recent years, the study of abnormal metabolism of cancer cells has become the focus of attention and is considered to be a promising area for cancer therapy. Cancer cells are characterized by consuming glucose through Warburg metabolism (41), to provide energy for their growth and proliferation. Abnormal glucose metabolism is the most prominent feature of tumor metabolism (42, 43). A study has shown that HNSC is a highly glycolytic tumor (44), and abnormal glucose metabolism is an important biological factor for the diagnosis and treatment of HNSC (45). A previous study confirmed that GMRGs such as PKM2 (pyruvate kinase) and PGK1 (phosphoglycerate kinase 1) were up-regulated in gastric cancer cell lines (46). So far, unfortunately, the role of glucose metabolism-related genes in HNSC is unclear.
In order to clarify the prognostic biomarkers related to glucose metabolism in HNSC, this study screened 605 GMRGs based on the existing HNSC gene data, and finally identified 5 key prognostic genes that may be prognostic markers or potential therapeutic targets in HNSC (MTHFD2, CDKN2A, TPM2, MPZ, and DNMT1). The mechanism of action of these five genes in tumors is summarized as follows. Methylenetetrahydrofolate dehydrogenase 2 (MTHFD2) predominantly localizes within the mitochondria and efficiently drives the folate cycle in embryonic tissues to sustain cellular proliferation. Conversely, in most adult tissues, MTHFD2 exhibits minimal to negligible expression. This enzyme possesses both dehydrogenase and cyclohydrolase activities (47). It catalyzes the conversion of CH2-tetrahydrofolic acid (CH2-THF) into 10 CHO-THF, while simultaneously converting oxidized nicotinamide adenine dinucleotide phosphate [nicotinamide adenine dinucleotide phosphate, NAD(P)+] into NAD(P)H, thus facilitating one-carbon metabolic reactions (48). It catalyzes the conversion of CH2-tetrahydrofolic acid (CH2-THF) into 10 CHO-THF, while simultaneously converting oxidized nicotinamide adenine dinucleotide phosphate [nicotinamide adenine dinucleotide phosphate, NAD(P)+] into NAD(P)H, thus facilitating one-carbon metabolic reactions (49). Studies have revealed its reactivation in diverse tumor types, and this phenomenon correlates with adverse patient prognoses (50–56). Cyclin-dependent kinase inhibitor 2A (CDKN2A), an essential tumor suppressor gene, localizes to the 21 region of human chromosome 9 (57). As a member of the cell cycle-dependent kinase inhibitor gene family, CDKN2A directly regulates the cell cycle, thus controlling cell proliferation and division. It serves as a critical tumor suppressor in various human malignancies, including colorectal cancer, exerting its preventive role by inducing cell growth arrest and senescence (58). However, homozygous deletion of CDKN2A is observed in 50% of human tumor cell lines. Its inactivation leads to malignant cell proliferation and the development of malignant tumors. Differential expression of the CDKN2A gene is evident in a variety of tumor tissues, with abnormal levels observed in tumor patients. Moreover, CDKN2A expression correlates with clinicopathological characteristics and patient prognosis (59). Tropomyosins (TPM) are actin-binding proteins that are expressed in all eukaryotes, and vertebrates have Four TPM genes containing TPM1, TPM2, TPM3, and TPM4. Recently, a large cohort study has identified TPM2 as a prognostic marker for colorectal cancer things. In colorectal cancer cell lines, the study found that TPM2 down-regulation can promote tumor proliferation and migration, whereas TPM2 over-expression attenuates the malignant phenotype of tumor cells (60). MPZ is a transmembrane protein consisting of 219 amino acids, which is a member of the immunoglobulin gene super family and has a single extracellular, transmembrane, and cytoplasmic domain (61). Recent studies have shown that MPZ is involved in the development of cancer development, report that the six cores of the MPZ are most likely to detect most clinically significant cancers but also detect many insignificant cancers (62). Most of the articles in MPZ are in the field of neuropathy, and there are few studies related to HNSC, which need to be further explored. DNA methyltransferase 1 (methyltransferase1, DNMT1) is a key gene of DNA methylation in mammalian genome epigenetic modification (63), it has the ability to regulate the cell cycle and regulate the expression of tumor suppressor genes, and plays a role in the formation of tumors, Progression, and metastasis. Poor prognosis was all related to the expression level of DNMT1. DNMT1 is highly expressed in a variety of tumors including lung cancer, leukemia, gastric cancer, and liver cancer (64), and the expression of DNMT1 in pancreatic cancer tumor tissue is significantly correlated with the degree of tumor malignancy (65). Thus, these genes play an important role in the development of cancer, which is consistent with the consensus that glucose metabolism plays a role in tumors.
Functional enrichment analyzes revealed the potential biological mechanism of the involved GMRGs. GSEA showed that genes in two groups were mainly enriched in epidermis development, oxidative phosphorylation, and T cell receptor path signaling. T cell receptor signaling pathway plays an important role in T cell mediated immune response, its hyperactivation can lead to autoimmune diseases. On the other hand, defects in TCR signaling can lead to immune deficiency, that contribute to tumor escape (66). As one of the cancer signals, oxidative phosphorylation supports the development of a variety of cancers (67, 68).
Abnormal metabolism is inextricably linked to a dysfunctional immune system in cancer cells (69, 70). Accumulating evidence suggests that immune cell dysfunction in the HNSC microenvironment promotes immunosuppression, correlates with tumor survival and progression, tumor-infiltrating immune cells are dependent on glucose, Impaired immune cell metabolism in the tumor microenvironment contributes to tumor immunological evasion (71, 72). This study showed that there were significant differences in B cells memory, Macrophages M0, Macrophages M2 and Dendritic cells resting in high and low risk groups. Compared with the low-risk group, the infiltration rate of Dendritic resting cells was lower and the infiltration rate of Macrophages M2 was higher in the high-risk group. Dendritic cells are the most critical professional antigen-presenting cells. In the tumor microenvironment, the function and activity of DCs are changed to induce the expansion of regulatory T cells, and the maturation of DCs depends on glycolysis, and the glucose competition of tumor cells will inhibit the activation of DCs (73). Increased infiltration of activated DCs in various tumors is associated with prolonged survival (74–76). Previous studies believed that B cells could promote the occurrence of tumors by regulating the immune response (77). However, the role of memory B cell infiltration in tumor immune response is still unclear. Some studies have found that memory B cells in HNSC patients are significantly reduced. Memory B cells play an important role in tumor memory immune response, which may be due to tumor suppression of its immune environment, sex regulation, and promotion of tumor immune escape (78, 79). Monocytes can bind to a variety of chemokines and be recruited to tumor or inflammatory sites (80). Monocytes infiltrate tumors and differentiate into tumor-associated macrophages (81), tumor-associated dendritic cells, etc (82). It affects the tumor microenvironment through multiple mechanisms, inducing immune tolerance, angiogenesis, and tumor cell metastasis. Tumor-associated macrophages (tumor-associated macrophages, TAM), mainly manifested as M2 type to promote tumor progression through strong immunosuppression (83, 84). The high infiltration of M2 cells is associated with breast cancer, gastric cancer, and hodgkin lymph, and it is related to the poor survival of tumors such as tumors (85–87). According to the subtype of microenvironment, HNSC is divided into two types: active immune response and exhausted immune response. The exhausted immune response type is characterized by high M2 macrophage infiltration, activation of WNT/TGF-β pathway, and poor prognosis. Rich M1 macrophage enrichment, and rich tumor infiltrating lymphocytes are associated with sensitivity to immunotherapy, and usually have a better prognosis (88). Another study divided HNSC into three immune subtypes: ICA, ICB, and ICC. The ICA type is marked by the infiltration of high M1 macrophages, memory CD4 T cells, and CD8 T cells. The immune subtype has a better prognosis. ICB type cluster patients are characterized by markedly increased dendritic cell (DC), activated natural killer (NK) and follicular helper T cell densities and have an intermediate prognosis. Overall survival is shorter in patients with the ICC type, which is characterized by infiltration of stromal components and increased infiltration of M2 macrophage with immunosuppression, and decreased DC infiltration (89). This type is similar to the immune failure type in the previous study, consistent with the conclusions of this study. The results of immune infiltration analysis in this study also showed that TPM2 was positively correlated with macrophage M0 and M2, MTHFD2 was significantly negatively correlated with dendritic resting cells, and DNMT1 was significantly negatively correlated with macrophage M2 and dendritic resting cells. In this study, we found that GMRGs promoted the development of HNSC to some extent. Based on these five key predictors, this study constructed a pre-risk model, divided HNSC patients into high- and low-risk groups after scoring, and found that high-risk groups is associated with poorer prognosis of patients, and its prognostic value is verified, suggesting that the risk score feature can be used as an independent factor to predict the prognosis of patients. In addition, TMB plays an important role in tumors as an indicator of tumor mutational load, reflecting the degree of mutation in the genome of tumor cells, which is closely related to tumor response to immunotherapy and prognosis. But unfortunately, our results showed no difference in TMB between high and low risk groups.
Our study shows that GMRGs (MTHFD2, CDKN2A, TPM2, MPZ and DNMT1) may be a valuable biomarker in the diagnosis of HNSC. We also demonstrate the potential association of MTHFD2, CDKN2A, TPM2, MPZ and DNMT1 and infiltrating immune cells, its important role in the development of HNSC, thereby providing a new insight into the prevention and treatment of HNSC. Despite the demonstrated utility of our model in prognosticating HNSC patients and aiding treatment decisions, our investigation has certain limitations. Primarily, our analysis hinges on data sourced from public databases, which could introduce disparities between predicted outcomes and real-world scenarios. As a result, validation of our model’s clinical effectiveness necessitates the acquisition of prospective clinical information and post-immunotherapy sequencing data. Additionally, the uniqueness of each HNSC patient may influence the characteristics of the GMRGs. To surmount these constraints and bolster the resilience of our model, novel approaches and continued research endeavors are imperative.
The original contributions presented in the study are included in the article/Supplementary Material. Further inquiries can be directed to the corresponding author.
The studies involving humans were approved by the Ethics Committee of Chongqing General Hospital (Ethics No. KYS2021-053-01). The studies were conducted in accordance with the local legislation and institutional requirements. The participants provided their written informed consent to participate in this study.
YL and ZL conceived the study. YL, NL and XZ drafted the manuscript. LZ and WW performed the literature search and collected the data. YL and JH analyzed and visualized the data. YL and NL completed in vitro experiments. ZL helped with the final revision of this manuscript. All authors contributed to the article and approved the submitted version.
The authors declare that the research was conducted in the absence of any commercial or financial relationships that could be construed as a potential conflict of interest.
All claims expressed in this article are solely those of the authors and do not necessarily represent those of their affiliated organizations, or those of the publisher, the editors and the reviewers. Any product that may be evaluated in this article, or claim that may be made by its manufacturer, is not guaranteed or endorsed by the publisher.
The Supplementary Material for this article can be found online at: https://www.frontiersin.org/articles/10.3389/fendo.2023.1245629/full#supplementary-material
1. Gong X, Chi H, Xia Z, Yang G, Tian G. Advances in HPV-associated tumor management: Therapeutic strategies and emerging insights. J Med Virol (2023) 95:e28950. doi: 10.1002/jmv.28950
2. Bray F, Ferlay J, Soerjomataram I, Siegel RL, Torre LA, Jemal A. Global cancer statistics 2018: GLOBOCAN estimates of incidence and mortality worldwide for 36 cancers in 185 countries. CA: Cancer J Clin (2018) 68:394–424. doi: 10.3322/caac.21492
3. Ferlay J, Colombet M, Soerjomataram I, Mathers C, Parkin DM, Piñeros M, et al. Estimating the global cancer incidence and mortality in 2018: GLOBOCAN sources and methods. Int J Cancer (2019) 144:1941–53. doi: 10.1002/ijc.31937
4. Posner M, Vermorken JB. Induction therapy in the modern era of combined-modality therapy for locally advanced head and neck cancer. Semin Oncol (2008) 35:221–8. doi: 10.1053/j.seminoncol.2008.03.007
5. Fakhri S, Moradi SZ, Farzaei MH, Bishayee A. Modulation of dysregulated cancer metabolism by plant secondary metabolites: A mechanistic review. Semin Cancer Biol (2022) 80:276–305. doi: 10.1016/j.semcancer.2020.02.007
6. Dauer P, Lengyel E. New roles for glycogen in tumor progression. Trends Cancer (2019) 5:396–9. doi: 10.1016/j.trecan.2019.05.003
7. Zhang Q, Wang J, Yadav DK, Bai X, Liang T. Glucose metabolism: the metabolic signature of tumor associated macrophage. Front Immunol (2021) 12:702580. doi: 10.3389/fimmu.2021.702580
8. Ždralević M, Vučetić M, Daher B, Marchiq I, Parks SK, Pouysségur J. Disrupting the 'Warburg effect' re-routes cancer cells to OXPHOS offering a vulnerability point via 'ferroptosis'-induced cell death. Adv Biol Regul (2018) 68:55–63. doi: 10.1016/j.jbior.2017.12.002
9. Fu Y, Wang D, Wang H, Cai M, Li C, Zhang X, et al. TSPO deficiency induces mitochondrial dysfunction, leading to hypoxia, angiogenesis, and a growth-promoting metabolic shift toward glycolysis in glioblastoma. Neuro-oncology (2020) 22:240–52. doi: 10.3390/cancers15041158
10. Chen C, Shi Y, Li Y, He ZC, Zhou K, Zhang XN, et al. A glycolysis-based ten-gene signature correlates with the clinical outcome, molecular subtype and IDH1 mutation in glioblastoma. J Genet Genomics = Yi Chuan xue bao (2017) 44:519–30. doi: 10.1016/j.jgg.2017.05.007
11. Gupta S, Roy A, Dwarakanath BS. Metabolic cooperation and competition in the tumor microenvironment: implications for therapy. Front Oncol (2017) 7:68. doi: 10.3389/fonc.2017.00068
12. Koczula KM, Ludwig C, Hayden R, Cronin L, Pratt G, Parry H, et al. Metabolic plasticity in CLL: adaptation to the hypoxic niche. Leukemia (2016) 30:65–73. doi: 10.1038/leu.2015.187
13. Lin X, Xiao Z, Chen T, Liang SH, Guo H. Glucose metabolism on tumor plasticity, diagnosis, and treatment. Front Oncol (2020) 10:317. doi: 10.3389/fonc.2020.00317
14. Chi H, Xie X, Yan Y, Peng G, Strohmer DF, Lai G, et al. Natural killer cell-related prognosis signature characterizes immune landscape and predicts prognosis of HNSCC. Front Immunol (2022) 13:1018685. doi: 10.3389/fimmu.2022.1018685
15. Chi H, Jiang P, Xu K, Zhao Y, Song B, Peng G, et al. A novel anoikis-related gene signature predicts prognosis in patients with head and neck squamous cell carcinoma and reveals immune infiltration. Front Genet (2022) 13:984273. doi: 10.3389/fgene.2022.984273
16. Wang X, Zhao Y, Strohmer DF, Yang W, Xia Z, Yu C. The prognostic value of MicroRNAs associated with fatty acid metabolism in head and neck squamous cell carcinoma. Front Genet (2022) 13:983672. doi: 10.3389/fgene.2022.983672
17. Chi H, Yang J, Peng G, Zhang J, Song G, Xie X, et al. Circadian rhythm-related genes index: A predictor for HNSCC prognosis, immunotherapy efficacy, and chemosensitivity. Front Immunol (2023) 14:1091218. doi: 10.3389/fimmu.2023.1091218
18. Peng G, Chi H, Gao X, Zhang J, Song G, Xie X, et al. Identification and validation of neurotrophic factor-related genes signature in HNSCC to predict survival and immune landscapes. Front Genet (2022) 13:1010044. doi: 10.3389/fgene.2022.1010044
19. Zhao S, Chi H, Ji W, He Q, Lai G, Peng G, et al. A bioinformatics-based analysis of an anoikis-related gene signature predicts the prognosis of patients with low-grade gliomas. Brain Sci 12 (2022) 10:1349. doi: 10.20944/preprints202209.0342.v1
20. Wang Q, Liu Y, Li Z, Tang Y, Long W, Xin H, et al. Establishment of a novel lysosomal signature for the diagnosis of gastric cancer with in-vitro and in-situ validation. Front Immunol (2023) 14:1182277. doi: 10.3389/fimmu.2023.1182277
21. Chi H, Peng G, Wang R, Yang F, Xie X, Zhang J, et al. Cuprotosis programmed-cell-death-related lncRNA signature predicts prognosis and immune landscape in PAAD patients. Cells (2022) 11:3436. doi: 10.3390/cells11213436
22. Huang X, Liu Y, Wang Q, Rehman HM, Horváth D, Zhou S, et al. Brief literature review and comprehensive bioinformatics analytics unravel the potential mechanism of curcumin in the treatment of periodontitis. BMC Oral Health (2023) 23:469. doi: 10.1186/s12903-023-03181-x
23. Zhang P, Pei S, Liu J, Zhang X, Feng Y, Gong Z, et al. Cuproptosis-related lncRNA signatures: Predicting prognosis and evaluating the tumor immune microenvironment in lung adenocarcinoma. Front Oncol (2022) 12:1088931. doi: 10.3389/fonc.2022.1088931
24. Wang Q, Li Z, Zhou S, Li Z, Huang X, He Y, et al. NCAPG2 could be an immunological and prognostic biomarker: From pan-cancer analysis to pancreatic cancer validation. Front Immunol (2023) 14:1097403. doi: 10.3389/fimmu.2023.1097403
25. Liu Y, Zhou S, Wang L, Xu M, Huang X, Li Z, et al. Machine learning approach combined with causal relationship inferring unlocks the shared pathomechanism between COVID-19 and acute myocardial infarction. Front Microbiol (2023) 14:1153106. doi: 10.3389/fmicb.2023.1153106
26. Jin W, Yang Q, Chi H, Wei K, Zhang P, Zhao G, et al. Ensemble deep learning enhanced with self-attention for predicting immunotherapeutic responses to cancers. Front Immunol (2022) 13:1025330. doi: 10.3389/fimmu.2022.1025330
27. Chi H, Peng G, Yang J, Zhang J, Song G, Xie X, et al. Machine learning to construct sphingolipid metabolism genes signature to characterize the immune landscape and prognosis of patients with uveal melanoma. Front Endocrinol (Lausanne) (2022) 13:1056310. doi: 10.3389/fendo.2022.1056310
28. Chi H, Zhao S, Yang J, Gao X, Peng G, Zhang J, et al. T-cell exhaustion signatures characterize the immune landscape and predict HCC prognosis via integrating single-cell RNA-seq and bulk RNA-sequencing. Front Immunol (2023) 14:1137025. doi: 10.3389/fimmu.2023.1137025
29. Liu J, Zhang P, Yang F, Jiang K, Sun S, Xia Z, et al. Integrating single-cell analysis and machine learning to create glycosylation-based gene signature for prognostic prediction of uveal melanoma. Front Endocrinol (Lausanne) (2023) 14:1163046. doi: 10.3389/fendo.2023.1163046
30. Pei S, Zhang P, Chen H, Zhao S, Dai Y, Yang L, et al. Integrating single-cell RNA-seq and bulk RNA-seq to construct prognostic signatures to explore the role of glutamine metabolism in breast cancer. Front Endocrinol (Lausanne) (2023) 14:1135297. doi: 10.3389/fendo.2023.1135297
31. Zhao S, Chi H, Yang Q, Chen S, Wu C, Lai G, et al. Identification and validation of neurotrophic factor-related gene signatures in glioblastoma and Parkinson's disease. Front Immunol (2023) 14:1090040. doi: 10.3389/fimmu.2023.1090040
32. Zhao S, Zhang X, Gao F, Chi H, Zhang J, Xia Z, et al. Identification of copper metabolism-related subtypes and establishment of the prognostic model in ovarian cancer. Front Endocrinol (Lausanne) (2023) 14:1145797. doi: 10.3389/fendo.2023.1145797
33. Zhang P, Pei S, Gong Z, Ren Q, Xie J, Liu H, et al. The integrated single-cell analysis developed a lactate metabolism-driven signature to improve outcomes and immunotherapy in lung adenocarcinoma. Front Endocrinol (Lausanne) (2023) 14:1154410. doi: 10.3389/fendo.2023.1154410
34. Ritchie ME, Phipson B, Wu D, Hu Y, Law CW, Shi W, et al. limma powers differential expression analyses for RNA-sequencing and microarray studies. Nucleic Acids Res (2015) 43:e47. doi: 10.1093/nar/gkv007
35. Ito K, Murphy D. Application of ggplot2 to pharmacometric graphics. CPT: pharmacometrics Syst Pharmacol (2013) 2:e79. doi: 10.1038/psp.2013.56
36. Langfelder P, Horvath S. WGCNA: an R package for weighted correlation network analysis. BMC Bioinf (2008) 9:559. doi: 10.1186/1471-2105-9-559
37. Zhang B, Yuan Q, Zhang B, Li S, Wang Z, Liu H, et al. Characterization of neuroendocrine regulation- and metabolism-associated molecular features and prognostic indicators with aid to clinical chemotherapy and immunotherapy of patients with pancreatic cancer. Front Endocrinol (Lausanne) (2022) 13:1078424. doi: 10.3389/fendo.2022.1078424
38. Mosmann T. Rapid colorimetric assay for cellular growth and survival: application to proliferation and cytotoxicity assays. J Immunol Methods (1983) 65:55–63. doi: 10.1016/0022-1759(83)90303-4
39. Liu J, Yuan Q, Ren J, Li Y, Zhang Y, Shang D. Single-cell sequencing and bulk RNA sequencing reveal a cell differentiation-related multigene panel to predict the prognosis and immunotherapy response of hepatocellular carcinoma. Chin Med J (Engl) (2023) 136:485–7. doi: 10.1097/CM9.0000000000002393
40. Yuan Q, Ren J, Chen X, Dong Y, Shang D. Contributions and prognostic performances of m7G RNA regulators in pancreatic adenocarcinoma. Chin Med J (Engl) (2022) 135:2101–3. doi: 10.1097/CM9.0000000000002179
41. Vander Heiden MG, DeBerardinis RJ. Understanding the intersections between metabolism and cancer biology. Cell (2017) 168:657–69. doi: 10.1016/j.cell.2016.12.039
42. Hanahan D, Weinberg RA. Hallmarks of cancer: the next generation. Cell (2011) 144:646–74. doi: 10.1016/j.cell.2011.02.013
43. Yuan Q, Deng D, Pan C, Ren J, Wei T, Wu Z, et al. Integration of transcriptomics, proteomics, and metabolomics data to reveal HER2-associated metabolic heterogeneity in gastric cancer with response to immunotherapy and neoadjuvant chemotherapy. Front Immunol (2022) 13:951137. doi: 10.3389/fimmu.2022.951137
44. Chacon-Barahona JA, MacKeigan JP, Lanning NJ. Unique metabolic contexts sensitize cancer cells and discriminate between glycolytic tumor types. Cancers (2023) 15:1158. doi: 10.3390/cancers15041158
45. Fujima N, Sakashita T, Homma A, Hirata K, Shiga T, Kudo K, et al. Glucose metabolism and its complicated relationship with tumor growth and perfusion in head and neck squamous cell carcinoma. PloS One (2016) 11:e0166236. doi: 10.1371/journal.pone.0166236
46. Kim NS, Hahn Y, Oh JH, Lee JY, Oh KJ, Kim JM, et al. Gene cataloging and expression profiling in human gastric cancer cells by expressed sequence tags. Genomics (2004) 83:1024–45. doi: 10.1016/j.ygeno.2003.12.002
47. Christensen KE, Mackenzie RE. Mitochondrial methylenetetrahydrofolate dehydrogenase, methenyltetrahydrofolate cyclohydrolase, and formyltetrahydrofolate synthetases. Vit hormones (2008) 79:393–410. doi: 10.1016/S0083-6729(08)00414-7
48. Zhu Z, Leung GKK. More than a metabolic enzyme: MTHFD2 as a novel target for anticancer therapy? Front Oncol (2020) 10:658. doi: 10.3389/fonc.2020.00658
49. Nilsson R, Jain M, Madhusudhan N, Sheppard NG, Strittmatter L, Kampf C, et al. Metabolic enzyme expression highlights a key role for MTHFD2 and the mitochondrial folate pathway in cancer. Nat Commun (2014) 5:3128. doi: 10.1038/ncomms4128
50. Liu X, Huang Y, Jiang C, Ou H, Guo B, Liao H, et al. Methylenetetrahydrofolate dehydrogenase 2 overexpression is associated with tumor aggressiveness and poor prognosis in hepatocellular carcinoma. Digest liver Dis (2016) 48:953–60. doi: 10.1016/j.dld.2016.04.015
51. Lin H, Huang B, Wang H, Liu X, Hong Y, Qiu S, et al. MTHFD2 overexpression predicts poor prognosis in renal cell carcinoma and is associated with cell proliferation and vimentin-modulated migration and invasion. Cell Physiol Biochem (2018) 51:991–1000. doi: 10.1159/000495402
52. Noguchi K, Konno M, Koseki J, Nishida N, Kawamoto K, Yamada D, et al. The mitochondrial one-carbon metabolic pathway is associated with patient survival in pancreatic cancer. Oncol Lett (2018) 16:1827–34. doi: 10.3892/ol.2018.8795
53. Shi Y, Xu Y, Yao J, Yan C, Su H, Zhang X, et al. MTHFD2 promotes tumorigenesis and metastasis in lung adenocarcinoma by regulating AKT/GSK-3β/β-catenin signalling. J Cell Mol Med (2021) 25:7013–27. doi: 10.1111/jcmm.16715
54. Ju HQ, Lu YX, Chen DL, Zuo ZX, Liu ZX, Wu QN, et al. Modulation of redox homeostasis by inhibition of MTHFD2 in colorectal cancer: mechanisms and therapeutic implications. J Natl Cancer Instit (2019) 111:584–96. doi: 10.1093/jnci/djy160
55. Liu F, Liu Y, He C, Tao L, He X, Song H, et al. Increased MTHFD2 expression is associated with poor prognosis in breast cancer. Tumour Biol (2014) 35:8685–90. doi: 10.1007/s13277-014-2111-x
56. Cui X, Su H, Yang J, Wu X, Huo K, Jing X, et al. Up-regulation of MTHFD2 is associated with clinicopathological characteristics and poor survival in ovarian cancer, possibly by regulating MOB1A signaling. J Ovarian Res (2022) 15:23. doi: 10.1186/s13048-022-00954-w
57. Casula M, Budroni M, Cossu A, Ascierto PA, Mozzillo N, Canzanella S, et al. The susceptibility CDKN2 locus may have a role on prognosis of melanoma patients. Ann Oncol (2010) 21:1379–80. doi: 10.1093/annonc/mdq056
58. Collado M, Blasco MA, Serrano M. Cellular senescence in cancer and aging. Cell (2007) 130:223–33. doi: 10.1016/j.cell.2007.07.003
59. Massi D, Tomasini C, Senetta R, Paglierani M, Salvianti F, Errico ME, et al. Atypical Spitz tumors in patients younger than 18 years. J Am Acad Dermatol (2015) 72:37–46. doi: 10.1016/j.jaad.2014.09.049
60. Cui J, Cai Y, Hu Y, Huang Z, Luo Y, Kaz AM, et al. Epigenetic silencing of TPM2 contributes to colorectal cancer progression upon RhoA activation. Tumour Biol (2016) 37:12477–83. doi: 10.1007/s13277-016-5103-1
61. Shy ME, Jáni A, Krajewski K, Grandis M, Lewis RA, Li J, et al. Phenotypic clustering in MPZ mutations. Brain J Neurol (2004) 127:371–84. doi: 10.1093/brain/awh048
62. Haas GP, Delongchamps NB, Jones RF, Chandan V, Serio AM, Vickers AJ, et al. Needle biopsies on autopsy prostates: sensitivity of cancer detection based on true prevalence. J Natl Cancer Instit (2007) 99:1484–9. doi: 10.1093/jnci/djm153
63. Zhang ZM, Liu S, Lin K, Luo Y, Perry JJ, Wang Y, et al. Crystal structure of human DNA methyltransferase 1. J Mol Biol (2015) 427:2520–31. doi: 10.1016/j.jmb.2015.06.001
64. Zimmer-Bensch G. Diverse facets of cortical interneuron migration regulation - Implications of neuronal activity and epigenetics. Brain Res (2018) 1700:160–9. doi: 10.1016/j.brainres.2018.09.001
65. Peng DF, Kanai Y, Sawada M, Ushijima S, Hiraoka N, Kosuge T, et al. Increased DNA methyltransferase 1 (DNMT1) protein expression in precancerous conditions and ductal carcinomas of the pancreas. Cancer Sci (2005) 96:403–8. doi: 10.1111/j.1349-7006.2005.00071.x
66. Shah K, Al-Haidari A, Sun J, Kazi JU. T cell receptor (TCR) signaling in health and disease. Signal transduct target Ther (2021) 6:412. doi: 10.1038/s41392-021-00823-w
67. Ying H, DePinho RA. Cancer signaling: when phosphorylation meets methylation. Cell Res (2014) 24:1282–3. doi: 10.1038/cr.2014.103
68. Rao S, Mondragón L, Pranjic B, Hanada T, Stoll G, Köcher T, et al. AIF-regulated oxidative phosphorylation supports lung cancer development. Cell Res (2019) 29:579–91. doi: 10.1038/s41422-019-0181-4
69. Stienstra R, Netea-Maier RT, Riksen NP, Joosten LAB, Netea MG. Specific and complex reprogramming of cellular metabolism in myeloid cells during innate immune responses. Cell Metab (2017) 26:142–56. doi: 10.1016/j.cmet.2017.06.001
70. Kishton RJ, Sukumar M, Restifo NP. Metabolic regulation of T cell longevity and function in tumor immunotherapy. Cell Metab (2017) 26:94–109. doi: 10.1016/j.cmet.2017.06.016
71. Chang CH, Qiu J, O'Sullivan D, Buck MD, Noguchi T, Curtis JD, et al. Metabolic competition in the tumor microenvironment is a driver of cancer progression. Cell (2015) 162:1229–41. doi: 10.1016/j.cell.2015.08.016
72. Ho PC, Bihuniak JD, Macintyre AN, Staron M, Liu X, Amezquita R, et al. Phosphoenolpyruvate is a metabolic checkpoint of anti-tumor T cell responses. Cell (2015) 162:1217–28. doi: 10.1016/j.cell.2015.08.012
73. Leone RD, Powell JD. Metabolism of immune cells in cancer. Nat Rev Cancer (2020) 20:516–31. doi: 10.1038/s41568-020-0273-y
74. Malietzis G, Lee GH, Jenkins JT, Bernardo D, Moorghen M, Knight SC, et al. Prognostic value of the tumour-infiltrating dendritic cells in colorectal cancer: A systematic review. Cell communication adhesion (2015) 22:9–14. doi: 10.3109/15419061.2015.1036859
75. Truxova I, Kasikova L, Hensler M, Skapa P, Laco J, Pecen L, et al. Mature dendritic cells correlate with favorable immune infiltrate and improved prognosis in ovarian carcinoma patients. J immunother Cancer (2018) 6:139. doi: 10.1186/s40425-018-0446-3
76. Tran Janco JM, Lamichhane P, Karyampudi L, Knutson KL. Tumor-infiltrating dendritic cells in cancer pathogenesis. J Immunol (Baltimore Md.) (2015) 1950) 194:2985–91. doi: 10.4049/jimmunol.1403134
77. Dong HP, Elstrand MB, Holth A, Silins I, Berner A, Trope CG, et al. NK- and B-cell infiltration correlates with worse outcome in metastatic ovarian carcinoma. Am J Clin Pathol (2006) 125:451–8. doi: 10.1309/15B66DQMFYYM78CJ
78. Xiong J, Chi H, Yang G, Zhao S, Zhang J, Tran LJ, et al. Revolutionizing anti-tumor therapy: unleashing the potential of B cell-derived exosomes. Front Immunol (2023) 14:1188760. doi: 10.3389/fimmu.2023.1188760
79. Norouzian M, Mehdipour F, Balouchi Anaraki S, Ashraf MJ, Khademi B, Ghaderi A. Atypical memory and regulatory B cell subsets in tumor draining lymph nodes of head and neck squamous cell carcinoma correlate with good prognostic factors. Head Neck Pathol (2020) 14:645–56. doi: 10.1007/s12105-019-01095-1
80. Charo IF, Ransohoff RM. The many roles of chemokines and chemokine receptors in inflammation. New Engl J Med (2006) 354:610–21. doi: 10.1056/NEJMra052723
81. Franklin RA, Liao W, Sarkar A, Kim MV, Bivona MR, Liu K, et al. The cellular and molecular origin of tumor-associated macrophages. Sci (New York N.Y.) (2014) 344:921–5. doi: 10.1126/science.1252510
82. León B, Ardavín C. Monocyte-derived dendritic cells in innate and adaptive immunity. Immunol Cell Biol (2008) 86:320–4. doi: 10.1038/icb.2008.14
83. Anderson NR, Minutolo NG, Gill S, Klichinsky M. Macrophage-based approaches for cancer immunotherapy. Cancer Res (2021) 81:1201–8. doi: 10.1158/0008-5472.CAN-20-2990
84. Chen D, Zhang X, Li Z, Zhu B. Metabolic regulatory crosstalk between tumor microenvironment and tumor-associated macrophages. Theranostics (2021) 11:1016–30. doi: 10.7150/thno.51777
85. Zhao X, Qu J, Sun Y, Wang J, Liu X, Wang F, et al. Prognostic significance of tumor-associated macrophages in breast cancer: a meta-analysis of the literature. Oncotarget (2017) 8:30576–86. doi: 10.18632/oncotarget.15736
86. Yin S, Huang J, Li Z, Zhang J, Luo J, Lu C, et al. The prognostic and clinicopathological significance of tumor-associated macrophages in patients with gastric cancer: A meta-analysis. PloS One (2017) 12:e0170042. doi: 10.1371/journal.pone.0170042
87. Guo B, Cen H, Tan X, Ke Q. Meta-analysis of the prognostic and clinical value of tumor-associated macrophages in adult classical Hodgkin lymphoma. BMC Med (2016) 14:159. doi: 10.1186/s12916-016-0711-6
88. Chen YP, Wang YQ, Lv JW, Li YQ, Chua MLK, Le QT, et al. Identification and validation of novel microenvironment-based immune molecular subgroups of head and neck squamous cell carcinoma: implications for immunotherapy. Ann Oncol (2019) 30:68–75. doi: 10.1093/annonc/mdy470
Keywords: glucose metabolism, head and neck squamous cell carcinoma, immune microenvironment, therapeutic target, drug sensitivity, prognosis
Citation: Liu Y, Liu N, Zhou X, Zhao L, Wei W, Hu J and Luo Z (2023) Constructing a prognostic model for head and neck squamous cell carcinoma based on glucose metabolism related genes. Front. Endocrinol. 14:1245629. doi: 10.3389/fendo.2023.1245629
Received: 23 June 2023; Accepted: 21 September 2023;
Published: 09 October 2023.
Edited by:
Chenyu Sun, AMITA Health, United StatesReviewed by:
Rui Liang, Chongqing University, ChinaCopyright © 2023 Liu, Liu, Zhou, Zhao, Wei, Hu and Luo. This is an open-access article distributed under the terms of the Creative Commons Attribution License (CC BY). The use, distribution or reproduction in other forums is permitted, provided the original author(s) and the copyright owner(s) are credited and that the original publication in this journal is cited, in accordance with accepted academic practice. No use, distribution or reproduction is permitted which does not comply with these terms.
*Correspondence: Zhibin Luo, bHVvemhpYmluY3FAMTI2LmNvbQ==
†These authors have contributed equally to this work
Disclaimer: All claims expressed in this article are solely those of the authors and do not necessarily represent those of their affiliated organizations, or those of the publisher, the editors and the reviewers. Any product that may be evaluated in this article or claim that may be made by its manufacturer is not guaranteed or endorsed by the publisher.
Research integrity at Frontiers
Learn more about the work of our research integrity team to safeguard the quality of each article we publish.