 Ya Shao
 Longti Li2†
- 1Department of Health Management Center, TaiHe Hospital, Hubei University of Medicine, Shiyan, China
- 2Department of Nursing, TaiHe Hospital, Hubei University of Medicine, Shiyan, China
- 3Department of Gastroenterology, TaiHe Hospital, Hubei University of Medicine, Shiyan, China
Objective: The relationship between body composition and insulin resistance (IR) is controversial. This study aimed to thoroughly examine the correlation between adipose tissue, lean body mass, and IR as evaluated by the Homeostatic Model Assessment (HOMA-IR).
Methods: In this cross-sectional study, we utilized data from the National Health and Nutrition Examination Survey (NHANES) conducted between 2011 and 2018. Our study included 4981 subjects, and we employed multiple linear regression, smoothed curve fitting, threshold, and saturation effect analysis to investigate the relationship between lean body mass, visceral fat mass, and IR. Also, we used the lean body mass to visceral fat ratio (Log LM/VFM) as a proxy variable to analyze its association with IR alone.
Results: The study discovered a negative link between lean body mass and IR, but the visceral fat mass was positively correlated after correcting for covariates. A negative correlation was observed when the alternative variable Log LM/VFM was analyzed separately for its association with IR. This association was present regardless of whether the exposure variables were analyzed as continuous or categorical. The data analysis revealed a nonlinear relationship between Log LM/VFM and IR, as evidenced by the generalized additive model. In addition, a threshold effect with a critical value of 1.80 and a saturation effect with a critical point of 2.5 were also observed. Further subgroup analysis for sex, age, BMI, active levels, hypertension, and diabetes showed considerable robustness between the relationship of Log LM/VFM and IR.
Conclusion: Maintaining a proper ratio of lean body mass and visceral fat is beneficial for decreasing IR.
1 Introduction
Diabetes has become a significant threat to human health, continuously challenging healthcare systems worldwide (1). The prevalence of diabetes is increasing due to factors such as rapid socio-economic development, deepening urbanization, and the adoption of unhealthy lifestyles, including poor diets and sedentary behaviors (2, 3). According to the International Diabetes Federation (4), a staggering 537 million people worldwide already have diabetes, and by 2045 years that number will grow to 783 million. The prevalence among adults aged 20-79 is 10.5% and will reach 12.2% in 2045. Diabetes is a chronic, lifelong disease that causes ongoing damage to multiple organs and systems in the body, leading to various complications and an overall disease burden. Besides the conventional risk of cardiovascular disease, diabetes is also associated with an increased risk of death from cancer, dementia, and various infections (5).
In the development of diabetes, Insulin resistance (IR) is one of the key pathophysiologic players (6). IR is a pathological condition that impairs insulin-induced glucose uptake and utilization in insulin-sensitive tissues (7). IR states result in the inhibition of adipose tissue catabolism, impaired glucose uptake in muscle, and inhibition of gluconeogenesis in the liver, ultimately leading to various metabolic diseases (8). Numerous studies have established a strong correlation between IR and the development or adverse outcomes of metabolic disorders, including coronary artery disease (9), heart failure (10), cardiovascular disease (11), diabetes (12), and hypertension (13).
Researchers have conducted extensive studies regarding the influencing factors related to IR, of which obesity is a vital link (14, 15). Obesity can lead to chronic inflammation of multiple organs and tissues throughout the body, increasing the risk of many diseases, especially IR (16). When evaluating obesity, the most commonly used indicator is body mass index (BMI). However, it does not provide a valid assessment of the distribution of muscle and fat throughout the body, making it difficult to assess the health risks associated with obesity comprehensively (17). In particular, the mortality rate observed in overweight and obese people with cardiovascular disease was lower than in normal-weight patients, known as the obesity paradox (18).
New epidemiologic studies have shown that precisely measured body composition correlates more strongly with cardiovascular disease than BMI. Researchers then used the ratio of fat to muscle to assess the distribution of muscle and fat. It can be used as a marker of sarcopenic obesity to assess cardiometabolic risk (19). In a study conducted by Yu et al., it was found that the fat-to-muscle ratio had a J-shaped correlation with all-cause mortality within the UK Biobank cohort population (20). Seo et al. discovered a significant correlation between the fat-to-muscle ratio, metabolic syndrome, and IR (21). However, recent studies have shown that not all fat in the body is harmful. Subcutaneous and lower body (buttock and leg) adipose tissue may be protective (22, 23), while visceral fat accumulation may pose significant health problems (24). Thus, the fat-to-muscle ratio marker may ignore health risks that differ between different fats in human tissues. Therefore, we used a novel index, lean body mass to visceral fat mass ratio, to assess its correlation with IR.
2 Materials and methods
2.1 Study design and participants
This cross-sectional study used data from the National Health and Nutrition Examination Survey (NHANES), a research program investigating people’s nutrition and health status in the United States. The survey has been ongoing since the 1960s and involves standardized surveys, physical examinations, laboratory tests, and other methods to gather health-related indicators from the population. The survey was conducted on a 2-year cycle using a multistage probability sampling design for the U.S. sample. Within each survey cycle, approximately 30 counties were selected for interviews from the approximately 3,000 counties in the United States. This study utilized data from 2011 to 2018, as only these cycles collected information on visceral fat mass. The National Center for Health Statistics Institutional Review Board of the United States approved the survey, and informed consent was obtained from all NHANES participants before implementation. People older than 18 years who have completed dual-energy X-ray absorptiometry will be included in this study. Individuals with tumors, lacking visceral fat and lean body mass information, and those unable to calculate HOMA-IR variables (fasting blood glucose and plasma insulin) were excluded. The final sample size included 4981 study subjects, 2542 men and 2349 women, and an average age of 37.58 ± 12.30 years. The selection process is illustrated in Figure 1.
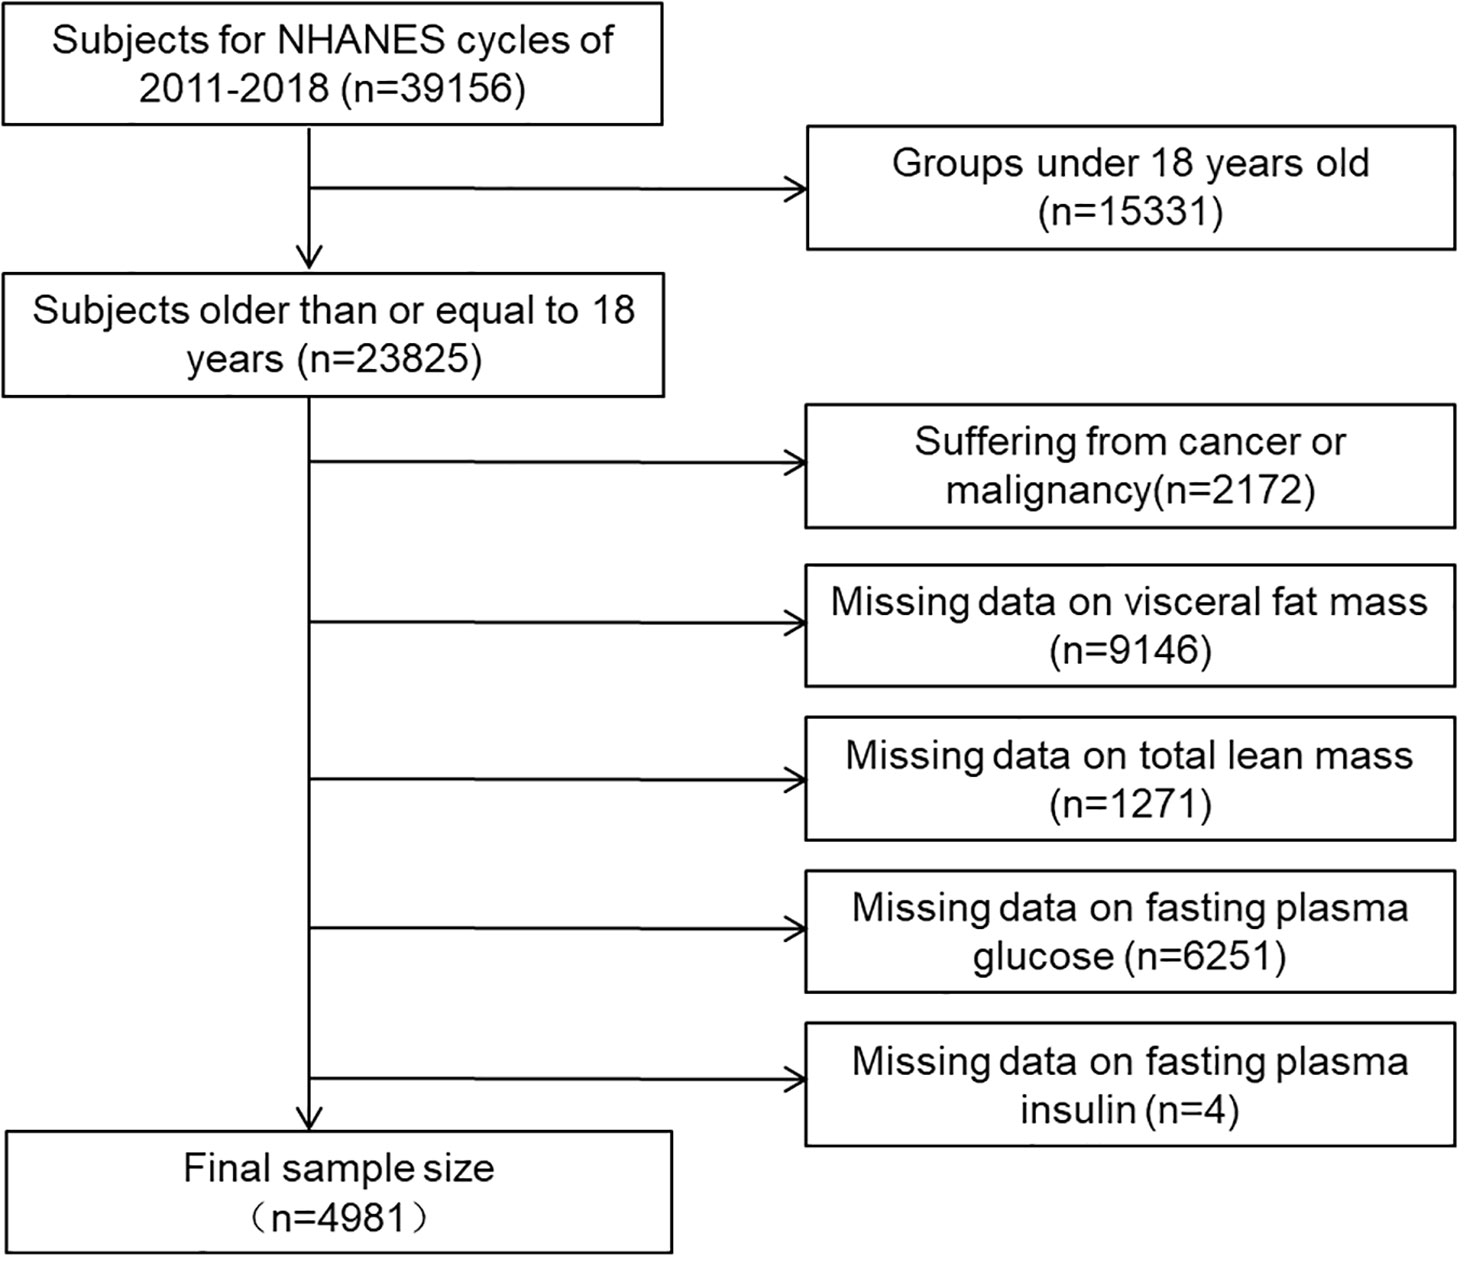
Figure 1 Flow chart for the selection of subjects.
2.2 Exposure and outcome variables
This study used the lean body mass to visceral adiposity mass ratio as an exposure variable. Dual-energy X-ray was employed to determine these variables, a criteria method for assessing body composition and providing insight into the distribution of muscle and fat throughout the body. The Hologic APEX version 4.0 software was used to analyze the data from the whole-body scan. Before the examination began, the subject was required to remove the metal objects from his body. Exclusions were made for pregnant individuals, those using radiology contrast agents within seven days, and those who weighed more than 450 pounds or were taller than 6 feet 5 inches. All examinations were completed by trained and certified radiologic technologists, and each participant’s scan information was reviewed and analyzed by an independent quality control center of the NHANES (25). Body composition, anthropometric measurements, and blood specimen collection were completed at the mobile examination center, which took 40 minutes to 4 hours per subject.
In this study, the outcome variable was IR, and the participants’ IR status was assessed using the Homeostatic Model Assessment for IR (HOMA-IR), a method widely used for quantifying IR. This method involves using the following formula to calculate HOMA-IR: fasting glucose (mg/dL) multiplied by fasting insulin (μU/mL) divided by 405 (26). These fasting tests require a 9-hour fast or more, and participants have blood specimens collected in a mobile screening vehicle. Blood specimens were transported to an independent testing laboratory for testing. Detailed procedures for collecting and testing blood specimens were described in the NHANES Laboratory Operations Manual (27).
2.3 Covariates
We used general demographic information on participants, including sex, age, race, marital status, educational attainment, poverty income ratio (PIR), anthropometric measurements (BMI, waist circumference), and lifestyle status, including activity, smoking, and alcohol consumption. Trained health technicians measured anthropometric data at mobile screening centers following standard procedures (28).
BMI was calculated as weight in kilograms divided by the square of height in meters. Waist circumference was measured bilaterally using a tape measure at the level of the superior iliac crest. Physical activity was evaluated using a standardized questionnaire. Participants were asked to report the number of days they engaged in various activities in the previous week and the average number of minutes per day spent on these activities. According to the relevant guidelines (29), physical activity levels were categorized as active, inactive, and completely inactive. “Active” was defined as >75 minutes of vigorous or >150 minutes of moderate-intensity weekly exercise. “Inactivity” includes physical activity that does not meet the above criteria. “Completely inactive” refers to a physically inactive person. Smoking was categorized into three categories: never, former, and current. Never-smokers were individuals who had smoked no more than 100 cigarettes in their lifetime. The former were those who had smoked 100 or more in their lifetime but were currently abstaining from smoking. On the other hand, current smokers were defined as those who had smoked 100 or more in their lifetime and were currently smoking. Alcohol consumption was determined by a cut-off of >12 drinks per year, and no alcohol consumption was defined as consuming less than 12 drinks per year.
In addition, we examined the impact of underlying chronic diseases such as hypertension and diabetes. Hypertension was described as previously diagnosed hypertension, use of antihypertensive medication, or non-same day, systolic blood pressure ≥140 mm Hg or diastolic blood pressure ≥90 mm Hg measured on three or more occasions. Diabetes was defined as a previous diagnosis, glucose-lowering medication or insulin use, fasting glucose ≥126 mg/dL, 2-hour OGTT ≥200 mg/dL, or HbA1c ≥6.5%. In addition, we considered the effects of other covariates, including total cholesterol, triglycerides, alanine aminotransferase (ALT), and blood uric acid.
2.4 Statistical analysis
Continuous variables were reported using the mean and standard deviation or the median and interquartile range. Categorical variables were presented as the number of cases and percentages. To compare differences in quartiles based on HOMA-IR, analysis of variance was used for continuous data, and the chi-square test was used for categorical variables. Mobile Examination Centre (MEC) test weights were employed in the analysis to improve data representativeness. Linear regression was utilized to examine the correlation between exposure and outcome variables. As the ratio of lean body mass to visceral fat mass and the HOMA-IR did not follow a Gaussian distribution, Log 10 transformations were employed, and the alternative variables Log LM/VFM, and Log HMOA-IR were used, respectively.
In the regression analysis, three models were considered. These were crude model, which did not adjust for any confounders; model 1, which adjusted for sex, age, and race; and model 2, which further accounted for marital status, education, PIR, BMI, waist circumference, activity, smoking, alcohol consumption, hypertension, diabetes, total cholesterol, triglycerides, ALT, and blood uric acid based on model 1. A generalized additive model investigated the correlation between Log LM/VFM and Log HMOA-IR. In contrast, a piece-wise linear regression model was employed to analyze the threshold effect of Log LM/VFM on HOMA-IR. The study also included stratification by sex, age, BMI, activity, hypertension, and diabetes to examine their potential impact on the outcomes. The statistical analyses were performed using EmpowerStats (www.empowerstats.com) and R software (http://www.r-project.org).
3 Results
Table 1 displays the comprehensive characteristics of the research population. The participants were categorized into four groups based on the HOMA-IR quartiles. The comparison among the groups indicated noteworthy differences in age, race, marital status, education, PIR, alcohol consumption, hypertension, diabetes, waist circumference, BMI, cholesterol, triglyceride, ALT, blood uric acid, lean body, and visceral fat mass.
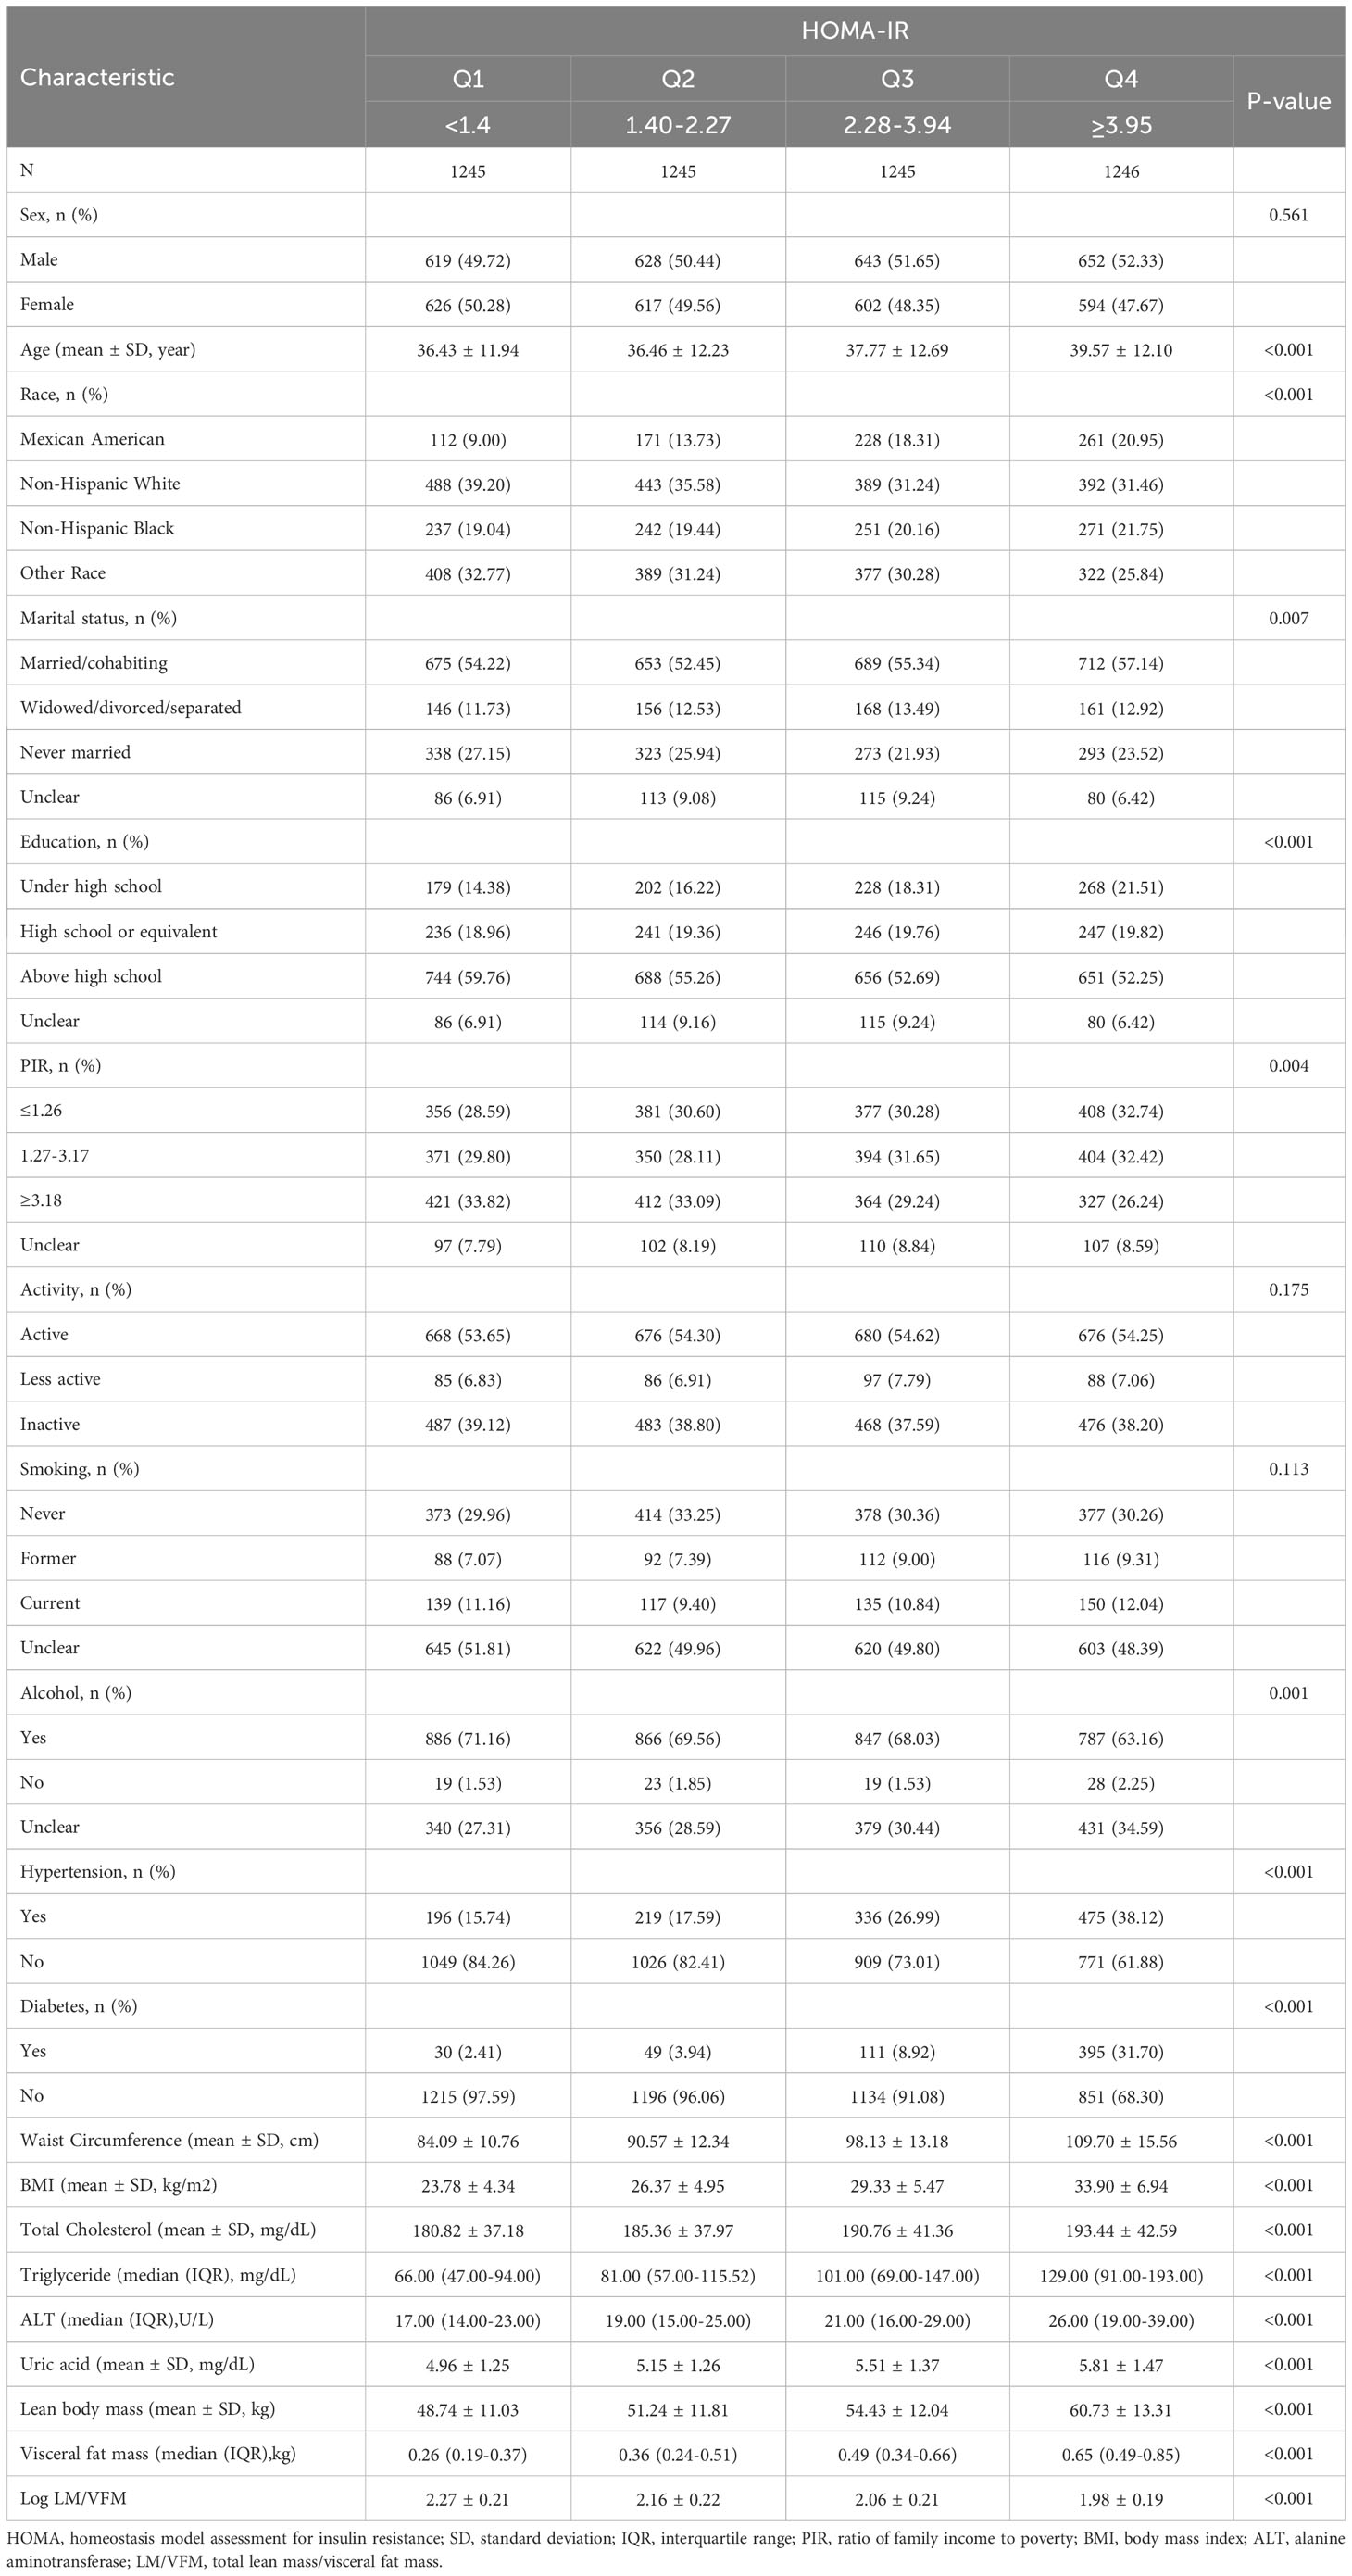
Table 1 Characteristics of participants.
3.1 Association of lean body mass to visceral fat mass ratio with IR
The results from the regression analysis are presented in Table 2. The results indicate that after adjusting for covariates, total lean body mass exhibited a negative association with HOMA-IR, both in its continuous (β =-0.03; 95% CI: -0.05, -0.02) and converted as a categorical variable. Specifically, the highest quartile of total lean mass was related to lower HOMA-IR (β=-0.10; 95% CI: -0.14, -0.06). When analyzed as a continuous variable, the study found a positive association between visceral fat mass and HOMA-IR (β = 0.08; 95% CI: 0.07, 0.09). Additionally, when visceral fat mass was considered a categorical variable, the highest quartile of visceral fat mass was associated with a higher level of HOMA-IR (β = 0.20; 95% CI: 0.17, 0.24).
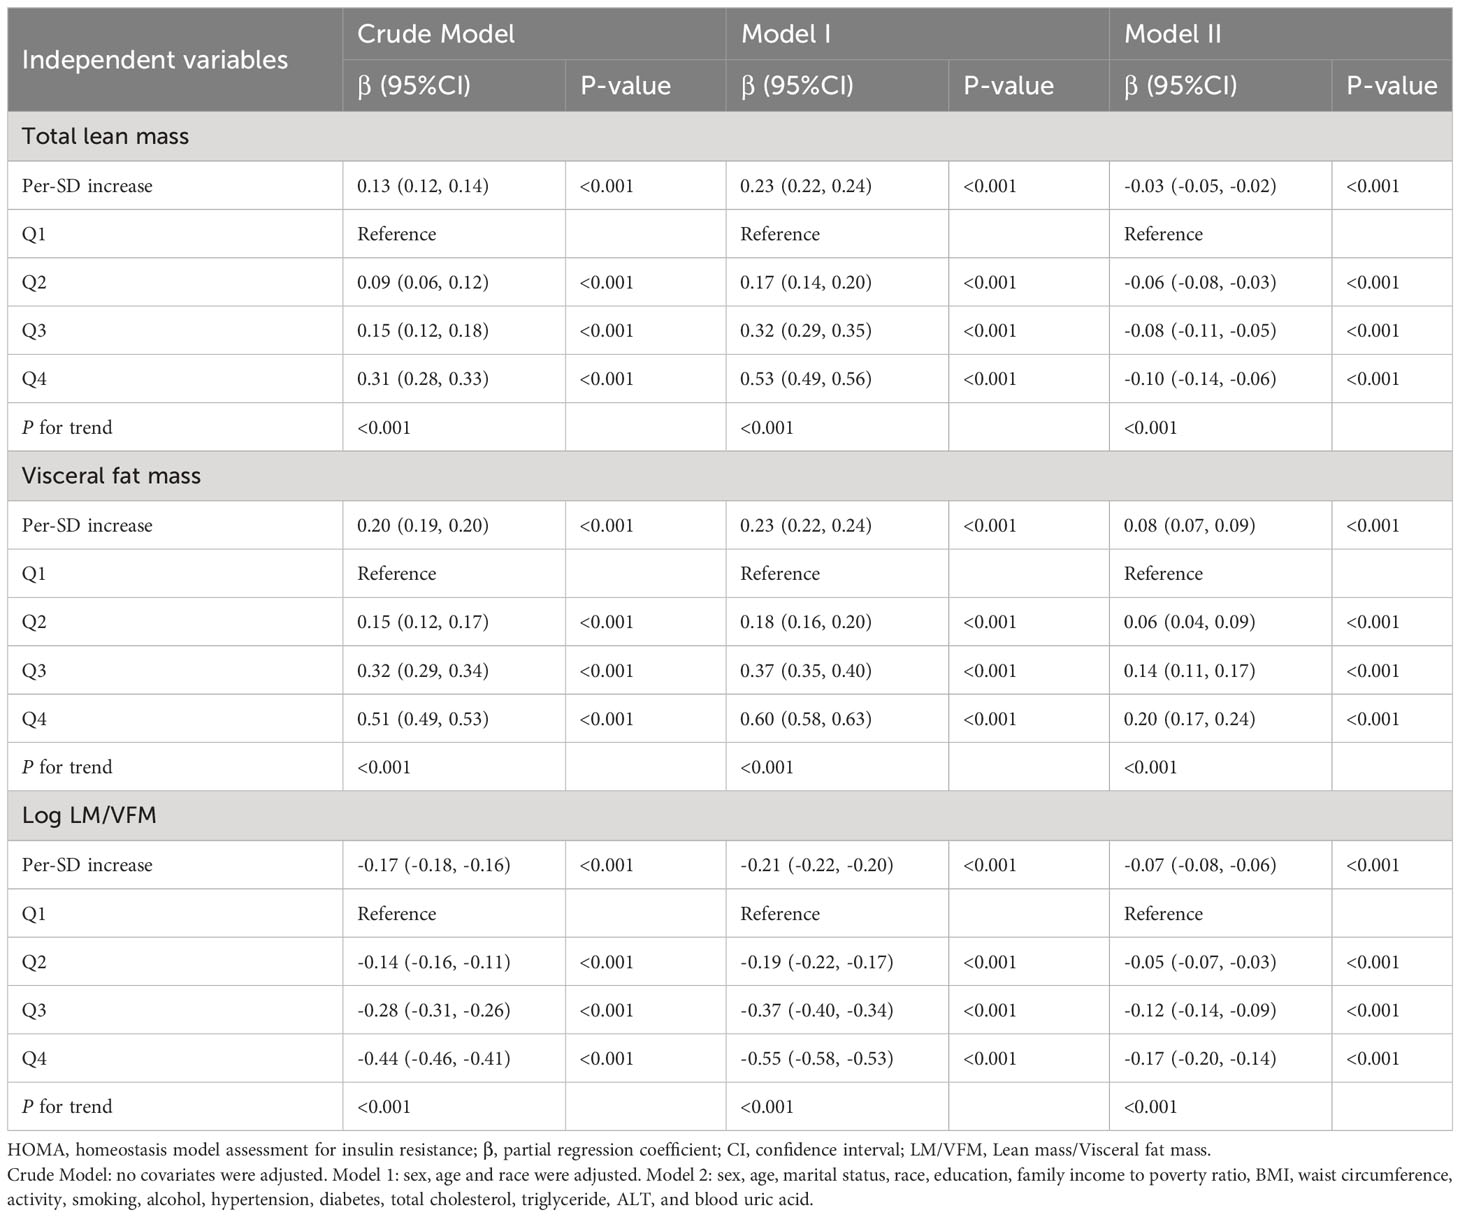
Table 2 Association of total lean mass, visceral fat and Log LM/VFM with HOMA-IR.
The study found a significant inverse relationship between HOMA-IR and Log LM/VFM. This association was observed both as a continuous variable (β=-0.07; 95% CI: -0.08, -0.06) and in categorical variables. Furthermore, individuals in the upper quartile of Log LM/VFM were found to have relatively lower HOMA-IR (β = -0.17; 95% CI: -0.20, -0.14).
3.2 Smoothing curve fitting and threshold effect analysis
The smoothing curve fitting study revealed an inverse linear relationship between total lean mass and HOMA-IR (Figure 2). Visceral fat mass, on the other hand, showed a non-linear upward trend with HOMA-IR (Figure 3). Surprisingly, the Log LM/VFM independent exposure variable analysis revealed a substantial negative non-linear relationship with HOMA-IR (Figure 4), reaching an inflection point of 1.80 and 2.50, respectively (Table 3). A significant inverse correlation was observed between Log LM/VFM and HOMA-IR. The level of HOMA-IR is highest when Log LM/VFM is less than 1.80, and then HOMA-IR decreases as the Log LM/VFM decreases. However, when it exceeds 2.50, the trend becomes flattened. Supplementary Table 1 describes the characteristics of the variables of interest for populations at different inflection points.
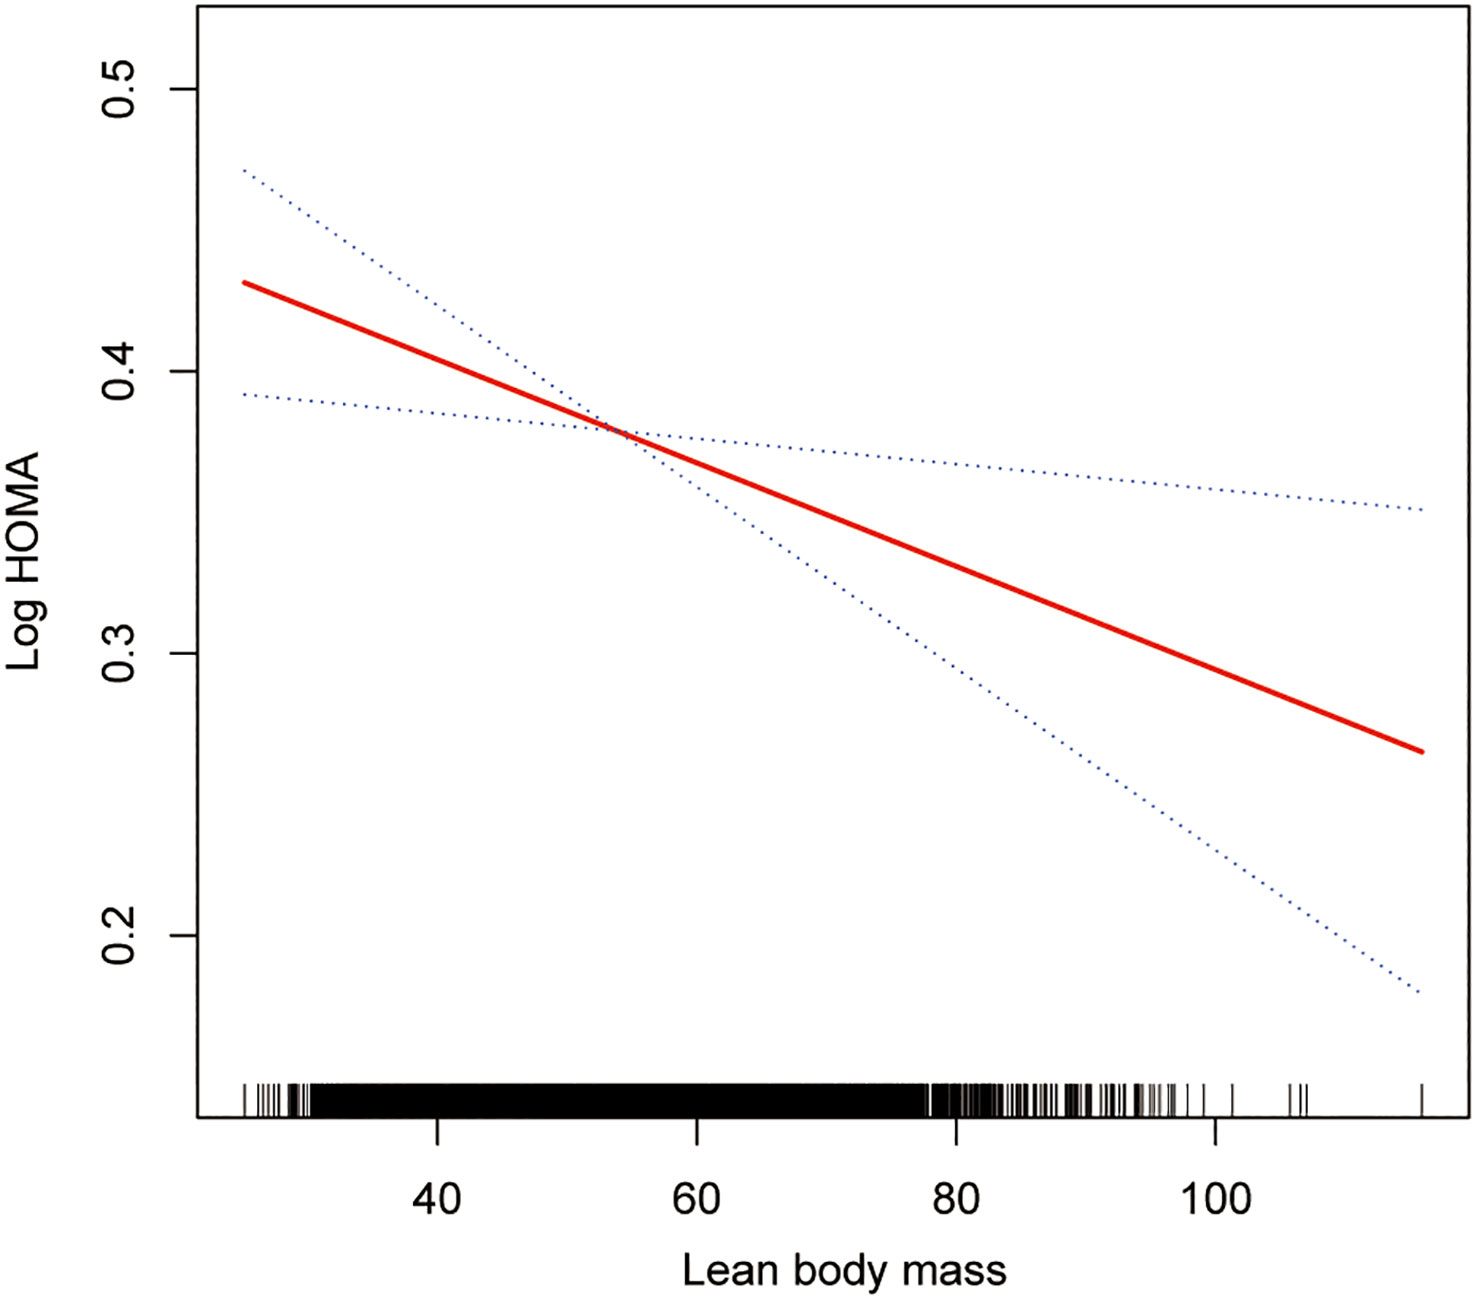
Figure 2 Association between lean body mass and IR. The solid rad line represents the smooth curve fit between variables. Blue bands represent the 95% of confidence interval from the fit. All adjusted covariates were the same as in the regression analysis.
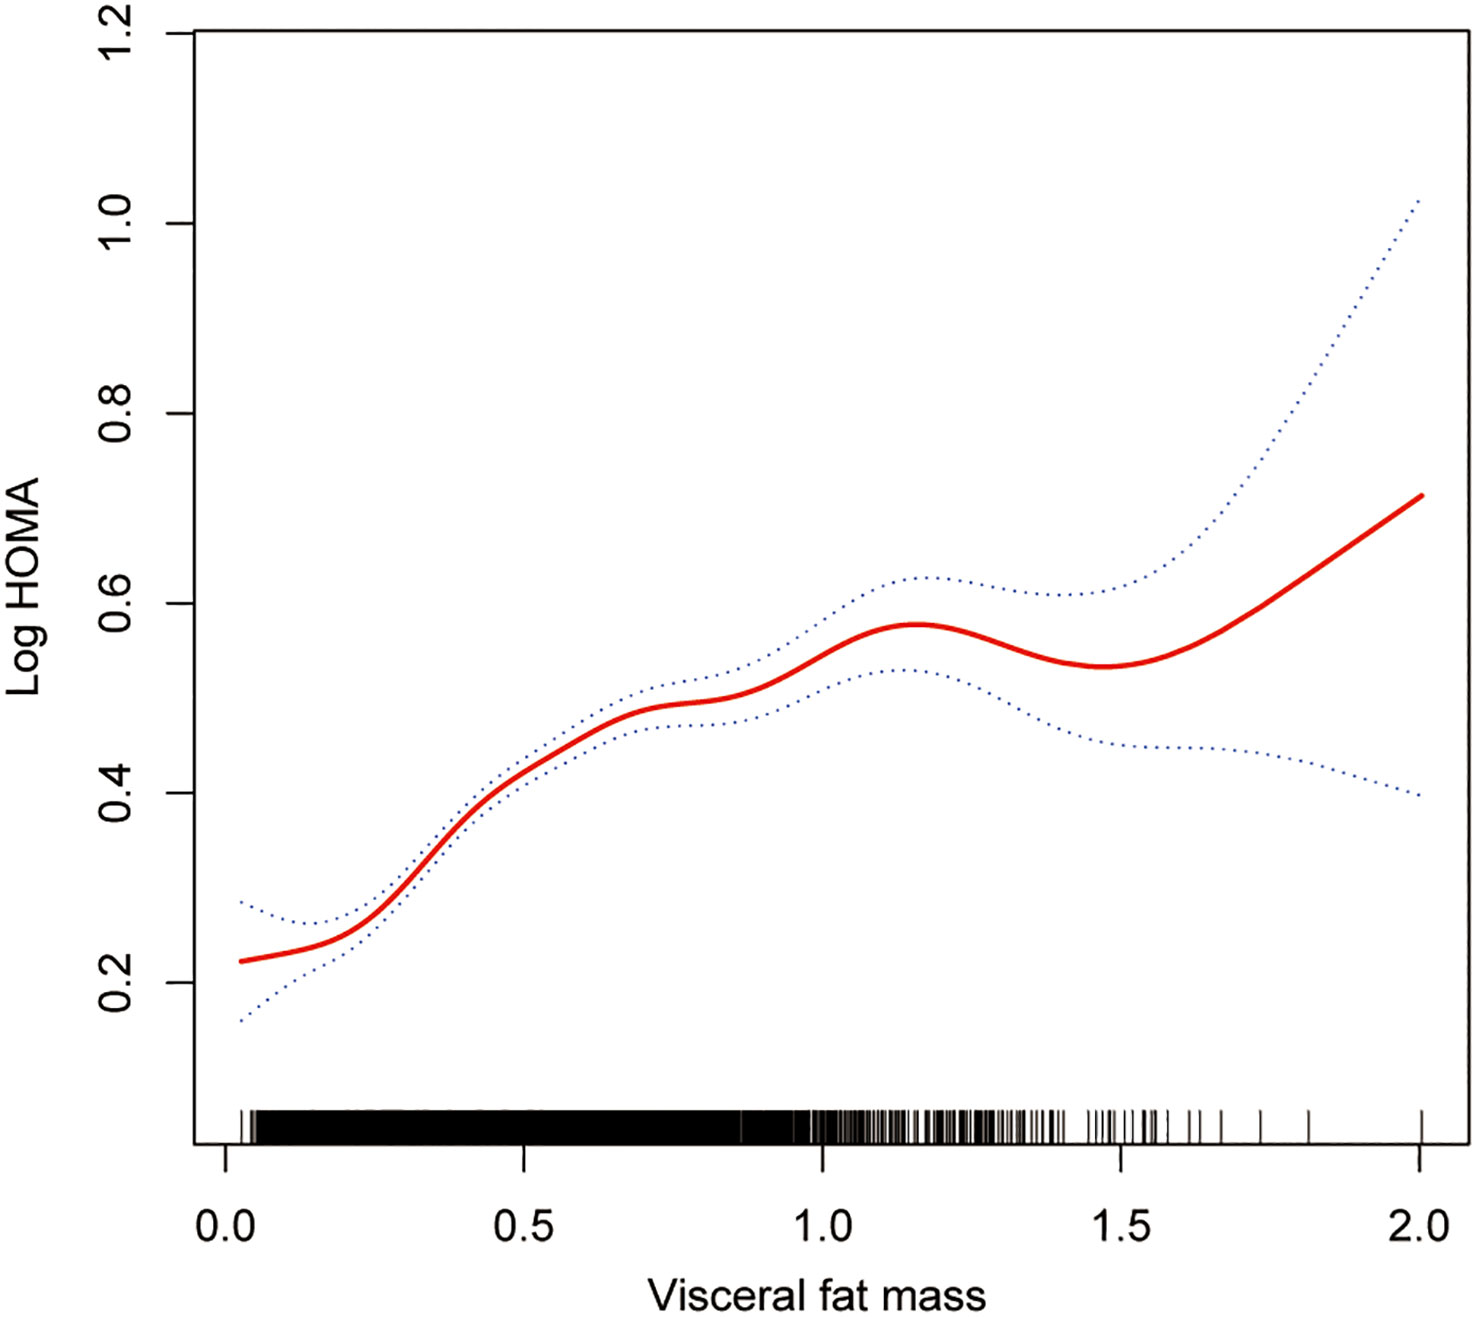
Figure 3 Association between visceral fat mass and IR. The solid rad line represents the smooth curve fit between variables. Blue bands represent the 95% of confidence interval from the fit. All adjusted covariates were the same as in the regression analysis.
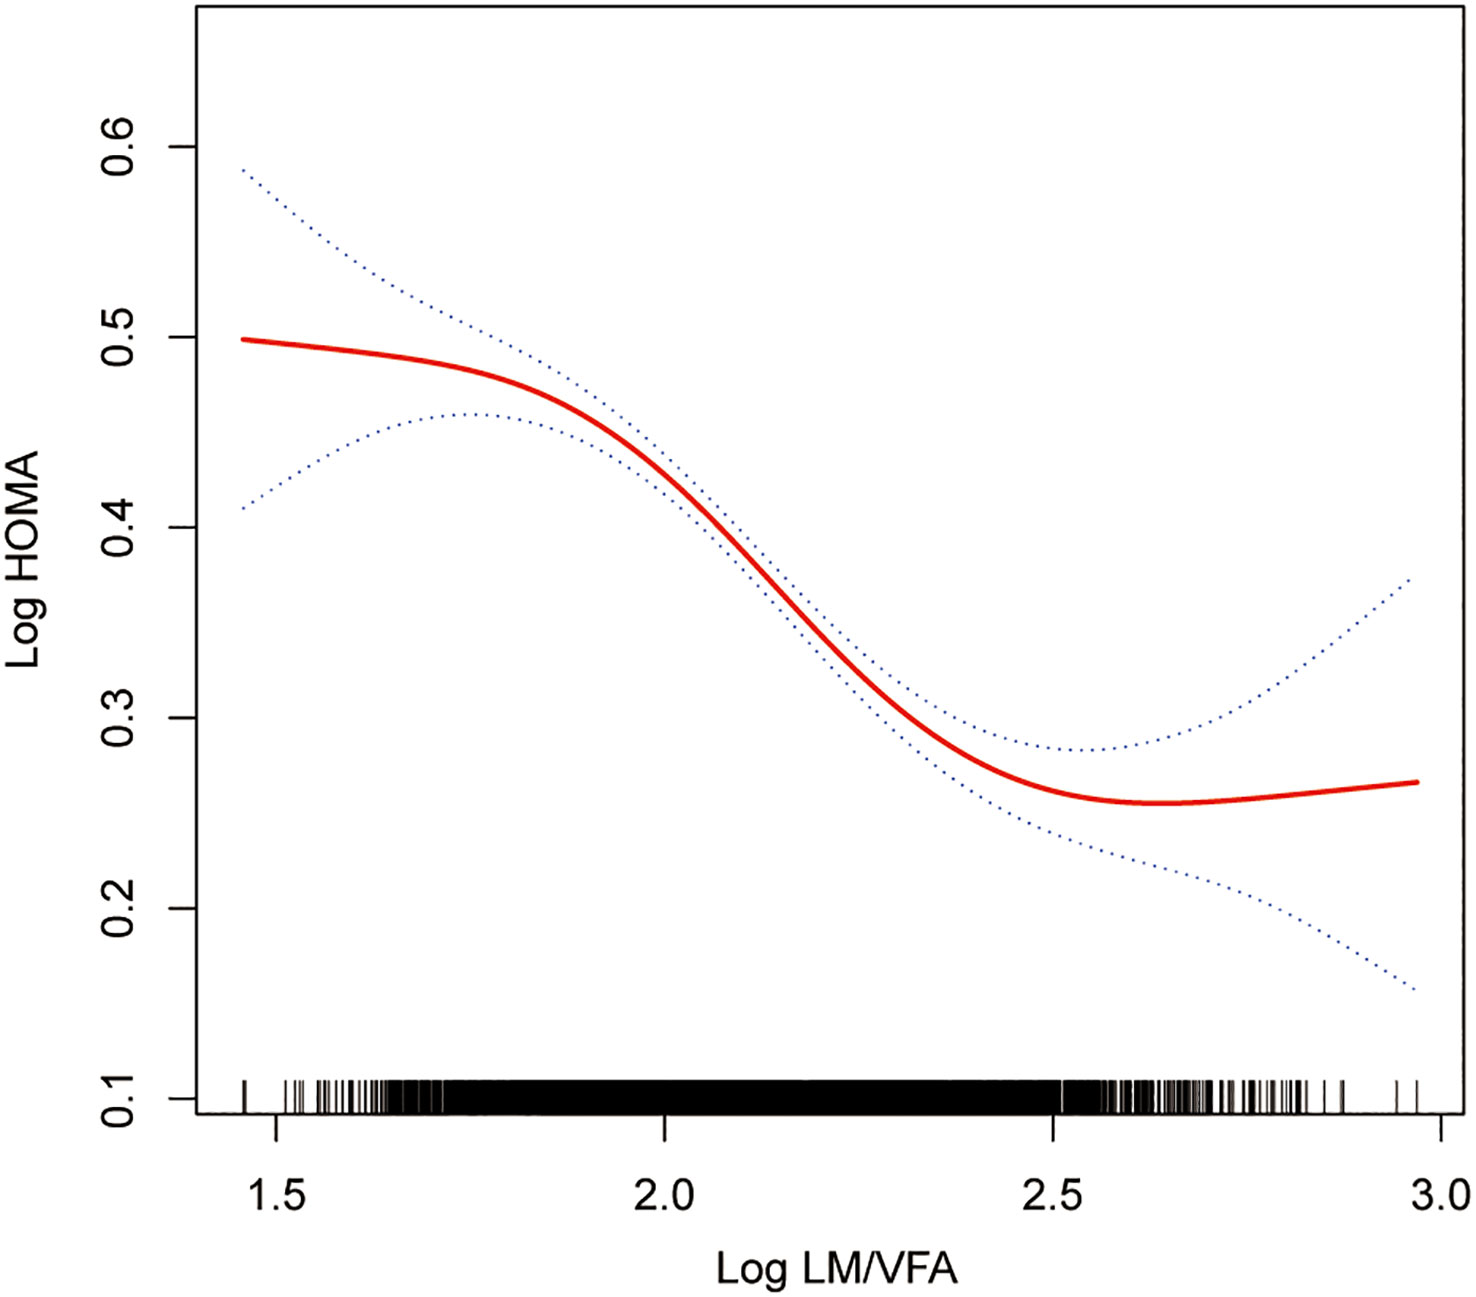
Figure 4 Association between Log LM/VFM and IR. The solid rad line represents the smooth curve fit between variables. Blue bands represent the 95% of confidence interval from the fit. All adjusted covariates were the same as in the regression analysis.
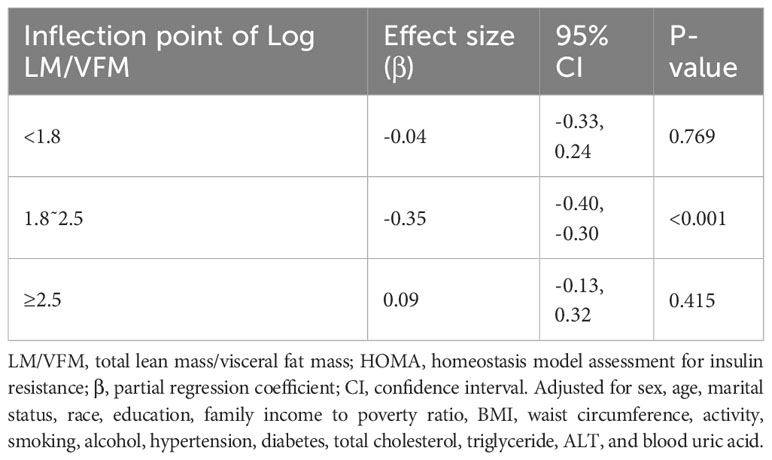
Table 3 Threshold effect analysis of Log LM/VFM with HOMA-IR using piece-wise linear regression.
3.3 Subgroup analysis
Subgroup analysis confirmed the association between Log LM/VFM and HOMA-IR with different clinical features. The results of the subgroup analyses based on sex, age, activity level, BMI, hypertension, and diabetes are presented in Table 4. Across all subgroups, the studies consistently showed a negative correlation between Log LM/VFM and IR.
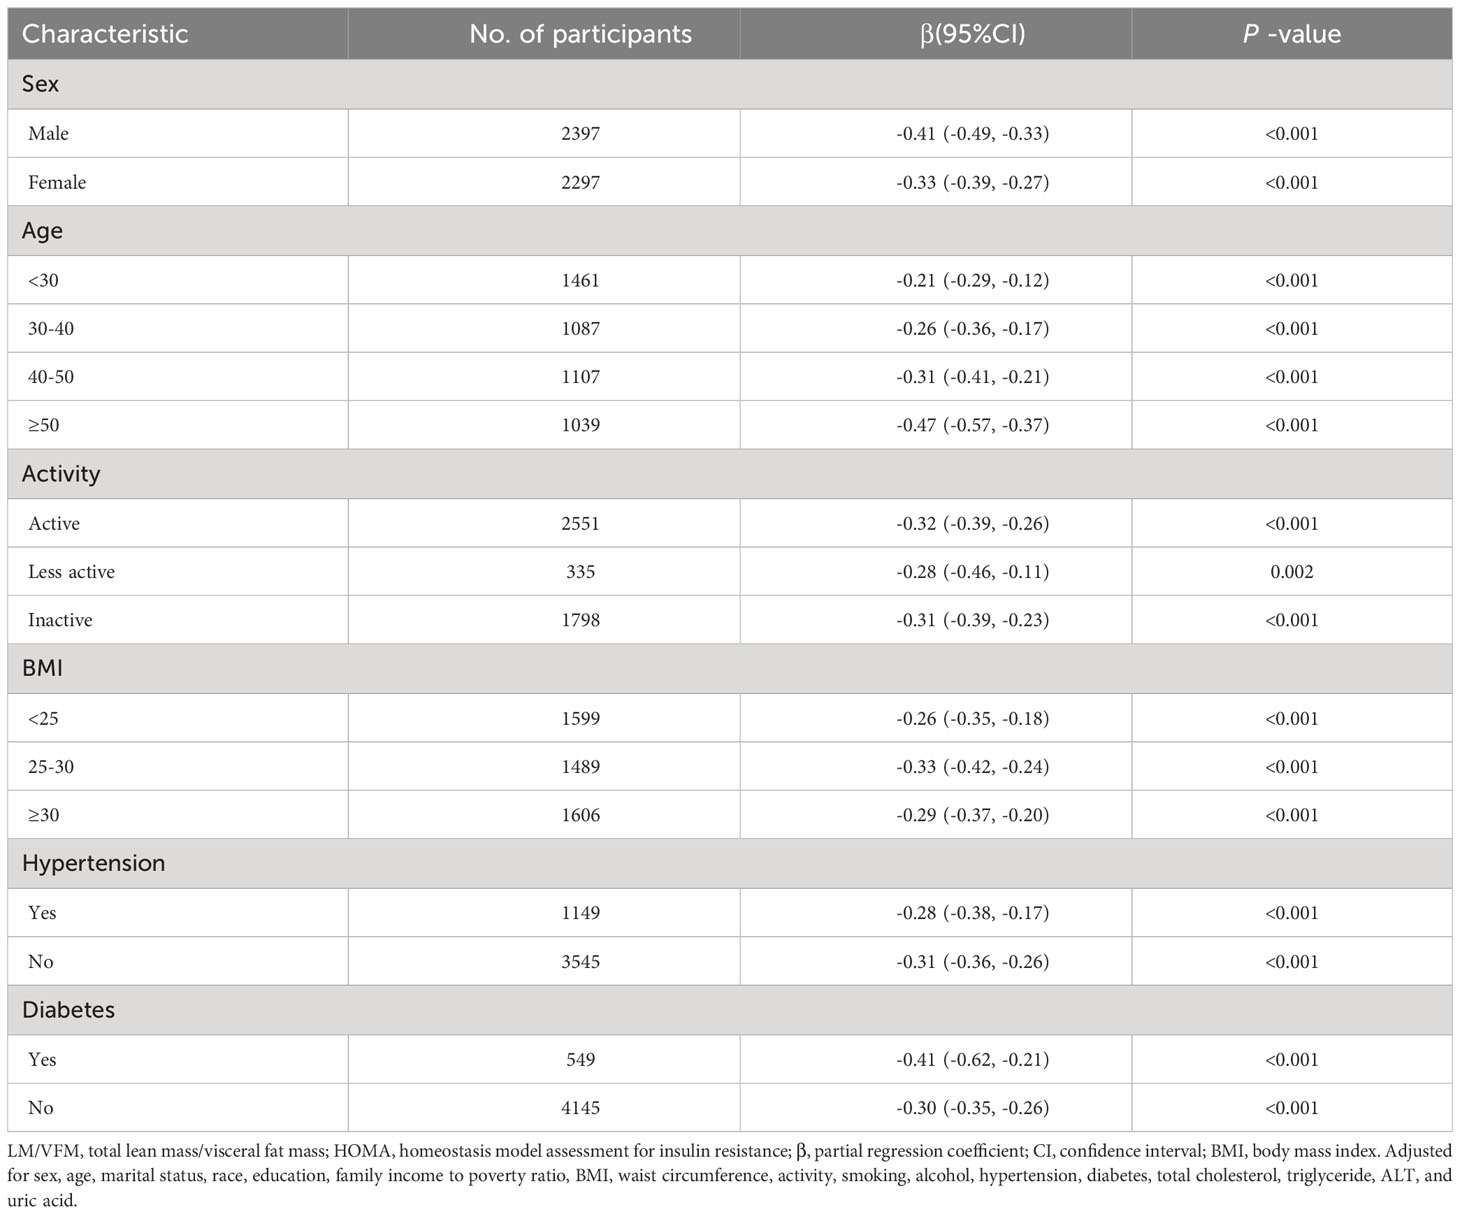
Table 4 Stratified subgroup analysis between Log LM/VFA and HOMA-IR.
4 Discussion
Based on the NHANES survey, the current study revealed a negative correlation between lean body mass and HOMA-IR, whereas visceral fat showed a positive correlation. We used Log LM/VFM as an alternative estimate to understand the combined effect on HOMA-IR. The results showed a negative association between Log LM/VFM and HOMA-IR, with a decrease in HOMA-IR as Log LM/VFM increased. To ensure the credibility of the results, we thoroughly investigated potential confounding factors in the regression analysis to minimize potential bias. Stratified analyses based on sex, age, BMI, exercise level, hypertension, and diabetes were conducted. These findings imply that the conclusion has a high degree of robustness. After additional research on smooth curve fitting and threshold effects, we discovered a nonlinear trend and threshold impact between LogLM/VFM and HOMA-IR.
Researchers have explored the relationship between lean body mass and IR but have yet to reach consistent conclusions. Various studies have demonstrated that increased lean body mass was positively associated with metabolic health. Takamura et al. discovered that lean body mass protects against IR and metabolic abnormalities (30). Similarly, Ghachem et al. found that lean body mass was an independent predictor of IR and that increased muscle mass led to improved IR (31). Ahn et al. investigated IR based on triglyceride glucose index assessment in the Korean population. They found that the group with a low skeletal muscle mass index had higher IR levels (32).
However, other studies have expressed a different view. A study of 7044 participants in the United States showed that lean body mass was positively associated with IR (31). Similarly, a systematic review of children and adolescents showed that lean body mass was minimally associated with glucose homeostasis in children; conflicting views have been generated in the literature (33), and another systematic review had similar findings (34). Rehunen et al. showed that higher lean body mass does not imply freedom from IR. That high lean body mass in men with fatness is detrimental to glucose regulation (35). In addition, a study in community-dwelling older adults in Australia showed that people with sarcopenic obesity did not imply a higher risk of IR (36). Our study supports the hypothesis that lean body mass is conducive to improving IR, and higher lean body mass is associated with lower IR levels, with a significant inverse relationship between the two. The mechanism of action between lean body mass and IR needs to be better understood, and further future exploration of this issue is needed.
The association between adipose tissue and metabolic diseases has received extensive attention. Of particular concern is visceral adipose tissue, which releases cytokines that can circulate throughout the body via the portal vein (37), and deposition of ectopic adipose tissue, contributing to a higher risk of cardiovascular disorders (38). Glintborg et al. found a positive correlation between trunk fat and IR in polycystic ovary syndrome patients (39). Additional studies have also shown a positive association between trunk fat and IR in people with overweight characteristics and a worsening of IR over time (40). The high visceral fat mass has also been positively associated with IR and β-cell dysfunction (41). However, the effects of different body adipose tissues on metabolic health vary. One study in China found that subcutaneous fat reduced the risk of diabetes in women, in contrast to visceral adipose tissue, which increased this risk (42). Given the harmful effects of visceral adipose tissue, we used visceral fat mass as an evaluation indicator to measure its harmful effects on IR better.
Although existing research has separately observed associations between lean mass and adipose tissue with IR, these parts are integral components of the human body that cannot be separated, just like the two sides of a coin. The inconsistent results of previous studies may be partly attributed to inconsistencies in evaluation methods or indices, including using different evaluation methods, such as bioelectrical impedance, dual-energy x-ray absorptiometry, computed tomography scans, and magnetic resonance imaging. Different evaluation indices have also been employed, such as Free Fat Mass, Skeletal Muscle Mass, and Appendicular Skeletal Muscle Index (43). These differences in evaluation methods or indicators limit the consistency between the findings of existing studies. Looking at the correlation in isolation of either lean body mass or adipose tissue with IR can only partially understand the relationship between the variables. Therefore, the combined effect of muscle and adipose tissue concerning IR is worth exploring.
In recent years, researchers have used the biomarker of fat-to-muscle ratio to evaluate body composition. This indicator has been widely used in studies related to various health outcomes, such as mortality (20, 44) and cardiometabolic risk (19). However, the marker of fat-to-muscle ratio was used in previous studies without considering the varying roles of different tissues in the body. Numerous studies have confirmed that visceral fat and subcutaneous adipose tissue were associated with human health-related indicators significantly differently. In a study conducted by Sato et al. (45), it was found that there is a significant association between the visceral fat area and dyslipidemia, hypertension, and coronary atherosclerosis. However, no such association was observed with subcutaneous fat. Huang et al. (46) demonstrated a positive correlation between visceral fat and insulin secretion and sensitivity in a diabetic population, even after considering confounding variables, while subcutaneous fat did not exhibit the same relationship. Similarly, a study by Koenen et al. found that Individuals with visceral tissue deposition are more likely to develop metabolic diseases than similarly obese individuals with less visceral adipose tissue and relatively more subcutaneous fat (47).
The fat-to-muscle ratio has been frequently examined as a metric in previous studies on body composition and insulin sensitivity or IR. A study by Poggiogalle et al. found that individuals with high adipose tissue and low lean mass characteristics tend to have lower insulin sensitivity and higher glycosylated hemoglobin levels (48). Similarly, Habib et al. demonstrated that people with sarcopenic obesity have significantly higher levels of IR and HOMA-β (49). A study conducted by Huang et al. examined 420 patients with type 1 diabetes and found that a higher fat-to-muscle ratio was associated with higher IR and cardiometabolic disorders (50). Another study by Hwang et al. on 424 diabetic patients revealed a positive correlation between the ratio of muscle mass to visceral fat and serum insulin concentrations (51). Based on the results of this study, we can conclude that there is a significant relationship between lean body mass to visceral fat mass ratio and IR. As the ratio increases, the level of IR tends to decrease gradually. However, this relationship is non-linear.
Further analysis of the threshold effect revealed that the level of IR was highest when the log LM/VFM was less than 1.8. Subsequently, as the log LM/VFM decreases, the level of IR also decreases. This finding emphasizes the significance of controlling visceral fat while maintaining lean body mass. The study indicates saturation effect occurs when the log LM/VFM value exceeds 2.5. Beyond this cut-off, increasing lean body mass to visceral fat mass ratio did not significantly improve IR levels. These findings have significant implications for the management of metabolic diseases.
Additionally, we observed variations in the body composition of individuals during different inflection intervals. Participants with a Log LM/VFM>2.5 exhibited significantly lower visceral fat and body weight levels while displaying the highest ratio of lean body mass to visceral fat. On the other hand, those with a Log LM/VFM <1.8 had higher visceral fat and body weight levels and a lower ratio of lean body mass to visceral fat. This higher ratio may be influenced mainly by the lower amount of visceral fat. Whether maintaining a certain level of lean body mass to visceral fat ratio implies a better metabolic health phenotype requires further population-based investigations to verify.
To better understand the research findings, it is vital to acknowledge the limitations of this cross-sectional study. It cannot definitively establish causality, and further cohort studies will be necessary to confirm the results. Secondly, cross-sectional studies are susceptible to confounding variables, which may skew the results. While the researchers attempted to consider these factors, there may still be unknown variables or biases that were not considered during the study that could have led to inaccurate results. Therefore, caution should be exercised when interpreting the findings, and further investigation is required to validate the results under different conditions. Third, in the NHANES survey, only those under 59 completed Dual-energy X-ray absorptiometry, so the study results do not apply to the elderly population. Fourth, diet, water intake, and activity status may influence body composition measurements. We are not sure whether all subjects completed the measures in a fast, peaceful state, which may tend to overestimate body composition results. However, considering all subjects were treated equally and objective measurements were taken at the mobile examination center, this should not bias the estimated results. Fifth, it is essential to note that the results in this study for HOMA-IR show a significantly skewed distribution, so we have log-transformed them. Although this does not change the correlation between the variables, this feature should be noted when interpreting the data. Finally, among the current methods for evaluating IR, the gold standard is the hyperinsulinemic-euglycemic clamp. However, this technique requires special operating equipment, is time-consuming, and is expensive, making it challenging to implement in large-scale population-based surveys. Where possible, in the future, the findings in this study need to be further validated using the gold standard.
In conclusion, it has been observed that there exists a negative correlation between lean body mass and IR. On the other hand, a positive correlation has been found between visceral fat and IR. A nonlinear negative relationship with a threshold effect has been observed through a detailed analysis of the relationship between the lean body mass to visceral fat mass ratio and IR, using LogLM/VFM as a proxy variable.
Data availability statement
Publicly available datasets were analyzed in this study. This data can be found here: https://www.cdc.gov/nchs/nhanes/about_nhanes.htm.
Ethics statement
The studies involving humans were approved by The National Center for Health Statistics Institutional Review Board of the United States. The studies were conducted in accordance with the local legislation and institutional requirements. The participants provided their written informed consent to participate in this study.
Author contributions
YS and HZ proposed research design. LL and XW cleaned up the data, YH and XZ completed statistical analysis of the data. YS and LL created this manuscript. YS, LL, HZ, XW, YH, and XZ contributed to the discussion, reviewed, and approved the manuscript. LL and HZ made important changes to key elements of the manuscript. All authors contributed to the article and approved the submitted version.
Funding
This study was funded by grants from the Hubei Provincial Health Commission (WJ2021M050), the Hubei Provincial Department of Education (18D070) and the Shiyan Science and Technology Bureau (22Y31).
Conflict of interest
The authors declare that the research was conducted in the absence of any commercial or financial relationships that could be construed as a potential conflict of interest.
Publisher’s note
All claims expressed in this article are solely those of the authors and do not necessarily represent those of their affiliated organizations, or those of the publisher, the editors and the reviewers. Any product that may be evaluated in this article, or claim that may be made by its manufacturer, is not guaranteed or endorsed by the publisher.
Supplementary material
The Supplementary Material for this article can be found online at: https://www.frontiersin.org/articles/10.3389/fendo.2023.1232896/full#supplementary-material
References
1. Collaborators GD. Global, regional, and national burden of diabetes from 1990 to 2021, with projections of prevalence to 2050: a systematic analysis for the global burden of disease study 2021. Lancet (2023) 402:203–34. doi: 10.1016/S0140-6736(23)01301-6
2. Ahmad E, Lim S, Lamptey R, Webb DR, Davies MJ. Type 2 diabetes. Lancet (2022) 400:1803–20. doi: 10.1016/S0140-6736(22)01655-5
3. Tinajero MG, Malik VS. An update on the epidemiology of type 2 diabetes: a global perspective. Endocrinol Metab Clin North Am (2021) 50:337–55. doi: 10.1016/j.ecl.2021.05.013
4. Sun H, Saeedi P, Karuranga S, Pinkepank M, Ogurtsova K, Duncan BB, et al. IDF diabetes atlas: global, regional and country-level diabetes prevalence estimates for 2021 and projections for 2045. Diabetes Res Clin Pract (2022) 183:109119. doi: 10.1016/j.diabres.2021.109119
5. Tomic D, Shaw JE, Magliano DJ. The burden and risks of emerging complications of diabetes mellitus. Nat Rev Endocrinol (2022) 18:525–39. doi: 10.1038/s41574-022-00690-7
6. Petersen MC, Shulman GI. Mechanisms of insulin action and insulin resistance. Physiol Rev (2018) 98:2133–223. doi: 10.1152/physrev.00063.2017
7. Johnson JD. On the causal relationships between hyperinsulinaemia, insulin resistance, obesity and dysglycaemia in type 2 diabetes. Diabetologia (2021) 64:2138–46. doi: 10.1007/s00125-021-05505-4
8. Li M, Chi X, Wang Y, Setrerrahmane S, Xie W, Xu H. Trends in insulin resistance: insights into mechanisms and therapeutic strategy. Signal Transduct Target Ther (2022) 7:216. doi: 10.1038/s41392-022-01073-0
9. Liu X, Tan Z, Huang Y, Zhao H, Liu M, Yu P, et al. Relationship between the triglyceride-glucose index and risk of cardiovascular diseases and mortality in the general population: a systematic review and meta-analysis. Cardiovasc Diabetol (2022) 21:124. doi: 10.1186/s12933-022-01546-0
10. Li X, Chan JSK, Guan B, Peng S, Wu X, Lu X, et al. Triglyceride-glucose index and the risk of heart failure: evidence from two large cohorts and a mendelian randomization analysis. Cardiovasc Diabetol (2022) 21:229. doi: 10.1186/s12933-022-01658-7
11. Wang T, Li M, Zeng T, Hu R, Xu Y, Xu M, et al. Association between insulin resistance and cardiovascular disease risk varies according to glucose tolerance status: a nationwide prospective cohort study. Diabetes Care (2022) 45:1863–72. doi: 10.2337/dc22-0202
12. Wang T, Lu J, Shi L, Chen G, Xu M, Xu Y, et al. Association of insulin resistance and β-cell dysfunction with incident diabetes among adults in China: a nationwide, population-based, prospective cohort study. Lancet Diabetes Endocrinol (2020) 8:115–24. doi: 10.1016/S2213-8587(19)30425-5
13. Wang F, Han L, Hu D. Fasting insulin, insulin resistance and risk of hypertension in the general population: a meta-analysis. Clin Chim Acta (2017) 464:57–63. doi: 10.1016/j.cca.2016.11.009
14. Jiang J, Cai X, Pan Y, Du X, Zhu H, Yang X, et al. Relationship of obesity to adipose tissue insulin resistance. BMJ Open Diabetes Res Care (2020) 8:e741. doi: 10.1136/bmjdrc-2019-000741
15. Rohm TV, Meier DT, Olefsky JM, Donath MY. Inflammation in obesity, diabetes, and related disorders. Immunity (2022) 55:31–55. doi: 10.1016/j.immuni.2021.12.013
16. Wu H, Ballantyne CM. Metabolic inflammation and insulin resistance in obesity. Circ Res (2020) 126:1549–64. doi: 10.1161/CIRCRESAHA.119.315896
17. Després J. BMI versus obesity subtypes in the era of precision medicine. Lancet Diabetes Endocrinol (2023) 11:382–4. doi: 10.1016/S2213-8587(23)00088-8
18. Koliaki C, Liatis S, Kokkinos A. Obesity and cardiovascular disease: revisiting an old relationship. Metabolism (2019) 92:98–107. doi: 10.1016/j.metabol.2018.10.011
19. Yu PC, Hsu CC, Lee WJ, Liang CK, Chou MY, Lin MH, et al. Muscle-to-fat ratio identifies functional impairments and cardiometabolic risk and predicts outcomes: biomarkers of sarcopenic obesity. J Cachexia Sarcopenia Muscle (2022) 13:368–76. doi: 10.1002/jcsm.12877
20. Yu B, Sun Y, Du X, Zhang H, Chen C, Tan X, et al. Age-specific and sex-specific associations of visceral adipose tissue mass and fat-to-muscle mass ratio with risk of mortality. J Cachexia Sarcopenia Muscle (2023) 14:406–17. doi: 10.1002/jcsm.13142
21. Seo YG, Song HJ, Song YR. Fat-to-muscle ratio as a predictor of insulin resistance and metabolic syndrome in korean adults. J Cachexia Sarcopenia Muscle (2020) 11:710–25. doi: 10.1002/jcsm.12548
22. Wu S, Chen W. Not the enemy: superficial subcutaneous adipose tissue may bring protective benefits. Polish Arch Internal Med (2022) 132:16237. doi: 10.20452/pamw.16237
23. Chen G, Arthur R, Iyengar NM, Kamensky V, Xue X, Wassertheil-Smoller S, et al. Association between regional body fat and cardiovascular disease risk among postmenopausal women with normal body mass index. Eur Heart J (2019) 40:2849–55. doi: 10.1093/eurheartj/ehz391
24. Després J, Carpentier AC, Tchernof A, Neeland IJ, Poirier P. Management of obesity in cardiovascular practice: jacc focus seminar. J Am Coll Cardiol (2021) 78:513–31. doi: 10.1016/j.jacc.2021.05.035
25. National Health and Nutrition Examination Survey (NHANES). Body Composition Procedures Manual 2018. Available at: https://wwwn.cdc.gov/nchs/data/nhanes/2017-2018/manuals/Body_Composition_Procedures_Manual_2018.pdf (Accessed August 4, 2023).
26. Matthews DR, Hosker JP, Rudenski AS, Naylor BA, Treacher DF, Turner RC. Homeostasis model assessment: insulin resistance and beta-cell function from fasting plasma glucose and insulin concentrations in man. Diabetologia (1985) 28:412–19. doi: 10.1007/BF00280883
27. National Health and Nutrition Examination Survey (NHANES). MEC Laboratory Procedures Manual 2017. Available at: https://wwwn.cdc.gov/nchs/data/nhanes/2017-2018/manuals/2017_MEC_Laboratory_Procedures_Manual.pdf (Accessed June 1, 2023).
28. National Health and Nutrition Examination Survey (NHANES). Anthropometry Procedures Manual. Available at: https://wwwn.cdc.gov/nchs/data/nhanes/2017-2018/manuals/2017_Anthropometry_Procedures_Manual.pdf (Accessed August 4, 2023).
29. Bull FC, Al-Ansari SS, Biddle S, Borodulin K, Buman MP, Cardon G, et al. World health organization 2020 guidelines on physical activity and sedentary behaviour. Br J Sports Med (2020) 54:1451–62. doi: 10.1136/bjsports-2020-102955
30. Takamura T, Kita Y, Nakagen M, Sakurai M, Isobe Y, Takeshita Y, et al. Weight-adjusted lean body mass and calf circumference are protective against obesity-associated insulin resistance and metabolic abnorMalities. Heliyon (2017) 3:e347. doi: 10.1016/j.heliyon.2017.e00347
31. Ghachem A, Lagacé J, Brochu M, Dionne IJ. Fat-free mass and glucose homeostasis: is greater fat-free mass an independent predictor of insulin resistance? Aging Clin Exp Res (2019) 31:447–54. doi: 10.1007/s40520-018-0993-y
32. Ahn S, Lee J, Lee J. Inverse association between triglyceride glucose index and muscle mass in korean adults: 2008–2011 knhanes. Lipids Health Dis (2020) 19:243. doi: 10.1186/s12944-020-01414-4
33. Córdoba-Rodríguez DP, Iglesia I, Gomez-Bruton A, Rodríguez G, Casajús JA, Morales-Devia H, et al. Fat-free/lean body mass in children with insulin resistance or metabolic syndrome: a systematic review and meta-analysis. BMC Pediatr (2022) 22:58. doi: 10.1186/s12887-021-03041-z
34. Perreault K, Lagacé J, Brochu M, Dionne IJ. Association between fat free mass and glucose homeostasis: common knowledge revisited. Ageing Res Rev (2016) 28:46–61. doi: 10.1016/j.arr.2016.04.007
35. Rehunen SK, Kautiainen H, Korhonen PE, Eriksson JG. Lean body mass is not beneficial, but may be detrimental for glucose tolerance-splitting body mass index according to body composition. Prim Care Diabetes (2020) 14:747–52. doi: 10.1016/j.pcd.2020.05.003
36. Scott D, Cumming R, Naganathan V, Blyth F, Le Couteur DG, Handelsman DJ, et al. Associations of sarcopenic obesity with the metabolic syndrome and insulin resistance over five years in older men: the concord health and ageing in men project. Exp Gerontol (2018) 108:99–105. doi: 10.1016/j.exger.2018.04.006
37. Karastergiou K, Smith SR, Greenberg AS, Fried SK. Sex differences in human adipose tissues - the biology of pear shape. Biol Sex Differ (2012) 3:13. doi: 10.1186/2042-6410-3-13
38. Stefan N. Causes, consequences, and treatment of metabolically unhealthy fat distribution. Lancet Diabetes Endocrinol (2020) 8:616–27. doi: 10.1016/S2213-8587(20)30110-8
39. Glintborg D, Petersen MH, Ravn P, Hermann AP, Andersen M. Comparison of regional fat mass measurement by whole body dxa scans and anthropometric measures to predict insulin resistance in women with polycystic ovary syndrome and controls. Acta Obstet Gynecol Scand (2016) 95:1235–43. doi: 10.1111/aogs.12964
40. Tang A, Coster A, Tonks KT, Heilbronn LK, Pocock N, Purtell L, et al. Longitudinal changes in insulin resistance in normal weight, overweight and obese individuals. J Clin Med (2019) 8:623. doi: 10.3390/jcm8050623
41. Moon HU, Ha KH, Han SJ, Kim HJ, Kim DJ. The association of adiponectin and visceral fat with insulin resistance and beta-cell dysfunction. J Korean Med Sci (2019) 34:e7. doi: 10.3346/jkms.2019.34.e7
42. Chen P, Hou X, Hu G, Wei L, Jiao L, Wang H, et al. Abdominal subcutaneous adipose tissue: a favorable adipose depot for diabetes? Cardiovasc Diabetol (2018) 17:93. doi: 10.1186/s12933-018-0734-8
43. Lagacé JC, Brochu M, Dionne IJ. A counterintuitive perspective for the role of fat-free mass in metabolic health. J Cachexia Sarcopenia Muscle (2020) 11:343–47. doi: 10.1002/jcsm.12520
44. Xue H, Du H, Xie Y, Zhai Y, Song S, Luo B, et al. Association between fat mass to lean body mass ratio and all-cause mortality among middle-aged and elderly cancer patients without obesity: a multi-center observational study in China. Front Nutr (2022) 9:914020. doi: 10.3389/fnut.2022.914020
45. Sato F, Maeda N, Yamada T, Namazui H, Fukuda S, Natsukawa T, et al. Association of epicardial, visceral, and subcutaneous fat with cardiometabolic diseases. Circ J (2018) 82:502–08. doi: 10.1253/circj.CJ-17-0820
46. Huang H, Zheng X, Wen X, Zhong J, Zhou Y, Xu L. Visceral fat correlates with insulin secretion and sensitivity independent of BMI and subcutaneous fat in chinese with type 2 diabetes. Front Endocrinol (Lausanne) (2023) 14:1144834. doi: 10.3389/fendo.2023.1144834
47. Koenen M, Hill MA, Cohen P, Sowers JR. Obesity, adipose tissue and vascular dysfunction. Circ Res (2021) 128:951–68. doi: 10.1161/CIRCRESAHA.121.318093
48. Poggiogalle E, Mendes I, Ong B, Prado CM, Mocciaro G, Mazidi M, et al. Sarcopenic obesity and insulin resistance: application of novel body composition models. Nutrition (2020) 75-76:110765. doi: 10.1016/j.nut.2020.110765
49. Habib SS, Alkahtani S, Alhussain M, Aljuhani O. Sarcopenia coexisting with high adiposity exacerbates insulin resistance and dyslipidemia in saudi adult men. Diabetes Metab Syndr Obes (2020) 13:3089–97. doi: 10.2147/DMSO.S260382
50. Huang F, Ji X, Wang Z, Yin Y, Fan L, Li J, et al. Fat-to-muscle ratio is associated with insulin resistance and cardiometabolic disorders in adults with type 1 diabetes mellitus. Diabetes Obes Metab (2023). doi: 10.1111/dom.15212
Keywords: insulin resistance, lean body mass, NHANES, visceral fat mass, HOMA-IR
Citation: Shao Y, Li L, Zhong H, Wang X, Hua Y and Zhou X (2023) Anticipated correlation between lean body mass to visceral fat mass ratio and insulin resistance: NHANES 2011-2018. Front. Endocrinol. 14:1232896. doi: 10.3389/fendo.2023.1232896
Received: 01 June 2023; Accepted: 28 August 2023;
Published: 13 September 2023.
Edited by:
Venketesh Sivaramakrishnan, Sri Sathya Sai Institute of Higher Learning (SSSIHL), IndiaReviewed by:
Xuewen Wang, University of South Carolina, United StatesElsayed E. Hafez, City of Scientific Research and Technological Applications, Egypt
Copyright © 2023 Shao, Li, Zhong, Wang, Hua and Zhou. This is an open-access article distributed under the terms of the Creative Commons Attribution License (CC BY). The use, distribution or reproduction in other forums is permitted, provided the original author(s) and the copyright owner(s) are credited and that the original publication in this journal is cited, in accordance with accepted academic practice. No use, distribution or reproduction is permitted which does not comply with these terms.
*Correspondence: Huiqin Zhong, emhxNjYwNzdAMTYzLmNvbQ==
†These authors have contributed equally to this work