
95% of researchers rate our articles as excellent or good
Learn more about the work of our research integrity team to safeguard the quality of each article we publish.
Find out more
ORIGINAL RESEARCH article
Front. Endocrinol. , 09 October 2023
Sec. Obesity
Volume 14 - 2023 | https://doi.org/10.3389/fendo.2023.1221325
 Wei Pan1,2,3†
 Menglong Wang1,2,3†
 Yingying Hu1
 Zhengqi Lian1,2Haonan Cheng1,2
 Juan-Juan Qin4,5*
 Jun Wan1,2,3,6*
Background: Previous animal studies have suggested that air pollution (AP) exposure may be a potential risk factor for obesity; however, there is limited epidemiological evidence available to describe the association of obesity with AP exposure.
Methods: A retrospective cross-sectional study was conducted on 11,766 participants across mainland China in 2015. Obesity was assessed using body mass index (BMI), waist circumference (WC), and visceral adiposity index (VAI). The space-time extremely randomized tree (STET) model was used to estimate the concentration of air pollutants, including SO2, NO2, O3, PM1, PM2.5, and PM10, matched to participants’ residential addresses. Logistic regression models were employed to estimate the associations of obesity with outdoor AP exposure. Further stratified analysis was conducted to evaluate whether sociodemographics or lifestyles modified the effects.
Results: Increased AP exposure was statistically associated with increased odds of obesity. The odds ratio (ORs) and 95% confidence interval (CI) of BMI-defined obesity were 1.21 (1.17, 1.26) for SO2, 1.33 (1.26, 1.40) for NO2, 1.15 (1.10, 1.21) for O3, 1.38 (1.29, 1.48) for PM1, 1.19 (1.15, 1.22) for PM2.5, and 1.11 (1.09, 1.13) for PM10 per 10 μg/m3 increase in concentration. Similar results were found for central obesity. Stratified analyses suggested that elderly participants experienced more adverse effects from all 6 air pollutants than middle-aged participants. Furthermore, notable multiplicative interactions were found between O3 exposure and females as well as second-hand smokers in BMI-defined obesity.
Conclusions: This study suggested that outdoor AP exposure had a significant association with the risk of obesity in the middle-aged and elderly Chinese population. Elderly individuals and women may be more vulnerable to AP exposure.
Obesity has been a persistent and alarming public health issue for the past few decades (1). It is considered a chronic, progressive, relapsing disease that substantially elevates the risk of various comorbidities, including fatty liver disease, type 2 diabetes mellitus, myocardial infarction, hypertension, and stroke, leading to a reduced quality of life and a shortened life expectancy (2). A recent study suggested that the age-standardized prevalence of obesity has been rising steadily from 1980 to 2015 in every country in the world (3); specifically, the obesity prevalence increased with age from 20 years and reached its peak at the age of 50 to 65 years. In addition, the prevalence of obesity was generally higher in women than in men, and the maximal sex difference was observed in middle-aged and elderly adults. In summary, obesity has now replaced smoking, becoming the leading lifestyle-related risk factor for premature mortality (2), and imposes a considerable economic burden on society as a whole.
The increasing prevalence of obesity can be attributed to lifestyle and environmental changes that have accompanied rapid advancement in industrialization and urbanization worldwide, especially in many Asian countries (4). Epidemiological studies have shown that air pollution (AP), mainly due to emissions from vehicular traffic and industrial processes (5), is related to the risk of obesity. Studies have demonstrated that maternal exposure to particulate matter with aerodynamic diameters of ≤ 2.5 μm (PM2.5) was linked to a higher birth weight of newborns (6, 7); in parallel, long-term exposure to ambient AP in children has been connected to a higher body mass index (BMI) and increased likelihood of obesity (8, 9). In adults, previous studies also provided evidence that exposure to AP was correlated with increased BMI and central obesity (10–12). In addition, experimental models in animals have provided possible biological plausibility that AP exposure could be a crucial risk factor for obesity and its complications (13–15). However, due to rapid industrialization and urbanization in recent years, China is facing the dual problems of population aging and environmental pollution. Moreover, since China has a vast territory and complex climate, resulting in large differences in AP levels in different regions, there is limited systematic epidemiological evidence describing the association between AP and obesity in middle-aged and elderly adults at a representative nationwide level, not only prohibiting the understanding of any potential mechanism for the association between AP and obesity but also hampering accurate estimates of the burden of obesity.
This study investigates the relationship between AP exposure and obesity in middle-aged and elderly individuals within the Chinese population. All participants were enrolled from the third follow-up of the China Health and Retirement Longitudinal Study (CHARLS).
This cross-sectional study obtained data from the CHARLS dataset, which is a national longitudinal cohort study that enrolled middle-aged and elderly adults in China, currently consisting of individuals aged 45 years and above, as well as their spouses or children when possible. The baseline survey of CHARLS consecutively employed a multistaged, stratified probability-proportionate-to-size sampling method to enroll respondents, which covered 450 villages in 28 provinces, 150 counties, and districts across mainland China. The baseline survey recorded sociodemographics, lifestyles, and health status through computer-assisted in-person interviews and subsequently assessed participants’ anthropometric measurements and biosamples, including blood and urine. Details about the recruitment method and designs of the CHARLS have been published previously (16).
The current study included the third follow-up of CHARLS participants in 2015, including a total of 13,337 respondents who had complete blood biochemistry data. Exclusion criteria included i) participants whose ages were under 45 (n = 1,150) and ii) participants with incomplete information on indoor fuel or missing anthropometric measurements (n = 421); the study finally included 11,766 individuals in the entire population dataset.
In the current study, BMI, waist circumference (WC), and visceral adiposity index (VAI) were all adopted to define obesity. VAI, an estimate of visceral adiposity that combines lipid parameters and anthropometric measurements, has been noted to be superior to general anthropometric parameters when predicting the occurrence of cardiovascular disease and metabolic syndrome (17, 18). Anthropometric measurements (height, weight) of each participant were recorded in accordance with WHO guidelines (19). Briefly, a stadiometer was used to measure height, and participants stood upright with their back against the vertical backboard of the stadiometer and kept their head in the Frankfort horizontal plane position. A scale was used to record weight, and participants stood with their shoes off (20). WC was measured with a soft measuring tape at the level of the navel. After obtaining anthropometric measurements, the participants’ BMI was computed using the standard formula of weight in kilograms divided by the square of height in meters. According to the guidelines for the prevention and control of obesity in the Chinese population (21), the obese state was defined by BMI cutoff value (obesity, BMI ≥ 28, non-obesity, BMI< 28). The modified WC cutoffs for Chinese populations were used to define central obesity (22), where WC ≥ 90 cm for men and ≥ 80 cm for women. VAI was calculated using a sex-specific formula according to a previous study and divided into quartiles when performing analysis (23), where triglyceride (TG) and high-density lipoprotein cholesterol (HDLc) levels were expressed in mmol/L:
We collected annual concentrations of sulfur dioxide (SO2), nitrogen dioxide (NO2), ozone (O3), and particulate matter with aerodynamic diameters of ≤ 1 μm (PM1), PM2.5, and PM10 levels at 10 km spatial resolution from the ChinaHighAirPollutants (CHAP) dataset. The method was described previously (24, 25). Briefly, the space-time extremely randomized tree (STET) model was utilized to estimate ambient AP concentrations in this study, which incorporates satellite remote sensing with machine learning techniques that account for the spatiotemporal variation in AP. The estimations were highly in accordance with surface measurements, as evidenced by average cross-validation coefficient of determination values (CV-R2) of 0.84, 0.93, 0.87, 0.77, 0.92, and 0.90 and root-mean-square error (RMSE) values of 10.07, 4.89, 17.10, 14.6, 10.76, and 21.12 μg/m3 for the daily concentrations of SO2, NO2, O3, PM1, PM2.5, and PM10, respectively.
Individual annual exposures to SO2, NO2, O3, PM1, PM2.5, and PM10 were geographically matched based on county-level longitude and latitude data. To minimize the disparities in air pollution exposure resulting from individuals’ outdoor work or commuting activities, exposures of AP assigned to each individual were determined as the average air pollution concentrations within a 15 km radius around their corresponding latitude and longitude coordinates. Then, 1-year average exposures for each participant in CHARLS wave 3 were employed in the current study.
Several potential confounders were controlled in the current study, including sociodemographics, lifestyles, health status and meteorological factors. Meteorological factors, such as temperature and specific humidity, were collected from the China Meteorological Administration’s meteorological monitoring stations (available at http://data.cma.cn/). Other confounding factors were collected via standardized questionnaires by experienced interviewers. In this study, sociodemographic covariates were sex (male and female), age level, which was categorized as middle-aged (45 to 64 years) and elderly (65 years and above), residence, which was grouped as rural and urban, and education attainment, grouped as “middle school or below” and “high school or above” (Supplementary Materials). Lifestyle-related covariates included smoking status, categorized as non-smoker, smoker, and second-hand smoker. In relation to smoking status, the term “smoker” referred to a person who had ever smoked before, while “second-hand smoker” was defined as someone who had never smoked himself but had family members who did; alcohol consumption, which was categorized into 3 groups: non-drinker, drink but less than once a month and drink more than once a month; indoor fuel use, which was classified as either “clean fuel use” or “solid fuel use”. Clean fuel use included solar energy, natural gas, biogas, liquefied petroleum gas, and electricity, while solid fuel use included coal, crop residue, and wood burning. Participants who never cooked and those who used other fuels were excluded according to previous study (26). Health status covariates included a self-reported history of hypertension and diabetes mellitus.
The baseline characteristics of the participants were described based on their obesity status. Continuous variables were examined by Kruskal−Wallis tests and presented as the median and the interquartile range (IQR). Categorical variables were presented as counts (percentages) and examined by Chi-squared tests. This study utilized a multilayered analysis strategy. Logistic regression models were performed to estimate the odds ratio (ORs) and 95% confidence interval (CI) of obesity in relation to outdoor AP exposure (per 10 μg/m3 increase in each air pollutant level). The crude estimates were present in Model 0. Based on Model 0, Model 1 was further adjusted for age at baseline visit and sex. Based on Model 1, Model 2 was additionally adjusted for sociodemographic factors (education attainment), lifestyle-related risk factors (alcohol consumption and smoking status), and indoor fuel use.
To investigate potential effect modification by sociodemographic or lifestyle factors, we conducted stratified analyses of the fully adjusted model (Model 2) by age, sex, education attainment, alcohol consumption, and smoking status. In each stratification, except for variables used for stratification, all other covariates were controlled in the models.
To evaluate the reliability of our results, we also conducted several sensitivity analyses via the following methods: a. including only participants who had resided at their present residential location for over 3 years, b. including meteorological factors (temperature and specific humidity) as covariates, c. including history of hypertension and diabetes mellitus as covariates, and iv) excluding participants with a personal history of cardiac events or stroke. A logistic regression-based restricted cubic spline model was implemented to assess the potential nonlinear associations between 6 air pollutants and obesity measured on a continuous scale. To strike a balance between model fit and overfitting of the primary spline for obesity, the knot value corresponding to the minimum Akaike information criterion (AIC) within the knot range from 3 to 5 was selected. Subsequently, variance analysis was conducted to test the statistical significance of the nonlinear relationships. The maximum ORs of obesity on the spline curves correspond to the air pollutant concentrations with the highest risk.
R version 4.2.1 was used for all statistical analyses in this study. Cases with missing covariate values were imputed by the nonparameter method missForest algorithm (27). Statistical significance in this study was defined as a p value less than 0.05 (two-tailed).
In the current study, we analyzed a total of 11,766 middle-aged and elderly individuals (see Figure 1). These respondents were enrolled from 445 communities located in 125 counties across 28 Chinese provinces. Figure 2 displays the geographical distribution of the study participants and the prevalence of obesity. The overall BMI-defined obesity prevalence was 13.3% (1,561/11,766). The prevalence of BMI-defined obesity in all provinces ranges from 5.88% to 26.87%. Tianjin, Xinjiang and Shandong had the top three prevalence rates at 26.87%, 25.93% and 21.92%, respectively (Supplementary Table 1). Regarding spatial distribution patterns, the prevalence of BMI-defined obesity in eastern China was generally higher than that in other regions, particularly in the northeastern regions, and lower in the southern and central regions. Xinjiang, a western province, also maintained a higher prevalence than other regions.
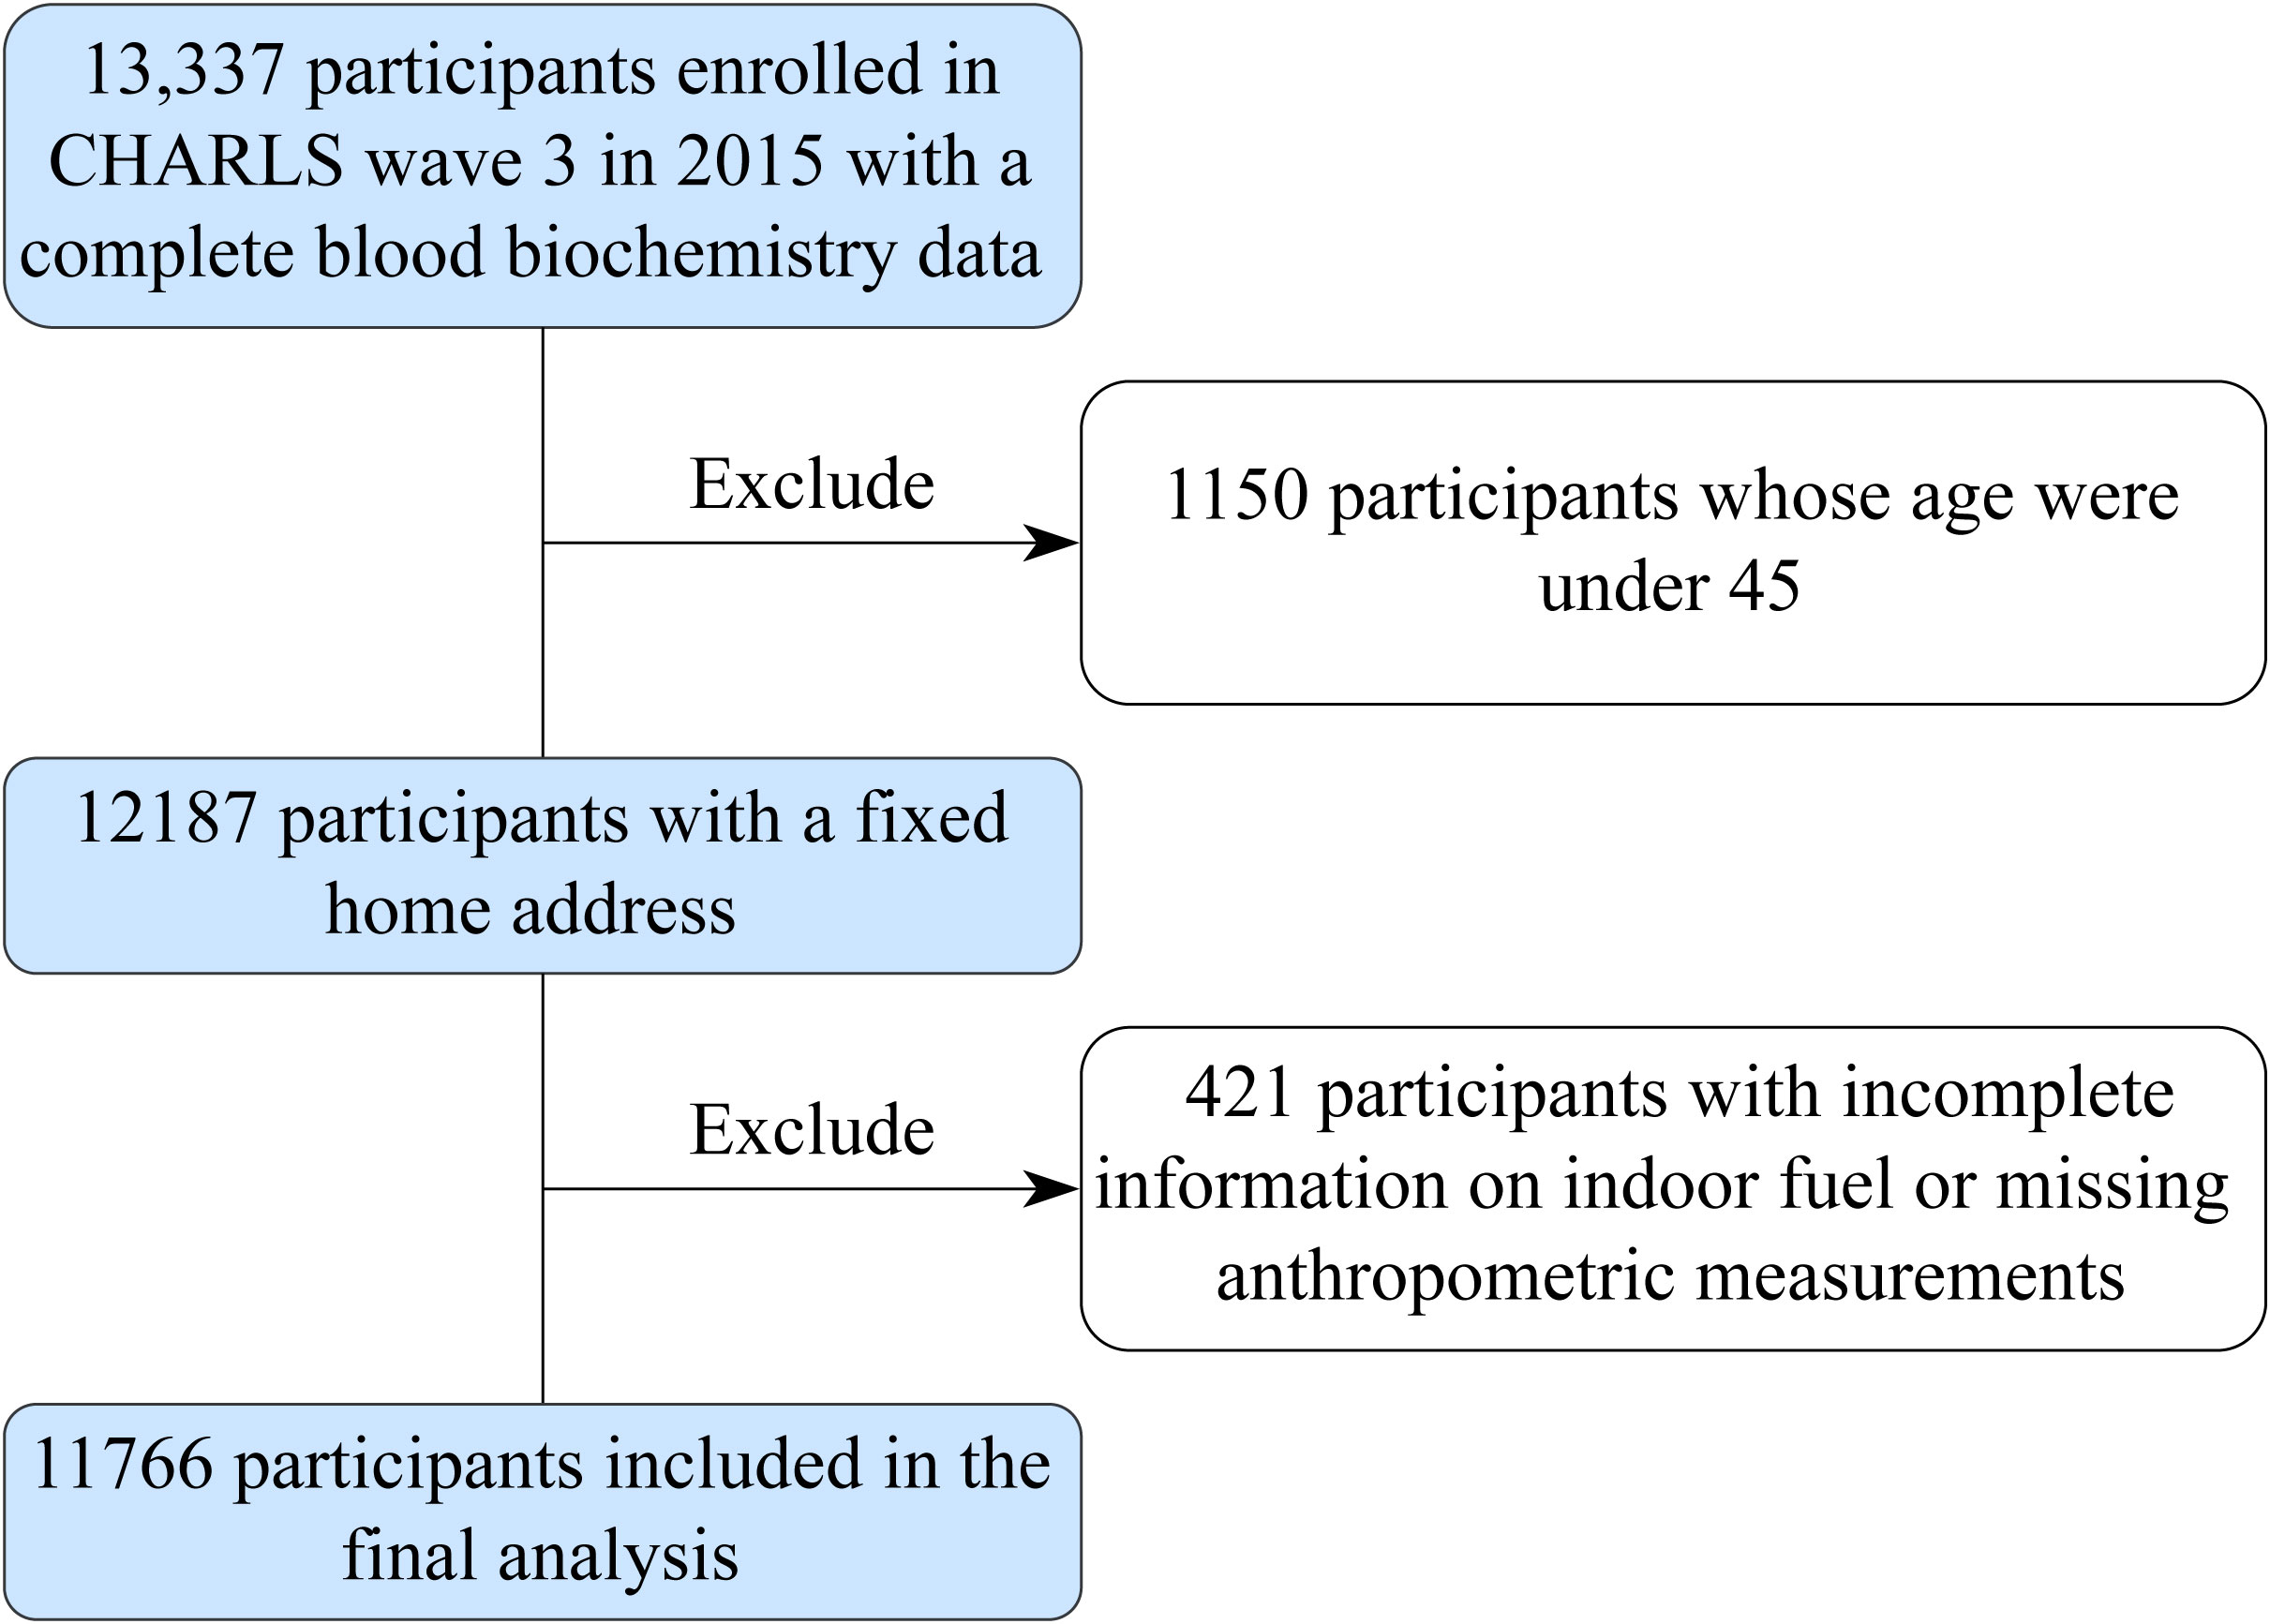
Figure 1 Schematic flow chart of patient inclusion in the study. CHARLS, the China Health and Retirement Longitudinal Study.
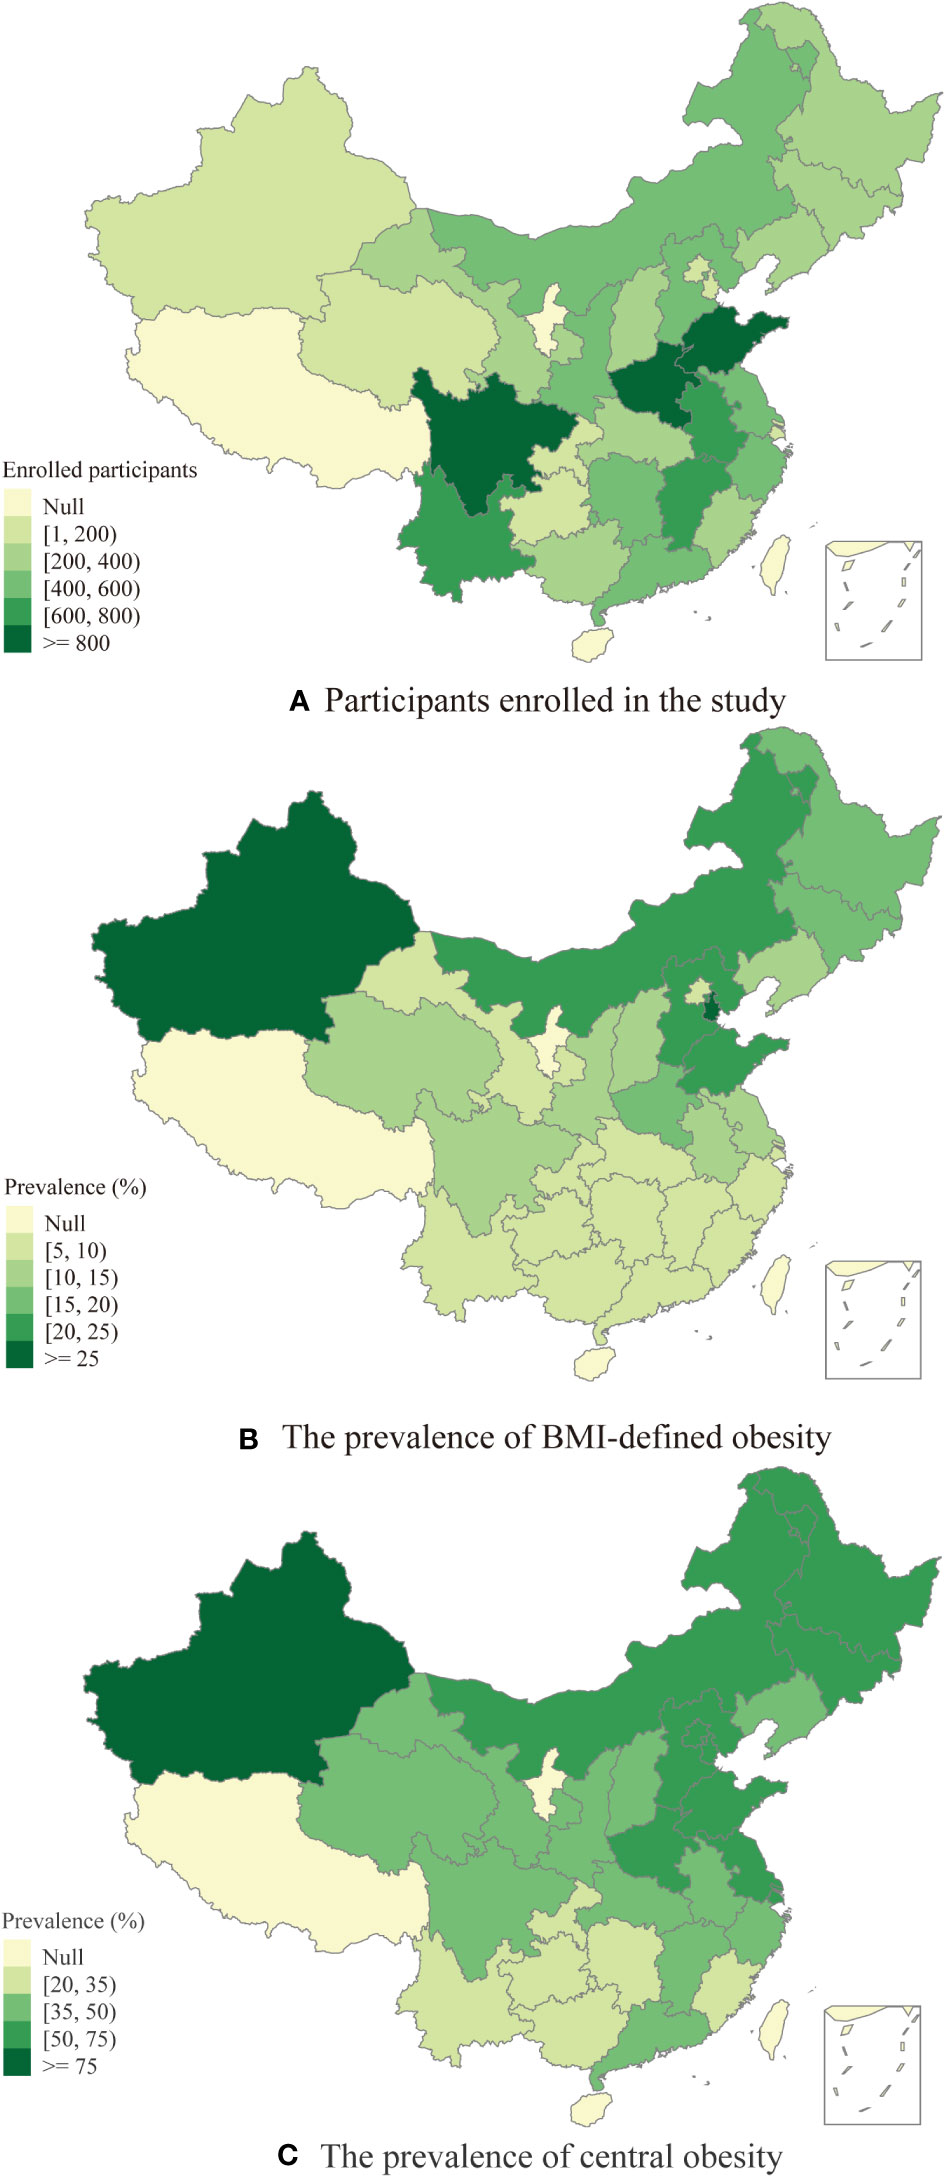
Figure 2 (A) The distribution of participants enrolled in the study. (B) The prevalence of BMI-defined obesity among middle-aged and elderly people. (C) The prevalence of central obesity among middle-aged and elderly people.
Table 1 shows the characteristics of individuals categorized by BMI-defined obesity. The respondents had a median age of 60 years old, 52.8% were female, and 61.94% lived in rural areas. Participants diagnosed with obesity tended to be slightly younger (57 vs. 60 years, P<0.001) and had a higher probability of being female (63.55%, P<0.001) and second-hand smokers (39.65%, P<0.001). In the current analysis, the median SO2, NO2, O3, PM1, PM2.5, and PM10 concentrations were 23.95 μg/m3 (range 16.37-36.22), 30.22 μg/m3 (range 21.84-38.12), 81.43 μg/m3 (range 74.94-92.30), 35.38 μg/m3 (range 31.53-41.08), 52.20 μg/m3 (range 39.62-64.34), and 86.69 μg/m3 (range 62.68-106.49), respectively. A similar distribution of the basic characteristics of participants grouped by WC-defined central obesity was observed and presented in Supplementary Table 2.
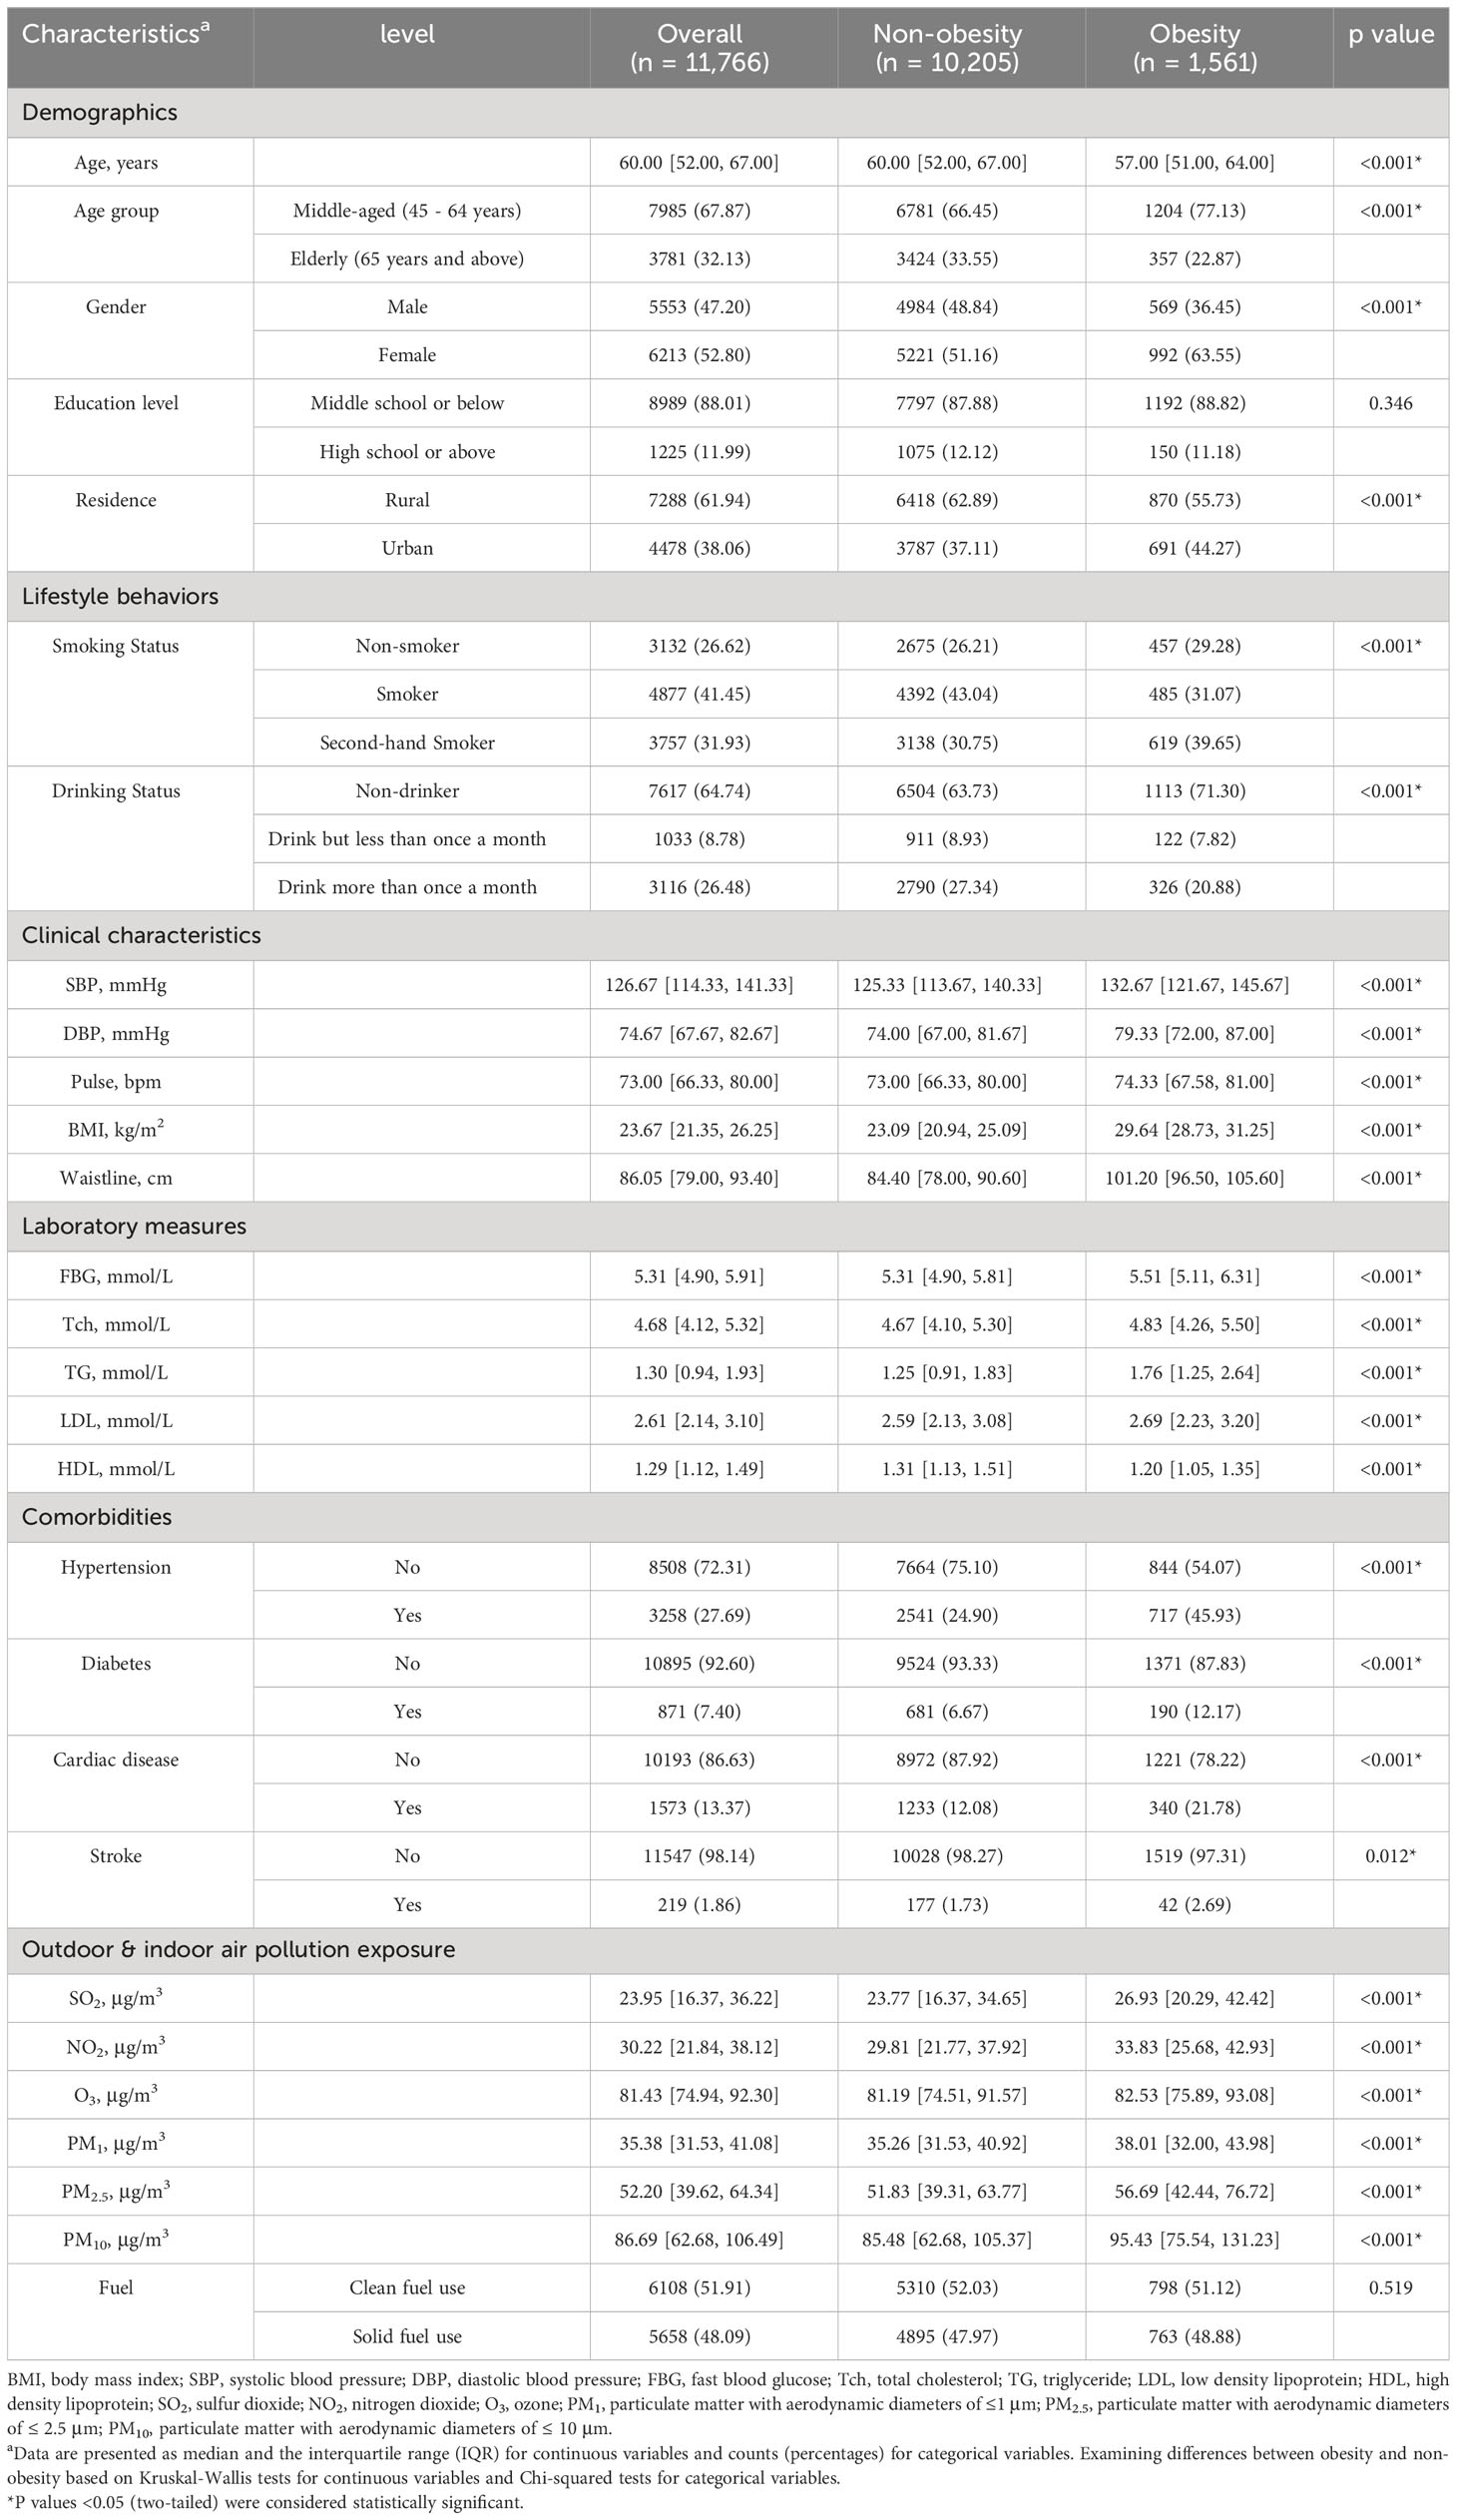
Table 1 Characteristics of the participants according to the presence of BMI-defined obesity.
The association between AP exposure and VAI quartiles is summarized in Supplementary Table 3. The quartile ranges were ≤ 0.96, 0.96-1.50, 1.50-2.48, and ≥ 2.48. According to the trending analysis, with the increase in VAI quartiles, BMI, systolic blood pressure, diastolic blood pressure, fasting blood glucose, TGs, and the prevalence of hypertension and diabetes increased. Moreover, we also observed a significant increase in the average AP exposure with a step increase by VAI quartiles (all P for trend< 0.001).
Figure 3 presents the relationship between the prevalence of obesity and exposure to AP. The results indicate that obesity and AP exposure had positive associations in all three models (crude, Model 1, and Model 2) with varying effect sizes. In Model 2 of obesity defined by BMI, after fully adjusting for age level, sex, educational attainment, alcohol consumption, smoking status, and indoor fuel use, the ORs and 95% CI of obesity were 1.21 (1.17, 1.26), 1.33 (1.26, 1.40), 1.15 (1.10, 1.21), 1.38 (1.29, 1.48), 1.19 (1.15, 1.22), and 1.11 (1.09, 1.13) per 10 μg/m3 increases in SO2, NO2, O3, PM1, PM2.5, and PM10, respectively, suggesting that all 6 ambient AP exposures were significantly associated with the increased prevalence of obesity.
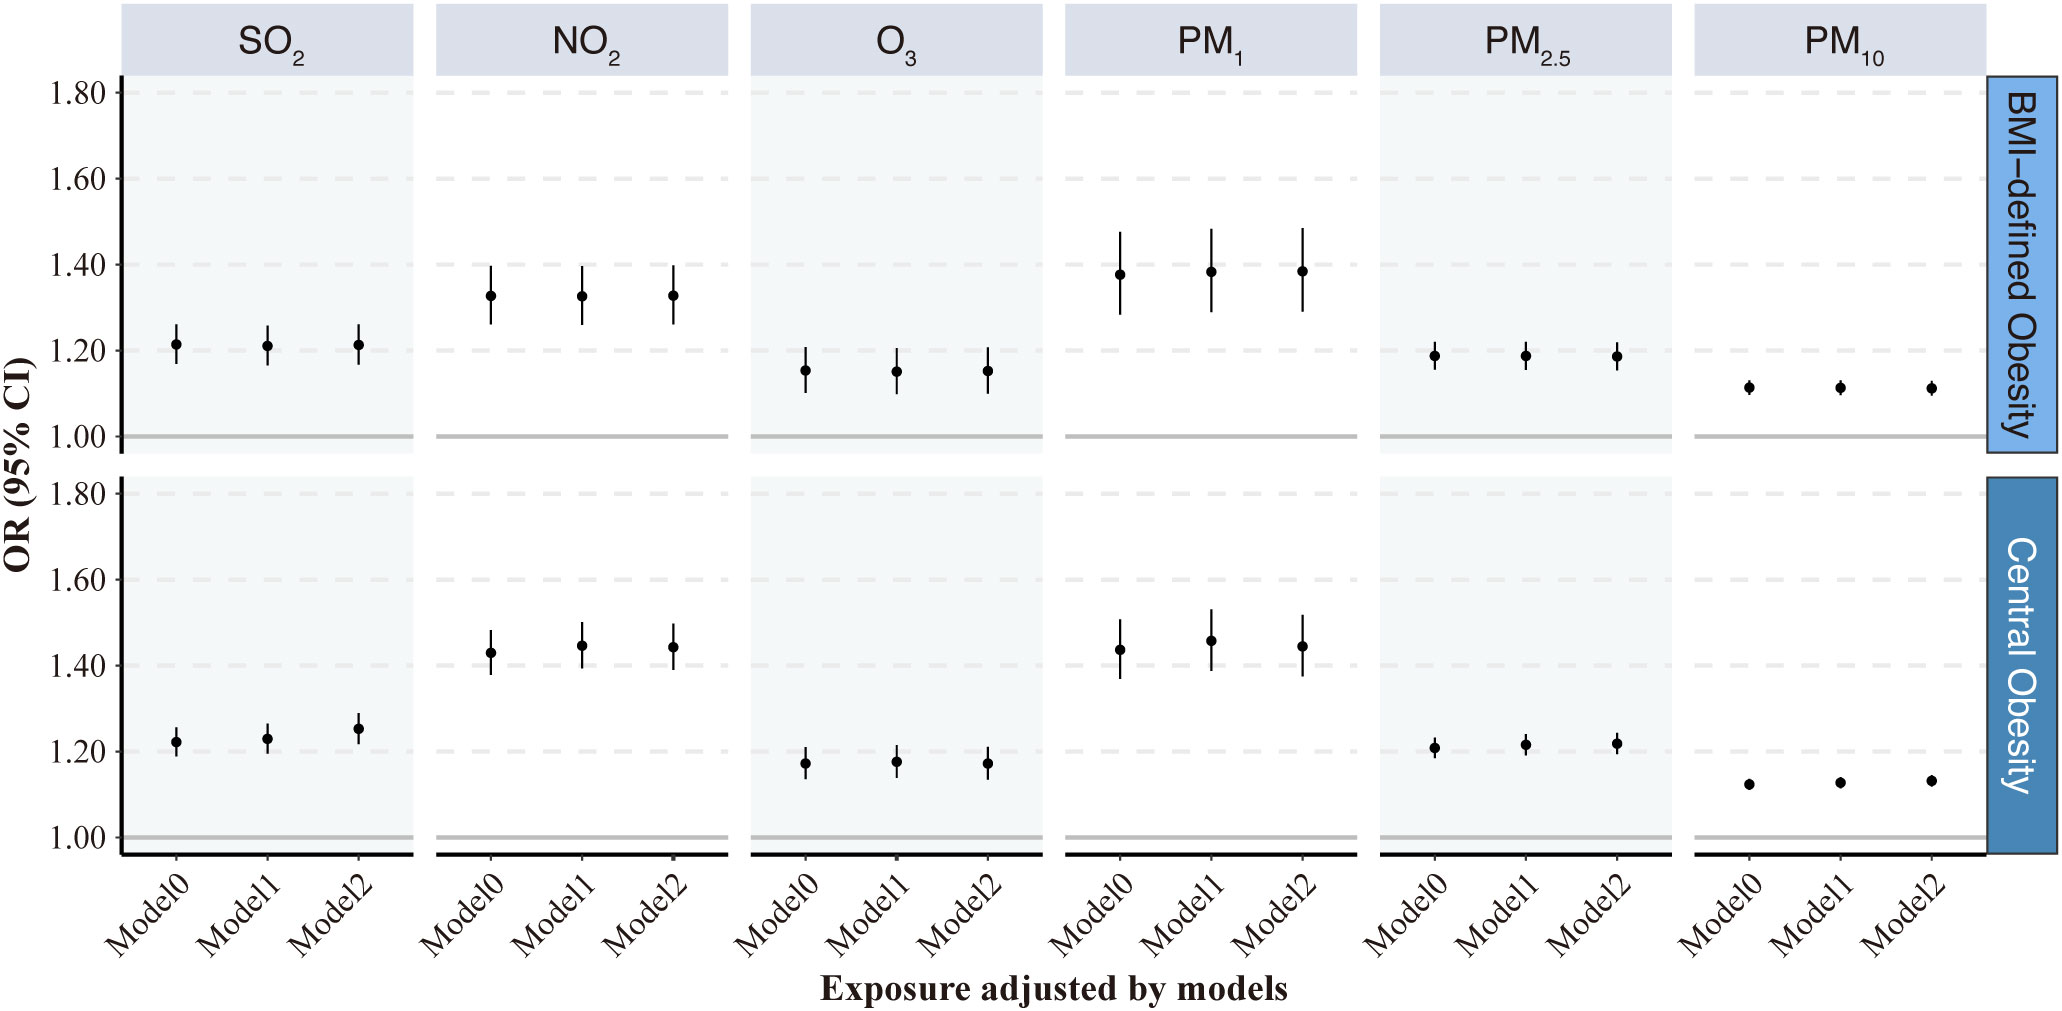
Figure 3 Odds ratios (95% CI) of obesity associated with each 10 μg/m3 increase in the 6 air pollutants. Model 0: initial crude model; Model 1: adjusted for age at baseline visit and gender; Model 2: additionally adjusted for education attainment, alcohol consumption and smoking status, and indoor fuel use. VAI, visceral adiposity index; SO2, sulfur dioxide; NO2, nitrogen dioxide; O3, ozone; PM1, particulate matter with aerodynamic diameters of ≤1 μm; PM2.5, particulate matter with aerodynamic diameters of ≤ 2.5 μm; PM10, particulate matter with aerodynamic diameters of ≤ 10 μm.
The results of Model 2 in obesity defined by BMI were similar to those defined by WC. When central obesity defined by WC was used as the outcome variable, the relationship between AP and obesity did not change significantly; however, AP exposure seemed to result in slightly higher ORs for central obesity defined by WC. The numerical results corresponding to the associations between 6 air pollutants and obesity presented in Figure 3 can be found in Supplementary Table 4.
Table 2 demonstrates the results of multivariate logistic regression modeling analysis between AP exposure and VAI quartiles. In Model 1, when comparing the highest quartile of VAI to the lowest quartile, the ORs for AP exposure were 1.13 (1.09, 1.18), 1.33 (1.26, 1.40), 1.13 (1.08, 1.18), 1.18 (1.10, 1.26), 1.10 (1.07, 1.13) and 1.07 (1.05, 1.09) per 10 μg/m3 increase in SO2, NO2, O3, PM1, PM2.5, and PM10, respectively. After additional adjustments for lifestyle risk factors, education level, and indoor fuel use, the ORs of AP exposure slightly decreased but did not change the association.
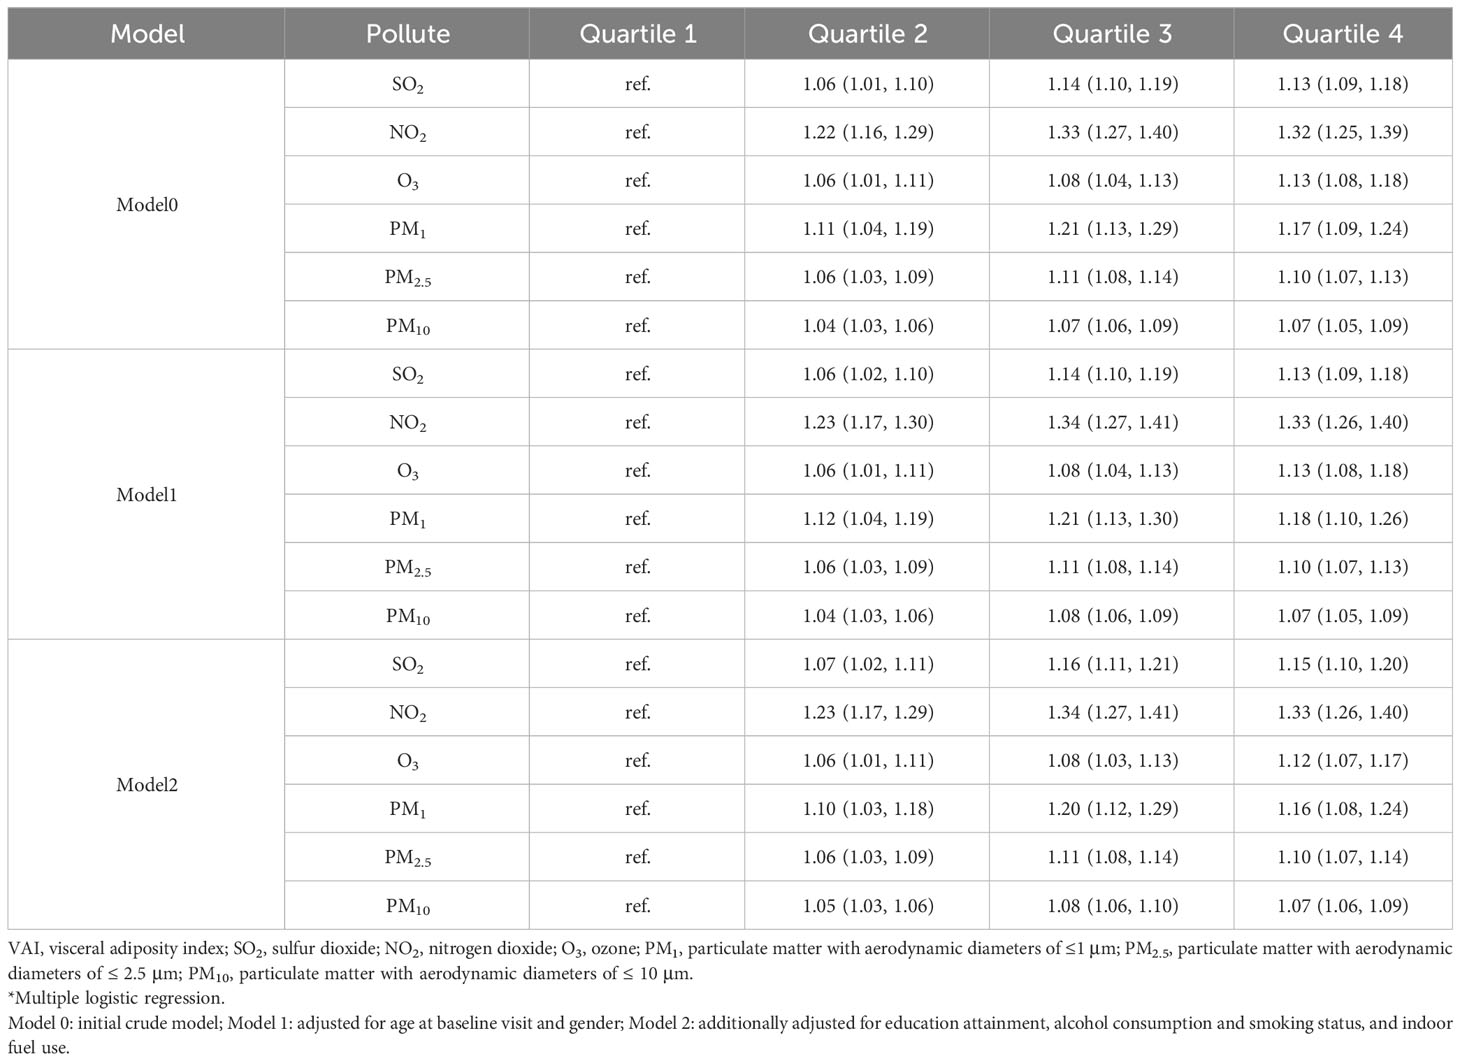
Table 2 Odds ratios (95% CI) of VAI associated with each 10 μg/m3 increase in the 6 air pollutants.
The results of several stratified analyses conducted to assess the effects of AP exposure in participants with different characteristics are presented in Table 3, as classified by BMI. Overall, the positive association between AP exposure and the prevalence of BMI-defined obesity was not substantially modified by sex, educational attainment, smoking status, or alcohol consumption. Notably, the observed positive association of NO2, PM1, PM2.5, and PM10 exposures was more pronounced among elderly participants (ORs: 1.50 (1.35, 1.67), 1.60 (1.37, 1.87), 1.26 (1.19, 1.33) and 1.15 (1.12, 1.19) per 10 μg/m3 increases in air pollutant above), while the relationship remained significant between O3 and both female and second-hand smokers (ORs: 1.21 (1.14, 1.28) for female and 1.28 (1.19, 1.38) for the second-hand smoker), demonstrating a strong interaction between outdoor O3 exposure and sex and smoking status on BMI-defined obesity. In addition, we observed that participants with lower education levels and those who were second-hand smokers or who drink more than once a month were more likely to develop BMI-defined obesity when exposed to ambient AP, despite there being no statistically significant interactions for education attainment and lifestyle risk factors.
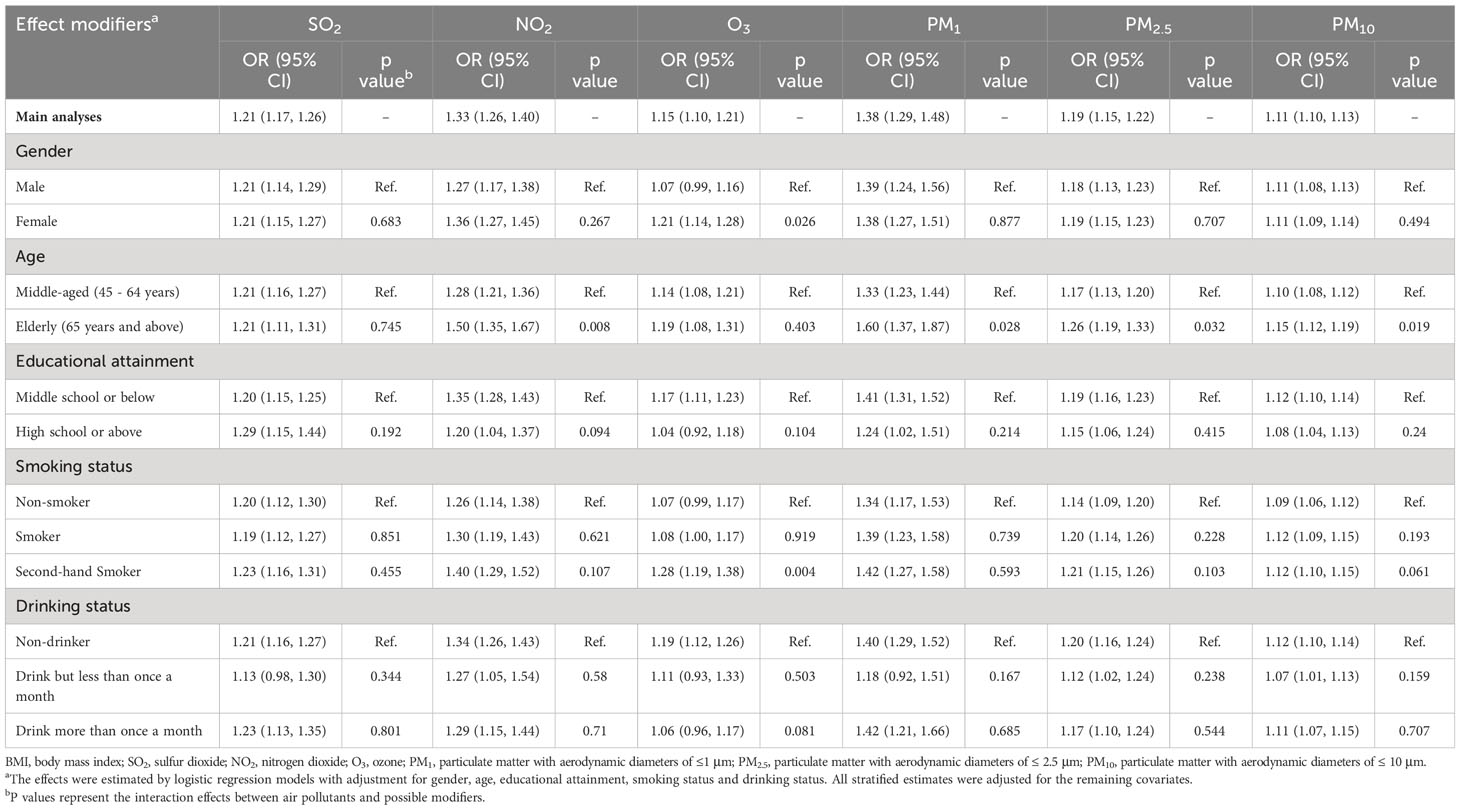
Table 3 Odds ratios (95% CI) of BMI-defined obesity associated with each 10 μg/m3 increase of SO2, NO2, O3, PM1, PM2.5, PM10, stratified by demographic and lifestyle factors.
Similar effects were also observed in WC-defined central obesity (Supplementary Table 5). However, there were no significant differences in the interactions between AP exposure and central obesity among participants stratified by different characteristics.
Table 4 displays the estimated ORs of obesity for all models. Sensitivity analysis 1 indicated that the estimated OR of obesity with AP exposure remained similar when only participants who had resided at their present residential location for over 3 years were included. Sensitivity analysis 2 found that when further including temperature and specific humidity, the ORs for obesity due to PM1 exposure slightly increased. Specifically, the OR was 1.59 (1.42, 1.77) vs. 1.48 (1.36, 1.61) for BMI-defined obesity and 1.57 (1.46, 1.69) vs. 1.53 (1.44, 1.62) for WC-defined central obesity. In sensitivity analysis 3, there was no significant difference in all models after adjusting for either hypertension or diabetes history. In sensitivity analysis 4, the results were consistent with the primary model when a sample with a personal history of cardiac events or stroke was restricted. Overall, sensitivity analysis suggested that the main results were robust concerning the participants.
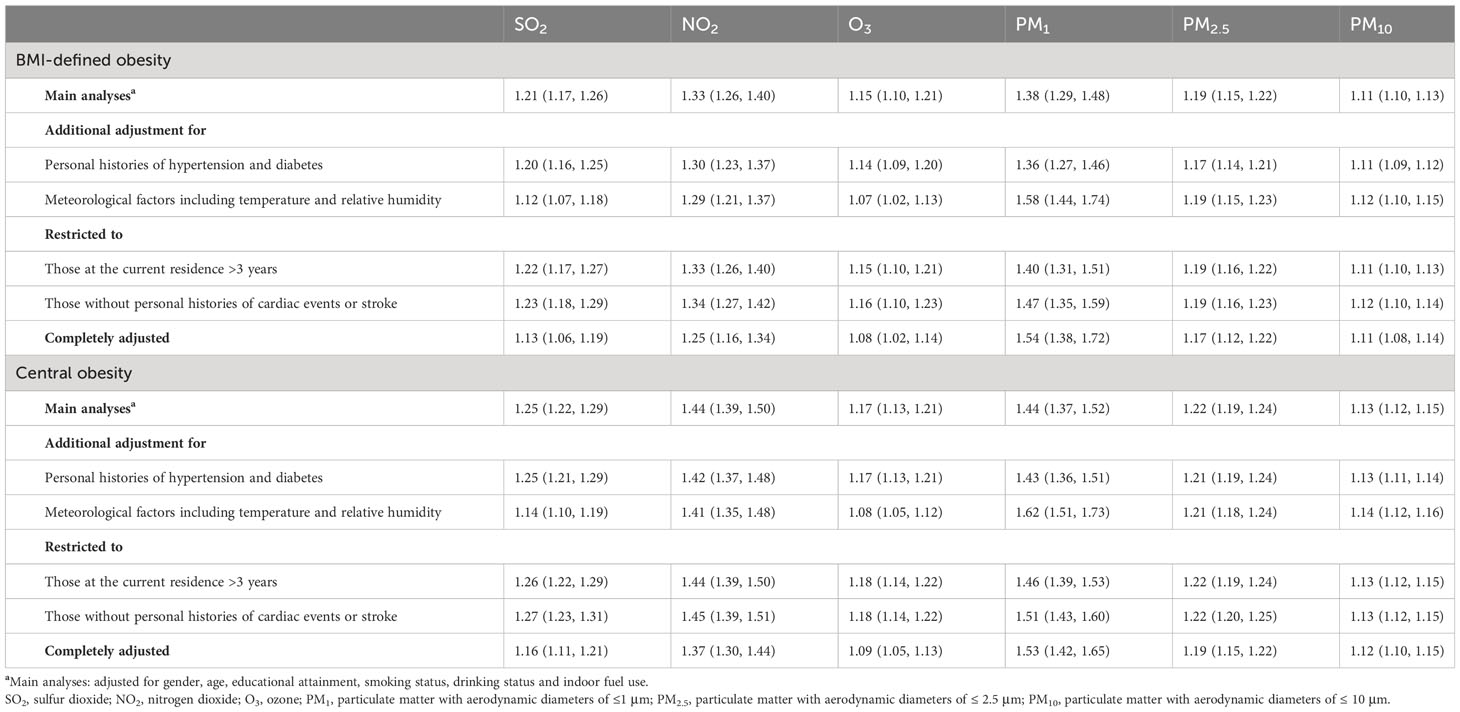
Table 4 Sensitivity analyses of ORs (95% CIs) of BMI-defined obesity associated with each 10 μg/m3 increase in the 6 air pollutants.
Supplementary Figure 1 illustrates the association between obesity and AP exposure on a continuous scale using the RCS model. The spline curves indicate a significant nonlinear relationship between obesity and SO2, PM2.5, and PM10 exposures according to the RCS models. However, the nonlinear results of NO2 and PM1 differ between BMI-defined obesity and central obesity. Regarding the O3 curves, linearity of the exposure-response association was observed in both BMI-defined obesity and central obesity. As depicted in Supplementary Figure 1A, the risk of obesity increased with the level of SO2 when the SO2 concentration was less than 42.9 μg/m3 in BMI-defined obesity and 46.2 μg/m3 in central obesity but decreased when the SO2 concentration exceeded these values. With regard to the other 5 air pollutants, irrespective of the significance of the linearity effect within the observable range of the corresponding air pollution concentration, the ORs of obesity increased with the AP concentration. The results of the significance tests corresponding to Supplementary Figure 1 are shown in Supplementary Table 6.
To the best of our knowledge, this was the first study to investigate the association between different parameters of obesity and AP exposure among middle-aged and elderly individuals within the Chinese population. Our cross-sectional study of 13,077 participants found that exposure to outdoor AP, including gaseous pollutants (SO2, NO2, O3) and particulate matter (PM1, PM2.5, and PM10), was significantly linked to higher obesity risk. Moreover, we also found significant multiplicative interaction effects between O3 exposure and several demographic and lifestyle factors on BMI-defined obesity, including sex, age, and smoking status. Sensitivity analyses validated the findings.
We are aware that there are several relevant epidemiological studies that analyze the impact of exposure to AP on obesity risk within the Chinese population. One study enrolled 24,845 participants and suggested that exposure to high concentrations of AP is positively correlated with overweight and obesity among adults (28). However, the survey area of the respondents was limited to Liaoning, an industry-oriented province in northeast China (29), which may not reflect the nationwide relationship between AP exposure and obesity. Another study found similar results, but limited to Anhui province in eastern China and used only BMI to classify normal weight and obesity. This limitation may restrict the potential biological implications related to adipose tissues (30). Although BMI is a general measure of obesity or adiposity in the Chinese population, it does not offer details about body-fat distribution, specifically subcutaneous adiposity or visceral adiposity. Studies have shown that visceral adiposity, or the amount of fat stored around the abdominal organs, is a better indicator of cardiovascular disease than BMI alone (31, 32). Additionally, a previous study reported that Chinese populations present higher levels of visceral adiposity than white people when total body fat mass is equal (33). This could potentially explain the increased risk of cardiometabolic disease in the Chinese population with a low BMI. In addition, studies have suggested that in the absence of clinical imaging evidence, WC is currently recommended as an alternative marker for measuring ectopic fat and central obesity (34, 35). In the current study, our results showed that AP was significantly linked to a higher risk of central obesity and a higher quantile of VAI in middle-aged and elderly adults, providing a more comprehensive view of the impact of AP exposure on abdominal and visceral adipose tissue beyond BMI alone.
Our study suggested that women may suffer greater impacts of O3 exposure on the risk of obesity, consistent with a prior study (36). There is growing evidence reporting the sex-specific difference between AP exposure and health, although some controversy still remains over their exact biological roles (37, 38). One time-series study proposed that females were more vulnerable when exposed to AP (39). Another study based on a Chinese rural population suggested that AP exposure in females was linked to an increased prevalence of obesity (11). Previous studies reported that women may be more susceptible than men to the adverse effect of O3 exposure, manifested by higher rates of hospitalization and slightly higher mortality for a 10-ppb increase in 8-hour O3 concentration (40–42). The underlying mechanism of sex-specific differences may be partially explained by hormones and physiological fluctuations in the female reproductive cycle (43, 44). Researchers have observed that there is no appreciable interaction between O3 exposure and smoking (45), which is consistent with our findings. In this study, a multiplicative interaction with O3 exposure was observed specifically among second-hand smokers rather than smokers, which may be partially explained by the enhanced sensitivity of the lungs to O3 exposure following short-term sidestream cigarette smoke (46, 47). Our results showed that AP exposure had a significant effect on BMI-defined obesity in elderly adults compared with the middle-aged population. Age may affect the association between AP and obesity, and the phenomenon may be attributed to decreased physical functioning and poorer physical reserves in the elderly population (48). Elderly individuals are known to have poor immune responsiveness, which can lead to increased susceptibility, severity of diseases, and systemic inflammation when exposed to AP (49).
Although the detailed mechanism underlying AP in obesity remains unclear, several animal experiments could partially interpret the potential associations. First, previous studies have suggested that exposure to O3 could stimulate the synthesis and secretion of leptin by activating lipopolysaccharides (50) and the hypothalamus pituitary adrenal axis (51) and increasing the release of fasting fatty acids (52), which may be associated with subsequent obesity (53). Second, a study revealed that exposure to ambient particulate matter induced systemic inflammation, which can lead to inflammation in various organs, including the liver and adipose tissue. This inflammation can contribute to the overgrowth of adipose tissue and dysregulation of lipid homeostasis (54). Additionally, particulate matter exposure increased oxidative stress and induced Toll-like receptor 2/4-dependent inflammatory activation in the lung and further spilled over systematically, finally leading to metabolic dysfunction and obesity (14). Recent studies have also raised the hypothesis that the gut microbiota may mediate the association between AP and obesity (55–57). Briefly, AP exposure can change the composition of gut bacteria, resulting in increased proinflammatory cytokine production and a decrease in glucose intolerance, which may be linked to obesity and diabetes.
A novel finding of the current study was that exposure to PM1 resulted in greater harm to obesity risks than exposure to other APs presented in this study. In other words, it appears that a larger diameter of the particles corresponds to a lower health hazard. Previous studies have explored the association of health hazards and the size of particles (58, 59); however, these studies have mostly focused on PM2.5 and PM10, with insufficient evidence regarding the health implications of smaller particles such as PM1 (60, 61). One possible explanation for this phenomenon is that smaller particles, especially PM1, could more easily enter the acinar section of the respiratory tract due to their higher surface-to-volume ratio, consequently promoting oxidative stress and inflammation and further health distress (62). Another alternative explanation is that PM1 may contain anthropogenic toxins, such as metals, which can lead to health damage and further genetic abnormalities as well as cancer (63).
This study is subject to several limitations. First, due to the absence of more detailed addresses, the AP concentrations matched to individuals were at county levels, which prevented the assessment of occupational risks and may deviate from the ideal theoretical value. Second, we only calculated the 1-year average outdoor AP exposure for analysis in the current study, which may result in misestimation of the effects of AP on obesity. Third, as our study is based on cross-sectional data, we cannot establish causal relationships between AP and the risk of obesity. Fourth, the unavailability of more lifestyle characteristics in the CHARLS dataset might lead to an underestimate of our results. Last, this study was conducted in an Asian population, and further validation is necessary when generalizing our findings to other populations and regions.
In conclusion, the present study found that there is a significant association between exposure to outdoor AP and an increased risk of obesity in middle-aged and elderly Chinese populations. Our findings contribute to evidence demonstrating the detrimental impact of outdoor AP on both subcutaneous adiposity and visceral adiposity. We also observed that women and elderly individuals may be more vulnerable to AP exposure-associated obesity. Additionally, our study demonstrated that smaller diameter of the particles corresponds to more health hazard. Further prospective studies are required to confirm the results of this study.
Datasets were obtained from the China Health and Retirement Longitudinal Study (CHARLS) 2015 (available at https://charls.pku.edu.cn/); Air pollution exposures were collected from ChinaHighAirPollutants (CHAP) dataset (available at https://weijing-rs.github.io/product.html); Meteorological factors (temperature and relative humidity) were obtained from meteorological monitoring stations in the China Meteorological Administration (http://data.cma.cn/).
The studies involving humans were approved by Institutional Review Board of Peking University (Code: IRB00001052-11015). The studies were conducted in accordance with the local legislation and institutional requirements. The participants provided their written informed consent to participate in this study.
JW: Conceptualization, Methodology. J-JQ: Methodology, Project administration. WP: Software, Writing - Original Draft, Data curation. YH: Visualization. ZL: Investigation, Software. HC: Supervision, Validation. MW: Writing - Review & Editing. All authors contributed to the article and approved the submitted version.
Grant from the National Natural Science Foundation of China (82000299), Excellent Doctoral Program of Zhongnan Hospital of Wuhan University (ZNYB2022001).
The authors declare that the research was conducted in the absence of any commercial or financial relationships that could be construed as a potential conflict of interest.
All claims expressed in this article are solely those of the authors and do not necessarily represent those of their affiliated organizations, or those of the publisher, the editors and the reviewers. Any product that may be evaluated in this article, or claim that may be made by its manufacturer, is not guaranteed or endorsed by the publisher.
The Supplementary Material for this article can be found online at: https://www.frontiersin.org/articles/10.3389/fendo.2023.1221325/full#supplementary-material
Supplementary Figure 1 | Restricted cubic spline with different knots for potential nonlinear association between 6 air pollutants and obesity on a continuous scale. The ORs and 95% confidence intervals represent the predicted levels of 6 air pollutants. Analyses were fully adjusted for age level, gender, education attainment, smoking status, alcohol consumption, history of hypertension and diabetes, indoor fuel use, temperature and specific humidity. OR, odds ratio; CI, confidence interval; BMI, body-mass index; SO2, sulfur dioxide; NO2, nitrogen dioxide; O3, ozone; PM1, particulate matter with aerodynamic diameters of ≤1 μm; PM2.5, particulate matter with aerodynamic diameters of ≤ 2.5 μm; PM10, particulate matter with aerodynamic diameters of ≤ 10 μm.
1. Swinburn BA, Kraak VI, Allender S, Atkins VJ, Baker PI, Bogard JR, et al. The global syndemic of obesity, undernutrition, and climate change: the Lancet Commission report. Lancet (2019) 393(10173):791–846. doi: 10.1016/S0140-6736(18)32822-8
2. Blüher M. Obesity: global epidemiology and pathogenesis. Nat Rev Endocrinol (2019) 15(5):288–98. doi: 10.1038/s41574-019-0176-8
3. Chooi YC, Ding C, Magkos F. The epidemiology of obesity. Metabolism (2019) 92:6–10. doi: 10.1016/j.metabol.2018.09.005
4. Fan J-G, Kim S-U, Wong VW-S. New trends on obesity and NAFLD in Asia. J Hepatol (2017) 67(4):862–73. doi: 10.1016/j.jhep.2017.06.003
5. Mukherjee A, Agrawal M. A global perspective of fine particulate matter pollution and its health effects. Rev Environ Contam Toxicol (2018) 244:5–51. doi: 10.1007/398_2017_3
6. Chen S, Wang S, Li T, Zhu H, Liang S, Xu K, et al. Effect of PM2. 5 on macrosomia in China: A nationwide prospective cohort study. Pediatr Obes (2020) 15(2):e12584. doi: 10.1111/ijpo.12584
7. Li R, Hopke PK, Dozier A, Thurston SW, Thevenet-Morrison K, Croft D, et al. Term birth weight and ambient air pollutant concentrations during pregnancy, among women living in Monroe County, New York. J exposure Sci Environ Epidemiol (2019) 29(4):500–9. doi: 10.1038/s41370-019-0131-8
8. Jerrett M, McConnell R, Wolch J, Chang R, Lam C, Dunton G, et al. Traffic-related air pollution and obesity formation in children: a longitudinal, multilevel analysis. Environ Health (2014) 13:49. doi: 10.1186/1476-069X-13-49
9. McConnell R, Shen E, Gilliland FD, Jerrett M, Wolch J, Chang CC, et al. A longitudinal cohort study of body mass index and childhood exposure to secondhand tobacco smoke and air pollution: the Southern California Children's Health Study. Environ Health Perspect (2015) 123(4):360–6. doi: 10.1289/ehp.1307031
10. Furlong MA, Klimentidis YC. Associations of air pollution with obesity and body fat percentage, and modification by polygenic risk score for BMI in the UK Biobank. Environ Res (2020) 185:109364. doi: 10.1016/j.envres.2020.109364
11. Liu X, Tu R, Qiao D, Niu M, Li R, Mao Z, et al. Association between long-term exposure to ambient air pollution and obesity in a Chinese rural population: The Henan Rural Cohort Study. Environ pollut (2020) 260:114077. doi: 10.1016/j.envpol.2020.114077
12. James P, Kioumourtzoglou MA, Hart JE, Banay RF, Kloog I, Laden F. Interrelationships between walkability, air pollution, greenness, and body mass index. Epidemiology (2017) 28(6):780–8. doi: 10.1097/EDE.0000000000000724
13. Xu X, Yavar Z, Verdin M, Ying Z, Mihai G, Kampfrath T, et al. Effect of early particulate air pollution exposure on obesity in mice: role of p47phox. Arteriosclerosis thrombosis Vasc Biol (2010) 30(12):2518–27. doi: 10.1161/ATVBAHA.110.215350
14. Wei Y, Zhang JJ, Li Z, Gow A, Chung KF, Hu M, et al. Chronic exposure to air pollution particles increases the risk of obesity and metabolic syndrome: findings from a natural experiment in Beijing. FASEB J (2016) 30(6):2115–22. doi: 10.1096/fj.201500142
15. Campolim CM, Weissmann L, Ferreira CKO, Zordao OP, Dornellas APS, de Castro G, et al. Short-term exposure to air pollution (PM(2.5)) induces hypothalamic inflammation, and long-term leads to leptin resistance and obesity via Tlr4/Ikbke in mice. Sci Rep (2020) 10(1):10160. doi: 10.1038/s41598-020-67040-3
16. Zhao Y, Hu Y, Smith JP, Strauss J, Yang G. Cohort profile: the China health and retirement longitudinal study (CHARLS). Int J Epidemiol (2014) 43(1):61–8. doi: 10.1093/ije/dys203
17. Kouli GM, Panagiotakos DB, Kyrou I, Georgousopoulou EN, Chrysohoou C, Tsigos C, et al. Visceral adiposity index and 10-year cardiovascular disease incidence: The ATTICA study. Nutr Metab Cardiovasc Dis (2017) 27(10):881–9. doi: 10.1016/j.numecd.2017.06.015
18. Vizzuso S, Del Torto A, Dilillo D, Calcaterra V, Di Profio E, Leone A, et al. Visceral adiposity index (VAI) in children and adolescents with obesity: no association with daily energy intake but promising tool to identify metabolic syndrome (MetS). Nutrients (2021) 13(2):413. doi: 10.3390/nu13020413
19. Physical status: the use and interpretation of anthropometry. In: Report of a WHO Expert Committee. World Health Organ Tech Rep Ser. p. 1–452. 854.
20. Niu Z, Duan Z, Wei J, Wang F, Han D, Zhang K, et al. Associations of long-term exposure to ambient ozone with hypertension, blood pressure, and the mediation effects of body mass index: A national cross-sectional study of middle-aged and older adults in China. Ecotoxicol Environ Saf (2022) 242:113901. doi: 10.1016/j.ecoenv.2022.113901
21. Yang G, Kong L, Zhao W, Wan X, Zhai Y, Chen LC, et al. Emergence of chronic non-communicable diseases in China. Lancet (2008) 372(9650):1697–705. doi: 10.1016/S0140-6736(08)61366-5
22. Alberti KG, Eckel RH, Grundy SM, Zimmet PZ, Cleeman JI, Donato KA, et al. Harmonizing the metabolic syndrome: a joint interim statement of the International Diabetes Federation Task Force on Epidemiology and Prevention; National Heart, Lung, and Blood Institute; American Heart Association; World Heart Federation; International Atherosclerosis Society; and International Association for the Study of Obesity. Circulation (2009) 120(16):1640–5. doi: 10.1161/CIRCULATIONAHA.109.192644
23. Amato MC, Giordano C, Galia M, Criscimanna A, Vitabile S, Midiri M, et al. Visceral Adiposity Index: a reliable indicator of visceral fat function associated with cardiometabolic risk. Diabetes Care (2010) 33(4):920–2. doi: 10.2337/dc09-1825
24. Wei J, Li Z, Li K, Dickerson RR, Pinker RT, Wang J, et al. Full-coverage mapping and spatiotemporal variations of ground-level ozone (O3) pollution from 2013 to 2020 across China. Remote Sens Environ (2022) 270:112775. doi: 10.1016/j.rse.2021.112775
25. Wei J, Li Z, Lyapustin A, Sun L, Peng Y, Xue W, et al. Reconstructing 1-km-resolution high-quality PM2.5 data records from 2000 to 2018 in China: spatiotemporal variations and policy implications. Remote Sens Environ (2021) 252:112136. doi: 10.1016/j.rse.2020.112136
26. Cao L, Zhao Z, Ji C, Xia Y. Association between solid fuel use and cognitive impairment: A cross-sectional and follow-up study in a middle-aged and older Chinese population. Environ Int (2021) 146:106251. doi: 10.1016/j.envint.2020.106251
27. Stekhoven DJ, Bühlmann P. MissForest–non-parametric missing value imputation for mixed-type data. Bioinformatics (2012) 28(1):112–8. doi: 10.1093/bioinformatics/btr597
28. Li M, Qian Z, Vaughn M, Boutwell B, Ward P, Lu T, et al. Sex-specific difference of the association between ambient air pollution and the prevalence of obesity in Chinese adults from a high pollution range area: 33 Communities Chinese Health Study. Atmospheric Environ (2015) 117:227–33. doi: 10.1016/j.atmosenv.2015.07.029
29. Shi T, Hu Y, Liu M, Li C, Zhang C, Liu C. How do economic growth, urbanization, and industrialization affect fine particulate matter concentrations? An assessment in Liaoning Province, China. Int J Environ Res Public Health (2020) 17(15):5441. doi: 10.3390/ijerph17155441
30. Li G, Liu J, Lu H, Hu W, Hu M, He J, et al. Multiple environmental exposures and obesity in eastern China: An individual exposure evaluation model. Chemosphere (2022) 298:134316. doi: 10.1016/j.chemosphere.2022.134316
31. Abraham TM, Pedley A, Massaro JM, Hoffmann U, Fox CS. Association between visceral and subcutaneous adipose depots and incident cardiovascular disease risk factors. Circulation (2015) 132(17):1639–47. doi: 10.1161/CIRCULATIONAHA.114.015000
32. Neeland IJ, Turer AT, Ayers CR, Berry JD, Rohatgi A, Das SR, et al. Body fat distribution and incident cardiovascular disease in obese adults. J Am Coll Cardiol (2015) 65(19):2150–1. doi: 10.1016/j.jacc.2015.01.061
33. Lear SA, Lesser IA. A review of obesity and body fat distribution and its relationship to cardio-metabolic risk in men and women of Chinese origin. Cardiovasc Hematol Disord Drug Targets (2012) 12(2):113–8. doi: 10.2174/1871529X11202020113
34. Ross R, Neeland IJ, Yamashita S, Shai I, Seidell J, Magni P, et al. Waist circumference as a vital sign in clinical practice: a Consensus Statement from the IAS and ICCR Working Group on Visceral Obesity. Nat Rev Endocrinol (2020) 16(3):177–89. doi: 10.1038/s41574-019-0310-7
35. Neeland IJ, Ross R, Després JP, Matsuzawa Y, Yamashita S, Shai I, et al. Visceral and ectopic fat, atherosclerosis, and cardiometabolic disease: a position statement. Lancet Diabetes Endocrinol (2019) 7(9):715–25. doi: 10.1016/S2213-8587(19)30084-1
36. Qin X-D, Qian Z, Vaughn MG, Trevathan E, Emo B, Paul G, et al. Gender-specific differences of interaction between obesity and air pollution on stroke and cardiovascular diseases in Chinese adults from a high pollution range area: A large population based cross sectional study. Sci Total Environ (2015) 529:243–8. doi: 10.1016/j.scitotenv.2015.05.041
37. Clougherty JE. A growing role for gender analysis in air pollution epidemiology. Environ Health Perspect (2010) 118(2):167–76. doi: 10.1289/ehp.0900994
38. Zanobetti A, Schwartz J. Race, gender, and social status as modifiers of the effects of PM10 on mortality. J Occup Environ Med (2000) 42(5):469–74. doi: 10.1097/00043764-200005000-00002
39. Kan H, London SJ, Chen G, Zhang Y, Song G, Zhao N, et al. Season, sex, age, and education as modifiers of the effects of outdoor air pollution on daily mortality in Shanghai, China: The Public Health and Air Pollution in Asia (PAPA) Study. Environ Health Perspect (2008) 116(9):1183–8. doi: 10.1289/ehp.10851
40. Bell ML, Zanobetti A, Dominici F. Who is more affected by ozone pollution? A systematic review and meta-analysis. Am J Epidemiol (2014) 180(1):15–28. doi: 10.1093/aje/kwu115
41. Medina-Ramón M, Schwartz J. Who is more vulnerable to die from ozone air pollution? Epidemiology (2008) 19(5):672–9. doi: 10.1097/EDE.0b013e3181773476
42. Zhang Y, Huang W, London SJ, Song G, Chen G, Jiang L, et al. Ozone and daily mortality in Shanghai, China. Environ Health Perspect (2006) 114(8):1227–32. doi: 10.1289/ehp.9014
43. Lovejoy JC. The influence of sex hormones on obesity across the female life span. J Women's Health (1998) 7(10):1247–56. doi: 10.1089/jwh.1998.7.1247
44. Zatko T, Matejovicova B, Boledovicova M, Vondrakova M, Bezakova A, Sirotkin A. Growth and obesity and its association with plasma level of steroid hormones and insulin-like growth factor-I (IGF-I) in Slovak female students. Bratislavske Lekarske Listy (2013) 114(10):573–80. doi: 10.4149/BLL_2013_123
45. Shephard RJ, Urch B, Silverman F, Corey PN. Interaction of ozone and cigarette smoke exposure. Environ Res (1983) 31(1):125–37. doi: 10.1016/0013-9351(83)90069-5
46. Yu M, Pinkerton KE, Witschi H. Short-term exposure to aged and diluted sidestream cigarette smoke enhances ozone-induced lung injury in B6C3F1 mice. Toxicol Sci (2002) 65(1):99–106. doi: 10.1093/toxsci/65.1.99
47. Nishikawa M, Ikeda H, Nishiyama H, Yamakawa H, Suzuki S, Okubo T. Combined effects of ozone and cigarette smoke on airway responsiveness and vascular permeability in Guinea pigs. Lung (1992) 170(6):311–22. doi: 10.1007/BF00177577
48. Sacks JD, Stanek LW, Luben TJ, Johns DO, Buckley BJ, Brown JS, et al. Particulate matter-induced health effects: who is susceptible? Environ Health Perspect (2011) 119(4):446–54. doi: 10.1289/ehp.1002255
49. Vasto S, Candore G, Balistreri CR, Caruso M, Colonna-Romano G, Grimaldi MP, et al. Inflammatory networks in ageing, age-related diseases and longevity. Mech Ageing Dev (2007) 128(1):83–91. doi: 10.1016/j.mad.2006.11.015
50. Clemente-Postigo M, Oliva-Olivera W, Coin-Aragüez L, Ramos-Molina B, Giraldez-Perez RM, Lhamyani S, et al. Metabolic endotoxemia promotes adipose dysfunction and inflammation in human obesity. Am J Physiol-Endocrinol Metab (2019) 316(2):E319–32. doi: 10.1152/ajpendo.00277.2018
51. Miller DB, Karoly ED, Jones JC, Ward WO, Vallanat BD, Andrews DL, et al. Inhaled ozone (O3)-induces changes in serum metabolomic and liver transcriptomic profiles in rats. Toxicol Appl Pharmacol (2015) 286(2):65–79. doi: 10.1016/j.taap.2015.03.025
52. Zhong J, Allen K, Rao X, Ying Z, Braunstein Z, Kankanala SR, et al. Repeated ozone exposure exacerbates insulin resistance and activates innate immune response in genetically susceptible mice. Inhalation Toxicol (2016) 28(9):383–92. doi: 10.1080/08958378.2016.1179373
53. Calderón-Garcidueñas L, Franco-Lira M, D'Angiulli A, Rodríguez-Díaz J, Blaurock-Busch E, Busch Y, et al. Mexico City normal weight children exposed to high concentrations of ambient PM2.5 show high blood leptin and endothelin-1, vitamin D deficiency, and food reward hormone dysregulation versus low pollution controls. Relevance for obesity and Alzheimer disease. Environ Res (2015) 140:579–92. doi: 10.1016/j.envres.2015.05.012
54. Jiang M, Li D, Piao J, Li J, Sun H, Chen L, et al. Real-ambient exposure to air pollution exaggerates excessive growth of adipose tissue modulated by Nrf2 signal. Sci Total Environ (2020) 730:138652. doi: 10.1016/j.scitotenv.2020.138652
55. Bailey MJ, Naik NN, Wild LE, Patterson WB, Alderete TL. Exposure to air pollutants and the gut microbiota: a potential link between exposure, obesity, and type 2 diabetes. Gut Microbes (2020) 11(5):1188–202. doi: 10.1080/19490976.2020.1749754
56. Moon YS, Kim DH, Song DK. Serum tumor necrosis factor-alpha levels and components of the metabolic syndrome in obese adolescents. Metabolism (2004) 53(7):863–7. doi: 10.1016/j.metabol.2004.02.007
57. Aguirre M, Venema K. Does the gut microbiota contribute to obesity? Going beyond the gut feeling. Microorganisms (2015) 3(2):213–35. doi: 10.3390/microorganisms3020213
58. Anderson JO, Thundiyil JG, Stolbach A. Clearing the air: a review of the effects of particulate matter air pollution on human health. J Med Toxicol (2012) 8(2):166–75. doi: 10.1007/s13181-011-0203-1
59. Kelly FJ, Fussell JC. Size, source and chemical composition as determinants of toxicity attributable to ambient particulate matter. Atmospheric Environ (2012) 60:504–26. doi: 10.1016/j.atmosenv.2012.06.039
60. Zhang N, Wang L, Zhang M, Nazroo J. Air quality and obesity at older ages in China: The role of duration, severity and pollutants. PloS One (2019) 14(12):e0226279. doi: 10.1371/journal.pone.0226279
61. Bowe B, Gibson AK, Xie Y, Yan Y, Donkelaar AV, Martin RV, et al. Ambient fine particulate matter air pollution and risk of weight gain and obesity in United States veterans: An observational cohort study. Environ Health Perspect (2021) 129(4):047003. doi: 10.1289/EHP7944
62. Valavanidis A, Fiotakis K, Vlachogianni T. Airborne particulate matter and human health: toxicological assessment and importance of size and composition of particles for oxidative damage and carcinogenic mechanisms. J Environ Sci Health (2008) 26(4):339–62. doi: 10.1080/10590500802494538
Keywords: obesity, body mass index, waist circumference, visceral adiposity index, air pollution, epidemiologic study
Citation: Pan W, Wang M, Hu Y, Lian Z, Cheng H, Qin J-J and Wan J (2023) The association between outdoor air pollution and body mass index, central obesity, and visceral adiposity index among middle-aged and elderly adults: a nationwide study in China. Front. Endocrinol. 14:1221325. doi: 10.3389/fendo.2023.1221325
Received: 12 May 2023; Accepted: 22 August 2023;
Published: 09 October 2023.
Edited by:
Sonia Saad, Kolling Institute of Medical Research, AustraliaReviewed by:
Haiping Duan, Qingdao Municipal Center for Disease Control and Prevention, ChinaCopyright © 2023 Pan, Wang, Hu, Lian, Cheng, Qin and Wan. This is an open-access article distributed under the terms of the Creative Commons Attribution License (CC BY). The use, distribution or reproduction in other forums is permitted, provided the original author(s) and the copyright owner(s) are credited and that the original publication in this journal is cited, in accordance with accepted academic practice. No use, distribution or reproduction is permitted which does not comply with these terms.
*Correspondence: Jun Wan, d2FuanVuQHdodS5lZHUuY24=; Juan-Juan Qin, cWluanVhbmp1YW5Ad2h1LmVkdS5jbg==
†These authors have contributed equally to this work
Disclaimer: All claims expressed in this article are solely those of the authors and do not necessarily represent those of their affiliated organizations, or those of the publisher, the editors and the reviewers. Any product that may be evaluated in this article or claim that may be made by its manufacturer is not guaranteed or endorsed by the publisher.
Research integrity at Frontiers
Learn more about the work of our research integrity team to safeguard the quality of each article we publish.