 Chenxiao Zhang1†
 Tengfei Ma2†
 Chang Liu1
 Ding Ma2
 Jian Wang2,3Meng Liu2
 Jinjun Ran1*Xueting Wang4*
 Xiaobei Deng1*
- 1School of Public Health, Shanghai Jiao Tong University School of Medicine, Shanghai, China
- 2College of Basic Sciences, Shanghai Jiao Tong University School of Medicine, Shanghai, China
- 3Department of Cardiology, Renji Hospital, Shanghai Jiao Tong University School of Medicine, Shanghai, China
- 4Department of Cardiology, Tongren Hospital, Shanghai Jiao Tong University School of Medicine, Shanghai, China
PM2.5 can cause adverse health effects via several pathways, such as inducing pulmonary and systemic inflammation, penetration into circulation, and activation of the autonomic nervous system. In particular, the impact of PM2.5 exposure on the liver, which plays an important role in metabolism and detoxification to maintain internal environment homeostasis, is getting more attention in recent years. In the present study, C57BL/6J mice were randomly assigned and treated with PM2.5 suspension and PBS solution for 8 weeks. Then, hepatic tissue was prepared and identified by metabolomics analysis and transcriptomics analysis. PM2.5 exposure can cause extensive metabolic disturbances, particularly in lipid and amino acids metabolic dysregulation.128 differential expression metabolites (DEMs) and 502 differently expressed genes (DEGs) between the PM2.5 exposure group and control group were detected. The Kyoto Encyclopedia of Genes and Genomes (KEGG) enrichment analyses showed that DEGs were significantly enriched in two disease pathways, non-alcoholic fatty liver disease (NAFLD) and type II diabetes mellitus (T2DM), and three signaling pathways, which are TGF-beta signaling, AMPK signaling, and mTOR signaling. Besides, further detection of acylcarnitine levels revealed accumulation in liver tissue, which caused restricted lipid consumption. Furthermore, lipid droplet accumulation in the liver was confirmed by Oil Red O staining, suggesting hepatic steatosis. Moreover, the aberrant expression of three key transcription factors revealed the potential regulatory effects in lipid metabolic disorders, the peroxisomal proliferative agent-activated receptors (PPARs) including PPARα and PPARγ is inhibited, and the activated sterol regulator-binding protein 1 (SREBP1) is overexpressed. Our results provide a novel molecular and genetic basis for a better understanding of the mechanisms of PM2.5 exposure-induced hepatic metabolic diseases, especially in lipid metabolism.
1 Introduction
With the rapid development of the world population, economy, and industrialization, energy consumption also grows increasingly. Air pollution has become an urgent global health problem (1, 2). Particulate matter 2.5 (particulate matter with an aerodynamic diameter of ≤ 2.5 µm, PM2.5), as one of the main pollutants, can penetrate the respiratory barrier simply with its extremely tiny particle diameter by absorbing and combining with toxic compounds (3, 4). Then it can reach almost all organs through the bloodstream (5). Many epidemiological, animal, and in vitro studies found that health effects can be caused by exposure to airborne PM2.5, such as increased morbidity and mortality rates, even at concentrations meeting the environmental criteria (6–8). PM2.5 can lead to extensive inflammation (9) and irreversible damage in almost all systems (10, 11), which causes respiratory diseases like asthma and lung cancer (12, 13), circulatory diseases like ventricular hypertrophy and heart disease (14), and neurological diseases like retinopathy (15, 16).
As an important metabolic center of the body, the liver plays an important role in maintaining the homeostasis of the internal environment and energy system (17). It participates in the regulations of the synthesis, storage, decomposition, detoxification, transformation, and excretion of xenobiotics in the organism (18, 19). The liver is critical in regulating lipid metabolism, amino acid metabolism, steroid metabolism, and many other metabolic pathways (20), of which metabolic disorders can result in severe damage and the promotion of function disturbances, for example, nonalcoholic fatty liver disease (NAFLD) (21). NAFLD covers the hepatic pathological change progression from steatosis to nonalcoholic steatohepatitis, fibrosis, and cirrhosis (20, 22–24), and can notably increase the risk of some more metabolic diseases such as diabetic cardiovascular disease and cancer (17, 24).
Previous research indicated that PM2.5 exposure affects various metabolic pathways in vivo (25), especially the pathways associated with lipid metabolism (18). Recent studies have shown that the liver has more obvious responses than the lung in metabolic disorders induced by PM2.5 exposure (26). PM2.5 exposure possibly contributes to dyslipidemia, vascular inflammation, lipid dysfunction, and insulin resistance, and then accelerates lipid-associated metabolic diseases such as atherosclerosis and type II diabetes mellitus (T2DM) (14, 27, 28). The impact of PM2.5 exposure on the liver has been getting more attention these years. Meanwhile, epidemiological studies suggested that airborne PM2.5 can improve the liver enzyme level (29), cause chronic liver inflammation, and increase the risk of cirrhosis and liver cancer (11, 30, 31). PM2.5 exposure has also been identified as an independent risk factor for NAFLD (21, 23). Previous toxicologic studies have shown that PM2.5 can transfer from the lung to the liver through multiple routes (26, 32), and it may expedite the progression of NAFLD through mechanisms such as inflammatory responses, oxidative stress, and insulin resistance (33, 34). PM2.5 exposure can induce insulin resistance (IR) via endothelial dysfunction, affecting hepatic insulin signaling pathways and suppressing the expression of peroxisome proliferator-activated receptors gamma (PPARγ) and PPARα, resulting in hepatic lipid accumulation (35, 36). Concurrently, PM2.5 exposure can cause oxidative stress, leading to hepatic tissue damage (37, 38). Moreover, exposure to PM2.5 may promote the expression of proinflammatory cytokines in adipocytesto and cause inflammation in NASH (39, 40).
This study randomly assigned C57BL/6J mice into two groups and treated them with PM2.5 suspension and PBS solution for eight weeks. The differences in liver tissue between the two groups, especially in metabolism and gene expression, were compared to investigate the impact of PM2.5 exposure on liver metabolism. The histopathological changes, differential expression of genes, and metabolites related to hepatic metabolic disorders were also analyzed to elaborate on the basic and comprehensive condition of the liver, illustrating the mechanism of injury triggered by PM2.5 exposure. To some extent, insights into hepatic metabolic disturbances benefit understanding the molecular pathology of metabolic diseases and exploring the potential therapeutic target.
2 Materials and methods
2.1 PM2.5 preparation and reagents
PM2.5 samples were collected and prepared according to previous studies (41), collected at Shanghai Jiao Tong University School of Medicine, Chongqing Road (S), Shanghai, China, from December 2017 to January 2018. The sampling site was close to the main traffic artery, and the surrounding area was densely populated. PM2.5 samples were collected on glass fiber filters for biological assay using a high-volume sampler (#2031, Lonying Company, Shandong, China) or quartz filters for chemical assay using a high-flow cascade sampler (#HFI 131, MSP Company, MN, USA) for 96 h. The collected PM2.5 sampling film was cut to the same size (3 cm × 3 cm) and randomly mixed. PM2.5 samples were split into four aliquots for chemical assay, which were analyzed for metal elements, polycyclic aromatic hydrocarbons (PAHs), elemental and organic carbon (EC and OC), and inorganic ion elements. The remaining sampling membranes were freeze-dried to separate PM2.5 for later animal experiments.
Metal elements in PM2.5 (Ca, Fe, Na, K, Al, Mg, Zn, Mn, Pb, Cu, Ba, Ti, Si, Sb, V, Mo, Sn, Ni, As, W, Cd) were measured by inductively coupled plasma mass spectrometry (# iCAP Q, ThermoFisher, MA, USA). Also, 16 PAHs (Naphthalene, Alenene, Acenaphthene, Indeno[1,2,3-cd]Pyrene, Benzo[b]Fluorathene, Fluorene, Pyrene, Benzo[k]Fluorathene, Benzo[g,h,i]Perylene, Fluoranthene, Benzo[a]Pyrene, Chrysene, Dibenz[a,h]Anthracene, Phenanthrene, Benz(a)Anthracene, Anthracene) were analyzed by gas chromatography-mass spectrometry (#*/7890A-5975C, Agilent, CA, USA). The inorganic ion elements (Ca2+, Na+, K+, Mg2+, SO42-, NO2-, NO3-, Cl-, PO43-) were analyzed by ion chromatography (#*ICS-5000+/900, Dionex, CA, USA). Thermophotometry detected the EC and OC content with a total organic carbon analyzer (#DRI Model 2015, DRI, NV, USA). The Instrumental Analysis Center of Shanghai Jiao Tong University provided the whole procedure of analysis and data. The results are shown in Supplementary Table 1.
PM2.5 samples were extracted for the biological assay by immersing the filters in ultrapure water and sonicating for 30 min (500 W, 40 kHz). Then they were recollected by a vacuum freeze drier (FreeZone2.5, Labconco Company, MO, USA). The extracted PM2.5 samples at 100 mg/mL concentration were stored at −80°C before animal and cell exposure.
2.2 Design of animal experiment
C57BL/6J mice (6 weeks old, n=12), purchased from the Animal Center of the Southern Model (Shanghai, China), were fed at relative temperature and humidity with a normal diet and water, providing ad libitum throughout the experiment. A total of twelve male mice were randomly divided into two groups, regardless of gender. After 2-week acclimation, mice in the PM2.5 group (n=6) were directly intranasally treated with 10 μL PM2.5 suspension (100 μg PM2.5/day) for 8 weeks, while the control group (n=6) were administered 10 μL phosphate buffer saline (PBS), which was in correspondence with the previous studies (38). When the exposure ended, all mice were subjected to a euthanasia procedure and then dissected. During the euthanasia procedure, we used the Rodent Anesthesia Machine (Gas Anesthesia, USA) with isoflurane as the anesthesia gas. We poured isoflurane into the anesthetic volatile tank, which was connected to the oxygen cylinder. Through the oxygen air blowing, volatile isoflurane was used with a concentration of 1.5-3%. The mice were anesthetized in 1-2 minutes and the body mass was measured. Then, liver samples were collected, weighed, and finally stored in a −80°C refrigerator for indicated experiments and analysis. Animal experiments have been approved by the animal and ethics review committee of the laboratory animal center at Shanghai Jiao Tong University School of Medicine (Shanghai, China).
2.3 Liver histological staining
Frozen liver tissues were cut into sections (3-5 μm) with the frozen slice system. Part of thesections were stained with hematoxylin and eosin (H&E) for histology analysis according to standard protocols (#E607318, Sangon Biotech (Shanghai) Co., Ltd.). The tissue sections were stained with lipid droplets with freshly prepared Oil-Red-O solution (#E607319, Sangon Biotech (Shanghai) Co., Ltd.) and nuclei with hematoxylin (#E607318, Sangon Biotech (Shanghai) Co., Ltd.) to assess the lipid accumulation in liver tissues. The specimens were observed and photographed randomly in six fields of view by fluorescence microscopy (Olympus, Japan). Meanwhile, quantitative analysis of the Oil Red O positive area was analyzed with Image-Pro Plus 6.0 software (Media Cybernetics, Inc., USA), expressed as a percent.
2.4 Determination of hepatic TG and FFA levels
Hepatic TG and FFA levels were measured by the Triglyceride Detection Kit (#D799795, Sangon Biotech (Shanghai) Co., Ltd.), the Nonesterified Fatty Acid Detection Kit (#D799793, Sangon Biotech (Shanghai) Co., Ltd.) according to the manufacturer’s instructions, respectively. A BCA Protein Test kit (#C503021) was used to calibrate TG and FFA levels.
2.5 Quantitative real-time PCR analysis
Total RNA from frozen liver tissue samples was extracted by Trizol (Invitrogen, Carlsbad, CA, USA). The experiment was conducted in the same way as in our previous study (38). The target gene studied was pparα, while the reference gene was β-actin. The corresponding primer pairs are designed from Primerbank (https://pga.mgh.harvard.edu/primerbank/) as follows. pparα, forward primer: AGAGCCCCATCTGTCCTCTC; reverse primer: ACTGGTAGTCTGCAAAACCAAA; β-actin, forward primer: GGCTGTATTCCCCTCCATATATCG; reverse primer: CCAGTTGGTAACAATGCCATGT.
2.6 Protein level analysis
For immunofluorescence assay, frozen liver tissue sections were prepared and performed for 30 min at normal temperature before commencing with the staining protocol. Then, the slices were washed with PBS three times and blocked with 5% Bovine Serum Albumin (BSA) for 1 h. SREBP1 (#ab71983, 1:200, Abcam, USA) and PPARγ (#ab41928, 1:100, Abcam, USA) primary antibodies were incubated overnight. Slides were incubated with Anti-rabbit or anti-mouse IgG secondary antibody (#2975, #4408, 1:500, Cell Signaling Technology, USA) for 1 h, followed by nuclear staining with 4’,6-diamidino-2-phenylindole (DAPI) (#D9542, Sigma, USA) for 30 s. Mounted slides were observed using fluorescence microscopy (Olympus, Japan) to obtain the fluorescence images.
Western Blot analysis was operated as described in our previous studies (38). The primary antibodies included anti-SREBP1 (#ab71983, 1:1000, Abcam, USA), anti-PPARγ (#ab41928, 1:1000, Abcam, USA), and anti-PPARα (#ab41928, 1:1000, Abcam, USA). As loading control, β-Actin (#ab8226, 1:2000, Abcam, USA) was used.
2.7 Quantitative detection of acylcarnitine in liver
Acylcarnitine was profiled by liquid chromatography-tandem mass spectrometry, and the detailed method was described previously (42, 43). In brief, a total of 66 acylcarnitine were measured, including free carnitine (C0), 11 short-chain acylcarnitine (C2, C3, C3:0-OH, C4, C5, C5:0-2, C5:0-OH, C5:1, C6, C6-DC, C7:0-DC), 24 medium-chain acylcarnitine (C8, C8:0-OH, C10, C10-DC, C10:0-DC-OH, C10:1, C10:2-OH, C10:3-1, C10:3-DC, C12, C12:0-DC, C12:0-OH, C12-OH, C14, C14:0-DC, C14:0-OH, C14:1, C14:1-2, C14:1-DC-2, C14:2, C15:0-2, C15:2, C15:2-DC, and C15:2-OH), and 30 long-chain acylcarnitine (C16, C16:0-DC, C16:1, C16:1-DC, C16:1-OH, C16:2, C16:2-OH, C17, C17:1, C17:1-DC, C17:1-DC-OH, C17:2-OH, C17:3, C18, C18:0-OH, C18:1-OH, C18:2-OH, C20, C20:0-OH, C20:1, C20:1-OH, C20:2, C20:2-DC, C20:2-OH-1, C20:2-OH-2, C20:3, C20:3-OH, and C20:4).
2.8 High-resolution mass spectrometric analysis of liver sample
A total of eight mouse liver tissue samples were collected, and tissue preparation strictly followed the procedure described in the method METAB_NonTargeted_0001.00 (i.e., DMPA-labeling Kit for Amine & Phenol/Hydroxyl/Carboxyl Metabolomics I). The LC-MS analysis strictly followed the SOP (i.e., LC-MS Analysis for Dansyl-labeled Amine&Phenol/Hydroxyl/Carboxyl Metabolomics) using the HP-CIL Metabolomics Platform. Analysis was performed using IsoMS Pro 1.2.10 (NovaMT Inc.) and NovaMT Metabolite Database v1.0. A total of 8 samples assigned to 2 groups were uploaded to IsoMS Pro 1.2.10. Data Quality Checks and Data Processing were performed. Data were cleaned with peak pairs where Mean (sample)/Mean (blank) was less than or equal to 4.0 at a significance level of 0.05 and were filtered out. Peak pairs without data present in at least 50.0% of all samples and 80.0% of samples in any group were filtered out-the Ratio of Total Useful Signal normalized data. Metabolite identification was performed using the CIL library and LI library.
MetaboAnalyst 5.0 was used to analyze the differences between the control group and the PM2.5 exposure group in endogenous metabolites of the liver and to construct principal component analysis (PCA) and partial least squares-discriminant analysis (PLS-DA) models. Identifying the perturbed biological pathways on the differential metabolite data was performed using the Kyoto Encyclopedia of Genes and Genomes (https://www.kegg.jp, KEGG). Quantitative enrichment analysis (QEA) was performed using a generalized linear model to estimate a Q-statistic for each metabolite set, which describes the correlation between compound concentration profiles, X, and clinical outcomes, Y. All the pathways with adjusted p-value <0.05 were considered as the biological pathways perturbed by chronic exposure to PM2.5. Differential metabolites were defined according to the following criteria: FC > 1.5 or FC < 0.67 with a p-value < 0.05 and a q-value < 0.05.
2.9 High-throughput RNA sequencing
Total RNA was isolated and purified using TRIzol reagent (Invitrogen, Carlsbad, CA, USA) following the manufacturer’s procedure. Each sample’s RNA amount and purity were quantified using NanoDrop ND-1000 (NanoDrop, Wilmington, DE, USA). The RNA integrity was assessed by Bioanalyzer 2100 (Agilent, CA, USA) with RIN number >7.0 and confirmed by electrophoresis with denaturing agarose gel. Poly (A) RNA is purified from 1μg total RNA using Dynabeads Oligo (dT) 25-61005 (Thermo Fisher, CA, USA) using two rounds of purification. Then the poly (A) RNA was fragmented into small pieces using Magnesium RNA Fragmentation Module (NEB, cat.e6150, USA) for 94°C 5-7min. Then the cleaved RNA fragments were reverse-transcribed to create the cDNA by SuperScript™ II Reverse Transcriptase (Invitrogen, cat. 1896649, USA), which were next used to synthesize U-labeled second-stranded DNAs with E. coli DNA polymerase I (NEB, cat.m0209, USA), RNase H (NEB, cat.m0297, USA) and dUTP Solution (Thermo Fisher, cat.R0133, USA). An A-base is then added to the blunt ends of each strand, preparing them for ligation to the indexed adapters. Each adapter contains a T-base overhang for ligating the adapter to the A-tailed fragmented DNA. Single- or dual-index adapters are ligated to the fragments, and size selection was performed with AMPureXP beads. After the heat-labile UDG enzyme (NEB, cat.m0280, USA) treatment of the U-labeled second-stranded DNAs, the ligated products are amplified with PCR by the following conditions: initial denaturation at 95°C for 3 min; 8 cycles of denaturation at 98°C for 15s, annealing at 60°C for 15 sec, and extension at 72°C for 30 sec; and then final extension at 72°C for 5 min. The average insert size for the final cDNA library was 300 ± 50 bp. At last, we performed the 2×150 bp paired-end sequencing (PE150) on an Illumina Novaseq™ 6000 (LC-Biotechnology CO., Ltd., Hangzhou, China) following the vendor’s recommended protocol.
Raw data were filtered to remove the reads with the connector (adaptor), reads containing more than 5% ambiguous nucleotides, and low-quality reads (mean Q-value <20) using Cutadapt before analysis. Statistics of the raw sequencing amount, the effective sequencing amount, Q20, Q30, GC content, and comprehensive evaluation were performed. Total RNA was isolated and sequenced by Lc-Bio Technologies Co., Ltd. (Hangzhou, China). The data of RNA sequencing (RNA-SEQ) is stored in csv format after conversion, and the analysis of significant differences between samples and the relative quantification of the transcripts is performed by means of the DESeq2 package in R. The p-values of 0.05 were set as the threshold for significantly differential expression. The screening criteria for differentially expressed genes were defined as genes with FC > 1.50 or FC < 0.67 with p-value < 0.05. Meanwhile, pathway enrichment analysis was performed for differentially expressed genes by KEGG and Gene Ontology (GO). KEGG enrichment analyses of differentially expressed genes were implemented, and p-value<0.05 were considered significantly enriched.
2.10 Data processing and statistical analysis
The experimental data of acylcarnitine (ten samples in each group) were expressed as the Mean ± standard error of Mean (`Mean ± SEM) and analyzed with SPSS Statistics 26.0 software, using Student-t test (two-side). GraphPad Prism5 software was used for statistical analysis and bar plot across all staining counts data. Differences between the two groups were considered to be significant when the p-value < 0.05. The relationship between differential metabolites and differentially expressed genes. Cytoscape v3.9.0 was used to plot the network diagram for the selected parts with a p-value < 0.001. The correlation analysis between DEGs and DEMs was evaluated by the cor function in the R package and the network plot was performed with Cytoscape v3.9.0. The analysis of metabolomics and transcriptomics data, which was performed with four independent samples in each group (transcriptomics control group only with three groups) were generated with MetaboAnalyst 5.0 and OmicStudio (https://www.omicstudio.cn), showing with the PCA plots, volcano plots, advanced heatmap plots, and enrichment plots. The significant enriched biological pathways performed for DEMs and DEGs were screened with relative counts number, enrich factors and p-value of the selected enriched pathways. Information in detail about OmicStudio was shown elsewhere (44, 45).
3 Result
3.1 Chemical composition analysis of PM2.5
To evaluate the physical and chemical composition of PM2.5, metal elements, polycyclic aromatic hydrocarbons (PAHs), elemental carbon (EC) and organic carbon (OC), and inorganic ionic elements were detected. As illustrated in Supplementary Table 1, Calcium (9865 ng/mg), Sodium (3794 ng/mg), Iron (2418 ng/mg), and Potassium (1362 ng/mg) were the main elements in PM2.5. The content of Naphthalene was the highest and much higher than the other 14 PAHs, up to 6.73 ng/mg. Acenaphthene, Pyrene, and Benzo[b]Fluorathene were 0.89 ng/mg, 0.76 ng/mg, and 0.67 ng/mg, respectively. The cation and anion contents in PM2.5 were mainly as followings: NH4+ (3992 ng/mg), Ca2+ (1189 ng/mg), K+ (865 ng/mg), Mg2+ (147 ng/mg), SO42- (3767 ng/mg), NO3- (2343 ng/mg), Cl- (74 ng/mg), PO43- (68 ng/mg). The content of organic carbon (OC) and elemental carbon (EC) were 641 ng/mg and 177 ng/mg, respectively, as the ratio of OC/EC was 3.62.
3.2 Effects of PM2.5 exposure on histopathological analysis
After 8-week PM2.5 exposure, there was no significant difference in body weight (Figure 1A) and liver weight (Figure 1B) compared with the control group. To evaluate the effects of PM2.5 exposure on the liver of mice, we assessed the histological changes. As shown in the H&E staining results (Figure 1C), obvious pathological changes in the liver, including visible hepatic steatosis, irregular hepatic cords arrangement, and partial cytoplasmic vacuolation, can be seen in the PM2.5 exposure group, demonstrating the significant liver damage caused by PM2.5.
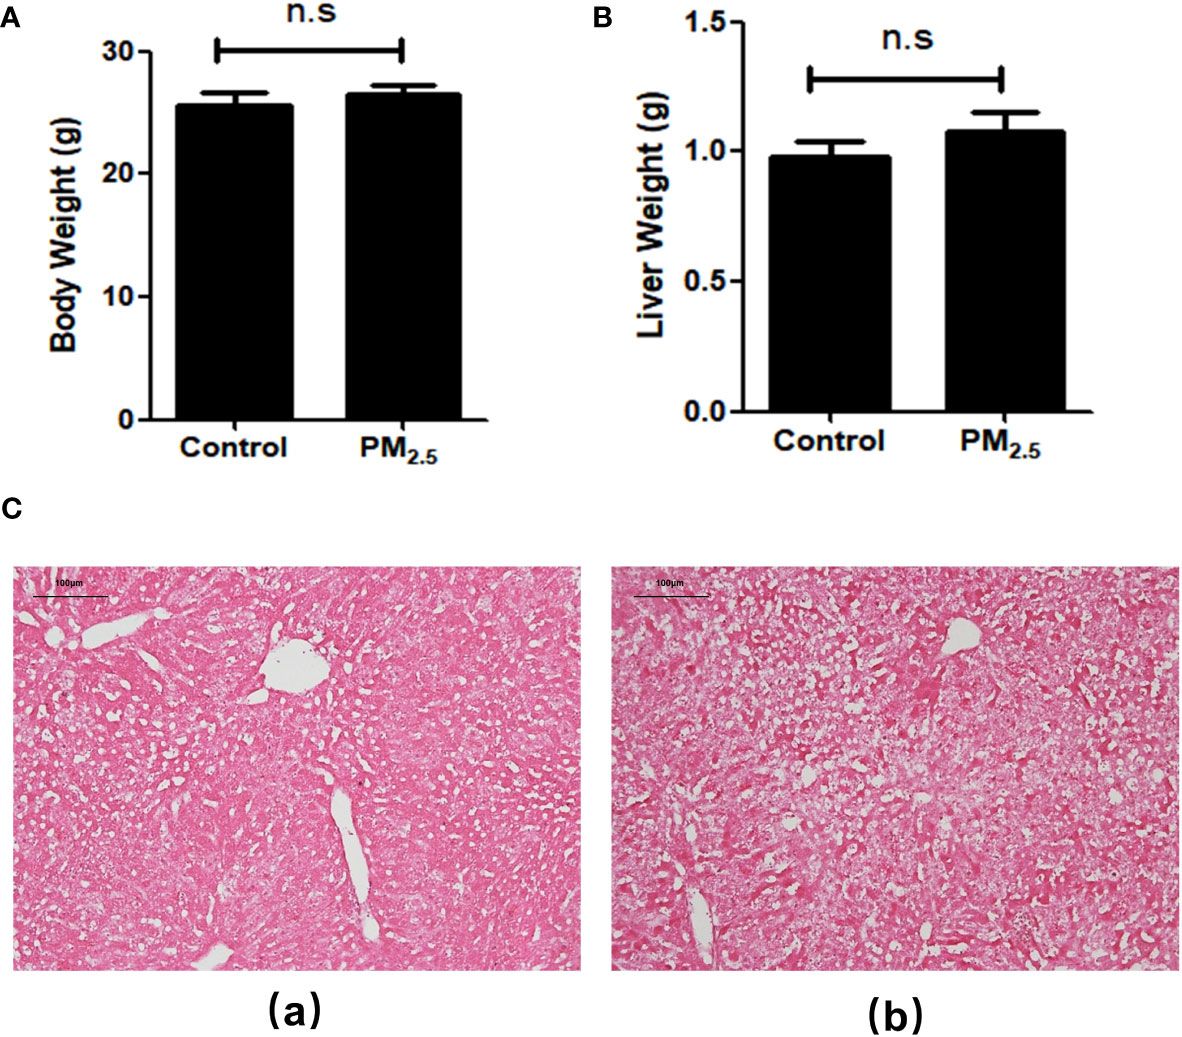
Figure 1 The Effect of PM2.5 exposure on the body weight, liver weight, and hepatic histology in mice. (A) Body weight; (B) Liver weight; (C) Representative pathological changes revealed by H&E staining of liver tissue. (a) Control; (b) PM2.5. Scale bar, 100 µm. n.s not significant.
3.3 General analysis of hepatic metabolism profile after PM2.5 exposure
Then the metabolomics analysis of tissue was performed to investigate the effect of PM2.5 exposure on the liver. The principal components analysis (PCA) was carried out to visualize variation in identified metabolites between the PM2.5 exposure group and the control group (Figure 2A). The results showed that PC1 represents 52.51% of the variation, and 26.2% is represented by PC2. Correlation analysis was executed to test the relevance and repeatability between samples (Figure 2B). It can be seen that the PM2.5 exposure group was separated from the control group, indicating that endogenous substances in the PM2.5 exposure group have changed compared with the control group, manifested in some specific metabolites.
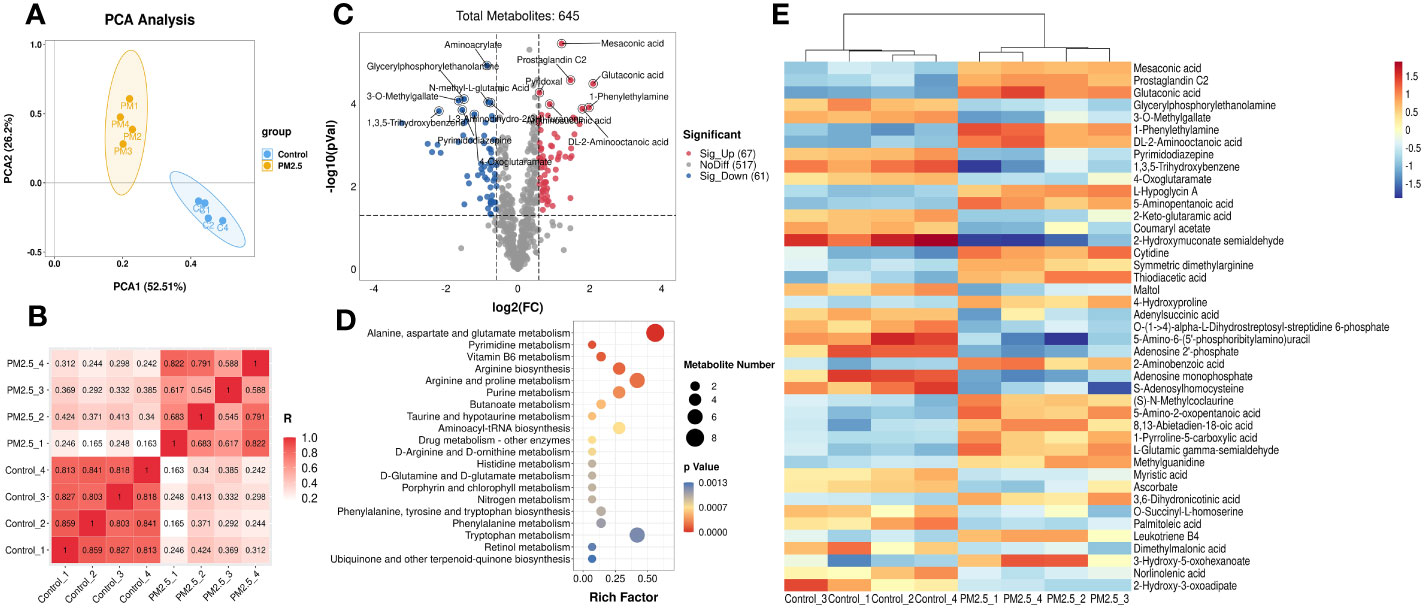
Figure 2 The Effect of PM2.5 exposure on the hepatic metabolites in mice. (A) PCA score plot. (B) Correlation analysis of all the biological samples. (C) Volcano plot of significant metabolites. (D) Cluster heatmap of differential metabolites. (E) KEGG enrichment analysis of differential metabolites. The y-axis represents the enrichment pathway, while the x-axis represents the enrichment ratio. The dot sizes represent the metabolites number. The color represents the p-value.
The total of 645 metabolites annotated by two groups are shown in the volcano plot (Figure 2C), which was constructed by plotting each metabolite’s fold change (FC) against the p-value. For comparison of the PM2.5 exposure group and the control group, the analysis showed 67 peak pairs with FC>1.5, p-value<0.05 (in red), and 61 peak pairs with FC<0.67, p-value< 0.05 (in blue). Hierarchical clustering analyses were used to elaborate on accumulating the 128 differential metabolites. Figure 2E shows the part of the top 43 differential metabolites between the two groups (FC>2 or FC<0.5, p-value< 0.05), and a more detailed view is shown in Supplementary Figure 1. Differential metabolites between the two groups are mainly amino acids and derivatives, lipids and lipid-like molecules, organic acids and derivatives, and nucleosides, nucleotides, and nucleotide analogs. The metabolites that decreased most significantly under PM2.5 exposure are 2-hydroxymuconate semialdehyde and 1,3,5-trihydroxy benzene. However, 1-Phenylethylamine, Glutaconic acid, Mesaconic acid, and Prostaglandin C2 increased remarkably (Supplementary Figure 2).
According to the KEGG analysis, there are a total of 37 KEGG pathways enriched in the PM2.5 exposure group (Supplementary Table 2). Moreover, the top 20 pathways include alanine, aspartate, glutamate metabolism, pyrimidine metabolism, vitamin B6 metabolism, arginine biosynthesis, arginine, proline, and purine metabolism etc, which are presented in Figure 2D. All these significantly enriched pathways mainly gather on amino acid and fatty metabolism, followed by glucose and vitamin metabolism. Six pathways (butanoate metabolism, fatty acid biosynthesis, arachidonic acid metabolism, biosynthesis of unsaturated fatty acids, linoleic acid metabolism, and α-Linolenic acid metabolism) are associated with fatty metabolism. Furthermore, amino sugar and nucleotide sugar metabolism, galactose metabolism, and citrate cycle (TCA cycle) were three pathways related to glucose metabolism.
3.4 General analysis of hepatic gene expression profiles after PM2.5 exposure
In addition to the metabolomics analysis, transcriptomics analysis was performed to provide an overview of changes in hepatic gene profile after PM2.5 exposure and to explore the deeper effects of PM2.5 exposure on the liver. Correlation analysis was executed to test the relevance and repeatability between samples (Figure 3A). The results showed that the control samples were reproducible, while PM2.5 exposed samples had a high pairwise correlation.
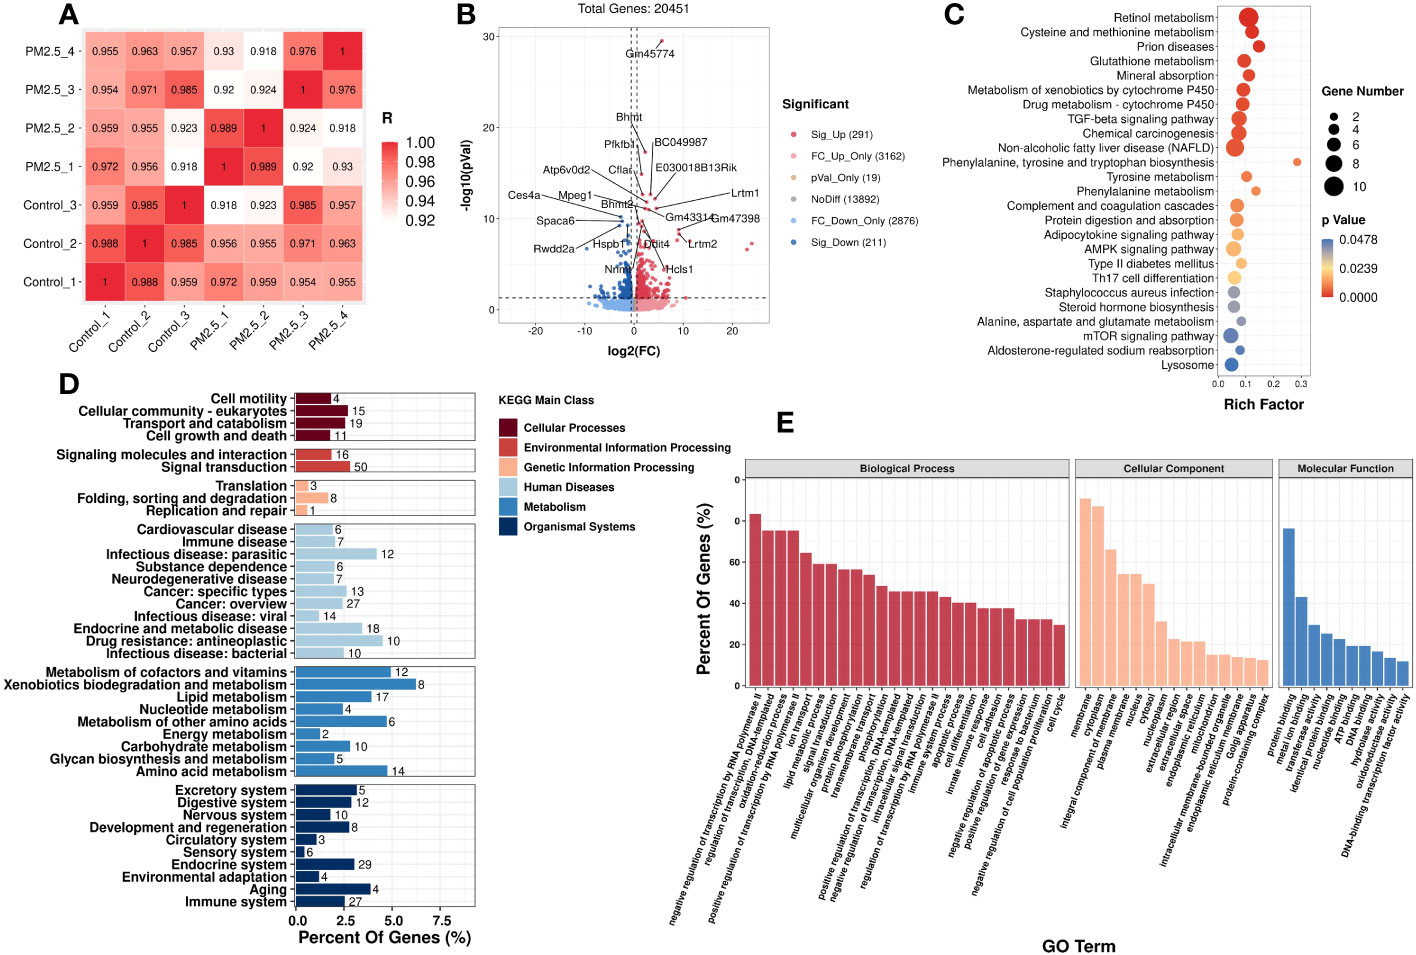
Figure 3 The effect of PM2.5 exposure on the hepatic gene expression in liver tissue. (A) Correlation analysis of all the biological samples. (B) Volcano plot showing the DEGs in the liver. KEGG (D) and GO (E) enrichment of class bar plot. The y-axis represents the enrichment of the subclass, while the x-axis represents a percent of genes. The bar’s color represents the different KEGG main classes (see color scale). (C) KEGG Enrichment scatter plot of DEGs. The y-axis represents the enrichment pathway, while the x-axis represents the rich factor. The dot sizes represent the gene number. The color represents the p-value.
Initially, setting the threshold as FC>1.5 or FC<0.67 with a p-value<0.05, a total of 502 differently expressed genes (DEGs) (291 upregulated DEGs and 211 downregulated DEGs) were found between the PM2.5 exposure group and control group (Figure 3B).
GO and KEGG analyses were performed to understand these DEGs’ functions better. It was found that 25 KEGG pathways (Supplementary Table 3) and 599 GO terms were significantly enriched, respectively. In Figure 3E, the top enriched GO terms are in three subclasses including biological process, cellular component, and molecular function. Meanwhile, 25 KEGG significantly enriched pathways are mainly related to fatty and amino acid metabolism. It is worth noting that PM2.5 exposure also significantly affected three signaling pathways: TGF-β signaling, AMPK signaling, and mTOR signaling. Moreover, the pathways of diseases related to metabolic disorders, such as NAFLD and T2DM, were also significantly enriched under PM2.5 exposure. The top 20 enriched pathways, according to the KEGG database, are shown in Figure 3D. We also performed a taxonomic analysis to demonstrate the proportion of significantly expressed genes in these DEGs subclasses. Under Metabolism terms, these DEGs mainly reacted in five main subclasses, including Metabolism of cofactors and vitamins, Xenobiotics biodegradation and metabolism, Amino acid metabolism, Metabolism of other amino acids, and lipid metabolism (Figure 3C).
3.5 Effects of PM2.5 exposure on hepatic levels of acylcarnitine
Combining the metabolomics and transcriptomics data, we found that, though several different pathways are involved, pathways related to lipid metabolism were significantly highlighted in both the gene expression and metabolites in the PM2.5 exposure group. Previous studies have proved that acylcarnitine, a kind of ester in carnitine, plays a key role in fatty acid oxidation. So, we measured the acylcarnitine levels in the liver tissue to observe the lipid metabolic level. The standardized quantitative detection result of acylcarnitine in the liver is presented in Table 1, presented in terms of mean ± standard error of the Mean, median, and minimum-maximum for each acylcarnitine profile of the PM2.5 exposure group and the control group. Sixty-six kinds of acylcarnitine were detected in the two groups, and 23 carnitine content significantly changed among them. Comparing acylcarnitine levels in control and PM2.5 exposure, groups revealed a significant decrease only in C14:1-2 (*p<0.05). Meanwhile, a significant increase was observed in average C0, C3:0-OH, C5:0-OH, C6-DC, C7:0-DC, C10:0-DC-OH, C10:2-OH, C10:3-DC, C14:0-DC, C15:2-DC, C16, C16:0-DC, C16:1, C16:1-DC, C17:1, C18, C18:1, C18:1-OH, C20:0, C20:0-OH, C20:2-OH-2, C20:3 levels (*p<0.05). There was no statistically significant difference in other acylcarnitine levels (p>0.05). The analysis of hepatic acylcarnitine levels showed that the lipid metabolism of the liver was disordered.
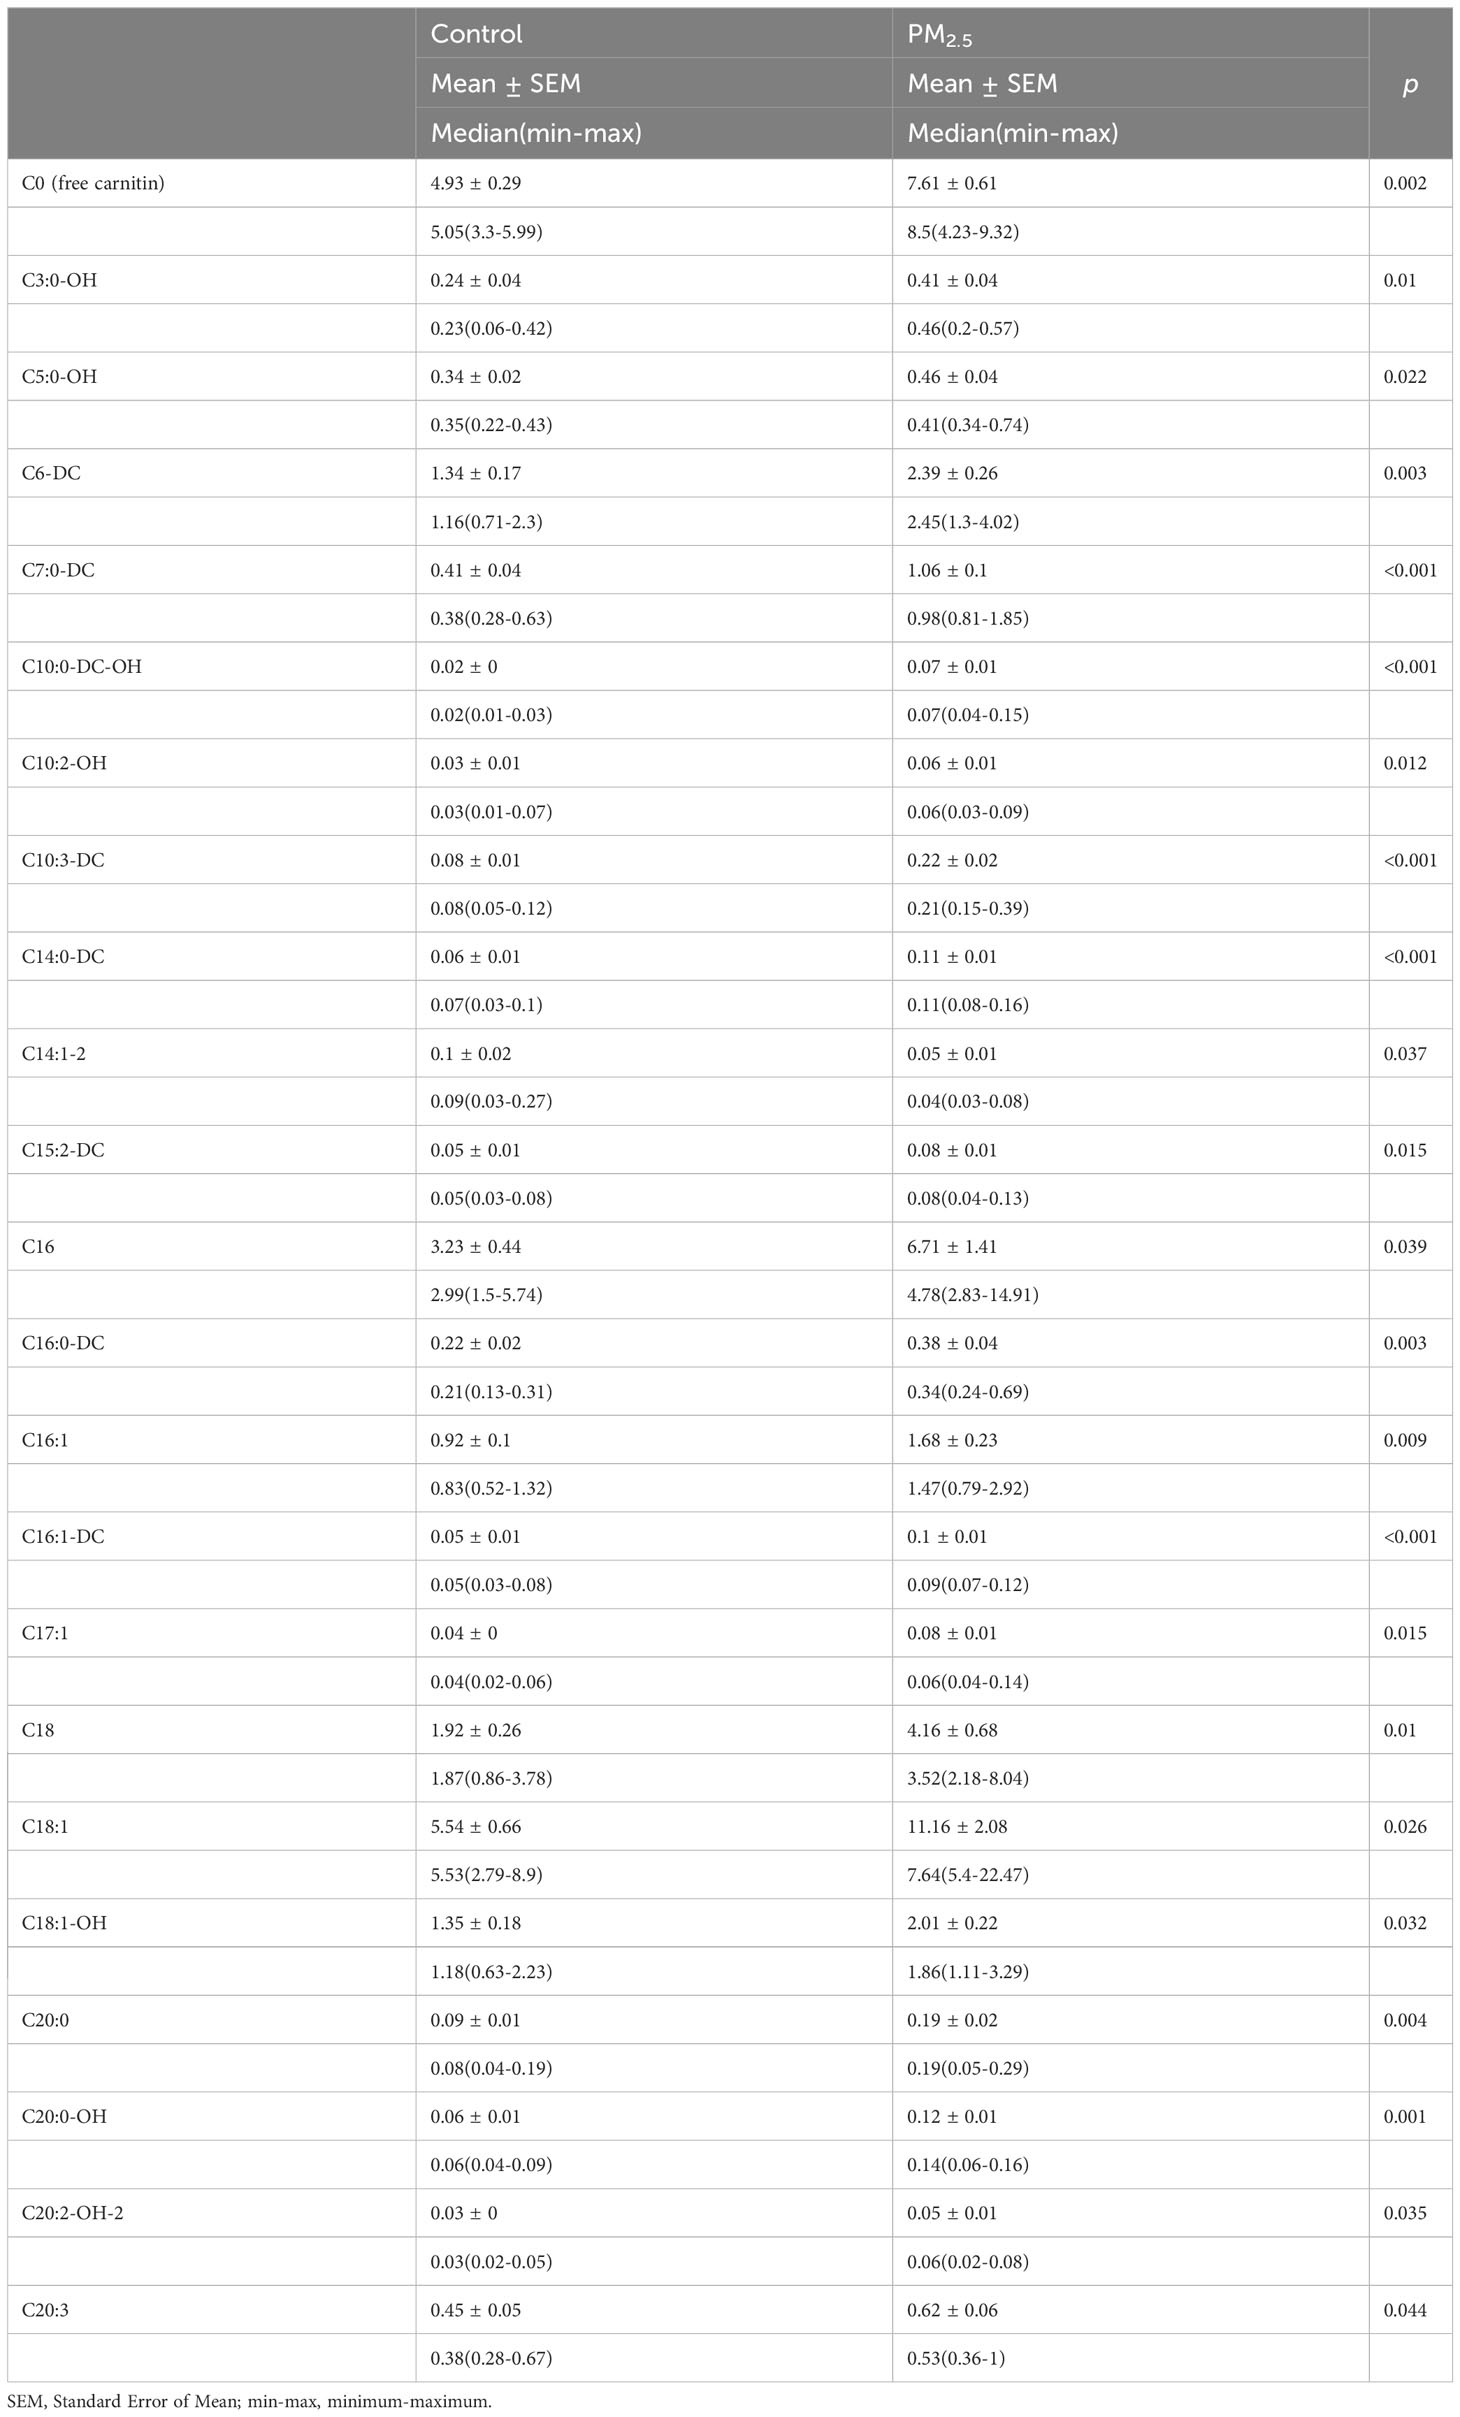
Table 1 Acylcarnitine values of liver tissue.
3.6 Correlation analysis on metabolomics and transcriptomics
We further verified the relationship between metabolomics and transcriptomics under PM2.5 exposure. Significant lipid metabolism-related differential metabolites were detected through pathway enrichment analysis with differential metabolites. Besides Leukotriene B4, lipid metabolism-related metabolites were significantly reduced (Figure 4A). Moreover, two signaling pathways (mTOR/AMPK) and two disease-associated gene pathways (type 2 diabetes, NAFLD) were identified through the enrichment of DEGs by KEGG. We analyzed and observed the correlation of the enriched DEGs in these pathways and added one other top enriched signaling pathway (PI3K-Akt), which showed that the IRS1 gene played a central role and the pathways were interrelated and influenced each other (Figure 4B). By performing a correlation analysis between the global DEM and DEG, using the standard of rho > 0.5 and p-value < 0.05, the results showed a broad correlation between DEM and DEG (Data not shown). To further observe the changes and correlations related to lipid metabolism, the screened metabolites related to lipid metabolism were used as the main nodes. The divergent selection of related DEGs was performed using the analysis criteria of rho > 0.80 and p-value < 0.005. A significant clustering was observed, with two centers formed around Leukotriene B4 and other lipid metabolites (Figure 4C). We found that amino acid and carbohydrate metabolism in the KEGG pathway correlated (Supplementary Figure 3).
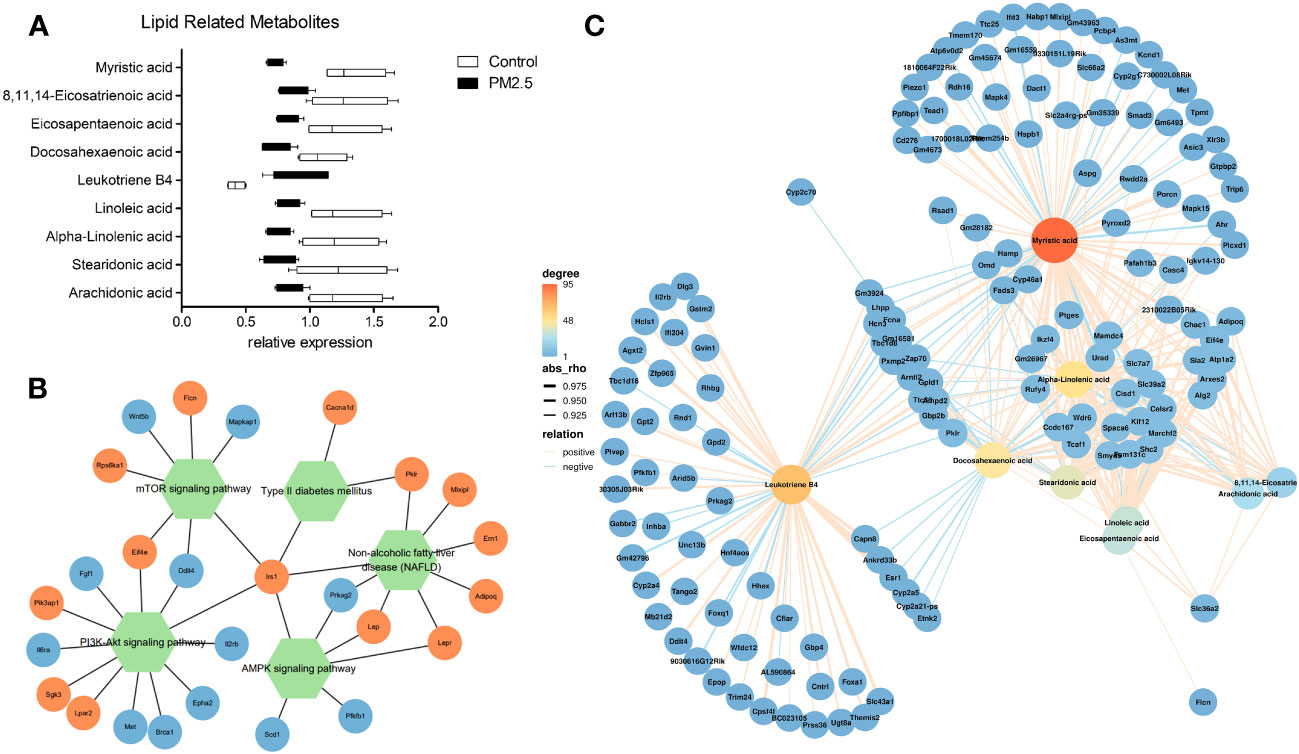
Figure 4 The effect of PM2.5 exposure on the correlation of DEMs and DEGs. (A) Relative expression of lipid metabolism-related DEMs. (B) Network(Pathway-Gene) of significant enrichment of DEGs by KEGG. (C) Association analysis of transcriptomic and metabolomic variation. Connection network between lipid metabolism-related DEMs and DEGs (rho > 0.80 and p-value < 0.005).
3.7 Effects of PM2.5 exposure on disorders of lipid metabolism
To further verify liver steatosis under PM2.5 exposure, we performed Oil Red O staining of mice liver tissue to measure concentrations of intracellular triglyceride stored in the lipid droplets of hepatic cells, which was contrasted with quantitative analysis of the ratio of oil red positive regions to total cell area (Figure 5A). The PM2.5-treated group had higher lipid accumulation in the hepatocytes than the control group (***p<0.001). In addition, increases in hepatic triglyceride (TGs) and FFA levels were also observed in PM2.5-exposed group (Figures 5B, C). These results suggest that ambient PM2.5 exposure results in the accumulation of lipids and elevation of FFA in the liver.
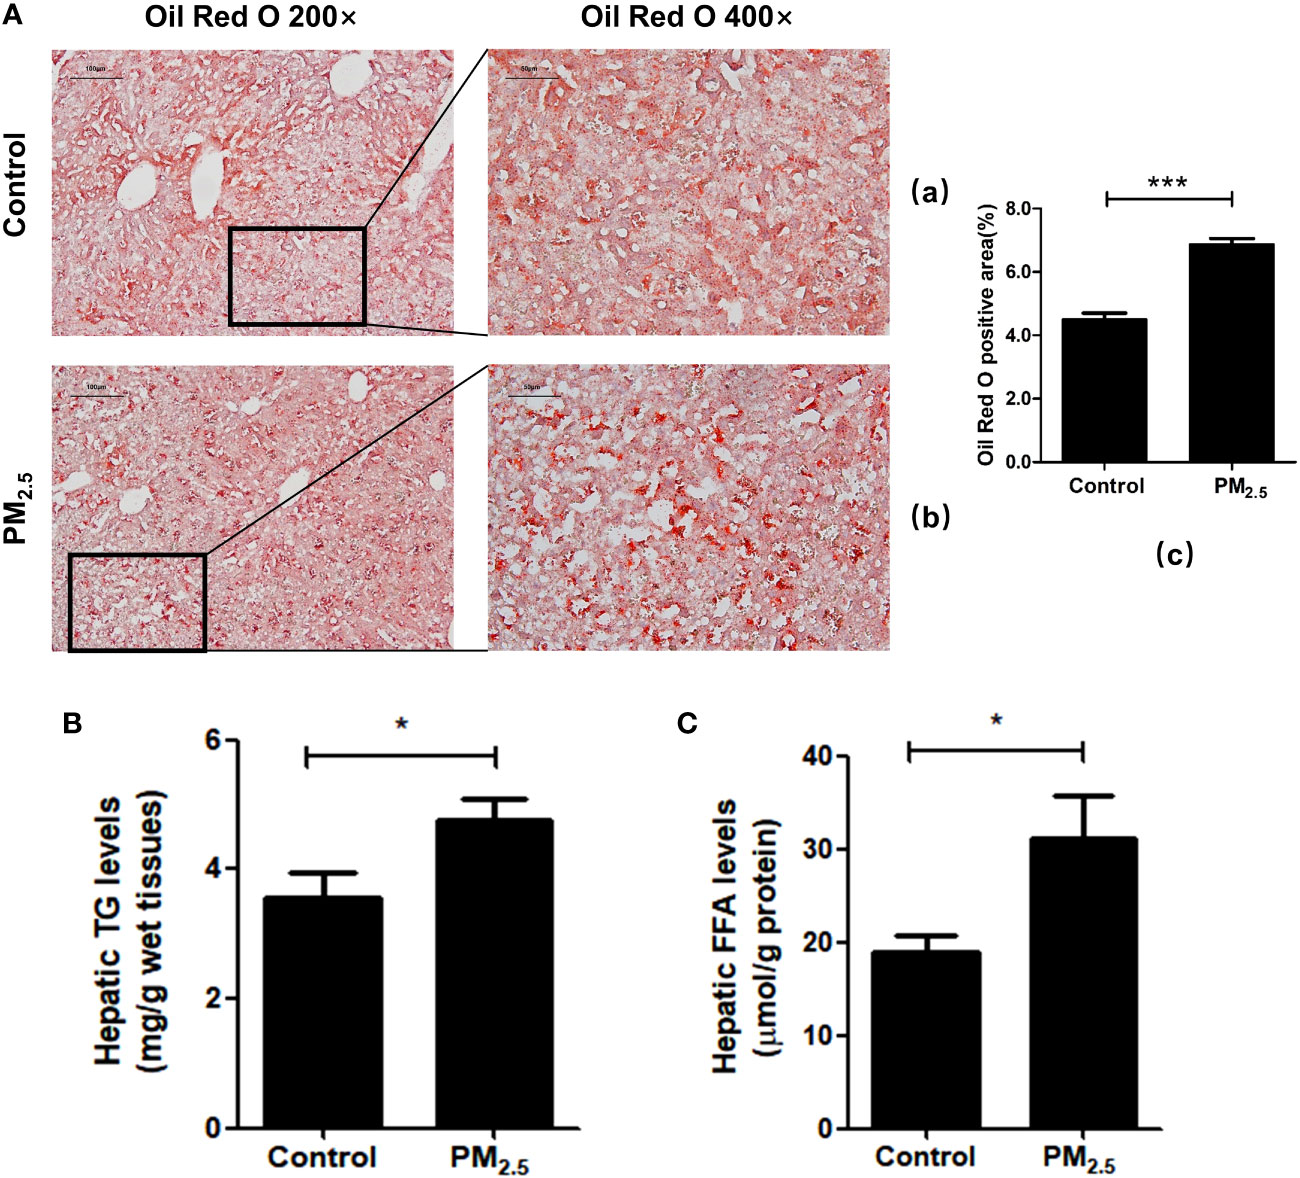
Figure 5 The effect of PM2.5 exposure on hepatic lipid accumulation in mice. (A) Liver pathology was assessed by Oil Red O staining. (a) Control; (b) PM2.5; (c) Quantification of the percentage of liver oil deposits. (B) Quantitative enzyme-based assays of hepatic triglycerides (TG) levels. (C) Quantitative enzyme-based assays of hepatic free fatty acids (FFA) levels. Data represent more than three independent experiments (Mean ± SEM). Scale bar, 100 µm, and 50 µm. n.s not significant. * p < 0.05, *** p < 0.001.
Furthermore, studies have shown that the AMPK signaling pathway, which is significantly enriched in the transcriptomics analysis of our data, may be one of the key pathways to regulating lipid metabolism and deposition. Related genes participate in adipogenesis, such as the activated sterol regulator-binding protein 1 (SREBP1) and the peroxisomal proliferative agent-activated receptor gamma (PPARγ). For further verification of lipid metabolic disorders, an immunofluorescence technique was performed to analyze the expression of SREBP1 and PPARγ.
One of the key elements in hepatic metabolic disorder studies is SREBP1, a major lipogenic transcription factor. Over-activation and over-expression of SREBP1 can lead to an imbalance of lipid homeostasis, prone to triglyceride accumulation and cirrhosis (46). Consistent with previous research (47), significantly higher expressions of SREBP1 were revealed in the PM2.5 exposed group compared with the control group (p<0.001) (Figure 6A).
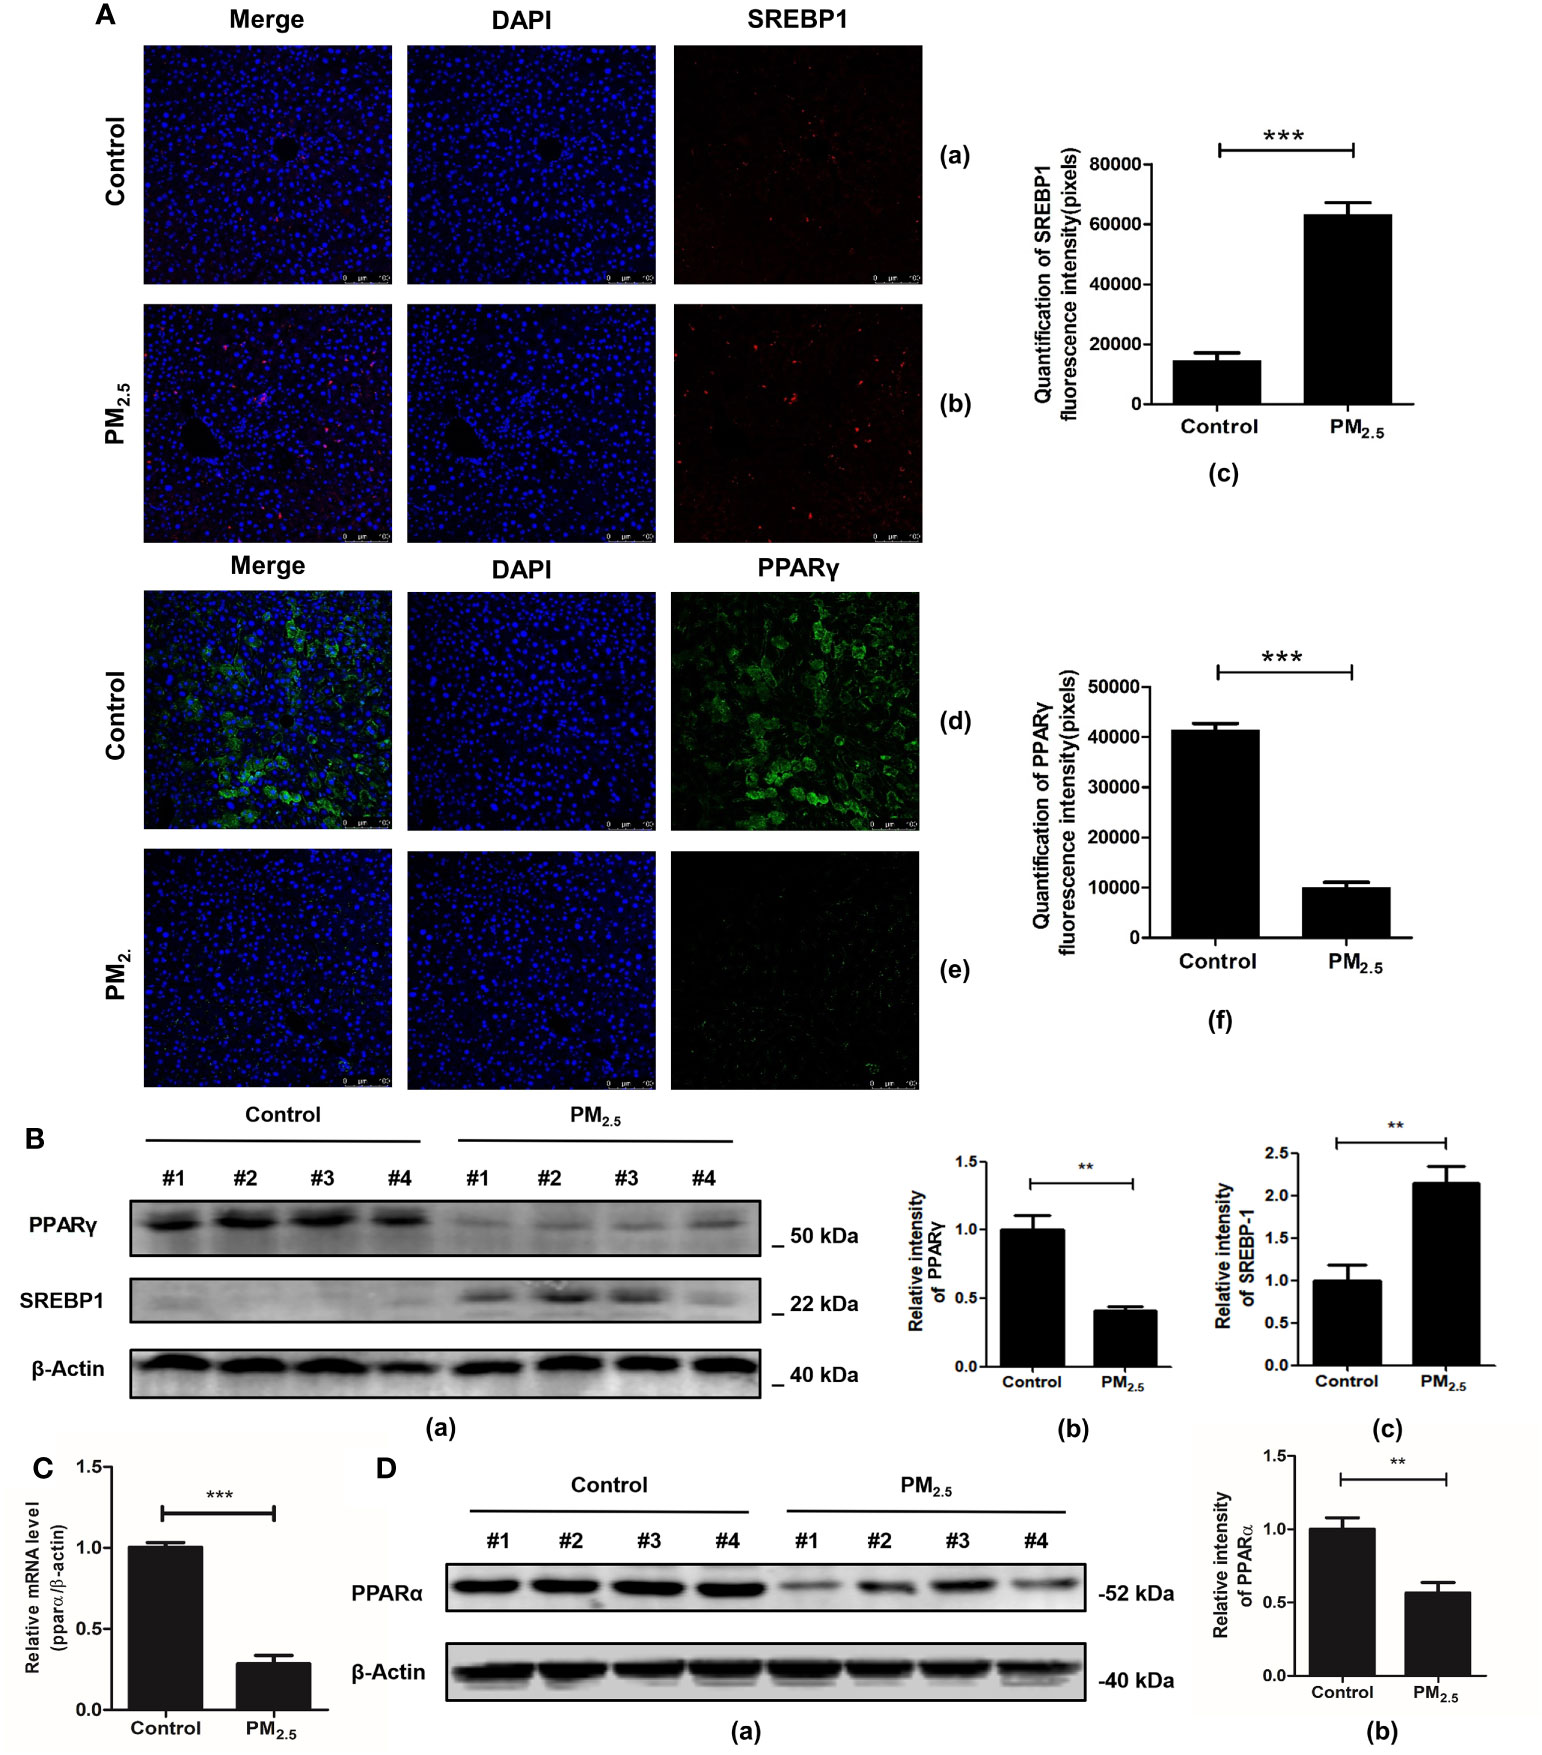
Figure 6 The effect of PM2.5 exposure on the expression of SREBP1, PPARγ, and PPARα in mice. (A) The immunofluorescence staining of SREBP1 and PPARγ. Nuclei were stained with DAPI. (a, d) Control; (b, e) PM2.5; (c, f) Graph quantifying SREBP1 and PPARγ. (B) The expression of PPARγ and SREBP1 after PM2.5 treatment. (a) Western blotting of PPARγ and SREBP1. (b, c) The quantification of the expression levels of PPARγ and SREBP1. (C) Quantitative real-time PCR analysis of PPARα mRNA expression. (D) The expression of PPARα protein in liver tissue. (a) Western blotting of PPARα. (b) The quantification of PPARα protein level. β-Actin as a reference gene. Data represent more than three independent experiments (Mean ± SEM). Scale bar, 100 µm. n.s not significant. ** p < 0.01, *** p < 0.001. n = 3 mice per group.
PPARγ is another key gene regulating fatty acid storage by activating genes that stimulate lipid ingestion and adipogenesis (48). Our study showed that mice in the PM2.5 exposure group decreased PPARγ expression significantly compared to the control group as detected by immunofluorescence assay (Figure 6A). To further verify the immunofluorescence results, western blot analysis was performed to detect the protein levels of SREBP-1 and PPAR-γ in hepatic tissues. The results showed that SREBP-1 was significantly upregulated, while the opposite results were observed in the PPARγ level (Figure 6B).
Considering that PPARα plays an important role in the regulation of liver lipid metabolism (49), the effect of PM2.5 exposure on PPARα expression was evaluated by qPCR and western blotting. As shown in Figure 6C, the level of PPARα mRNA in the liver of PM2.5 was significantly reduced (p < 0.01). Then, Western blotting was performed to confirm the downregulation of PPARα (Figure 6D). These results indicated that PM2.5-induced liver lipid metabolic disorders might be related to the downregulation of PPARα and PPARγ expression via deceleration of lipoprotein transport and increased lipotoxicity (50).
4 Discussion
Air pollution PM2.5 not only has a huge impact on the respiratory and cardiovascular systems but also seriously impacts the whole body and various organs through the plasma and into peripheral tissues (51). Many researches have confirmed the central function of the active oxygen (ROS) and inflammatory factors in the regulation of PM2.5 multi-organ toxicity. Because PM2.5 is abundant in active oxidants like metals, PAHs, and quinones (Supplementary Table 1), it can induce ROS to form through lung redox reactions by direct interaction between PM2.5 and pulmonary lining. Numerous experiments have also shown that PM2.5 is responsible for forming lipid peroxidation products, and inflammatory factors that diffuse from the lungs could be transferred through the plasma and into peripheral tissues, where they could cause oxidative stress, inflammatory response, and, thus, damage (3, 5, 26, 44, 52).
As the liver is the core organ for detoxifying exogenous chemicals, liver damage caused by PM2.5 exposure has attracted more and more attention in recent years (17, 25, 28, 29). PM2.5 could directly affect the process of normal hepatic function by enhancing inflammatory cytokines, ultimately elevating the risk of NAFLD by abnormal lipids metabolism (44, 45). Besides, PM2.5-caused destruction of tight junctions allows intestinal bacteria and their toxic derivatives to leak, leading to liver inflammation and even the development of NASH (53). A study by Wang (54) has illustrated that long-term PM2.5 exposure can contribute to enteral malnutrition and, subsequently, abnormal glucose metabolism, which leads to the transfer of lipopolysaccharides into the systemic circulation, exacerbating the process of NAFLD and T2DM (44). More detailed functions need further verification and exploration to provide new insight into our knowledge of the potential molecular mechanism of hepatic injury by PM2.5 exposure. Our study provides a comprehensive description and a partially targeted analysis of the differences in liver metabolism and gene expression under PM2.5 exposure, especially lipid metabolic disorders.
Previous studies have shown that dysregulation of hepatic lipid metabolism plays an important role in various metabolic diseases (24, 55). Nonalcoholic fatty liver disease, the most common liver pathological change, is characterized by lipid accumulation and is closely associated with metabolic syndrome (32, 33). Our study found that the pathways of NAFLD and T2DM were significantly enriched under PM2.5 exposure by the analyses of transcriptome data. In previous studies, PM2.5 exposure may accelerate the occurrence of lipid-related metabolic diseases (27), such as T2DM and NAFLD (21, 56), by inducing dyslipidemia (52, 57) and adipose dysfunction (4), while the results of our analysis provide correlative evidence of gene expression for it. The integrated metabolomics and transcriptomics results showed that amino acid, carbohydrate, and lipid metabolism were disordered (Supplementary Figure 3).
In this study, we further measured acylcarnitine levels in mice liver tissue, which is widely used to screen for metabolic diseases and identify some relevant biomarkers (19, 58). Acylcarnitine plays an important role in maintaining normal liver function. As a specific substrate for mitochondrial fatty acid β-oxidation, it can help liver cells transfer fatty acids into mitochondria to provide energy for the body (19, 59), which is one of the major pathways of lipid metabolism (60, 61). When mitochondrial function is damaged, acylcarnitine accumulates, which can be a practical indicator for predicting hepatotoxicity (62). Our results found a significant accumulation of short-chain, medium-chain, and long-chain acylcarnitine, consistent with a previous study finding that PM2.5 exposure resulted in a significant accumulation of medium-chain acylcarnitine (17). Acylcarnitine, with obvious differences and stability under PM2.5 exposure among medium-chain or long-chain acylcarnitine, can be further used as a biomarker to indicate liver damage. Only myristoyl carnitine (C14:1) was decreased in statistical significance, but there was no relevant research to show its special mechanism in hepatocytes. At the same time, acylcarnitine accumulation also represents mitochondrial disorders to some extent and plays a key role in nonalcoholic steatohepatitis (34).
PPARs, which act as nuclear hormone receptors, regulate the transcription of genes associated with lipid metabolism and glucose metabolism.It has three isoforms: PPARα, PPARβ/δ and PPARγ. Numerous researches have demonstrated that PPARα negatively affects the proinflammatory and Acute Phase Reaction (APR) signaling pathways, as observed in the Systemic Inflammatory, Atherogenic, and Nonalcoholic Fatty Liver Disease (NASH) models (63–67). As a key transcriptional regulator of adipogenesis, PPARγ plays a key role in lipid storage and lipid droplet formation (63, 68). For instance, previous studies have shown that exposure to PM2.5 inhibits PPARγ signal transduction (17), to which subsequent liver damage, such as triglyceride accumulation and hepatic steatosis (46), can be partly attributed (37). Zheng et al.’s studies showed that PM2.5 induced abnormal lipid balance and decreased PPARγ and PPARα expression in vivo (63) and in vitro (37). In the present study, we also found that PPARα and PPARγ were significantly inhibited under PM2.5 exposure, indicating an imbalance of lipid homeostasis induced by PM2.5. However, the related effect and mechanism of hepatic steatosis need to be further studied, which may become a key step to understanding the impact and prevention of PM2.5 on liver injury.
SREBP-1c is a major transcription factor that regulates hepatic de novo lipogenesis through insulin (69). Furthermore, SREBP1 molecules mainly provide the building block by inducing lipid synthesis in rapidly growing cells (46). Hepatic de novo lipogenesis can be reduced, and excessive lipid accumulation can be suppressed by modulating the AMPK/SREBP1c/FAS signaling pathway (70). The role of SREBP-1c was demonstrated in a transgenic mouse model overexpressing SREBP-1c in the liver, which leads to the development of hepatic steatosis due to increased lipogenesis (71). Our gene network (Figure 4B) shows that the core node IRS1 is also related to SREBP-1c. Previous studies have shown the decrease in IRS1 expression associated with increased fat synthesis and steatosis. Docking and phosphorylation of Irs1/Irs2 in the cell can activate downstream kinase cascades, such as the PI3K-Akt pathway. Akt, activated by the pathway, can further inhibit hepatic gluconeogenesis but simultaneously activate SREBP1c-mediated hepatic lipid metabolism (72). In our study, it was demonstrated by fluorescent staining that PM2.5 exposure leads to overexpression of SREBP1, promoting the development of steatosis, which is consistent with previous findings (47).
According to the KEGG database, we found that there were seven common significantly enriched pathways combining the metabolomics and transcriptomics analysis data between the PM2.5 exposure group and control group, including alanine, aspartate and glutamate metabolism, phenylalanine, tyrosine, and tryptophan biosynthesis, phenylalanine metabolism, retinol metabolism, tyrosine metabolism, cysteine, and methionine metabolism and glutathione metabolism. The thorough KEGG pathway of the relationship between differential metabolites and DEGs related to glutathione metabolism, retinol metabolism, alanine, aspartate and glutamate metabolism, and cysteine and methionine metabolism are shown in Supplementary Figure 1.
Glutamate is essential to adjust glutathione levels in the body as the important substrate for synthesizing glutathione, which can undergo intermediate conversion by glutamine (62). Our study significantly altered the expression of glutathione (GSH) and L-Glutamic acid at PM2.5 exposure. Although oxidized glutathione (GSSG) was not a significantly altered metabolite, the GSH/GSSG ratio decreased with PM2.5 exposure due to the significant decrease in GSH. The decreased ratio is the hallmark of oxidative stress in the hepatocytes (17, 73), which is consistent with the previous study that exposure to PM2.5 may cause oxidative stress in the liver (26, 74).
IRS1 is essential to regulate insulin-dependent glucose utilization and glycogen synthesis. The disruption of IRS1 signaling is a key and common mechanism in developing insulin resistance in population and laboratory studies (75–77). In our transcriptomic analysis, we found that the expression of the irs1 was significantly downregulated in the PM2.5-exposed group, suggesting that IRS1 might be an important pathway for preventing and intervening in PM2.5-accelerated metabolic liver diseases. This idea was supported by an earlier study, finding that total flavonoids alleviate PM2.5-induced NAFLD by modulating the IRS1/Akt and CYP2E1/JNK pathways (78). Leukotriene B4 (LB4) could activate LB4r1 in hepatocytes, leading to cellular insulin resistance (79). In a recent study, Li et al. suggest that the LB4/Lb4r1 axis promotes the development of NAFLD by enhancing lipogenesis in hepatocytes, potentially serving as a therapeutic target for NAFLD (80). In the metabolomic analysis, we found LB4 was significantly upregulated in the PM2.5-treated group, indicating that LB4/Lb4r1 axis might participate in the PM2.5-induced abnormal liver metabolism. Thus, IRS1 and LB4 might mediate the hepatic pathological impact of PM2.5 exposure, which provides promising directions for developing therapeutic interventions.
In addition, the other detrimental influence of PM2.5 exposure can also be discovered with non-negligible abnormal phenomena shown in our study, including inflammatory response, insulin resistance, apoptosis, fibrosis, cofactor-related and vitamin-related metabolic disorders (5, 37, 52, 66, 81). Since our experimental study used single-sex mice and the gender differences were not considered, which may be certain restrictions. In future studies, we will continue to strengthen research on female mice to analyze further the distinct effects of PM2.5 exposure in both genders. As the metabolism and gene expression change depicted in our study, the specific effects and mechanisms of those changes need further exploration and experimental verification. The results may provide a comprehensive foundation and new insight into our knowledge of lipid accumulation and chronic hepatic injury by PM2.5 exposure.
5 Conclusion
Our study demonstrated that PM2.5 could induce extensive metabolic disturbances, particularly significant in lipid and amino acid dysregulation, through in vivo experiments combined with metabolomics and transcriptomics analyses. Meanwhile, our results revealed lipid dysfunction and hepatic steatosis induced by PM2.5 exposure, manifested as acylcarnitine and lipid droplet accumulation. Furthermore, we speculated and detected several key transcription factors as the potential regulatory effects in lipid metabolic disorders, PPARα, PPARγ, and SREBP1, and found their aberrant expression in the PM2.5 exposure group. Our study provides a novel molecular and genetic basis for a better understanding of the mechanisms of hepatic metabolic disorders induced by PM2.5 exposure, which can provide new insights into the toxicology of liver lipid metabolic disorders associated with air pollution and the risk assessment of chronic liver diseases.
Data availability statement
The original contributions presented in the study are publicly available. This data can be found here: https://github.com/Chenxiao-Zhang/RawData.
Ethics statement
The animal study was approved by the animal and ethics review committee of the laboratory animal center at Shanghai Jiao Tong University School of Medicine (Shanghai, China). The study was conducted in accordance with the local legislation and institutional requirements.
Author contributions
XD and CZ designed the study. CZ and TM drafted the manuscript. TM, JW, and DM conducted the PM2.5 collection and animal experiment. TM and CZ conducted liver histological staining. ML and XW completed the Quantitative Detection of Acylcarnitine. CZ, JW, and CL processed high-resolution mass spectrometric analysis and high-throughput RNA sequencing. CZ, JR, and XW contributed to virtualization. CZ, CL, DM, JW, and ML contributed to data analysis and manuscript writing. All authors contributed to the article and approved the submitted version.
Funding
This study was supported by the National Natural Science Foundation of China (Grant No. 21777099, XD), SJTU Public Health School Local High-level University Achievement-oriented Top-notch Cultivation Programme for Undergraduate Students (Grant No. 18ZYGW12), and Core Facility of Basic Medical Sciences, Shanghai Jiao Tong University School of Medicine. The funding agencies had no role in the design and conduct of the study; collection, management, analysis, and interpretation of the data; preparation, review, or approval of the manuscript; or decision to submit the manuscript for publication.
Conflict of interest
The authors declare that the research was conducted in the absence of any commercial or financial relationships that could be construed as a potential conflict of interest.
Publisher’s note
All claims expressed in this article are solely those of the authors and do not necessarily represent those of their affiliated organizations, or those of the publisher, the editors and the reviewers. Any product that may be evaluated in this article, or claim that may be made by its manufacturer, is not guaranteed or endorsed by the publisher.
Supplementary material
The Supplementary Material for this article can be found online at: https://www.frontiersin.org/articles/10.3389/fendo.2023.1212291/full#supplementary-material
References
1. Fang GC, Zhuang YJ, Cho MH, Huang CY, Xiao YF, Tsai KH. Review of total suspended particles (TSP) and PM2.5 concentration variations in Asia during the years of 1998-2015. Environ Geochem Health (2018) 40(3):1127–44. doi: 10.1007/s10653-017-9992-8
2. Borhani F, Shafiepour Motlagh M, Ehsani AH, Rashidi Y. Evaluation of short-lived atmospheric fine particles in Tehran, Iran. Arab J Geosci (2022) 15(16):1398. doi: 10.1007/s12517-022-10667-5
4. Yan R, Ku T, Yue H, Li G, Sang N. PM2.5 exposure induces age-dependent hepatic lipid metabolism disorder in female mice. J Environ Sci (China) (2020) 89:227–37. doi: 10.1016/j.jes.2019.10.014
5. Wang R, Han X, Pang H, Hu Z, Shi C. Illuminating a time-response mechanism in mice liver after PM2.5 exposure using metabolomics analysis. Sci Total Environ (2021) 767:144485. doi: 10.1016/j.scitotenv.2020.144485
6. Douwes J, Thorne P, Pearce N, Heederik D. Bioaerosol health effects and exposure assessment: progress and prospects. Ann Occup Hyg (2003) 47(3):187–200. doi: 10.1093/annhyg/meg032
7. Junaid M, Syed JH, Abbasi NA, Hashmi MZ, Malik RN, Pei DS. Status of indoor air pollution (IAP) through particulate matter (PM) emissions and associated health concerns in South Asia. Chemosphere (2018) 191:651–63. doi: 10.1016/j.chemosphere.2017.10.097
8. Chen Y, Ebenstein A, Greenstone M, Li H. Evidence on the impact of sustained exposure to air pollution on life expectancy from China's Huai River policy. Proc Natl Acad Sci USA (2013) 110(32):12936–41. doi: 10.1073/pnas.1300018110
9. Maier KL, Alessandrini F, Beck-Speier I, Hofer TP, Diabate S, Bitterle E, et al. Health effects of ambient particulate matter–biological mechanisms and inflammatory responses to in vitro and in vivo particle exposures. Inhal Toxicol (2008) 20(3):319–37. doi: 10.1080/08958370701866313
10. Ruckerl R, Schneider A, Breitner S, Cyrys J, Peters A. Health effects of particulate air pollution: A review of epidemiological evidence. Inhal Toxicol (2011) 23(10):555–92. doi: 10.3109/08958378.2011.593587
11. Feng S, Gao D, Liao F, Zhou F, Wang X. The health effects of ambient PM2.5 and potential mechanisms. Ecotoxicol Environ Saf (2016) 128:67–74. doi: 10.1016/j.ecoenv.2016.01.030
12. Bouazza N, Foissac F, Urien S, Guedj R, Carbajal R, Treluyer JM, et al. Fine particulate pollution and asthma exacerbations. Arch Dis Child (2018) 103(9):828–31. doi: 10.1136/archdischild-2017-312826
13. Thimmegowda GG, Mullen S, Sottilare K, Sharma A, Mohanta SS, Brockmann A, et al. A field-based quantitative analysis of sublethal effects of air pollution on pollinators. Proc Natl Acad Sci USA (2020) 117(34):20653–61. doi: 10.1073/pnas.2009074117
14. Rajagopalan S, Al-Kindi SG, Brook RD. Air pollution and cardiovascular disease: JACC state-of-the-art review. J Am Coll Cardiol (2018) 72(17):2054–70. doi: 10.1016/j.jacc.2018.07.099
15. Zhang X, Chen X, Zhang X. The impact of exposure to air pollution on cognitive performance. Proc Natl Acad Sci USA (2018) 115(37):9193–7. doi: 10.1073/pnas.1809474115
16. Calderon-Garciduenas L, Solt AC, Henriquez-Roldan C, Torres-Jardon R, Nuse B, Herritt L, et al. Long-term air pollution exposure is associated with neuroinflammation, an altered innate immune response, disruption of the blood-brain barrier, ultrafine particulate deposition, and accumulation of amyloid beta-42 and alpha-synuclein in children and young adults. Toxicol Pathol (2008) 36(2):289–310. doi: 10.1177/0192623307313011
17. Ye G, Ding D, Gao H, Chi Y, Chen J, Wu Z, et al. Comprehensive metabolic responses of HepG2 cells to fine particulate matter exposure: Insights from an untargeted metabolomics. Sci Total Environ (2019) 691:874–84. doi: 10.1016/j.scitotenv.2019.07.192
18. Shi C, Han X, Mao X, Fan C, Jin M. Metabolic profiling of liver tissues in mice after instillation of fine particulate matter. Sci Total Environ (2019) 696:133974. doi: 10.1016/j.scitotenv.2019.133974
19. Pan Z, Miao W, Wang C, Tu W, Jin C, Jin Y. 6:2 Cl-PFESA has the potential to cause liver damage and induce lipid metabolism disorders in female mice through the action of PPAR-gamma. Environ Pollut (2021) 287:117329. doi: 10.1016/j.envpol.2021.117329
20. Byrne CD, Olufadi R, Bruce KD, Cagampang FR, Ahmed MH. Metabolic disturbances in non-alcoholic fatty liver disease. Clin Sci (Lond) (2009) 116(7):539–64. doi: 10.1042/CS20080253
21. Elizabeth M, Brunt MD. Nonalcoholic steatohepatitis. Semin Liver Dis (2004) 24:3–20. doi: 10.1055/s-2004-823098
22. Suzuki A, Diehl AM. Nonalcoholic steatohepatitis. Annu Rev Med (2017) 68:85–98. doi: 10.1146/annurev-med-051215-031109
23. Zhang J, Du H, Shen M, Zhao Z, Ye X. Kangtaizhi granule alleviated nonalcoholic fatty liver disease in high-fat diet-fed rats and hepG2 cells via AMPK/mTOR signaling pathway. J Immunol Res (2020) 2020:3413186. doi: 10.1155/2020/3413186
24. Gaggini M, Morelli M, Buzzigoli E, DeFronzo RA, Bugianesi E, Gastaldelli A. Non-alcoholic fatty liver disease (NAFLD) and its connection with insulin resistance, dyslipidemia, atherosclerosis and coronary heart disease. Nutrients (2013) 5(5):1544–60. doi: 10.3390/nu5051544
25. Xu Y, Wang W, Zhou J, Chen M, Huang X, Zhu Y, et al. Metabolomics analysis of a mouse model for chronic exposure to ambient PM2. 5. Environ Pollut (2019) 247:953–63. doi: 10.1016/j.envpol.2019.01.118
26. Jeong S, Park SA, Park I, Kim P, Cho NH, Hyun JW, et al. PM2.5 exposure in the respiratory system induces distinct inflammatory signaling in the lung and the liver of mice. J Immunol Res (2019) 2019:3486841. doi: 10.1155/2019/3486841
27. Zhang SY, Shao D, Liu H, Feng J, Feng B, Song X, et al. Metabolomics analysis reveals that benzo[a]pyrene, a component of PM2.5, promotes pulmonary injury by modifying lipid metabolism in a phospholipase A2-dependent manner in vivo and in vitro. Redox Biol (2017) 13:459–69. doi: 10.1016/j.redox.2017.07.001
28. Sun Q, Yue P, Deiuliis JA, Lumeng CN, Kampfrath T, Mikolaj MB, et al. Ambient air pollution exaggerates adipose inflammation and insulin resistance in a mouse model of diet-induced obesity. Circulation (2009) 119(4):538–46. doi: 10.1161/CIRCULATIONAHA.108.799015
29. Kim KN, Lee H, Kim JH, Jung K, Lim YH, Hong YC. Physical activity- and alcohol-dependent association between air pollution exposure and elevated liver enzyme levels: an elderly panel study. J Prev Med Public Health (2015) 48(3):151–69. doi: 10.3961/jpmph.15.014
30. VoPham T, Bertrand KA, Tamimi RM, Laden F, Hart JE. Ambient PM2.5 air pollution exposure and hepatocellular carcinoma incidence in the United States. Cancer Causes Control (2018) 29(6):563–72. doi: 10.1007/s10552-018-1036-x
31. Wong CM, Tsang H, Lai HK, Thomas GN, Lam KB, Chan KP, et al. Cancer mortality risks from long-term exposure to ambient fine particle. Cancer Epidemiol Biomarkers Prev (2016) 25(5):839–45. doi: 10.1158/1055-9965.EPI-15-0626
32. Kim JW, Park S, Lim CW, Lee K, Kim B. The role of air pollutants in initiating liver disease. Toxicol Res (2014) 30(2):65–70. doi: 10.5487/TR.2014.30.2.065
33. Yang S, Chen R, Zhang L, Sun Q, Li R, Gu W, et al. Lipid metabolic adaption to long-term ambient PM2.5 exposure in mice. Environ Pollut (2021) 269:116193. doi: 10.1016/j.envpol.2020.116193
34. Ge CX, Qin YT, Lou DS, Li Q, Li YY, Wang ZM, et al. iRhom2 deficiency relieves TNF-alpha associated hepatic dyslipidemia in long-term PM2.5-exposed mice. Biochem Biophys Res Commun (2017) 493(4):1402–9. doi: 10.1016/j.bbrc.2017.09.152
35. Haberzettl P, O’Toole TE, Bhatnagar A, Conklin DJ. Exposure to fine particulate air pollution causes vascular insulin resistance by inducing pulmonary oxidative stress. Environ Health Perspect (2016) 124(12):1830–9. doi: 10.1289/EHP212
36. Ding D, Ye G, Lin Y, Lu Y, Zhang H, Zhang X, et al. MicroRNA-26a-CD36 signaling pathway: Pivotal role in lipid accumulation in hepatocytes induced by PM2. 5 liposoluble extracts. Environ Pollut (2019) 248:269–78. doi: 10.1016/j.envpol.2019.01.112
37. Zheng Z, Zhang X, Wang J, Dandekar A, Kim H, Qiu Y, et al. Exposure to fine airborne particulate matters induces hepatic fibrosis in murine models. J Hepatol (2015) 63(6):1397–404. doi: 10.1016/j.jhep.2015.07.020
38. Xu Z, Li Z, Liao Z, Gao S, Hua L, Ye X, et al. PM2.5 induced pulmonary fibrosis in vivo and in vitro. Ecotoxicol Environ Saf (2019) 171:112–21. doi: 10.1016/j.ecoenv.2018.12.061
39. Anderson N, Borlak J. Molecular mechanisms and therapeutic targets in steatosis and steatohepatitis. Pharmacol Rev (2008) 60(3):311–57. doi: 10.1124/pr.108.00001
40. Joshi-Barve S, Barve SS, Amancherla K, Gobejishvili L, Hill D, Cave M, et al. Palmitic acid induces production of proinflammatory cytokine interleukin-8 from hepatocytes. Hepatology (2007) 46(3):823–30. doi: 10.1002/hep.21752
41. Xu Z, Wang N, Xu Y, Hua L, Zhou D, Zheng M, et al. Effects of chronic PM2.5 exposure on pulmonary epithelia: Transcriptome analysis of mRNA-exosomal miRNA interactions. Toxicol Lett (2019) 316:49–59. doi: 10.1016/j.toxlet.2019.09.010
42. Sun L, Liang L, Gao X, Zhang H, Yao P, Hu Y, et al. Early prediction of developing type 2 diabetes by plasma acylcarnitines: A population-based study. Diabetes Care (2016) 39(9):1563–70. doi: 10.2337/dc16-0232
43. Zhao D, Han L, He Z, Zhang J, Zhang Y. Identification of the plasma metabolomics as early diagnostic markers between biliary atresia and neonatal hepatitis syndrome. PloS One (2014) 9(1):e85694. doi: 10.1371/journal.pone.0085694
44. Chen J, Qiu S, Li W, Wang K, Zhang Y, Yang H, et al. Tuning charge density of chimeric antigen receptor optimizes tonic signaling and CAR-T cell fitness. Cell Res (2023) 33(5):341–54. doi: 10.1038/s41422-023-00789-0
45. Zhang Y, Sheng R, Chen J, Wang H, Zhu Y, Cao Z, et al. Silk fibroin and sericin differentially potentiate the paracrine and regenerative functions of stem cells through multiomics analysis. Adv Mater (2023) 35:e2210517. doi: 10.1002/adma.202210517
46. Yalcin M, Kacar M. Investigation of the hepatic mTOR/S6K1/SREBP1 signalling pathway in rats at different ages: from neonates to adults. Mol Biol Rep (2021) 48:7415–22. doi: 10.1007/s11033-021-06757-4
47. Ding S, Yuan C, Si B, Wang M, Da S, Bai L, et al. Combined effects of ambient particulate matter exposure and a high-fat diet on oxidative stress and steatohepatitis in mice. PloS One (2019) 14(3):e0214680. doi: 10.1371/journal.pone.0214680
48. Jia Y, Wu C, Kim J, Kim B, Lee SJ. Astaxanthin reduces hepatic lipid accumulations in high-fat-fed C57BL/6J mice via activation of peroxisome proliferator-activated receptor (PPAR) alpha and inhibition of PPAR gamma and Akt. J Nutr Biochem (2016) 28:9–18. doi: 10.1016/j.jnutbio.2015.09.015
49. Pawlak M, Lefebvre P, Staels B. Molecular mechanism of PPARα action and its impact on lipid metabolism, inflammation and fibrosis in non-alcoholic fatty liver disease. J Hepatol (2015) 62(3):720–33. doi: 10.1016/j.jhep.2014.10.039
50. Zhong J, Gong W, Lu L, Chen J, Lu Z, Li H, et al. Irbesartan ameliorates hyperlipidemia and liver steatosis in type 2 diabetic db/db mice via stimulating PPAR-gamma, AMPK/Akt/mTOR signaling and autophagy. Int Immunopharmacol (2017) 42:176–84. doi: 10.1016/j.intimp.2016.11.015
51. Zhao C, Niu M, Song S, Li J, Su Z, Wang Y, et al. Serum metabolomics analysis of mice that received repeated airway exposure to a water-soluble PM2.5 extract. Ecotoxicol Environ Saf (2019) 168:102–9. doi: 10.1016/j.ecoenv.2018.10.068
52. Xu MX, Ge CX, Qin YT, Gu TT, Lou DS, Li Q, et al. Prolonged PM2.5 exposure elevates risk of oxidative stress-driven nonalcoholic fatty liver disease by triggering increase of dyslipidemia. Free Radic Biol Med (2019) 130:542–56. doi: 10.1016/j.freeradbiomed.2018.11.016
53. Fasano A. Physiological, pathological, and therapeutic implications of zonulin-mediated intestinal barrier modulation: living life on the edge of the wall. Am J Pathol (2008) 173(5):1243–52. doi: 10.2353/ajpath.2008.080192
54. Wang W, Zhou J, Chen M, Huang X, Xie X, Li W, et al. Exposure to concentrated ambient PM(2.5) alters the composition of gut microbiota in a murine model. Part Fibre Toxicol (2018) 15(1):17.
55. Item F, Wueest S, Lemos V, Stein S, Lucchini FC, Denzler R, et al. Fas cell surface death receptor controls hepatic lipid metabolism by regulating mitochondrial function. Nat Commun (2017) 8(1):480. doi: 10.1038/s41467-017-00566-9
56. Li Y, Xu L, Shan Z, Teng W, Han C. Association between air pollution and type 2 diabetes: an updated review of the literature. Ther Adv Endocrinol Metab (2019) 10:2042018819897046. doi: 10.1177/2042018819897046
57. Ramanathan G, Yin F, Speck M, Tseng CH, Brook JR, Silverman F, et al. Effects of urban fine particulate matter and ozone on HDL functionality. Part Fibre Toxicol (2016) 13(1):26. doi: 10.1186/s12989-016-0139-3
58. Hannon WH, Grosse SD. Using tandem mass spectrometry for metabolic disease screening among newborns. A report of a work group. MMWR Recomm Rep (2001) 50(Rr-3):1–34.
59. Li S, Gao D, Jiang Y. Function, detection and alteration of acylcarnitine metabolism in hepatocellular carcinoma. Metabolites (2019) 9(2):36. doi: 10.3390/metabo9020036
60. Indiveri C, Iacobazzi V, Tonazzi A, Giangregorio N, Infantino V, Convertini P, et al. The mitochondrial carnitine/acylcarnitine carrier: function, structure and physiopathology. Mol Aspects Med (2011) 32(4-6):223–33. doi: 10.1016/j.mam.2011.10.008
61. Nakamura M, Nakata K, Matsumoto H, Ohtsuka T, Yoshida K, Tokunaga S, et al. Acyl/free carnitine ratio is a risk factor for hepatic steatosis after pancreatoduodenectomy and total pancreatectomy. Pancreatology (2017) 17(1):135–8. doi: 10.1016/j.pan.2016.11.007
62. Ya-lan X, Ping-fei F. Advance in hepatotoxicity biomarkers based on pharmacometabolomics. Chinese Journal of New Drugs and Clinical Remedies (2020) 39(11):641–6. doi: 10.14109/j.cnki.xyylc.2020.11.01
63. Zheng Z, Xu X, Zhang X, Wang A, Zhang C, Hüttemann M, et al. Exposure to ambient particulate matter induces a NASH-like phenotype and impairs hepatic glucose metabolism in an animal model. J Hepatol (2013) 58(1):148–54. doi: 10.1016/j.jhep.2012.08.009
64. Francque S, Verrijken A, Caron S, Prawitt J, Paumelle R, Derudas B, et al. PPARα gene expression correlates with severity and histological treatment response in patients with non-alcoholic steatohepatitis. J Hepatol (2015) 63(1):164–73. doi: 10.1016/j.jhep.2015.02.019
65. Qiu YY, Zhang J, Zeng FY, Zhu YZ. Roles of the peroxisome proliferator-activated receptors (PPARs) in the pathogenesis of nonalcoholic fatty liver disease (NAFLD). Pharmacol Res (2023) 192:106786. doi: 10.1016/j.phrs.2023.106786
66. Li Y, Adeniji NT, Fan W, Kunimoto K, Török NJ. Non-alcoholic fatty liver disease and liver fibrosis during aging. Aging Dis (2022) 13(4):1239–51. doi: 10.14336/AD.2022.0318
67. Gavrilova O, Haluzik M, Matsusue K, Cutson JJ, Johnson L, Dietz KR, et al. Liver peroxisome proliferator-activated receptor gamma contributes to hepatic steatosis, triglyceride clearance, and regulation of body fat mass. J Biol Chem (2003) 278(36):34268–76. doi: 10.1074/jbc.M300043200
68. Morán-Salvador E, López-Parra M, García-Alonso V, Titos E, Martínez-Clemente M, González-Périz A, et al. Role for PPARγ in obesity-induced hepatic steatosis as determined by hepatocyte- and macrophage-specific conditional knockouts. FASEB J (2011) 25(8):2538–50. doi: 10.1096/fj.10-173716
69. Moon YA. The SCAP/SREBP pathway: A mediator of hepatic steatosis. Endocrinol Metab (Seoul) (2017) 32(1):6–10. doi: 10.3803/EnM.2017.32.1.6
70. Li J, Xie S, Teng W. Sulforaphane attenuates nonalcoholic fatty liver disease by inhibiting hepatic steatosis and apoptosis. Nutrients (2021) 14(1):76. doi: 10.3390/nu14010076
71. Shimano H, Horton JD, Shimomura I, Hammer RE, Brown MS, Goldstein JL. Isoform 1c of sterol regulatory element binding protein is less active than isoform 1a in livers of transgenic mice and in cultured cells. J Clin Invest (1997) 99(5):846–54. doi: 10.1172/JCI119248
72. Sakurai Y, Kubota N, Yamauchi T, Kadowaki T. Role of insulin resistance in MAFLD. Int J Mol Sci (2021) 22(8):4156. doi: 10.3390/ijms22084156
73. Cuykx M, Rodrigues RM, Laukens K, Vanhaecke T, Covaci A. In vitro assessment of hepatotoxicity by metabolomics: a review. Arch Toxicol (2018) 92(10):3007–29. doi: 10.1007/s00204-018-2286-9
74. Li M, Li YM. Fine particulate matter and nonalcoholic fatty liver disease. Zhonghua Gan Zang Bing Za Zhi (2016) 24(9):713–5. doi: 10.3760/cma.j.issn.1007-3418.2016.09.017
75. Lavin DP, White MF, Brazil DP. IRS proteins and diabetic complications. Diabetologia (2016) 59(11):2280–91. doi: 10.1007/s00125-016-4072-7
76. Baena M, Sangüesa G, Dávalos A, Latasa M-J, Sala-Vila A, Sánchez RM, et al. Fructose, but not glucose, impairs insulin signaling in the three major insulin-sensitive tissues. Sci Rep (2016) 6(1):26149. doi: 10.1038/srep26149
77. Bhatt SP, Guleria R. Association of IRS1 (Gly972Arg) and IRS2 (Gly1057Asp) genes polymorphisms with OSA and NAFLD in Asian Indians. PloS One (2021) 16(8):e0245408. doi: 10.1371/journal.pone.0245408
78. Jian T, Ding X, Wu Y, Ren B, Li W, Lv H, et al. Hepatoprotective effect of loquat leaf flavonoids in PM(2.5)-induced non-alcoholic fatty liver disease via regulation of IRs-1/akt and CYP2E1/JNK pathways. Int J Mol Sci (2018) 19(10):3005. doi: 10.3390/ijms19103005
79. Li P, Oh DY, Bandyopadhyay G, Lagakos WS, Talukdar S, Osborn O, et al. LTB4 promotes insulin resistance in obese mice by acting on macrophages, hepatocytes and myocytes. Nat Med (2015) 21(3):239–47. doi: 10.1038/nm.3800
80. Liu X, Wang K, Wang L, Kong L, Hou S, Wan Y, et al. Hepatocyte leukotriene B4 receptor 1 promotes NAFLD development in obesity. Hepatology (2022) 00:1–16. doi: 10.1002/hep.32708
Keywords: particulate matter, metabolomics, transcriptomics, hepatic steatosis, PPARα, PPARγ, SREBP1
Citation: Zhang C, Ma T, Liu C, Ma D, Wang J, Liu M, Ran J, Wang X and Deng X (2023) PM2.5 induced liver lipid metabolic disorders in C57BL/6J mice. Front. Endocrinol. 14:1212291. doi: 10.3389/fendo.2023.1212291
Received: 26 April 2023; Accepted: 16 August 2023;
Published: 14 September 2023.
Edited by:
Marianna Sadagurski, Wayne State University, United StatesReviewed by:
Jonathan Shannahan, Purdue University, United StatesKezhong Zhang, Wayne State University, United States
Copyright © 2023 Zhang, Ma, Liu, Ma, Wang, Liu, Ran, Wang and Deng. This is an open-access article distributed under the terms of the Creative Commons Attribution License (CC BY). The use, distribution or reproduction in other forums is permitted, provided the original author(s) and the copyright owner(s) are credited and that the original publication in this journal is cited, in accordance with accepted academic practice. No use, distribution or reproduction is permitted which does not comply with these terms.
*Correspondence: Xiaobei Deng, ZGVuZ3hpYW9iZWlAc2p0dS5lZHUuY24=; Xueting Wang, d3h0MjA4OEBzaHRyaG9zcGl0YWwuY29t; Jinjun Ran, amluanVuckBzanR1LmVkdS5jbg==
†These authors have contributed equally to this work