
95% of researchers rate our articles as excellent or good
Learn more about the work of our research integrity team to safeguard the quality of each article we publish.
Find out more
ORIGINAL RESEARCH article
Front. Endocrinol. , 04 July 2023
Sec. Systems Endocrinology
Volume 14 - 2023 | https://doi.org/10.3389/fendo.2023.1184190
This article is part of the Research Topic Machine Learning-Assisted Diagnosis and Treatment of Endocrine-Related Diseases View all 13 articles
 Xiao zhu Liu1,2†
 Minjie Duan2,3†
 Hao dong Huang2,3
 Yang Zhang2,3
 Tian yu Xiang4Wu ceng Niu5Bei Zhou1
 Hao lin Wang3*
 Ting ting Zhang6*
Objective: Diabetic kidney disease (DKD) has been reported as a main microvascular complication of diabetes mellitus. Although renal biopsy is capable of distinguishing DKD from Non Diabetic kidney disease(NDKD), no gold standard has been validated to assess the development of DKD.This study aimed to build an auxiliary diagnosis model for type 2 Diabetic kidney disease (T2DKD) based on machine learning algorithms.
Methods: Clinical data on 3624 individuals with type 2 diabetes (T2DM) was gathered from January 1, 2019 to December 31, 2019 using a multi-center retrospective database. The data fell into a training set and a validation set at random at a ratio of 8:2. To identify critical clinical variables, the absolute shrinkage and selection operator with the lowest number was employed. Fifteen machine learning models were built to support the diagnosis of T2DKD, and the optimal model was selected in accordance with the area under the receiver operating characteristic curve (AUC) and accuracy. The model was improved with the use of Bayesian Optimization methods. The Shapley Additive explanations (SHAP) approach was used to illustrate prediction findings.
Results: DKD was diagnosed in 1856 (51.2 percent) of the 3624 individuals within the final cohort. As revealed by the SHAP findings, the Categorical Boosting (CatBoost) model achieved the optimal performance 1in the prediction of the risk of T2DKD, with an AUC of 0.86 based on the top 38 characteristics. The SHAP findings suggested that a simplified CatBoost model with an AUC of 0.84 was built in accordance with the top 12 characteristics. The more basic model features consisted of systolic blood pressure (SBP), creatinine (CREA), length of stay (LOS), thrombin time (TT), Age, prothrombin time (PT), platelet large cell ratio (P-LCR), albumin (ALB), glucose (GLU), fibrinogen (FIB-C), red blood cell distribution width-standard deviation (RDW-SD), as well as hemoglobin A1C(HbA1C).
Conclusion: A machine learning-based model for the prediction of the risk of developing T2DKD was built, and its effectiveness was verified. The CatBoost model can contribute to the diagnosis of T2DKD. Clinicians could gain more insights into the outcomes if the ML model is made interpretable.
Diabetes mellitus refers to a chronic epidemic metabolic disease with high blood glucose. The latest statistics from the International Diabetes Federation (IDF) suggested that approximately 463 million adults (aged 20-79 years) worldwide would have diabetes by 2019; the number of people with diabetes was estimated to reach 700 million by 2045 (1). Complications of diabetes have been found as the leading cause of death in diabetic patients (2), with 76.4% of diabetic patients reporting at least one complication (3). Diabetic kidney disease (DKD) has been reported as a main microvascular complication of diabetes mellitus, which is characterized by high prevalence, mortality, and treatment costs, but low awareness and poor prevention and treatment rates (4). In China, nearly 20-40% of diabetic patients suffer from DKD, while the awareness rate of DKD is lower than 20%, and the treatment rate is even lower than 50% (5).
The typical progression of DKD refers to an initial increase in urinary albumin excretion (called microalbuminuria), which is accompanied with progression to massive albuminuria and subsequent rapid decline in renal function. As a result, proteinuria has been considered the initial pathway for the progression of declining renal function from the traditional perspective (6). However, the above theory has been challenged since numerous patients with proteinuria have been found to return to normal albumin excretion rates either spontaneously or based on the integrated risk management with DKD (7–11). On that basis, the effectiveness of microalbuminuria as a traditional marker of DKD and the optimal opportunity for intervention are challenged since DKD is generally insidious during onset (12). Although renal biopsy is capable of distinguishing DKD from Diabetic kidney disease (NDKD), no gold standard has been validated to assess the development of DKD. Although increased screening frequency can avoid delayed diagnoses, this is not uniformly implemented. Furthermore, the prevention, early diagnosis and treatment of DKD take on a critical significance in reducing the incidence of cardiovascular events in diabetic patients and improving their survival and quality of life. Accordingly, there is an urgent need for a simple and convenient clinical tool to assess DKD in daily clinical practice.
Developing a risk scoring system based on simple predictors, i.e., clinical data, is considered a vital for monitoring and diagnosing DKD. Machine learning algorithm (ML) show significant advantages in processing a considerable number of data with high-dimensional properties and numerous cases. It is extensively employed for disease prediction (13). Machine learning algorithms can efficiently predict the DKD (14–17). Identification of risk factors for the progression of DKD to ESRD is expected to improve the prognosis by early detection and appropriate intervention (18). Most studies on predictive models for DKD have adopted a single classifier for statistical analysis, and most of them achieved small sample sizes. Under excessive samples and variables, the models will be prone to underfitting or overfitting, and the performance and efficiency could be enhanced. Most of the prediction models developed by foreign researchers apply to the white population, and they are likely to be less applicable to the Asian population (19, 20). Thus, it is of clinical significance in developing ancillary diagnostic models for DKD with the use of ML. However, few large-scale studies have investigated the use of machine learning analysis of clinical characteristics to predict DKD in the Chinese population. A retrospective cohort study was conducted, which involved the collection of clinical parameters and the application of machine learning models to differentiate between DKD and NDKD.
The data originated from Chongqing Medical University’s Medical Data Intelligence Platform(Yidu-Cloud (Beijing) Technology Co, Ltd, China), which consisted of the data from seven institutions and over 40 million electronic medical records (during 1 January 2010 to 31 May 2020) (21–23). Only the information from the first hospitalization was applied in the event of subsequent hospitalizations. Xiaozhu Liu (Account Number: cy2014223346)and Minjie Duan (Account Number: MI2020111943) were permitted to access data directly on the platform system where all information is anonymous and has a unique identifying code to preserve privacy, while an informed consent from the patient is unnecessary. The local institutional ethics committee gave us their authorization.The inclusion and exclusion criteria below were employed for screening:
Inclusion criteria: (1) hospitalization for T2DM or T2DKD; (2) following the WHO 1999 diagnostic criteria for diabetes mellitus; (3) age >18 years; following the diagnostic criteria of the KDOQI US commentary on the 2012 KDIGO clinical practice guideline for Chronic kidney disease (24).
Exclusion criteria: (1) combination of other possible complications such as urinary tract infection, malignancy; (2) immune diseases (e.g., systemic lupus erythematosus and vasculitis); (3) Other endocrine diseases; (4) type 1 diabetes, gestational diabetes and other diabetes with unclear classification; (5) hospitalization days <1; (6) discharge against medical advice; (7) patients lost to follow-up or death during index hospitalization; and (8) patients with >25% of data missing.
In accordance with the inclusion and exclusion criteria, 3624 patients with T2DM were recruited, which consisted of 1856 patients with T2DKD (Figure 1). In this study, DKD was defined in accordance with the National Health Insurance Administration’s definition of catastrophic illness ICD-9 and ICD-10 codes for DKD.
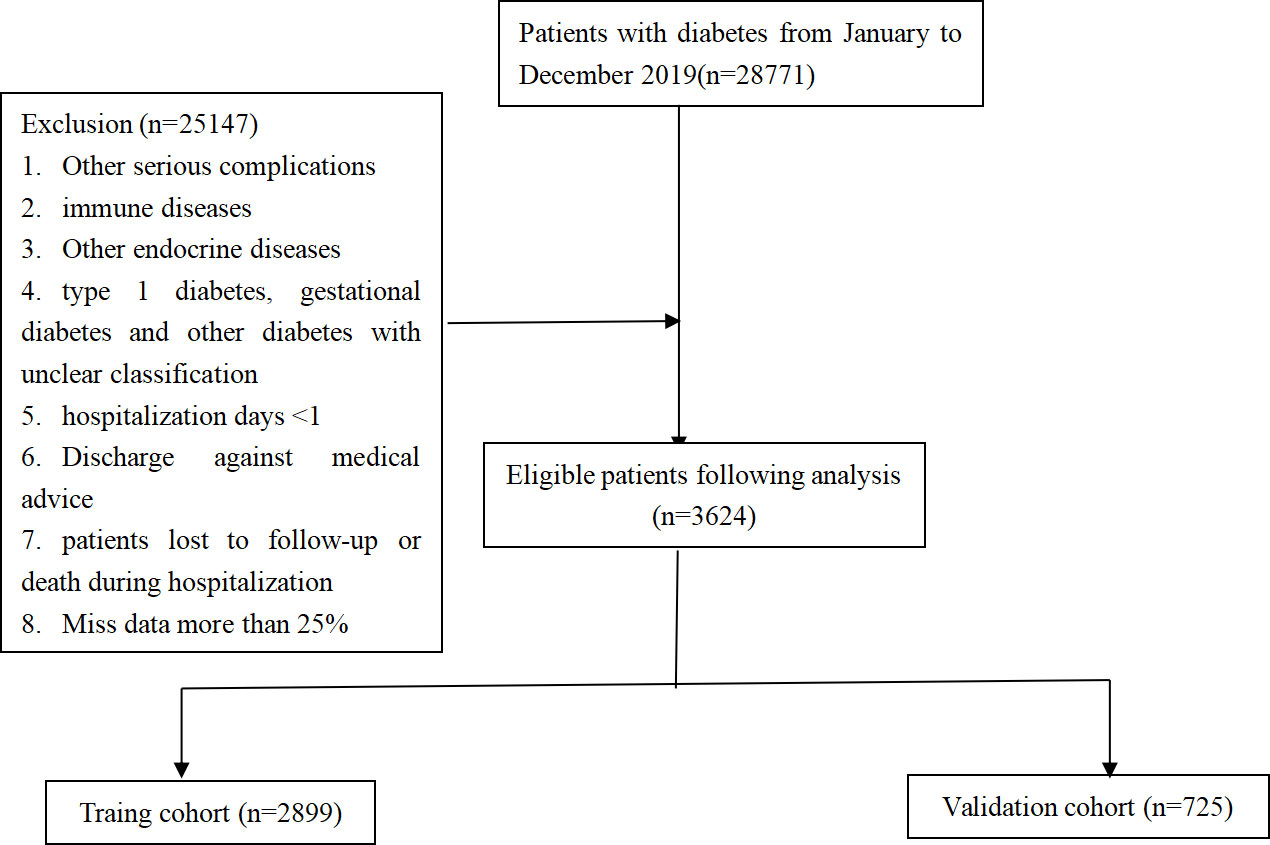
Figure 1 The flowchart of the study.
The definition of CKD in the 2012 KDIGO clinical practice guideline was adopted (24, 25).
The latest literature on DKD was reviewed and combined with clinical experience to acquire relevant clinical data and laboratory characteristics (25–28). 53 clinical characteristics with missing values ≤ 25% were covered. Since most models cannot analyze data with missing values, Multivariate Imputation by Chained Equations (MICE) algorithm was used for data filling.
Baseline data were compared in patients with DKD and T2DKD from the first examination and test results after admission (Table S1)
The data set was randomly assigned to a training set (80%) and a validation set (20%) based on stratified random sampling. Our models were developed using the training set, and their performance was assessed using the validation set. The least absolute shrinkage and selection operator (LASSO) was employed for selecting the risk predictors to eliminate unnecessary and redundant information and increase the model’s discriminative capacity. Finally, non-zero regression coefficient variables were selected to build the prediction models.
To select the prospective algorithms for our prediction models, we first analyzed the performance of 15 machine learning algorithms without hyper-parameters tuning. After that, an algorithm with the optimal performance was selected in accordance with the model’s accuracy and the area under the receiver operating characteristic curve (AUC). PyCaret (version 2.3.3), an open source, low-code machine learning library in Python, was employed to perform the screening procedure. Second, the Bayesian Optimization approach with 10-fold cross validation was adopted for adjusting a prediction model based on the training set to find the ideal hyper-parameter configuration. The above algorithm is an efficient constrained global optimization tool, which was performed based on the functions of the bayes_opt Python package (version 1.2.0). AUC, accuracy and sensitivity were obtained to assess the models performance based on the independent validation set.
To reduce the black-box nature of machine learning and to allow clinicians to understand the results of the provided model, SHapley Additive exPlanations (SHAP) was adopted to interpret the model with the use of SHAP python package (version 0.39.0). The significance of input features was obtained with the use of a game-theoretic algorithm based on the independent validation set. It is noteworthy that all 38 variables would not always be available in clinical practice. Accordingly, the top 12 were taken from SHAP summary plots to build the simpler model, and the discriminative power was compared between the full model and simpler models.
For baseline comparison of data sets, categorical variables were denoted as percentages, and Chi-square test or Fisher’s exact test was performed for comparison between groups. Continuous variables were examined for normality using Kolmogorov-Smirnov test, and measures following normal distribution were denoted as mean ± standard deviation, and Student’s t-test was used for comparison between groups, and measures not following normal distribution were denoted as median (interquartile range), and Mann-Whitney U rank sum test was performed for comparison between groups. R (version 4.0.2) was adopted for statistical analysis. A two-sided P < 0.05 was considered to achieve statistical significance.
The data were assigned to a training set and a validation set at 8:2. The training set consisted of 2899 cases, including 1485 cases of T2DKD (51.2%) and 1414 cases of T2DM (48.8%); the validation set consisted of 725 cases, including 371 cases of T2DKD (51.2%) and 354 cases of T2DM (48.8%) (see Table S2 for details).
Least absolute shrinkage and selection operator(LASSO) was employed to select the most significant features, so as to classify individuals diagnosed DKD. All features (a total of 53 variables) were included in the LASSO regression analysis and narrowed down to 38 features with non-zero β coefficients in the LASSO regression model. The above features were Sex, Smoke, Drink history, Age, length of stay (LOS), Systolic blood pressure (SBP), diastolic blood pressure (DBP), total protein (TP), albumin (ALB), gamma glutamyltransferase (GGT), alanine aminotransferase (ALT), alkaline phosphatase (ALP), total cholesterol (TC), triglyceride (TG), high-density lipoprotein cholesterol (HDL-C), phosphorus (P), glucose (GLU), apolipoprotein A1 (ApoA1), Hemoglobin A1C (HbA1C), creatinine (CREA), urea, uric acid (UA), fibrinogen (FIB-C), platelet count (PLT), prothrombin time (PT), thrombin time (TT), monocyte percentage (Mon%), basophil count (Bas), eosinophil count (Eos), neutrophil count (Neu), platelet large cell ratio (P-LCR), mean corpuscular volume (MCV), mean corpuscular hemoglobin concentration (MCHC), lymphocyte count (Lym), red blood cell distribution width-standard deviation (RDW-SD), hematocrit (HCT), platelet distribution width (PDW), mean platelet volume (MPV) (Figure 2A).
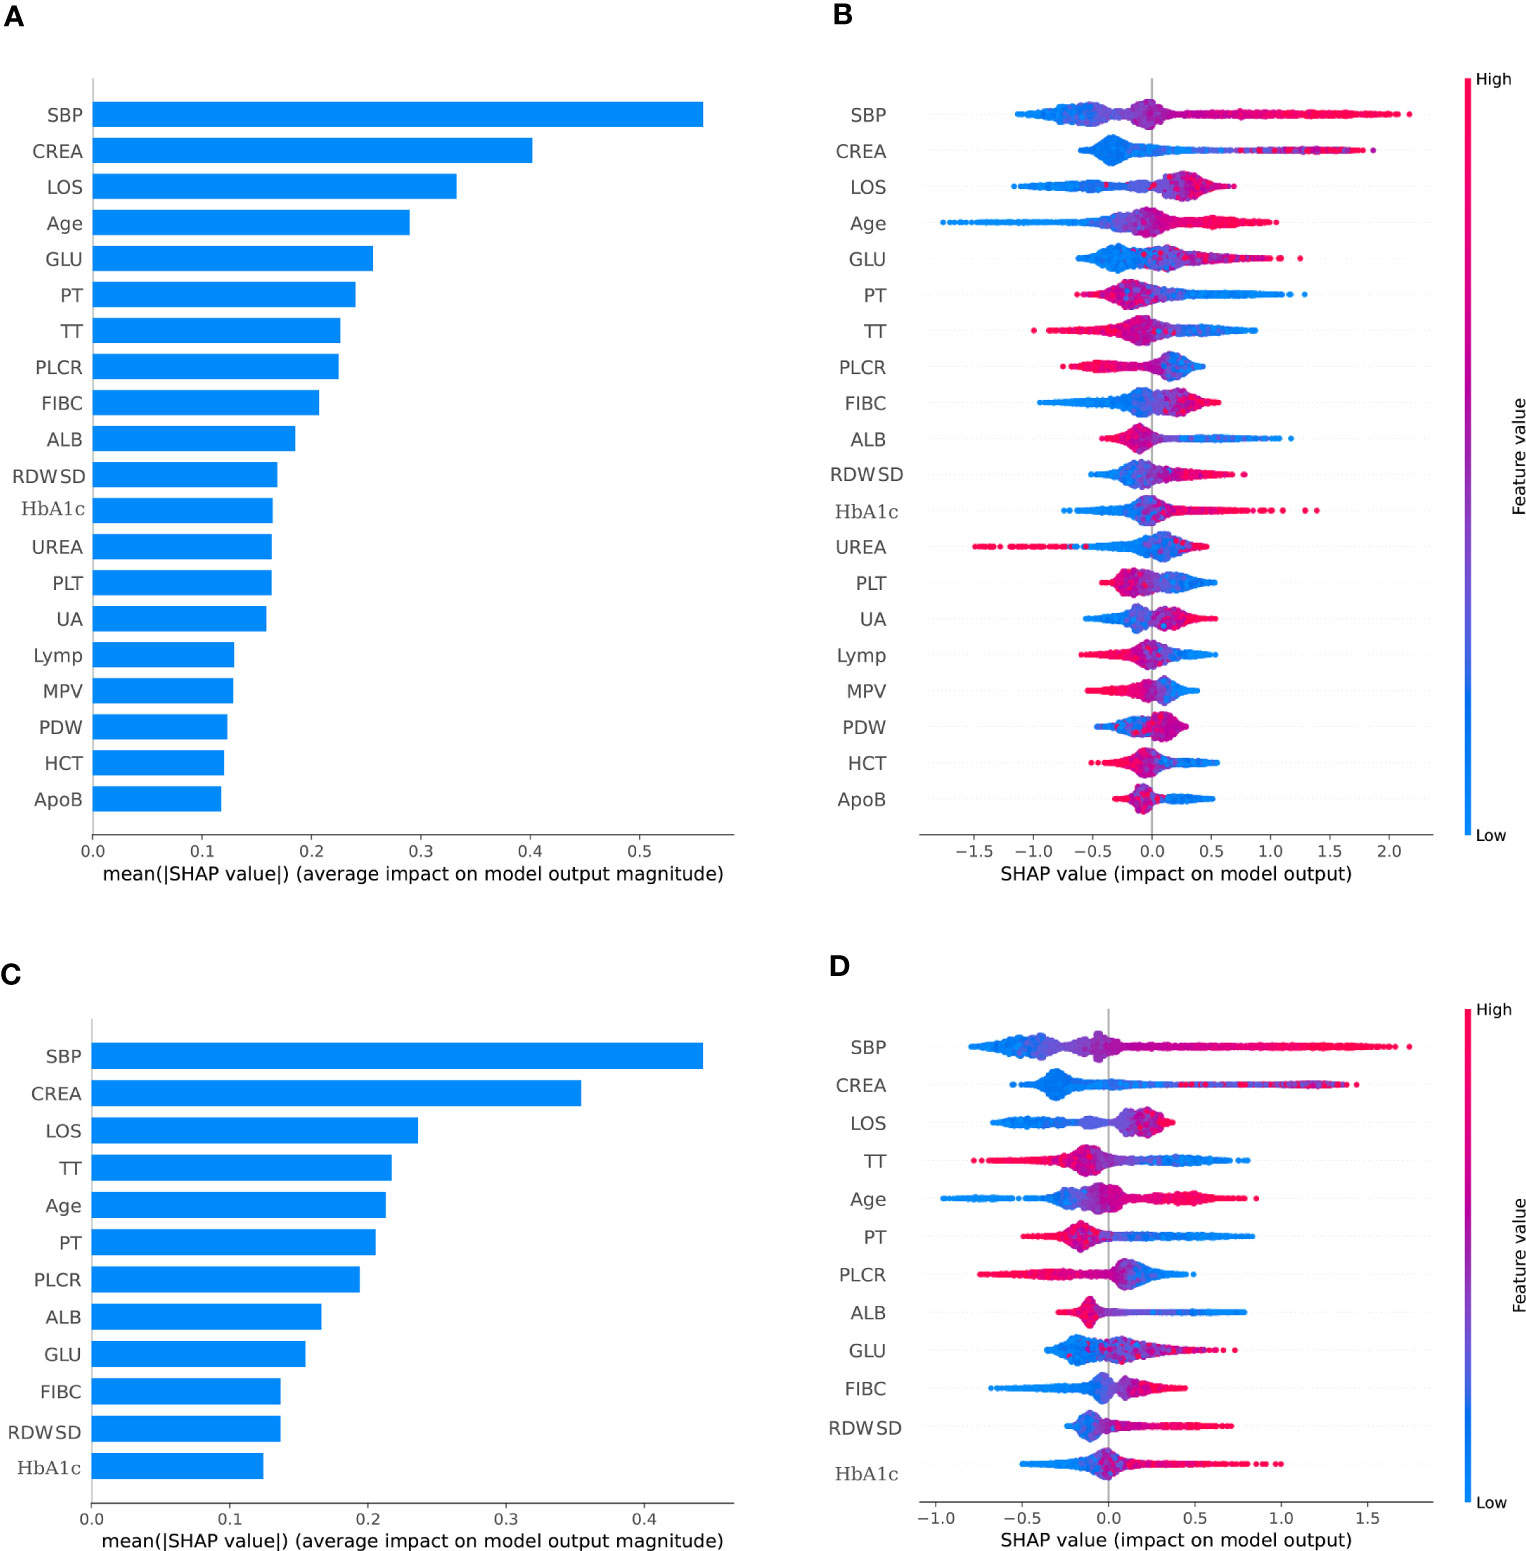
Figure 2 The SHAP summary plots for the CatBoost model. (A) depicts the most 38 effective characteristics on prediction (ranked from showing the highest to lowest importance). (B) depicts the distribution of the effects of 38 characteristics on the output of the model. (C) depicts the most 12 effective characteristics on prediction (ranked from showing the highest to lowest importance). (D) depicts the distribution of the effects of 12 characteristics on the output of the model.For numeric characteristics, the colors indicate the feature values: red for larger values and blue for smaller values. The thickness of the line is defined by the number of instances at a specific value, and it is made up of individual dots representing each DKD (e.g., most patients have a low risk of developing of DKD). A lower likelihood is indicated by a negative SHAP value (stretching to the left), while a higher probability is indicated by a positive SHAP value (reaching to the right). The gray dots reflect particular possible values for non-numeric characteristics such as main diagnosis, with select diagnoses considerably raising or decreasing the model’s output, while the majority of diagnoses have just a little influence on prediction.
Figure 3 lists the predictive performance of 15 ML models after 10-fold cross validation for internal training. Almost all classic ML methods capable of conducting classification analysis were considered. The top six models consisted of CatBoost Classifier, Light Gradient Boosting Machine, extreme gradient Boosting, Extra Trees Classifier, Gradient Boosting Classifier, Random Forest Classifier, with AUC over 0.8. As revealed by the results, the CatBoost model indicated the maximum performance in predicting DKD risk with AUC and accuracy of 0.840 and 0.755, respectively. As a result, the CatBoost model was selected and optimized in the following step.
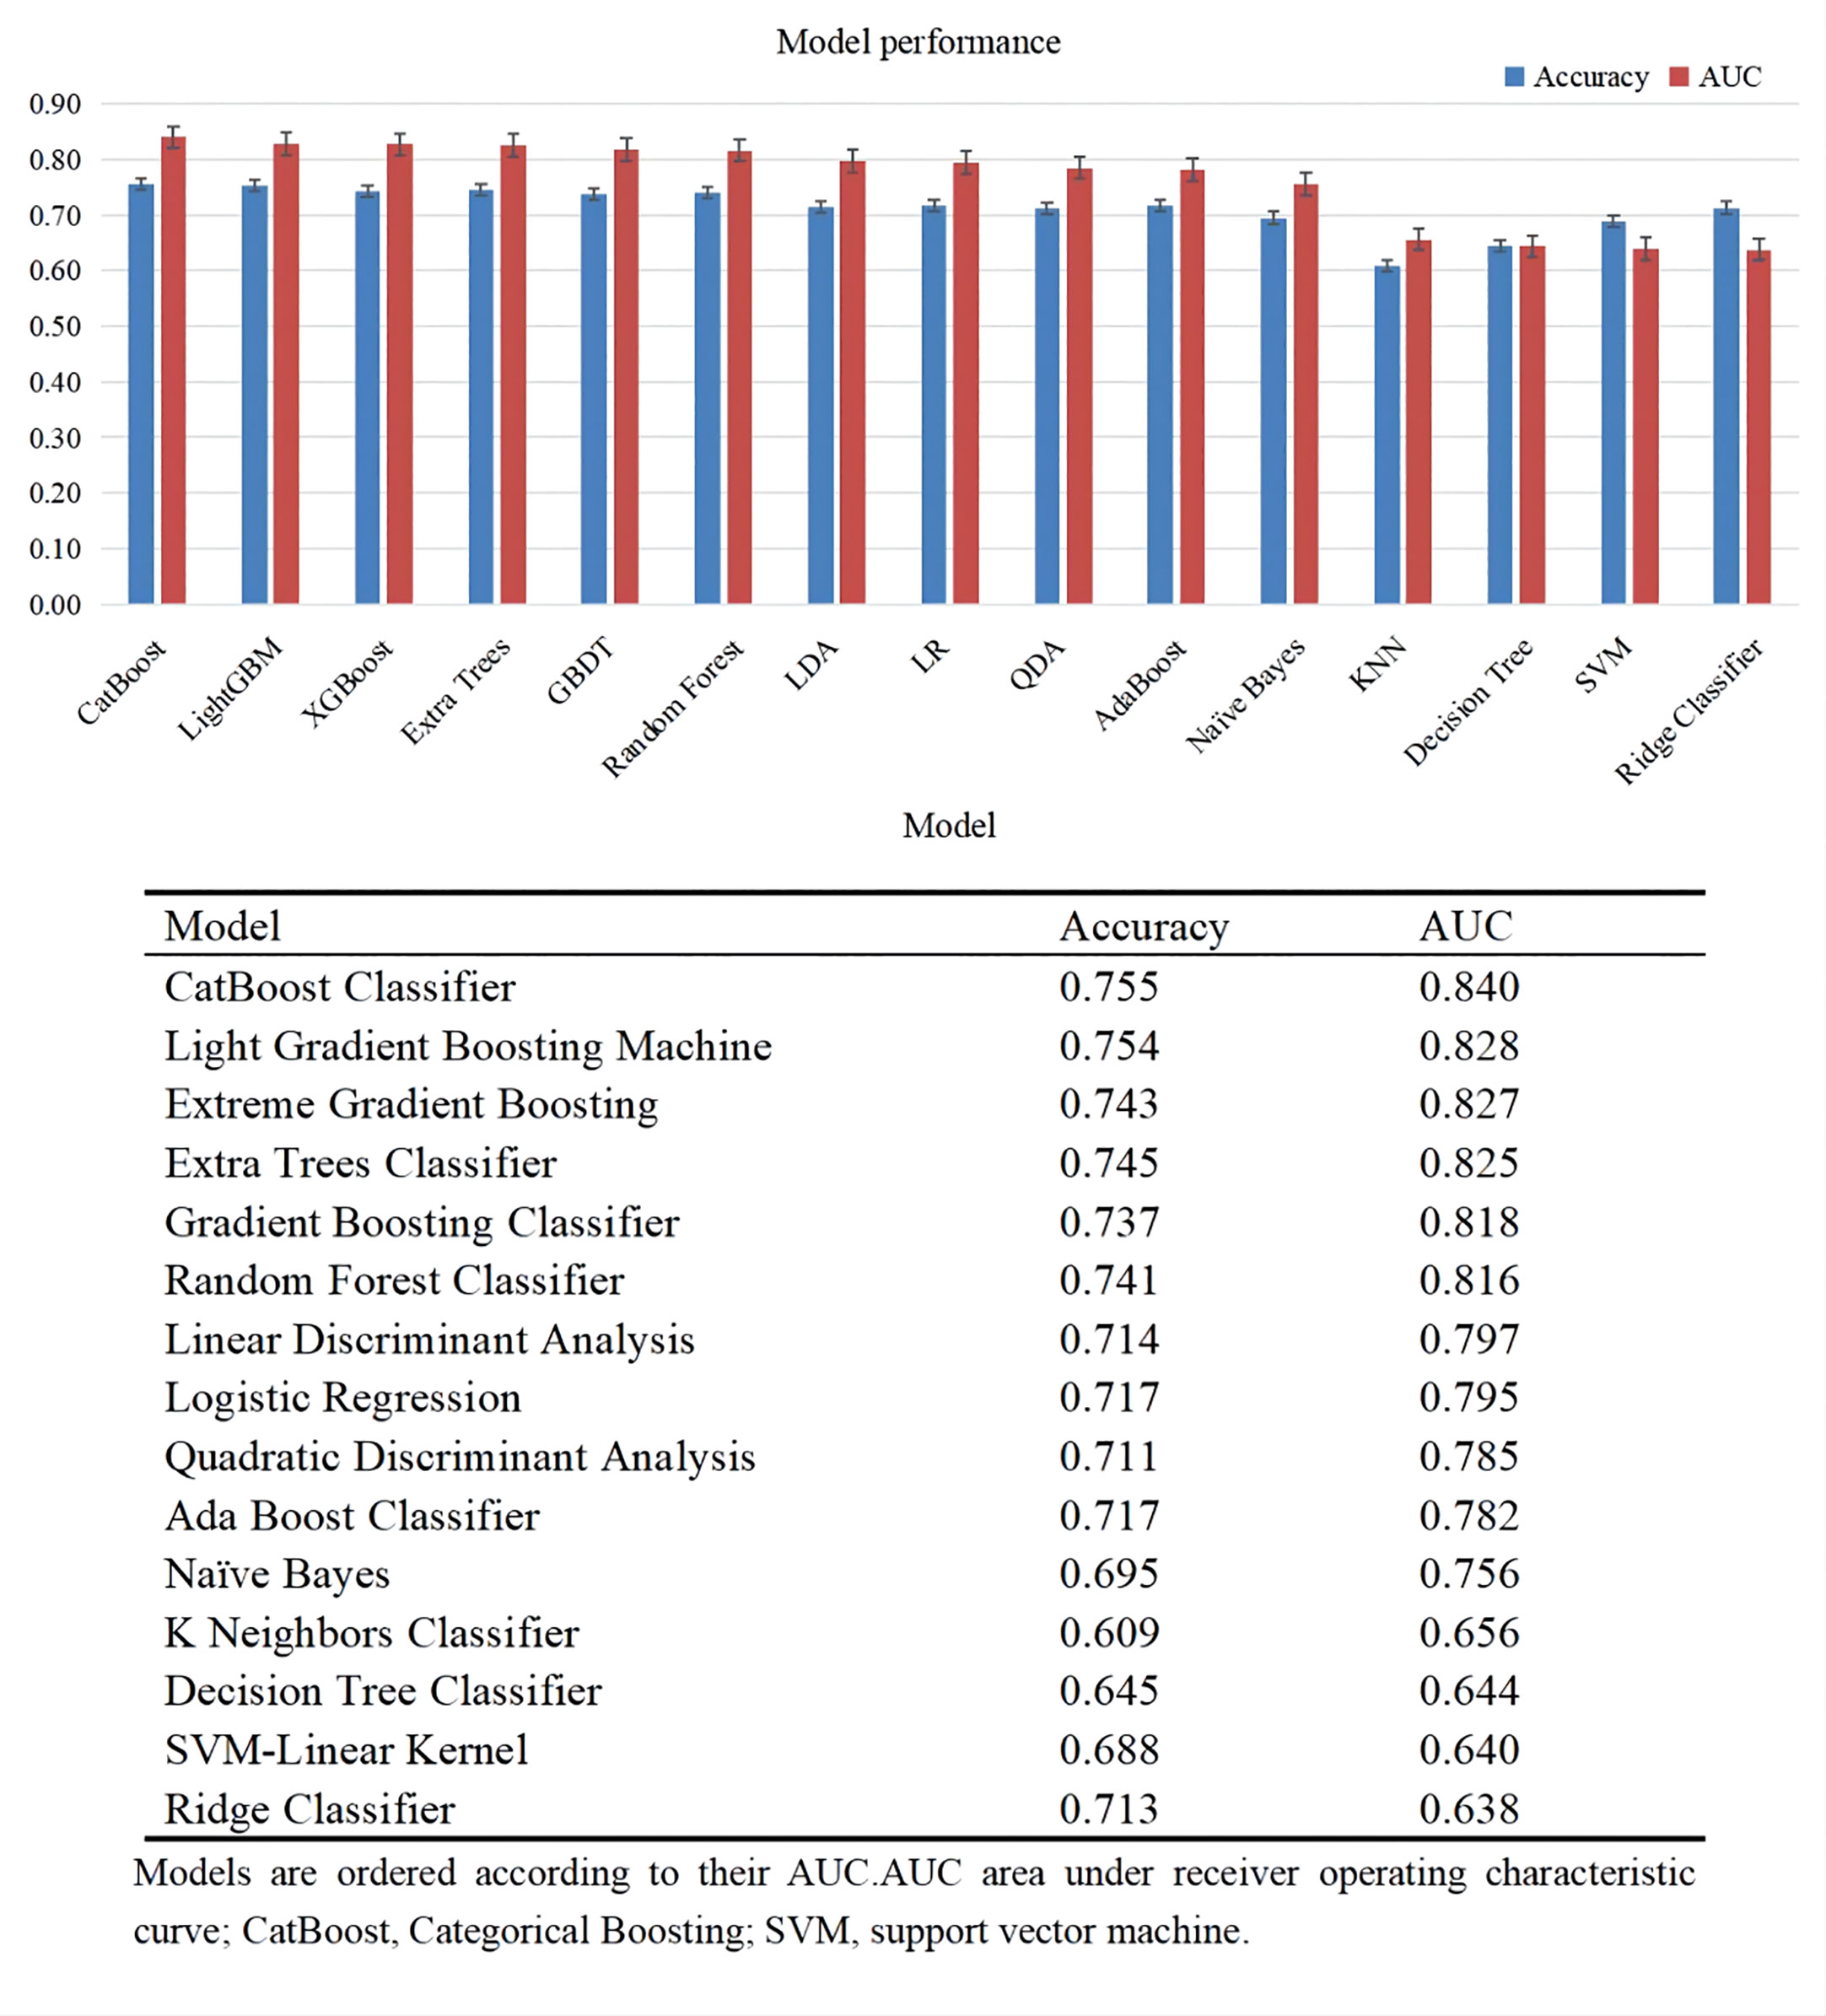
Figure 3 Performance of different models in internal validation.
Bayesian optimization algorithm with 10-fold cross validation to select the optimal hyperparameter configuration for the CatBoost model. The optimized CatBoost model exhibited the optimal and the most stable performance, with an AUC of 0.861, an accuracy of 0.777, a sensitivity of 0.755 (Figure 4). To increase the transparency and usability in real clinical setting of the prediction model, 12 top features were selected to construct the simpler prediction model based on the SHAP values and clinical availability. The top 12 most significant features consisted of SBP, CREA, LOS, TT, Age, PT, PLCR, ALB, GLU, FIBC, RDWSD, HbA1c (Figure 2C). As depicted in Figure 4, the simpler CatBoost model showed slight worse performance (AUC: 0.840). In this study, our CatBoost model was illustrated using the SHAP method by Lundberg and Lee (29). We employ the Shap technique to gain a global interpretation of our reserved cohort as well as individual patient interpretations. The SHAP summary plots for the top 38 clinical characteristics contributing to our ML model’s prediction of DKD development in our research are shown in Figures 2A, B. The SHAP summary plots for the top 12 clinical characteristics contributing to our ML model’s prediction of developing DKD in our research are shown in Figures 2C, D.
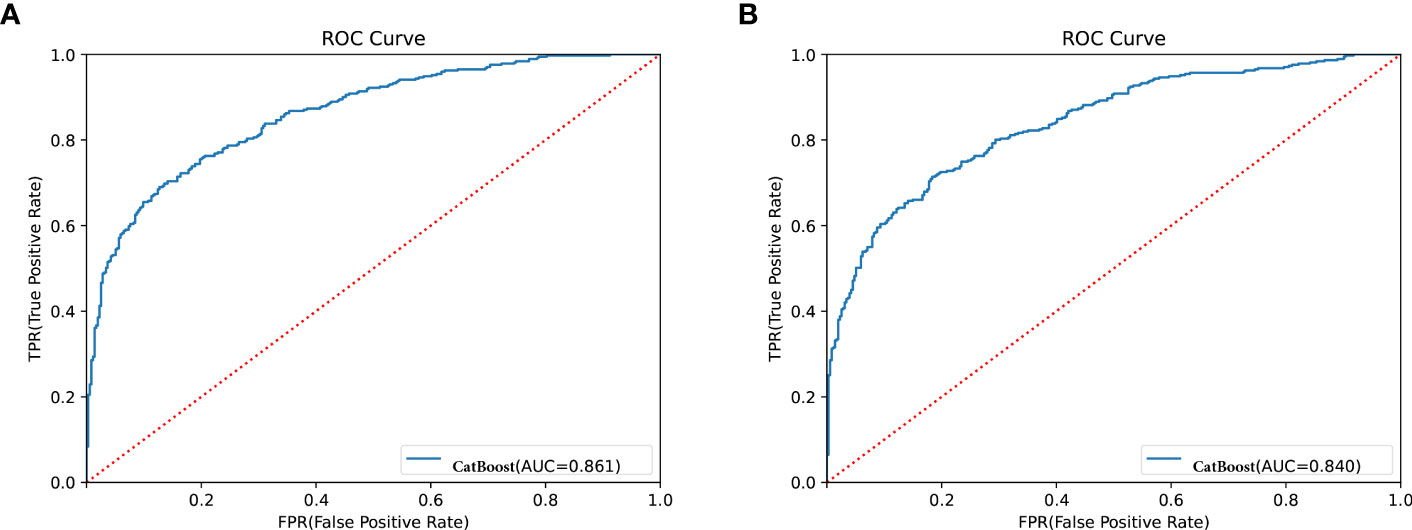
Figure 4 Receiver operator characteristic (ROC) curves for the CatBoost model. (A) Shows ROC for CatBoost with most 38 effective characteristics on prediction (ranked from most to least important). (B) Shows ROC for CatBoost with most 12 effective characteristics on prediction (ranked from most to least important).
Meanwhile, we show the SHAP explanation force diagram for two patients from the CatBoost model’s validation set (Figure 5). Figure 5A depicts a patient who is 48 years old. This patient’s anticipated risk of having DKD is significant, at 160 percent, in comparison with a baseline risk of 10%. (average prevalence of the validation cohort). Lower ALB of 29.5g/l, increased HbA1C of 15.1 percent, increased RDWSD of 52.7 mg/dl, prolonged LOS of 16 days, lower PLCR of 22.9 percent, and PT of 11.1 seconds were the characteristics found by the model for the prediction of a greater prevalence in this patient. The patient’s age of 48 years and TT of 18.8 seconds help to mitigate the increased risk. Figure 5B presents another T2DM patient. This patient’s anticipated risk of getting DKD was -146 percent, in comparison with a baseline risk of 10%. (average prevalence of the validation cohort). Normal SBP of 120mmHg, shorter LOS of 3 days, normal TT of 18.53 seconds, normal FIBC of 2.06, normal CREA of 42.6 umol/l, and normal RDWSD of 40.1 mg/dl were the parameters found using the model for the inhibition of DKD development. The lower risk was somewhat countered by a 12.8 percent HbA1C and a 22.9 percent PLCR.
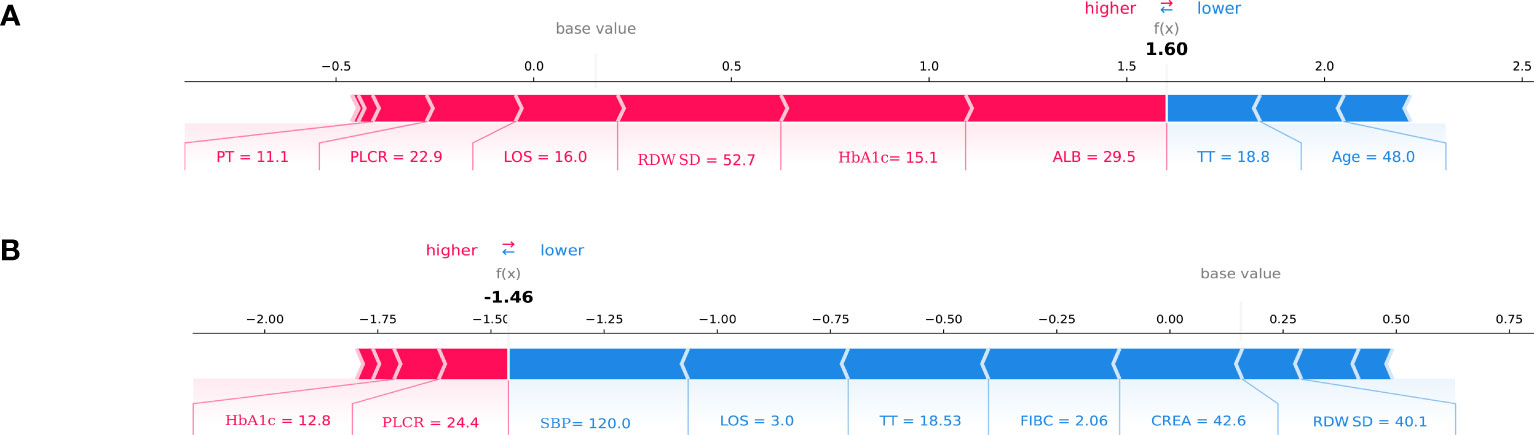
Figure 5 SHAP force plot for two patients of the held-out validation set. (A) patient at high risk of developing T2DKD; (B) patient at low risk of developing T2DKD. DKD, diabetic kidney disease; ALB, albumin; HbA1C, hemoglobin A1C; RDWSD, red blood cell distribution width-standard deviation; LOS, length of stay; PLCR, platelet large cell ratio; PT, prothrombin time; TT, thrombin time; SBP, Systolic blood pressure; FIBC,fibrinogen; CREA, creatine.
T2DKD has been recognized as the major cause of end-stage renal failure (4). Its diagnosis is largely dependent on kidney biopsy, which is generally used to distinguish diabetic kidney disease from other kidney diseases. However, biopsy cannot be employed for early screening and diagnosis of T2DKD, thus resulting in missed diagnosis and misdiagnosis. The development of chronic albuminuria followed by a steady drop in GFR (classical phenotype of DKD) (24) has been adopted to diagnose DKD. Several studies have indicated the trajectories of renal function (i.e., changes in GFR and albuminuria with time) that diverge from this traditional phenotype over the past decade (30). Three non-classical DKD phenotypes have been identified, each of which are defined by albuminuria regression, fast GFR decrease, or the lack of proteinuria or albuminuria, respectively (31). Albuminuria has limitations in the prediction of the progression of DKD. The determination of albuminuria values is affected by a wide variety of factors (e.g., fever, strenuous exercise within 24h, menstruation, hyperglycemia and hypertension). For atypical DKD, albuminuria is not sufficiently specific for the diagnosis of DKD, and some studies have indicated that 30% of patients with albuminuria had negative urine albumin within 10 years, and this phenomenon has been more significant in type 2 diabetes patients (32, 33). Urinary albumin excretion was influenced by many factors (34). It was recommended that the diagnosis of albuminuria requires three 24-h urine collections over a 3-month period, with at least two of the three results exceeding the threshold and not measured by urinary routine. Thus, the diagnosis of albuminuria as a basis for DKD should be based on a combination of multiple tests and long-term follow-up with glomerular filtration rate, and the cause of albuminuria should be excluded. Thus, the necessity of a simple and convenient clinical tool to assess DKD in daily clinical practice is highlighted.
Accordingly, a multi-center retrospective study was conducted to analyze clinical indicators of T2DM and T2DKD based on real-world data, and adopted machine learning algorithms to investigate potential clinical and Laboratory risk factors for DKD among patients with T2DM. In this study, 15 ML models for ancillary diagnosis of T2DKD were initially developed in accordance with the clinical data from seven hospitals in China, and the efficacy of the 15 ML models was assessed. Meanwhile, we tried the CatBoost algorithms, which are seldom employed in medical studies. Our retrospective study showed that CatBoost is very effective for ancillary diagnosis of DKD. The patients’ clinical and laboratory parameters were assessed with a CatBoost model, and key features correlated with an increased risk of DKD, (e.g., SBP, CREA, LOS, TT, Age, PT, PLCR, ALB, GLU, FIBC, RDWSD, as well as HbA1c) were identified.
In this study, the differential diagnosis model of T2DKD was built based on 15 machine learning algorithms, thus solving the nonlinear relationship between clinical features and diagnosis results. The CatBoost model with the highest diagnostic accuracy than the other 14 models, such as light gradient booting model, Extreme Gradient Boosting and so on, indicating a good predictive performance. With LASSO analysis, SBP, CREA, LOS, TT, Age, PT, PLCR, ALB, GLU, FIBC, RDWSD, HbA1c were the top 12 major influencing factors of the index importance, which achieved statistical significance in multivariate logistic regression analysis.
Existing studies suggested that SBP, CREA, Age, ALB, and GLU are factors for DKD. High SBP was reported with rapidly eGFR decline in the Atherosclerosis Risk in Communities (ARIC) study (35). As reported by Gross JL et al., hypertension increased the morbidity of patients hospitalized with kidney disease, and increased blood pressure was found as a major risk factor for DKD (36). Sasso FC et al. found in their study that arterial pressure is a relevant factor for the progression of DKD in patients with DM, accompanied by hypertension is highly susceptible to periglomerular microvascular changes leading to development of DKD (37). Viazzi F et al. investigated the clinical records of more than 30,000 patients with T2DM combined with hypertension over 4 years of follow-up. It was found that elevated long-term blood pressure variability predicted CKD in T2DM and (38). In the model built in this study, SBP was the primary predictor of DKD, consistent with previous studies mentioned above. As revealed by the analysis of the examination of renal function in patients with DKD hospitalized between 2015 and 2017, CREA achieved a high predictive value in the diagnosis of patients with DKD and could effectively assess the status of renal function in patients with DM (39). This is consistent with the findings of our study.
Radcliffe NJ et al. found a correlation between elevated age, early GFR decline and DKD progression, consistent with the results of the present study (40). Elley et al. demonstrated an independent relationship between higher age and increased risk of DKD progression (28). López-Revuelta K et al. also suggested that age could be a risk factor for DKD development, with a mean age of 58.3 years in terms of DKD (41). The above studies assessed changes in GFR in predominantly adult patients (28). Several cross-sectional studies have shown changes in P-LCR, PLT, and FIBC in DKD patients in comparison with normal, suggesting that the occurrence of DKD is closely related to abnormal platelet function (42–44).
The study by Zoppini G et al. followed more than 1,000 patients with DKD and found that HbA1c was a risk factor for the progression of DKD. A decrease in HbA1c significantly reduced the risk of complications in patients with DM. A decrease in Hb A1c from 10% to 9% was also found to have a greater impact on reducing the risk of complications than a decrease in Hb A1c from 7% to 6% (45). Yun KJ, et al. found HbA1c variability may affect the development and progression of DKD in their study (46). Visit-to-visit variability of HbA1c was an independent risk factor of microalbuminuria in association with oxidative stress among type 2 diabetes mellitus patients (47, 48). Meanwhile, observational studies have not consistently demonstrated a glucose threshold (49). In a referred population of established DKD, higher HbA1c was not associated with higher risk of ESKD or death (50). In addition, our study found that HbA1c also influences the progression of DKD, in agreement with most previous studies.In addition, our study found that LOS, TT, PT, RDWSD also influence of DKD progression, which has not been reported in the literature and deserves further study.
Previously, it was confirmed that metabolic syndrome(MetS) and associated components (abdominal obesity, elevated BG, elevated BP and lipid metabolic disorder) are strongly related to CKD and a decreased estimated glomerular filtration rate (eGFR) (51–55). Over the 4-year follow-up period, Peijia L et al. found that MetS recovery was associated with a reduced risk of rapid eGFR decline in middle-aged and older adults, while MetS occurrence was not related to rapid eGFR decline. Recovery from MetS appeared to protect against a rapid decline in eGFR (56).
Due to the strong interpretability, logistic regression model is widely used to explore the risk factors of diseases. However, problems such as under-fitting, data missing, poor overall performance of the model are likely to occur in the process of modeling. In terms of the machine learning algorithms, this study has been considered the first to assess the risk of patients with DKD using the CatBoost model. As revealed by this study, the CatBoost model achieved great performance in the prediction of DKD. By analyzing clinical indicators of 1768 cases of type 2 diabetes and 1856 cases of type 2 diabetic kidney disease, this study applied the CatBoost model to the risk assessment of type 2 diabetic kidney disease for the first time, and analyzed the weight relationship of influencing factors. A good classification results was obtained (AUC=0.840).
This study had several limitations. First, although general clinical data and laboratory indexes were collected more comprehensively, some of the indexes were not covered in the model due to the missing values of ≥25%, and the significance of the correlation with type 2 diabetic kidney disease should be investigated in more detail when the volume of data is expanded.However, it was found through our data that some clinical parameters (cystatin-C, total 24-hour urine protein, duration of disease, etc.) are missing in many patients and many indicators cannot be generalized in primary care. Second, We found in the construction of the model that SBP was included as an important parameter in the prediction model, considering hypertension as an important confounding factor that is best analyzed in a stratified manner. Third, Due to data limitations, we were unable to select patients with a first diagnosis of T2DKD to model.Fourth, a cross-sectional study was conducted, and the results should be validated through a prospective study.
To sum up, this retrospective study suggested that CatBoost could be highly effective in the early ancillary diagnosis of DKD. The importance of the model’s correlation to type 2 diabetic kidney disease should be investigated in depth after the data volume is expanded. In subsequent research, a greater amount of data and more machine learning models will be adopted for modeling research, as an attempt to build a better risk assessment model.
The raw data supporting the conclusions of this article will be made available by the authors, without undue reservation.
The studies involving human participants were reviewed and approved by the Ethics Committee of the Chongqing Medical University. Written informed consent for participation was not required for this study in accordance with the national legislation and the institutional requirements.
XL, TZ, MD and HW conceived and designed the study. All authors contributed to the acquisition of data or analysis and interpretation of data. XL drafted the manuscript. MD drew the figures and tables.HH, YZ, TX, WN, and BZ revised the manuscript critically for essential intellectual content. All authors read and approved the final version to be published.
This work was supported by the National Natural Science Foundation of China under Grant 72101040 and Intelligent Medicine Research Project of Chongqing Medical University under Grant ZHYXQNRC202201.
We acknowledge Yidu Cloud Technology Inc.’s participation in this project.
The authors declare that the research was conducted in the absence of any commercial or financial relationships that could be construed as a potential conflict of interest.
All claims expressed in this article are solely those of the authors and do not necessarily represent those of their affiliated organizations, or those of the publisher, the editors and the reviewers. Any product that may be evaluated in this article, or claim that may be made by its manufacturer, is not guaranteed or endorsed by the publisher.
The Supplementary Material for this article can be found online at: https://www.frontiersin.org/articles/10.3389/fendo.2023.1184190/full#supplementary-material
1. Saeedi P, Petersohn I, Salpea P, Malanda B, Karuranga S, Unwin N, et al. Global and regional diabetes prevalence estimates for 2019 and projections for 2030 and 2045: results from the international diabetes federation diabetes atlas, 9th edition. Diabetes Res Clin Pract (2019) 157:107843. doi: 10.1016/j.diabres.2019.107843
2. An Y, Zhang P, Wang J, Gong Q, Gregg EW, Yang W, et al. Cardiovascular and all-cause mortality over a 23-year period among Chinese with newly diagnosed diabetes in the da Qing IGT and diabetes study. Diabetes Care (2015) 38(7):1365–71. doi: 10.2337/dc14-2498
3. Hu H, Sawhney M, Shi L, Duan S, Yu Y, Wu Z, et al. A systematic review of the direct economic burden of type 2 diabetes in china. Diabetes therapy: research Treat Educ Diabetes Related Disord (2015) 6(1):7–16. doi: 10.1007/s13300-015-0096-0
4. Cho NH, Shaw JE, Karuranga S, Huang Y, da Rocha Fernandes JD, Ohlrogge AW, et al. IDF diabetes atlas: global estimates of diabetes prevalence for 2017 and projections for 2045. Diabetes Res Clin Pract (2018) 138:271–81. doi: 10.1016/j.diabres.2021.109119
5. Zhang L, Wang F, Wang L, Huang Y, da Rocha Fernandes JD, Ohlrogge AW, et al. Prevalence of chronic kidney disease in China: a cross-sectional survey. Lancet (London England) (2012) 379(9818):815–22. doi: 10.1016/S0140-6736(12)60033-6
6. Colhoun HM, Marcovecchio ML. Biomarkers of diabetic kidney disease. Diabetologia (2018) 61(5):996–1011. doi: 10.1007/s00125-018-4567-5
7. de Galan BE, Perkovic V, Ninomiya T, Pillai A, Patel A, Cass A, et al. Lowering blood pressure reduces renal events in type 2 diabetes. J Am Soc Nephrol (2009) 20(4):883–92. doi: 10.1681/ASN.2008070667
8. de Zeeuw D, Remuzzi G, Parving HH, Keane WF, Zhang Z, Shahinfar S, et al. Proteinuria, a target for renoprotection in patients with type 2 diabetic nephropathy: lessons from RENAAL. Kidney Int (2004) 65(6):2309–20. doi: 10.1111/j.1523-1755.2004.00653.x
9. Araki S, Haneda M, Koya D, Hidaka H, Sugimoto T, Isono M, et al. Reduction in microalbuminuria as an integrated indicator for renal and cardiovascular risk reduction in patients with type 2 diabetes. Diabetes (2007) 56(6):1727–30. doi: 10.2337/db06-1646
10. Yokoyama H, Araki S, Haneda M, Matsushima M, Kawai K, Hirao K, et al. Chronic kidney disease categories and renal-cardiovascular outcomes in type 2 diabetes without prevalent cardiovascular disease: a prospective cohort study (JDDM25). Diabetologia (2012) 55(7):1911–8. doi: 10.1007/s00125-012-2536-y
11. Yokoyama H, Araki S, Honjo J, Matsushima M, Kawai K, Hirao K, et al. Association between remission of macroalbuminuria and preservation of renal function in patients with type 2 diabetes with overt proteinuria. Diabetes Care (2013) 36(10):3227–33. doi: 10.2337/dc13-0281
12. Mogensen CE. Microalbuminuria as a predictor of clinical diabetic nephropathy. Kidney Int (1987) 31(2):673–89. doi: 10.1038/ki.1987.50
13. Lan K, Wang DT, Fong S, Liu LS, Wong KKL, Dey N. A survey of data mining and deep learning in bioinformatics. J Med Syst (2018) 42(8):139. doi: 10.1007/s10916-018-1003-9
14. Allen A, Iqbal Z, Green-Saxena A, Hurtado M, Hoffman J, Mao Q, et al. Prediction of diabetic kidney disease with machine learning algorithms, upon the initial diagnosis of type 2 diabetes mellitus. BMJ Open Diabetes Res Care (2022) 10(1):e002560. doi: 10.1136/bmjdrc-2021-002560
15. David SK, Rafiullah M, Siddiqui K. Comparison of different machine learning techniques to predict diabetic kidney disease. J Healthcare Eng (2022) 2022:7378307. doi: 10.1155/2022/7378307
16. Makino M, Yoshimoto R, Ono M, Itoko T, Katsuki T, Koseki A, et al. Artificial intelligence predicts the progression of diabetic kidney disease using big data machine learning. Sci Rep (2019) 9(1):11862. doi: 10.1038/s41598-019-48263-5
17. Maniruzzaman M, Rahman MJ, Ahammed B, Abedin MM. Classification and prediction of diabetes disease using machine learning paradigm. Health Inf Sci Syst (2022) 8(1):7. doi: 10.1007/s13755-019-0095-z
18. Chan L, Nadkarni GN, Fleming F, McCullough JR, Connolly P, Mosoyan G, et al. Derivation and validation of a machine learning risk score using biomarker and electronic patient data to predict progression of diabetic kidney disease. Diabetologia Vol (2021) 64(7):1504–15. doi: 10.1007/s00125-021-05444-0
19. Viana LV, Gross JL, Camargo JL, Zelmanovitz T, da Costa Rocha EP, Azevedo MJ. Prediction of cardiovascular events, diabetic nephropathy, and mortality by albumin concentration in a spot urine sample in patients with type 2 diabetes. J Diabetes its Complications Vol (2012) 26(5):407–12. doi: 10.1016/j.jdiacomp.2012.04.014
20. Park SB, Kim SS, Kim IJ, Nam YJ, Ahn KH, Kim JH, et al. Variability in glycated albumin levels predicts the progression of diabetic nephropathy. J Diabetes its Complications Vol (2017) 31(6):1041–6. doi: 10.1016/j.jdiacomp.2017.01.014
21. Xu Q, Peng Y, Tan J, Zhao W, Yang M, Tian J. Prediction of atrial fibrillation in hospitalized elderly patients with coronary heart disease and type 2 diabetes mellitus using machine learning: a multicenter retrospective study. Front Public Health (2022) 10:842104. doi: 10.3389/fpubh.2022.842104
22. Tan J, Tang X, He Y, Xu X, Qiu D, Chen J, et al. In-patient expenditure between 2012 and 2020 concerning patients with liver cirrhosis in chongqing: a hospital-based multicenter retrospective study. Front Public Health (2022) 10:780704. doi: 10.3389/fpubh.2022.780704
23. Xu X, Wang H, Zhao W, Wang Y, Wang J, Qin B. Recompensation factors for patients with decompensated cirrhosis: a multicentre retrospective case-control study. BMJ Open (2021) 11(6):e043083. doi: 10.1136/bmjopen-2020-043083
24. National Kidney Foundation. KDOQI clinical practice guideline for diabetes and CKD: 2012 update. Am J Kidney Dis (2012) 60(5):850–86. doi: 10.1053/j.ajkd.2012.07.005
25. KDOQI. KDOQI clinical practice guidelines and clinical practice recommendations for diabetes and chronic kidney disease. Am J Kidney Dis (2007) 492 Suppl 2:S12–154. doi: 10.1053/j.ajkd.2006.12.005
26. Song X, Waitman LR, Yu AS, Robbins DC, Hu Y, Liu M. lLongitudinal risk prediction of chronic kidney disease in diabetic patients using a temporal-enhanced gradient boosting machine: retrospective cohort study. JMIR Med Inf (2020) 8(1):e15510. doi: 10.2196/15510
27. Macisaac RJ, Ekinci EI, Jerums G. Markers of and risk factors for the development and progression of diabetic kidney disease. Am J Kidney Dis (2014) 63(2 Suppl 2):S39–62. doi: 10.1053/j.ajkd.2013.10.048
28. Elley CR, Robinson T, Moyes SA, Kenealy T, Collins J, Robinson E, et al. Derivation and validation of a renal risk score for people with type 2 diabetes. Diabetes Care vol (2013) 36(10):3113–20. doi: 10.2337/dc13-0190
29. Lundberg SM, Lee SI. A unified approach to interpreting model predictions. Proc Adv Neural Inf Process Syst (2017), 4768–77.
30. Afkarian M, Zelnick LR, Hall YN, Heagerty PJ, Tuttle K, Weiss NS, et al. Clinical manifestations of kidney disease among US adults with diabetes, 1988-2014. JAMA vol (2016) 316(6):602–10. doi: 10.1001/jama.2016.10924
31. Oshima M, Shimizu M, Yamanouchi M, Toyama T, Hara A, Furuichi K, et al. Trajectories of kidney function in diabetes: a clinicopathological update nature reviews. Nephrol vol (2021) 17(11):740–50. doi: 10.1038/s41581-021-00462-y
32. American Diabetes association. 16. diabetes advocacy: standards of medical care in diabetes-2019. Diabetes Care (2019) 42(Suppl 1):S182–3. doi: 10.2337/dc19-S016
33. Ekinci EI, Jerums G, Skene A, Crammer P, Power D, Cheong KY, et al. Renal structure in normoalbuminuric and albuminuric patients with type 2 diabetes and impaired renal function. Diabetes Care (2013) 36(11):3620–6. doi: 10.2337/dc12-2572
34. Tuttle KR, Bakris GL, Bilous RW, Chiang JL, de Boer IH, Goldstein-Fuchs J, et al. Diabetic kidney disease: a report from an ADA consensus conference. Am J Kidney Dis (2014) 64(4):510–33. doi: 10.1053/j.ajkd.2014.08.001
35. Warren B, Rebholz CM, Sang Y, Lee AK, Coresh J, Selvin E, et al. Diabetes and trajectories of estimated glomerular filtration rate: a prospective cohort analysis of the atherosclerosis risk in communities study. Diabetes Care vol (2018) 41:8. doi: 10.2337/dc18-0277
36. Gross JL, de Azevedo MJ, Silveiro SP, Jorge L, Canani LH, Caramori ML, Zelmanovitz T. Diabetic nephropathy: diagnosis, prevention, and treatment. Diabetes Care vol (2005) 28:1. doi: 10.2337/diacare.28.1.164
37. Sasso FC, De Nicola L, Carbonara O, Nasti R, Minutolo R, Salvatore T, et al. Cardiovascular risk factors and disease management in type 2 diabetic patients with diabetic nephropathy. Diabetes Care (2006) 29(3):498–503. doi: 10.2337/diacare.29.03.06.dc05-1776
38. Viazzi F, Bonino B, Mirijello A, Fioretto P, Giorda C, Ceriello A, et al. Long-term blood pressure variability and development of chronic kidney disease in type 2 diabetes. J hypertension (2019) 37(4):805–13. doi: 10.1097/HJH.0000000000001950
39. Rigalleau V, Lasseur C, Perlemoine C, Barthe N, Raffaitin C, Chauveau P, et al. Cockcroft-gault formula is biased by body weight in diabetic patients with renal impairment. Metabolism: Clin Exp (2006) 55(1):108–12. doi: 10.1016/j.metabol.2005.07.014
40. Radcliffe NJ, Seah JM, Clarke M, MacIsaac RJ, Jerums G, Ekinci EI. Clinical predictive factors in diabetic kidney disease progression. J Diabetes Invest (2017) 8(1):6–18. doi: 10.1111/jdi.12533
41. López-Revuelta K, Galdo PP, Stanescu R, Parejo L, Guerrero C, Pérez-Fernández E. Silent diabetic nephropathy. World J Nephrol (2014) 3(1):6–15. doi: 10.5527/wjn.v3.i1.6
42. Doshi SM, Friedman AN. Diagnosis and management of type 2 diabetic kidney disease. Clin J Am Soc Nephrol (2017) 12(8):1366–73. doi: 10.2215/CJN.11111016
43. American Diabetes Association. Standards of medical care in diabetes-2016 abridged for primary care providers. Clin Diabetes (2016) 34(1):3–21. doi: 10.2337/diaclin.34.1.3
44. Yu M, Xie R, Zhang Y, Liang H, Hou L, Yu C, et al. Phosphatidylserine on microparticles and associated cells contributes to the hypercoagulable state in diabetic kidney disease. Nephrology dialysis Transplant (2018) 33(12):2115–27. doi: 10.1093/ndt/gfy027
45. Zoppini G, Targher G, Chonchol M, Ortalda V, Negri C, Stoico V, et al. Predictors of estimated GFR decline in patients with type 2 diabetes and preserved kidney function. Clin J Am Soc Nephrol (2012) 7(3):401–8. doi: 10.2215/CJN.07650711
46. Yun KJ, Kim HJ, Kim MK, Kwon HS, Baek KH, Roh YJ, et al. Risk factors for the development and progression of diabetic kidney disease in patients with type 2 diabetes mellitus and advanced diabetic retinopathy. Diabetes Metab J (2016) 40(6):473–81. doi: 10.4093/dmj.2016.40.6.473
47. Yan Y, Kondo N, Oniki K, Watanabe H, Imafuku T, Sakamoto Y, et al. Predictive ability of visit-to-Visit variability of HbA1c measurements for the development of diabetic kidney disease: a retrospective longitudinal observational study. J Diabetes Res (2022) 2022:6934188. doi: 10.1155/2022/6934188
48. Ceriello A, De Cosmo S, Rossi MC, Lucisano G, Genovese S, Pontremoli R, et al. Variability in HbA1c, blood pressure, lipid parameters and serum uric acid, and risk of development of chronic kidney disease in type 2 diabetes. Diabetes Obes Metab (2017) 19(11):1570–8. doi: 10.1111/dom.12976
49. MacIsaac RJ, Jerums G, Ekinci EI. Effects of glycaemic management on diabetic kidney disease. World J Diabetes (2017) 8(5):172–86. doi: 10.4239/wjd.v8.i5.172
50. Limkunakul C, de Boer IH, Kestenbaum BR, Himmelfarb J, Ikizler TA, Robinson-Cohen C. The association of glycated hemoglobin with mortality and ESKD among persons with diabetes and chronic kidney disease. J Diabetes its Complications (2019) 33(4):296–301. doi: 10.1016/j.jdiacomp.2018.12.010
51. Xie K, Bao L, Jiang X, Ye Z, Bing J, Dong Y, et al. The association of metabolic syndrome components and chronic kidney disease in patients with hypertension. Lipids Health Dis (2019) 18(1):229. doi: 10.1186/s12944-019-1121-5
52. Viazzi F, Piscitelli P, Giorda C, Ceriello A, Genovese S, Russo G, et al. Metabolic syndrome, serum uric acid and renal risk in patients with T2D. PloS One (2017) 12(4):e0176058. doi: 10.1371/journal.pone.0176058
53. Chen J, Kong X, Jia X, Li W, Wang Z, Cui M, et al. Association between metabolic syndrome and chronic kidney disease in a Chinese urban population. Clinica chimica acta; Int J Clin Chem (2017) 470:103–8. doi: 10.1016/j.cca.2017.05.012
54. Thomas G, Sehgal AR, Kashyap SR, Srinivas TR, Kirwan JP, Navaneethan SD. Metabolic syndrome and kidney disease: a systematic review and meta-analysis. Clin J Am Soc Nephrol (2011) 6(10):2364–73. doi: 10.2215/CJN.02180311
55. Chang IH, Han JH, Myung SC, Kwak KW, Kim TH, Park SW, et al. Association between metabolic syndrome and chronic kidney disease in the Korean population. Nephrol (Carlton Vic.) (2009) 14(3):321–6. doi: 10.1111/j.1440-1797.2009.01091.x
56. Liu P, Tang L, Fang J, Chen C, Liu X. Association between recovery/occurrence of metabolic syndrome and rapid estimated glomerular filtration rate decline in middle-aged and older populations: evidence from the China health and retirement longitudinal study. BMJ Open (2022) 12(10):e059504. doi: 10.1136/bmjopen-2021-059504
Keywords: type 2 diabetes mellitus, diabetic kidney disease, machine learning, prediction, CatBoost model
Citation: Liu Xz, Duan Mj, Huang Hd, Zhang Y, Xiang Ty, Niu Wc, Zhou B, Wang Hl and Zhang Tt (2023) Predicting diabetic kidney disease for type 2 diabetes mellitus by machine learning in the real world: a multicenter retrospective study. Front. Endocrinol. 14:1184190. doi: 10.3389/fendo.2023.1184190
Received: 11 March 2023; Accepted: 09 June 2023;
Published: 04 July 2023.
Edited by:
Prem P. Kushwaha, Case Western Reserve University, United StatesReviewed by:
Raushan Kumar, Allahabad University, IndiaCopyright © 2023 Liu, Duan, Huang, Zhang, Xiang, Niu, Zhou, Wang and Zhang. This is an open-access article distributed under the terms of the Creative Commons Attribution License (CC BY). The use, distribution or reproduction in other forums is permitted, provided the original author(s) and the copyright owner(s) are credited and that the original publication in this journal is cited, in accordance with accepted academic practice. No use, distribution or reproduction is permitted which does not comply with these terms.
*Correspondence: Hao lin Wang, aGFvbGlud2FuZ0BjcW11LmVkdS5jbg==; Ting ting Zhang, emhhbmd0aW5nODM1NTY2QDEyNi5jb20=
†These authors have contributed equally to this work
Disclaimer: All claims expressed in this article are solely those of the authors and do not necessarily represent those of their affiliated organizations, or those of the publisher, the editors and the reviewers. Any product that may be evaluated in this article or claim that may be made by its manufacturer is not guaranteed or endorsed by the publisher.
Research integrity at Frontiers
Learn more about the work of our research integrity team to safeguard the quality of each article we publish.