
94% of researchers rate our articles as excellent or good
Learn more about the work of our research integrity team to safeguard the quality of each article we publish.
Find out more
ORIGINAL RESEARCH article
Front. Endocrinol. , 02 June 2023
Sec. Obesity
Volume 14 - 2023 | https://doi.org/10.3389/fendo.2023.1183666
 Chao Yu1,2,3
 Xinlei Zhou2,3
 Tao Wang1,2,3
 Lingjuan Zhu1,2,3*
 Wei Zhou1,2,3*
 Huihui Bao1,2,3
 Xiaoshu Cheng1,2,3
Background: Few studies have examined the relationship between fatty liver index (FLI) and hyperuricemia (HUA). This study explores the relationship between FLI and HUA in hypertensive patients.
Methods: A total of 13,716 hypertensive subjects were included in the current study. FLI, a simple index calculated from triglycerides (TG), waist circumference (WC), body mass index (BMI), and γ -glutamyltransferase (GGT), was used as a useful predictor of nonalcoholic fatty liver disease (NAFLD) distribution. HUA was defined as serum uric acid ≥ 360 μmol/L for females and ≥ 420 μmol/L for males.
Results: The mean value of total FLI was 31.8 ± 25.1. Multiple logistic analyses revealed a significant positive correlation between FLI and HUA (OR, 1.78; 95% CI: 1.69–1.87). A subgroup analysis demonstrated that the correlation between FLI (< 30 vs. ≥ 30) and HUA was significant in both sexes (P for interaction = 0.006). Further analyses stratified by sex indicated a positive correlation between FLI and HUA prevalence among male and female subjects. However, the correlation between FLI and HUA was stronger in female subjects than in males (male: OR, 1.70; 95% CI: 1.58–1.83; female: 1.85; 95% CI: 1.73–1.98).
Conclusion: This study demonstrates a positive correlation between FLI and HUA in hypertensive adults, but stronger in females than males.
● Fatty liver index (FLI) has a positive correlation with hyperuricemia (HUA) in hypertensive adults, but stronger in females than males.
Hyperuricemia (HUA) is a metabolic disease caused by abnormal purine metabolism resulting in overproduction of uric acid (primarily in liver) and its decreased renal and intestinal excretion (1). HUA is the main risk factor for gout, a very painful long-term systemic inflammatory arthritis caused by the deposition of monosodium urate (MSU) crystal (2, 3). A systematic review and meta-analysis revealed a pooled HUA prevalence of 13.3% between 2000 and 2014 in mainland China, with a higher prevalence among males than females (4). Moreover, numerous studies have discovered that HUA prevalence is typically higher in high-income countries than in economically developing countries (4–8). Additionally, gout and HUA prevalence has increased with age, posing a huge burden for aging countries (9). Gout and HUA can cause $116 million in socio-economic losses yearly in the United States (10). Previous studies have stated association of HUA with hypertension (11, 12), adverse cardiovascular outcomes (13), stroke (14), metabolic syndrome (15), and chronic kidney disease (16). Particularly, HUA has been correlated with the severity of hypertension (14). Therefore, the study of HUA in hypertensive populations can help to optimize the risk stratification of HUA and provide important clinical guidance for the future personalized care of hypertensive individuals. Recent studies suggest that non-alcoholic fatty liver disease (NAFLD) may be an independent risk factor for HUA and is associated with its occurrence and development (17). Additionally, HUA occurrence and development may vary according to gender (18, 19).
Fat accumulation in the liver due to metabolic disorders causes NAFLD (20). It has also been linked to hypertension, insulin resistance, and metabolic syndrome (19). Previous studies have reported that NAFLD patients have significantly higher Serum urate levels than normal subjects. NAFLD presence also significantly increases HUA risk (17, 21) due to the increased xanthine oxidase (XO) expression or activity in NAFLD patients, which catalyzes uric acid production (17). Additionally, there is a sex difference in NAFLD (22), with females having a worse prognosis for HUA than males (19). Thus, sex may serve as a mediator in the association between NAFLD and HUA (21, 23, 24).
Abdominal ultrasonography and liver biopsies are the gold standard for diagnosing NAFLD, but they are an invasive procedure with elevated risks and economic costs that preclude large-scale epidemiological studies. Therefore, Bedogni et al. (25) developed a compound index that includes triglycerides (TG), waist circumference (WC), body mass index (BMI), and γ-glutamyltransferase (GGT) to evaluate NAFLD, namely fatty liver index (FLI). FLI has an overall accuracy of 84% in detecting NAFLD (26); thus, FLI can be used as an alternative predictor of NAFLD. Moreover, FLI has outstanding application value in large-scale epidemiological studies. FLI has been used in numerous scientific investigations with large sample sizes (27–29). A significant association has been reported between FLI and the risk of HUA (30). However, the study included only 1,284 subjects, the sample was small, and several limitations like the study is cross-sectional in nature with possible Neyman bias, type II error, and urate-lowering therapy dietary habits not adjusted etc.
This study aims to address the above knowledge gap and explore the correlation between FLI and HUA in hypertensive patients using China H-type Hypertension Registry Study data. This study also examines sex difference in this association and further explores potential modifiers between them.
The data from the China H-type Hypertension Registry Study (registration number: ChiCTR1800017274) were analyzed in this study. It was an ongoing observational study of the real world in Wuyuan, China, from March 2018 to August 2018. The study design and methods have been described in detail previously (31, 32). Hypertension patients over 18 years old were included. Participants who could not sign informed consent due to psychological or nervous system injury and could not have long-term follow-up according to the study protocol were excluded. The study was approved by the ethics committee of the Institute of Biomedicine, Anhui Medical University (NO. CH1059), and the Second Affiliated Hospital of Nanchang University (NO. 2018019). Additionally, an informed consent form was signed by each participant.
A total of 14,234 hypertensive subjects met the inclusion and exclusion criteria. Participants who lost FLI data (n = 12), Serum urate data (n = 0), or using lipid-lowering medications (n = 506) were excluded from our analysis. The analysis involved 13,716 participants. The exclusion process details are described in Figure S1.
The study population’s demographic and behavioral characteristics were collected through a health interview conducted by trained medical staff using a validated questionnaire. This demographic and behavioral data included age, sex, education level (Illiteracy, primary, and at least secondary), physical activity (mild, moderate, and vigorous), smoking and drinking status, diabetes history, stroke history, and medication information (antihypertensive drugs, lipoprotein-lowering drugs, and glucose-lowering drugs). Current smoking was defined as smoking ≥ 1 cigarette per day for one year or more or a cumulative smoking amount of ≥ 360 cigarettes per year.
Anthropometric data, body height, WC, measured to the nearest 5 mm directly touching the participant’s skin using cloth tape. Blood pressure (BP) was assessed by trained medical staff to limit interobserver variability in measurement. After 5 min of rest as seated BP was measured using an electronic sphygmomanometer (Omron; Dalian, China), following the standard method and appropriately sized cuffs. Three measurements were performed on the right arm, with 1 min intervals between them, and the mean value was calculated. BMI was defined as body weight/hei2 (kg/m2).
Fasting blood samples were obtained from all of the patients. All the biochemical measurements were conducted at the Biaojia Biotechnology, Shenzhen, Guangdong Province, China using automatic clinical analyzers (Beckman Coulter, USA). Biochemical data, including fasting plasma glucose (FPG), homocysteine (Hcy), TG, total cholesterol (TC), high-density lipoprotein cholesterol (HDL-C), low-density lipoprotein cholesterol (LDL-C), aspartate aminotransferase, alanine aminotransferase, and GGT, were obtained from the fasting blood samples. The estimated glomerular filtration rate (eGFR) was calculated using the Chronic Kidney Disease Epidemiology Collaboration (CKD-EPI) equation (33).
FLI was calculated using Bedogni et al. (25) method with following formula: FLI = (e0.953×ln(TG)+0.139×BMI+0.718×ln (GGT) + 0.053 ×WC−15.745)/(1+ e0.953×ln(TG)+0.139×BMI+0.718×ln (GGT) + 0.053 ×WC−15.745)×100. In the above formula, the unit of BMI, WC, TG, and GGT were kg/m2, cm, mmol/L, and U/L, respectively. FLI scores ranged from 0 to 100. Since FLI ≥ 30 was suggested as a cutoff level to rule in hepatic steatosis (25). According to clinical significance, FLI was divided into two groups (< 30, ≥ 30). HUA was defined as serum uric acid ≥ 360 μmol/L for females and ≥ 420 μmol/L for males (34).
Diabetes mellitus was defined as self-reported physician diagnosis, FBG concentration ≥ 7.0 mmol/L, or use of glucose-lowering drugs. The medical history of the stroke was a self-reported stroke that was primarily collected via a questionnaire.
Participants’ baseline characteristics were presented as mean ± standard deviation (SD) for continuous variables and as a percentage (%) for categorical variables using an FLI clinical cutoff. Accordingly, differences in population characteristics by the clinical cutoff of FLI were compared using mono factorial variance test, or χ2 tests.
FLI was divided into two groups: normal group FLI < 30 and hepatic steatosis group FLI ≥ 30, for analysis based on its clinical cutoff. The FLI was assessed by two groups and continuous variables. Multivariate logistic regression models were used to evaluate the association between the FLI and HUA in hypertensive participants of both sexes. Covariates were included as potential confounders in the final multivariate logistic regression models if they changed the estimates of FLI on HUA by more than 10% (35) or were known as traditional risk factors for HUA. Four multivariate regression models were considered: Model 1: age and sex (only for the overall population); Model 2: age, sex, BMI, WC, education, living standard, physical activity, current smoking, current drinking, Hcy, creatinine, and eGFR; Model 3: age, sex (only for overall population), BMI, WC, education, living standard, physical activity, current smoking, current drinking, Hcy, creatinine, eGFR, diabetes mellitus, antihypertensive drugs, and glucose-lowering drugs. A generalized additive model and a fitted smoothing curve (penalized spline method) were utilized to assess the dose-response association between FLI and HUA prevalence. Stratification analyses were performed based on age (< 65 vs. ≥ 65y), living standard (preferably, commonly, and poor), current smoking (no vs. yes), current drinking (no vs. yes), eGFR (< 60 vs. ≥ 60 mL/min/1.73 m2), diabetes mellitus (no vs. yes), LDL-C (<1.8 vs. ≥1.8 mmol/L), HDL-C (<1.0 vs. ≥1.0 mmol/L), and Hcy (<15 vs. ≥15 μmol/L) to test whether these factors could modify the association between FLI and HUA prevalence in different sex. These were tested by adding a cross-product term between covariates and FLI to the model.
Statistical analyses were conducted using the statistical packages R, version 4.2.3, (R Foundation for Statistical Computing; http://www.r-project.org). A two-sided P-value < 0.05 was considered statistically significant in all analyses.
This study enrolled 13,716 hypertensive subjects (mean age 63.8 ± 9.4 years old, 47.2% male subjects). The average FLI was 31.8 ± 25.1, with HUA accounting for 44.5%. Table 1 presents the baseline characteristics of the participants according to FLI (< 30 vs. ≥ 30) in both sexes. In males, higher FLI was associated with higher BMI, WC, GGT, TC, TG, LDL-C, and UA but lower levels of Hcy and HDL-C. They were also more likely to be people with elevated living standards, current drinkers, HUA, diabetes, using glucose-lowering drugs, and younger adults. The baseline characteristics of the female subjects were identical to those of the males. Hcy levels, living standards, and alcohol consumption did not differ significantly between the two groups (P > 0.05). Patients with a higher FLI were more likely to use antihypertensive drugs. Table S1 displays the participants’ baseline characteristics based on FLI classification (< 30, ≥ 30).
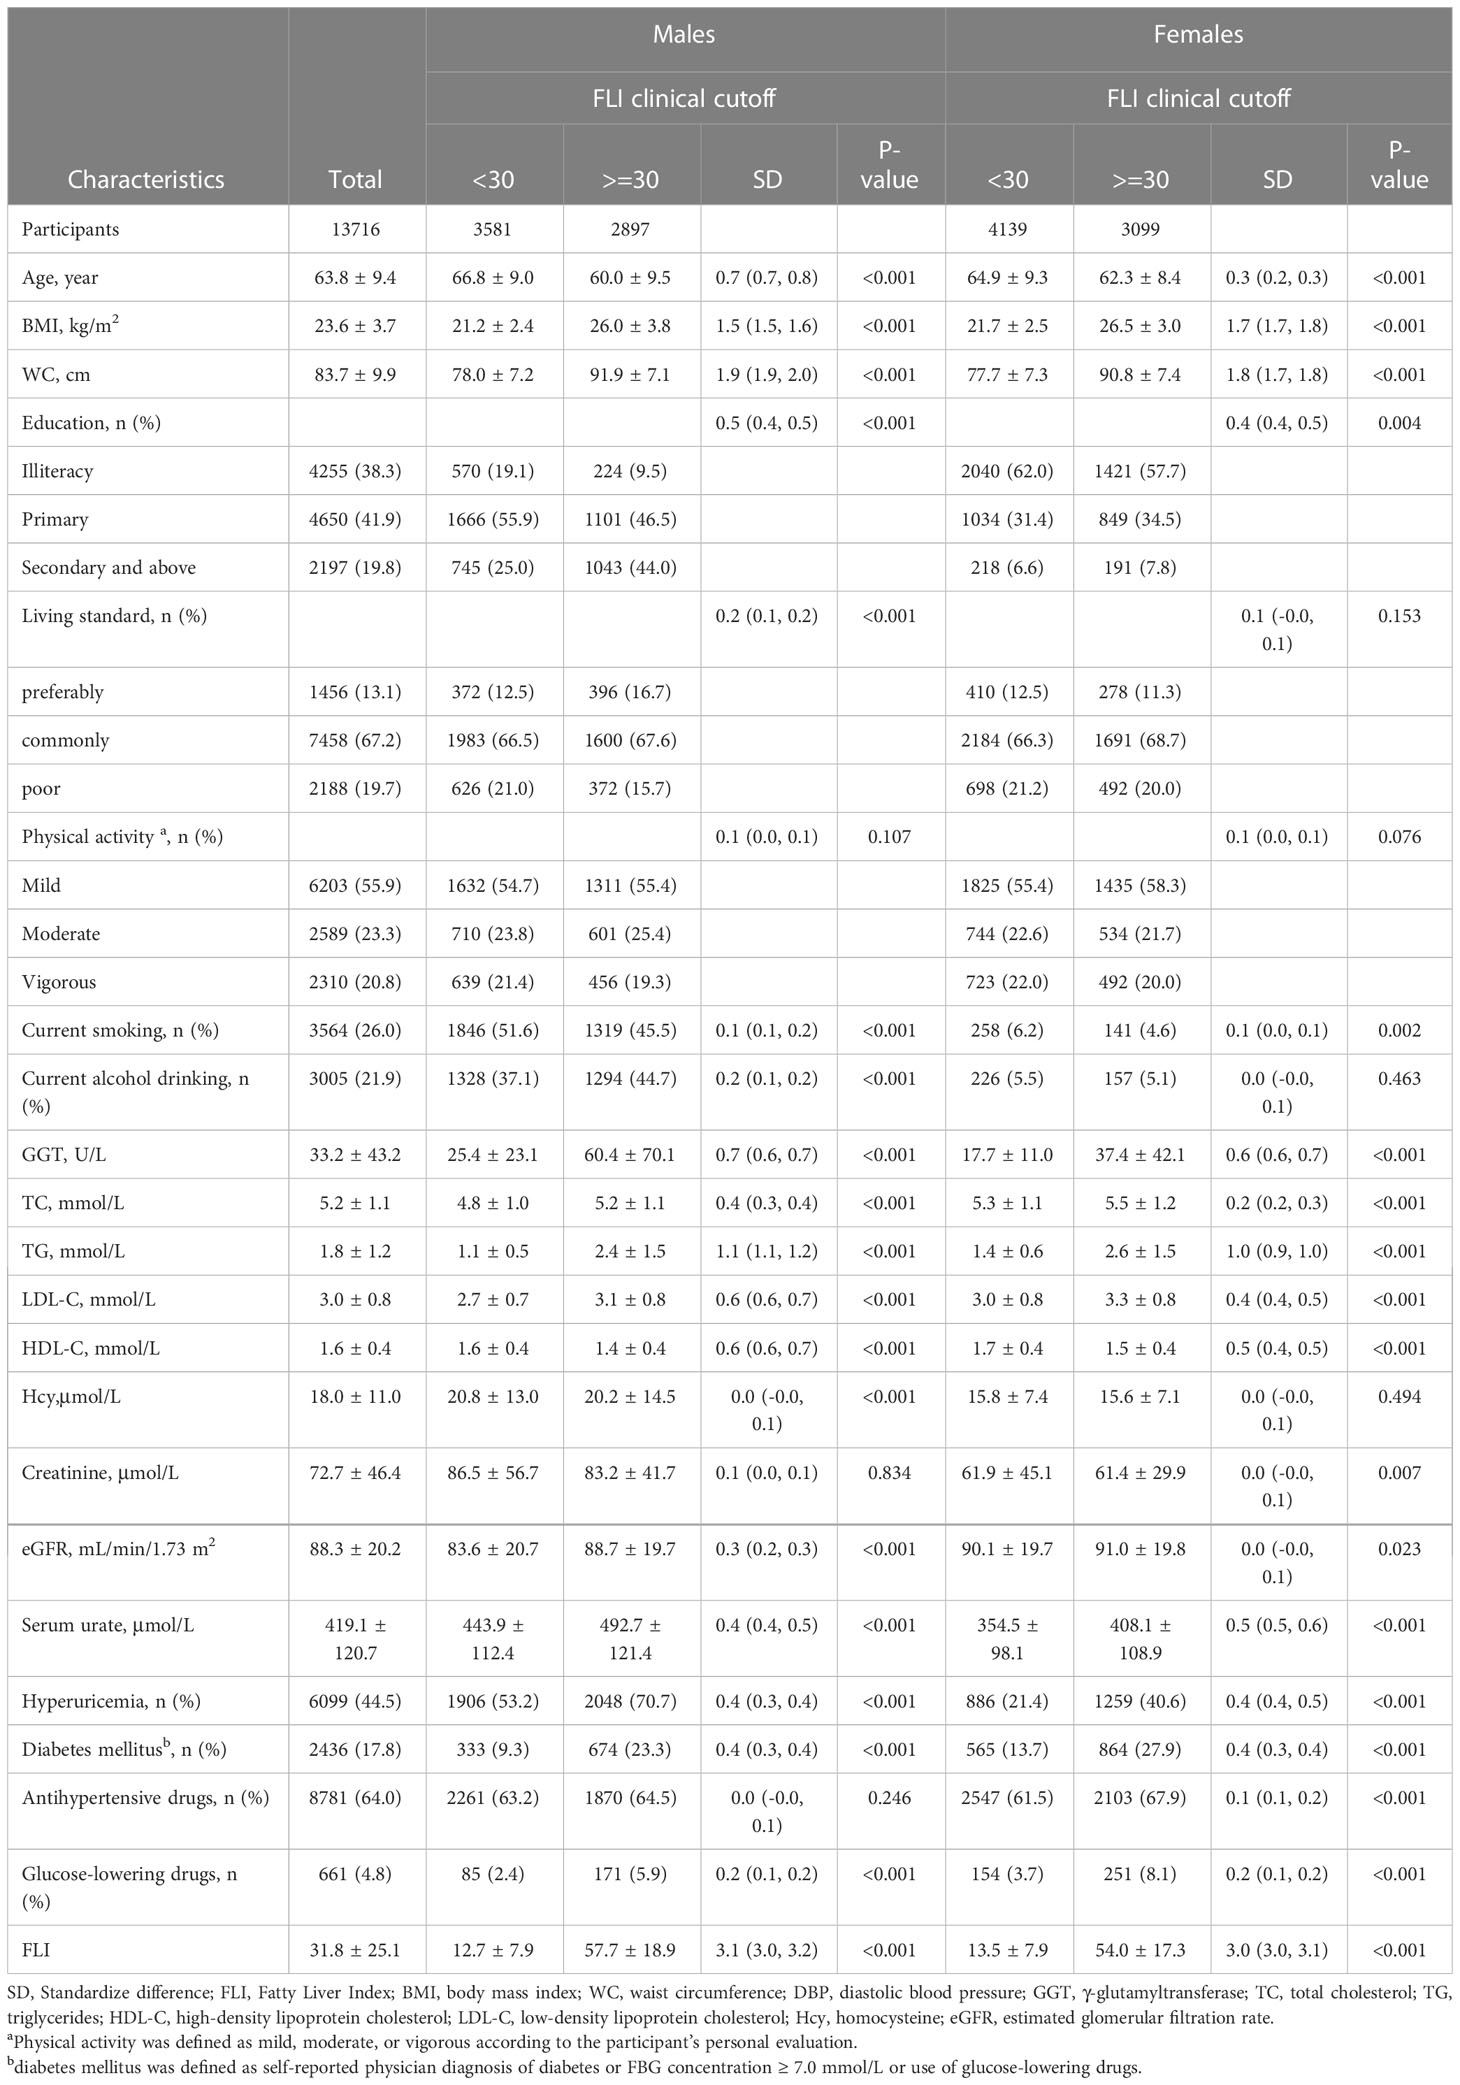
Table 1 Baseline characteristics of different sex participants according to FLI.
Table 2 depicts logistic regression model results for the correlation between FLI and HUA. FLI and HUA had a significant positive correlation (Figure 1). Per each SD unit increase in FLI, the prevalence of HUA increased by 78% (OR, 1.78; 95% CI: 1.69–1.87). HUA prevalence (FLI < 30) was significantly higher in the steatosis group than in the normal group (FLI ≥ 30) after adjusting numerous confounding factors (OR, 2.53; 95% CI: 2.30–2.77). Additionally, we split the FLI into four quartiles for sensitivity analysis to further validate the results of this study. Finally, HUA prevalence gradually and significantly increased across all quartiles of FLI. We observed sex differences in the relationship between FLI (< 30 vs. ≥ 30) and HUA (P for interaction = 0.006); thus, we performed a sex stratification analysis. Both males and females exhibited a positive correlation between FLI and HUA prevalence. The correlation between FLI and HUA was stronger in females than in males (male: OR, 1.70; 95% CI: 1.58–1.83; female: 1.85; 95% CI: 1.73–1.98). The generalized additive model and fitted smoothing curve (penalized spline method) are consistent with multivariate logistic regression models for the different gender (Figure 2).
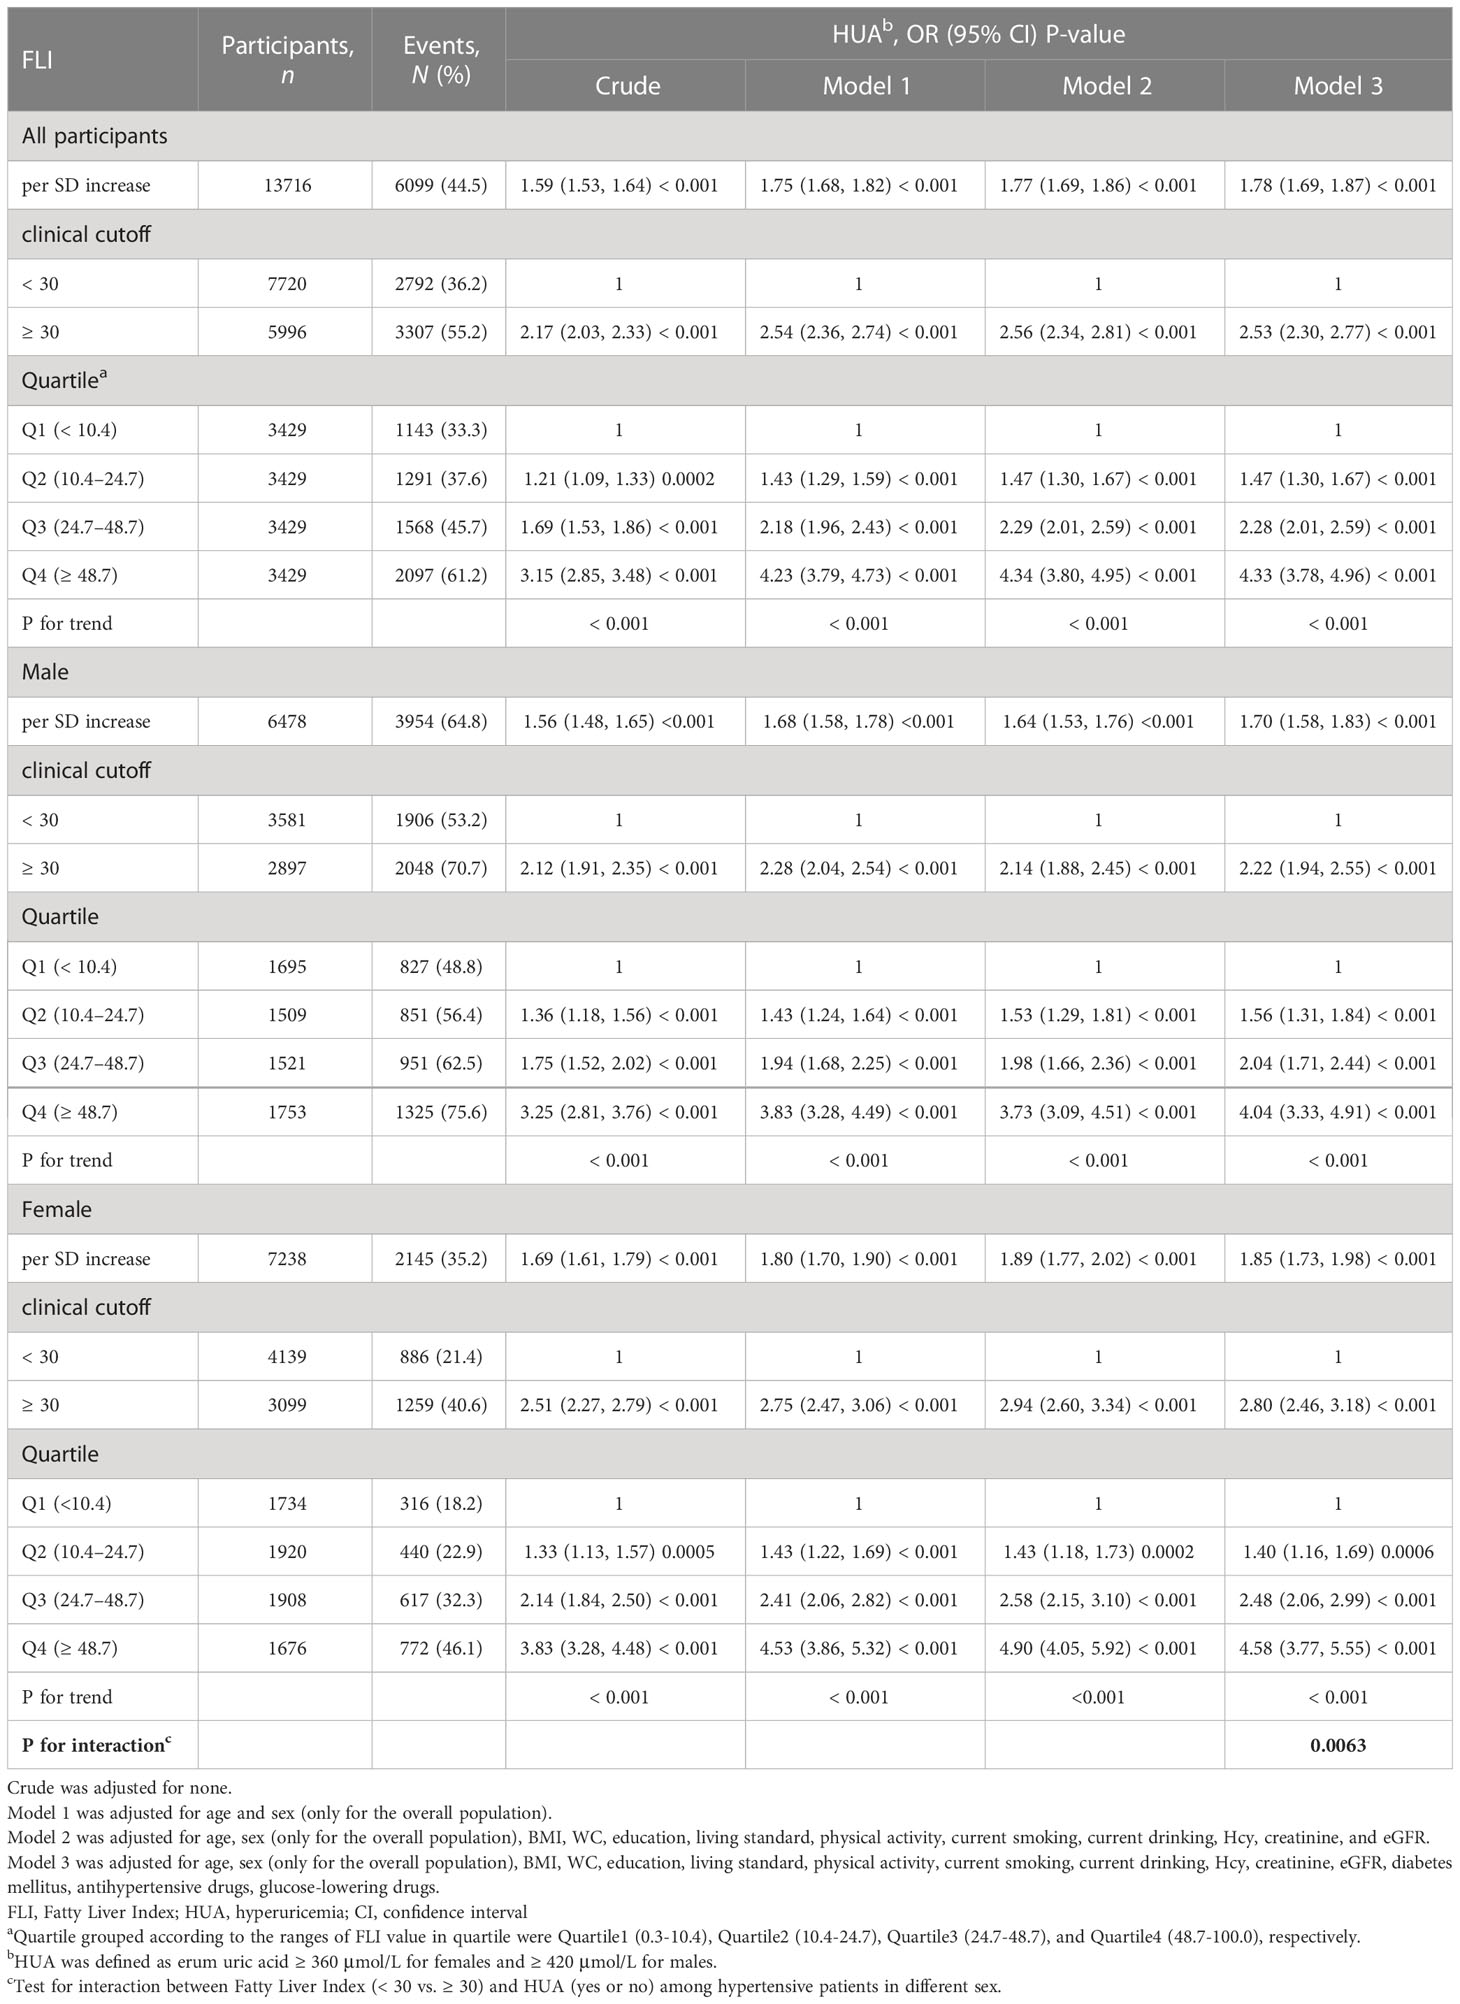
Table 2 Relative odds between FLI and HUA in different models among hypertensive patients in different sex.

Figure 1 Dose-response association between FLI and HUA prevalence in hypertensive Chinese patients. A linear correlation between FLI and HUA prevalence was found (P < 0.05). The solid and dashed lines represent the estimated values and corresponding 95% confidence interval, respectively. Adjustment factors included age, sex, BMI, WC, Education, Living standard, Physical activity, current smoking, current drinking, Hcy, creatinine, eGFR, diabetes mellitus, antihypertensive drugs, and glucose-lowering drugs.
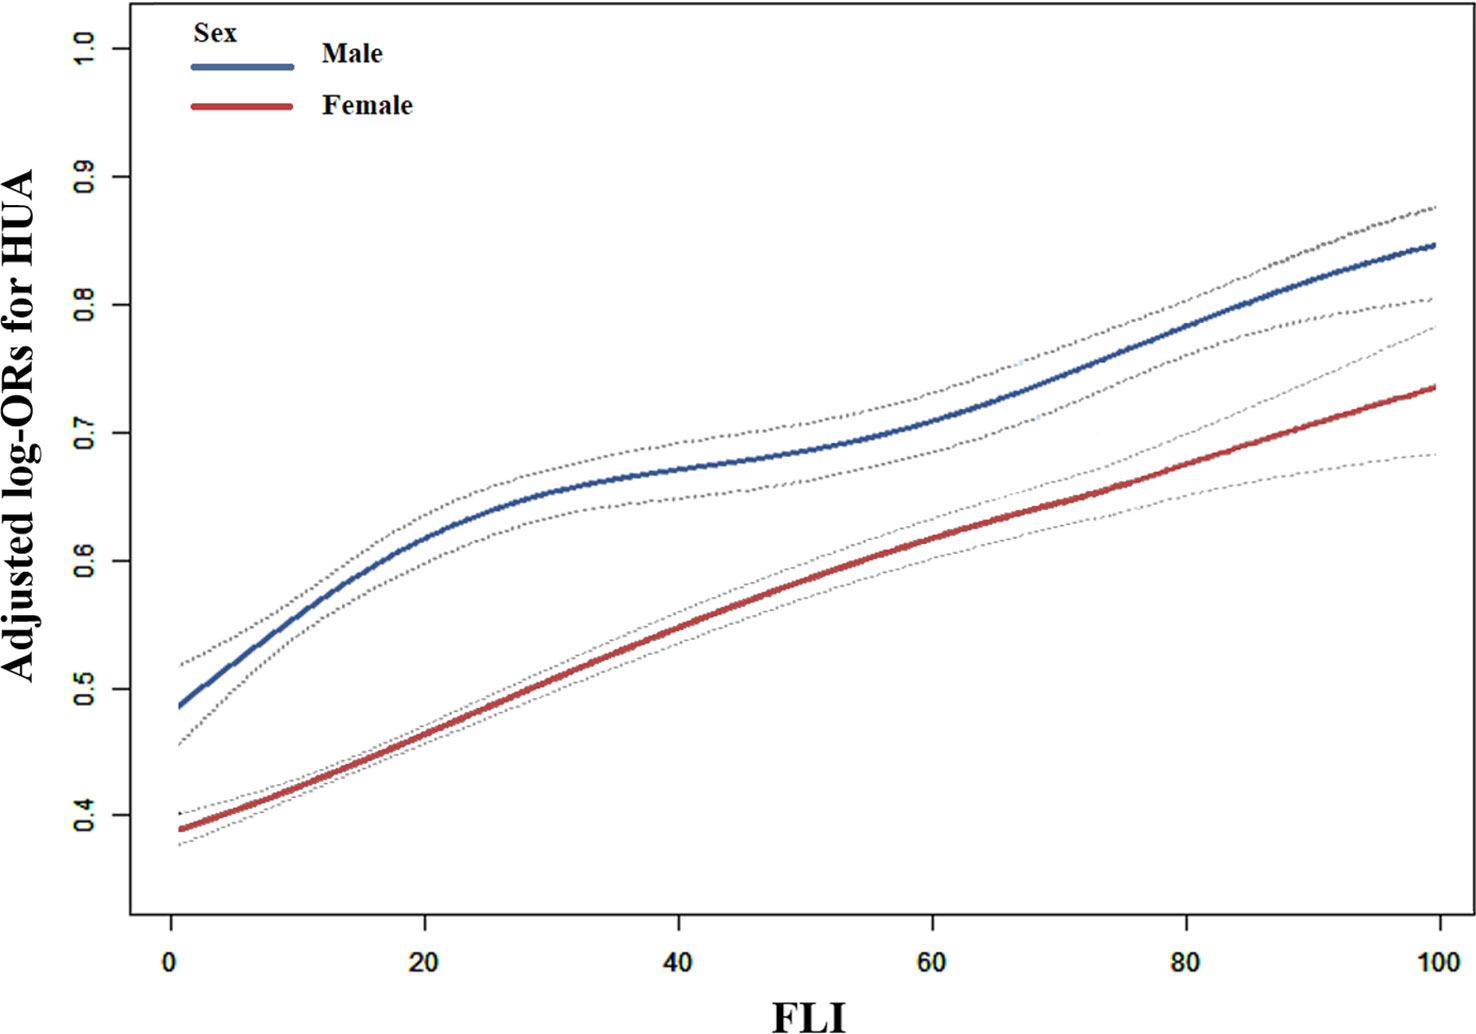
Figure 2 Correlation between FLI and HUA prevalence by sex in hypertensive Chinese patients. A linear correlation between FLI and HUA prevalence by sex was discovered (P < 0.05). The solid and dashed lines represent the estimated values in males and females, respectively. The adjustment factors included age, BMI, WC, Education, Living standard, Physical activity, current smoking, current drinking, Hcy, creatinine, eGFR, diabetes mellitus, antihypertensive drugs, and glucose-lowering drugs.
A stratified analysis was conducted to examine further the relationship between FLI (< 30 vs. ≥ 30) and HUA among different subgroups (Figure 3). The results revealed that age (< 65 vs. ≥ 65 y), diabetes (no vs. yes), and other stratified variables did not significantly modify the relationship between FLI and HUA in different genders, except smoking in males (P-values for all interactions > 0.05).

Figure 3 Stratified Analyses by Potential Modifiers of the Correlation between FLI and HUA prevalence by sex (A) males and (B) females. Each subgroup analysis adjusted for age, BMI, WC, education, living standard, physical activity, current smoking, alcohol intake, Hcy, creatinine, eGFR, diabetes mellitus, antihypertensive drugs, and glucose-lowering drugs.
This study discovered a strong positive correlation between FLI and HUA prevalence in hypertensive individuals, even after adjusting for various confounding factors. An additional evaluation of gender differences in the correlation between FLI and HUA prevalence revealed that the correlation was stronger in female subjects. This is the first known study of the strong positive correlation between FLI and HUA prevalence and the presence of sex differences in hypertensive individuals.
Previous studies have shown a synergistic effect between NAFLD and HUA (17, 36, 37). However, few reports have been published on the relationship between FLI and HUA. When Huang et al. (30) explored the relationship between visceral fat and HUA in the general population, they found that the risk of HUA increased significantly with FLI. In cellular and mouse models of NAFLD, increased expression of xanthine oxidase (XO), a rate-limiting enzyme that catalyzes uric acid production, could very well explain the underlying mechanisms of how NAFLD causes hyperuricemia (16). However, the sample size in Huang et al.’s (30) study is small (involving 1284 participants compared to 13,716 participants in the present study), leading to low statistical precision, less reliable, and less acceptable. Additionally, the study did not perform a sensitivity analysis, which would have cast doubt on the suitability of the results, or a subgroup analysis to explore potentially special subgroup of populations. This study compensates for these deficiencies.
This study is the first to report a sex difference in the correlation between FLI and HUA, suggesting that females may have a stronger correlation between FLI and HUA in hypertensive patients than males. The findings have been unreported in previous studies. The exact mechanism is unknown; possibly, hormonal differences underlie the underlying biochemical mechanisms. However, this may also be due to a study that included several postmenopausal females (18, 38, 39), who have significantly increased uric acid levels and NAFLD prevalence (40).
Previous studies have discovered that HUA can contribute to hypertension occurrence and development. The mechanism may involve decreasing vascular endothelial NO levels, oxidative stress, and activating the renin-angiotensin system (41, 42). Additionally, hypertension is a common and significantly elevated risk factor for HUA (43–45). The association between hyperuricemia and hypertension has been a subject of intense controversy (11, 43–48). Large-scale clinical trials are needed to determine if serum urate reduction can benefit hypertension and cardiometabolic disease. Simultaneously, hypertension and HUA are risk factors for multiple cardiovascular diseases (11, 49). The annual death toll from cardiovascular disease is as high as 18 million (50), Thus, early identification of high-risk groups of hypertensive patients with HUA is critical for the primary prevention of cardiovascular disease. According to this study, HUA prevalence in hypertension patients increased significantly with FLI. Therefore, FLI could be used as a useful predictor of NAFLD and to help optimize risk stratification management of HUA in hypertensive patients.
This study has the following advantages. According to our knowledge, this is the largest study to date to assess the correlation between FLI and HUA. Numerous confounding factors were adjusted, and group sensitivity analyses were performed to enhance the authenticity and reliability of this study (30, 51). Additionally, this study identified gender differences in the correlation between FLI and HUA. Several limitations of this study are also there. First, this cross-sectional study does not infer a causal relationship between FLI and HUA and needs further validation by large-scale prospective studies. Second, the study was conducted on Chinese hypertensive people, and the generalization to other populations remains to be verified. Third, this study lacks data on uric acid-lowering drugs (52–54). Fourth, heavy drinkers were included in the screening due to the lack of information on alcohol consumption in the questionnaire used for this study. This study aims to explore the relationship between NAFLD and HUA and assess the potential value of this index in the risk stratification of HUA in hypertensive individuals. Drinking status was adjusted as a confounding factor in the data analysis.
This study demonstrated a significant positive correlation between FLI and HUA prevalence in hypertensive Chinese adults. Importantly, this positive correlation appears to be stronger in females. If further confirmed in clinical practice, FLI could be an important predictor tool for identifying NAFLD and to predict the risk of developing HUA in hypertensive patients. In summary, routine monitoring of FLI in hypertensive patients is recommended because FLI helps identify people at high risk of HUA. Hypertension and HUA are also major risk factors for cardiovascular complications.
The raw data supporting the conclusions of this article will be made available by the authors, without undue reservation.
This study was approved by the ethics committee of the Institute of Biomedicine, Anhui Medical University (NO.CH1059), and the Second Affiliated Hospital of Nanchang University (NO. 2018019). The patients/participants provided their written informed consent to participate in this study. All procedures performed in studies involving human participants followed the ethical standards of the institutional and national research committee and the 1964 Helsinki declaration and its later amendments or comparable ethical standards.
CY participated in literature search, data analysis, and data interpretation. CY wrote the manuscript. XZ extracted and collected data. CY, XZ, WZ, TW, LZ, HB, and XC conceived of the study and participated in its design and coordination. WZ and LZ participated in the study design and provided critical revision. All authors contributed to the article and approved the submitted version.
This work was supported by the Cultivation of backup projects for National Science and Technology Awards (20223AEI91007), Jiangxi Science and Technology Innovation Base Plan - Jiangxi Clinical Medical Research Center (20223BCG74012), Science and Technology Innovation Base Construction Project (20221ZDG02010), Jiangxi Science and Technology Innovation Platform Project (20165BCD41005), Jiangxi Provincial Natural Science Foundation (20212ACB206019 and 20224BAB206090), Key R&D Projects, Jiangxi (20203BBGL73173), Jiangxi Provincial Health Commission Science and Technology Project (20203241, 202130440, 202210495, and 202310528), Jiangxi Provincial Drug Administration Science and Technology Project (2022JS41), and Fund project of the Second Affiliated Hospital of Nanchang University (2016YNQN12034, 2019YNLZ12010, 2021efyA01, and 2021YNFY2024).
Thanks to all investigators and subjects who participated in the China Hypertension Registry Study.
The authors declare that the research was conducted in the absence of any commercial or financial relationships that could be construed as a potential conflict of interest.
All claims expressed in this article are solely those of the authors and do not necessarily represent those of their affiliated organizations, or those of the publisher, the editors and the reviewers. Any product that may be evaluated in this article, or claim that may be made by its manufacturer, is not guaranteed or endorsed by the publisher.
The Supplementary Material for this article can be found online at: https://www.frontiersin.org/articles/10.3389/fendo.2023.1183666/full#supplementary-material
1. Mandal AK, Mount DB. The molecular physiology of uric acid homeostasis. Annu Rev Physiol (2015) 77:323–45. doi: 10.1146/annurev-physiol-021113-170343
2. Cabau G, Crisan TO, Kluck V, Popp RA, Joosten L. Urate-induced immune programming: consequences for gouty arthritis and hyperuricemia. Immunol Rev (2020) 294(1):92–105. doi: 10.1111/imr.12833
3. So AK, Martinon F. Inflammation in gout: mechanisms and therapeutic targets. Nat Rev Rheumatol (2017) 13(11):639–47. doi: 10.1038/nrrheum.2017.155
4. Liu R, Han C, Wu D, Xia X, Gu J, Guan H, et al. Prevalence of hyperuricemia and gout in mainland China from 2000 to 2014: a systematic review and meta-analysis. BioMed Res Int (2015) 2015:762820. doi: 10.1155/2015/762820
5. Kumar AUA, Browne LD, Li X, Adeeb F, Perez-Ruiz F, Fraser AD, et al. Temporal trends in hyperuricaemia in the Irish health system from 2006-2014: a cohort study. PloS One (2018) 13(5):e198197. doi: 10.1371/journal.pone.0198197
6. Roman YM. The Daniel k. inouye college of pharmacy scripts: perspectives on the epidemiology of gout and hyperuricemia. Hawaii J Med Public Health (2019) 78(2):71–6.
7. Thompson MD. Insights in public health: hyperuricemia and gout in hawai'i. Hawaii J Med Public Health (2018) 77(5):121–4.
8. Zhu Y, Pandya BJ, Choi HK. Prevalence of gout and hyperuricemia in the us general population: the national health and nutrition examination survey 2007-2008. Arthritis Rheumatol (2011) 63(10):3136–41. doi: 10.1002/art.30520
9. Smith E, Hoy D, Cross M, Merriman TR, Vos T, Buchbinder R, et al. The global burden of gout: estimates from the global burden of disease 2010 study. Ann Rheum Dis (2014) 73(8):1470–6. doi: 10.1136/annrheumdis-2013-204647
10. Gamala M, Jacobs J. Gout and hyperuricaemia: a worldwide health issue of joints and beyond. Rheumatology (2019) 58(12):2083–5. doi: 10.1093/rheumatology/kez272
11. Kuwabara M, Kodama T, Ae R, Kanbay M, Andres-Hernando A, Borghi C, et al. Update in uric acid, hypertension, and cardiovascular diseases. Hypertens Res (2023). doi: 10.1038/s41440-023-01273-3
12. Johnson RJ, Segal MS, Srinivas T, Ejaz A, Mu W, Roncal C, et al. Essential hypertension, progressive renal disease, and uric acid: a pathogenetic link? J Am Soc Nephrol (2005) 16(7):1909–19. doi: 10.1681/ASN.2005010063
13. Kleber ME, Delgado G, Grammer TB, Silbernagel G, Huang J, Kramer BK, et al. Uric acid and cardiovascular events: a mendelian randomization study. J Am Soc Nephrol (2015) 26(11):2831–8. doi: 10.1681/ASN.2014070660
14. Chaudhary NS, Bridges SJ, Saag KG, Rahn EJ, Curtis JR, Gaffo A, et al. Severity of hypertension mediates the association of hyperuricemia with stroke in the regards case cohort study. Hypertension (2020) 75(1):246–56. doi: 10.1161/HYPERTENSIONAHA.119.13580
15. Yao S, Zhou Y, Xu L, Zhang Q, Bao S, Feng H, et al. Association between hyperuricemia and metabolic syndrome: a cross-sectional study in Tibetan adults on the Tibetan plateau. Front Endocrinol (2022) 13:964872. doi: 10.3389/fendo.2022.964872
16. Li L, Yang C, Zhao Y, Zeng X, Liu F, Fu P. Is hyperuricemia an independent risk factor for new-onset chronic kidney disease?: a systematic review and meta-analysis based on observational cohort studies. BMC Nephrol (2014) 15:122. doi: 10.1186/1471-2369-15-122
17. Xu C, Wan X, Xu L, Weng H, Yan M, Miao M, et al. Xanthine oxidase in non-alcoholic fatty liver disease and hyperuricemia: one stone hits two birds. J Hepatol (2015) 62(6):1412–9. doi: 10.1016/j.jhep.2015.01.019
18. Qi D, Liu J, Wang C, Wang L, Zhang X, Lin Q, et al. Sex-specific differences in the prevalence of and risk factors for hyperuricemia among a low-income population in China: a cross-sectional study. POSTGRAD Med (2020) 132(6):559–67. doi: 10.1080/00325481.2020.1761133
19. Wu SJ, Zhu GQ, Ye BZ, Kong FQ, Zheng ZX, Zou H, et al. Association between sex-specific serum uric acid and non-alcoholic fatty liver disease in Chinese adults: a Large population-based study. Medicine (2015) 94(17):e802. doi: 10.1097/MD.0000000000000802
20. Jian-gao F. Guidelines for management of nonalcoholic fatty liver disease: an updated and revised edition. Zhonghua Gan Zang Bing Za Zhi (2010) 18(3):163–6. doi: 10.3760/cma.j.issn.1007-3418.2010.03.003
21. Li Y, Xu C, Yu C, Xu L, Miao M. Association of serum uric acid level with non-alcoholic fatty liver disease: a cross-sectional study. J Hepatol (2009) 50(5):1029–34. doi: 10.1016/j.jhep.2008.11.021
22. Moran-Costoya A, Proenza AM, Gianotti M, Llado I, Valle A. Sex differences in nonalcoholic fatty liver disease: estrogen influence on the liver-adipose tissue crosstalk. Antioxid Redox Sign (2021) 35(9):753–74. doi: 10.1089/ars.2021.0044
23. Kong L, Yang Y, Li H, Shan Y, Wang X, Shan X. Prevalence of nonalcoholic fatty liver disease and the related risk factors among healthy adults: a cross-sectional study in chongqing, China. Front Public Health (2023) 11:1127489. doi: 10.3389/fpubh.2023.1127489
24. Yu XL, Shu L, Shen XM, Zhang XY, Zheng PF. Gender difference on the relationship between hyperuricemia and nonalcoholic fatty liver disease among Chinese: an observational study. Medicine (2017) 96(39):e8164. doi: 10.1097/MD.0000000000008164
25. Bedogni G, Bellentani S, Miglioli L, Masutti F, Passalacqua M, Castiglione A, et al. The fatty liver index: a simple and accurate predictor of hepatic steatosis in the general population. BMC Gastroenterol (2006) 6:33. doi: 10.1186/1471-230X-6-33
26. Festi D, Schiumerini R, Marasco G, Scaioli E, Pasqui F, Colecchia A. Non-invasive diagnostic approach to non-alcoholic fatty liver disease: current evidence and future perspectives. Expert Rev Gastroenterol Hepatol (2015) 9(8):1039–53. doi: 10.1586/17474124.2015.1049155
27. Ahn SH, Seo DH, Kim SH, Nam MS, Hong S. The relationship between fatty liver index and bone mineral density in koreans: knhanes 2010-2011. Osteo Int (2018) 29(1):181–90. doi: 10.1007/s00198-017-4257-z
28. Choi YJ, Lee DH, Han KD. Association between high fatty liver index and development of colorectal cancer: a nationwide cohort study with 21,592,374 Korean. Korean J Intern Med (2020) 35(6):1354–63. doi: 10.3904/kjim.2018.022
29. Park JH, Choi IS, Han KD, Park H, Kim KH, Kim JS. Association between fatty liver index and risk of breast cancer: a nationwide population-based study. Clin Breast Cancer (2020) 20(4):e450–7. doi: 10.1016/j.clbc.2020.02.004
30. Huang X, Jiang X, Wang L, Chen L, Wu Y, Gao P, et al. Visceral adipose accumulation increased the risk of hyperuricemia among middle-aged and elderly adults: a population-based study. J Transl Med (2019) 17(1):341. doi: 10.1186/s12967-019-2074-1
31. Li M, Zhan A, Huang X, Hu L, Zhou W, Wang T, et al. Positive association between triglyceride glucose index and arterial stiffness in hypertensive patients: the China h-type hypertension registry study. Cardiovasc Diabetol (2020) 19(1):139. doi: 10.1186/s12933-020-01124-2
32. Shi Y, Hu L, Li M, Ding C, Zhou W, Wang T, et al. The ankle-brachial index and risk of incident stroke in Chinese hypertensive population without atrial fibrillation: a cross-sectional study. J Clin Hypertens (2021) 23(1):114–21. doi: 10.1111/jch.14102
33. Levey AS, Stevens LA, Schmid CH, Zhang YL, Castro AF 3rd, Feldman HI, et al. A new equation to estimate glomerular filtration rate. Ann Intern Med (2009) 150(9):604–12. doi: 10.7326/0003-4819-150-9-200905050-00006
34. Krishnan E, Kwoh CK, Schumacher HR, Kuller L. Hyperuricemia and incidence of hypertension among men without metabolic syndrome. Hypertension (2007) 49(2):298–303. doi: 10.1161/01.HYP.0000254480.64564.b6
35. Greenland S. Modeling and variable selection in epidemiologic analysis. Am J Public Health (1989) 79(3):340–9. doi: 10.2105/ajph.79.3.340
36. Catanzaro R, Sciuto M, He F, Singh B, Marotta F. Non-alcoholic fatty liver disease: correlation with hyperuricemia in a European Mediterranean population. Acta Clin BELG (2022) 77(1):45–50. doi: 10.1080/17843286.2020.1783907
37. Ma Z, Zhang J, Kang X, Xu C, Sun C, Tao L, et al. Hyperuricemia precedes non-alcoholic fatty liver disease with abdominal obesity moderating this unidirectional relationship: three longitudinal analyses. Atherosclerosis (2020) 311:44–51. doi: 10.1016/j.atherosclerosis.2020.08.006
38. Koga M, Saito H, Mukai M, Kasayama S, Yamamoto T. Factors contributing to increased serum urate in postmenopausal Japanese females. Climacteric (2009) 12(2):146–52. doi: 10.1080/13697130802607719
39. Wingrove CS, Walton C, Stevenson JC. The effect of menopause on serum uric acid levels in non-obese healthy women. Metabolism (1998) 47(4):435–8. doi: 10.1016/s0026-0495(98)90056-7
40. Tomiya T. Sex difference in non-alcoholic fatty liver disease and non-alcoholic steatohepatitis. Hepatol Res (2010) 40(1):108–10. doi: 10.1111/j.1872-034X.2009.00611.x
41. Perlstein TS, Gumieniak O, Hopkins PN, Murphey LJ, Brown NJ, Williams GH, et al. Uric acid and the state of the intrarenal renin-angiotensin system in humans. Kidney Int (2004) 66(4):1465–70. doi: 10.1111/j.1523-1755.2004.00909.x
42. McMullan CJ, Borgi L, Fisher N, Curhan G, Forman J. Effect of uric acid lowering on renin-Angiotensin-System activation and ambulatory bp: a randomized controlled trial. Clin J Am Soc Nephro (2017) 12(5):807–16. doi: 10.2215/CJN.10771016
43. Johnson RJ, Choi HK, Yeo AE, Lipsky PE. Pegloticase treatment significantly decreases blood pressure in patients with chronic gout. Hypertension (2019) 74(1):95–101. doi: 10.1161/HYPERTENSIONAHA.119.12727
44. Feig DI, Soletsky B, Johnson RJ. Effect of allopurinol on blood pressure of adolescents with newly diagnosed essential hypertension: a randomized trial. JAMA-J Am Med Assoc (2008) 300(8):924–32. doi: 10.1001/jama.300.8.924
45. Soletsky B, Feig DI. Uric acid reduction rectifies prehypertension in obese adolescents. Hypertension (2012) 60(5):1148–56. doi: 10.1161/HYPERTENSIONAHA.112.196980
46. Sanchez-Lozada LG, Rodriguez-Iturbe B, Kelley EE, Nakagawa T, Madero M, Feig DI, et al. Uric acid and hypertension: an update with recommendations. Am J Hypertens (2020) 33(7):583–94. doi: 10.1093/ajh/hpaa044
47. Feig DI. Serum uric acid and the risk of hypertension and chronic kidney disease. Curr Opin Rheumatol (2014) 26(2):176–85. doi: 10.1097/BOR.0000000000000033
48. Kuwabara M, Niwa K, Nishi Y, Mizuno A, Asano T, Masuda K, et al. Relationship between serum uric acid levels and hypertension among Japanese individuals not treated for hyperuricemia and hypertension. Hypertens Res (2014) 37(8):785–9. doi: 10.1038/hr.2014.75
49. Kuo CF, See LC, Yu KH, Chou IJ, Chiou MJ, Luo SF. Significance of serum uric acid levels on the risk of all-cause and cardiovascular mortality. Rheumatology (2013) 52(1):127–34. doi: 10.1093/rheumatology/kes223
50. Chopra HK, Ram C. Recent guidelines for hypertension. Circ Res (2019) 124(7):984–6. doi: 10.1161/CIRCRESAHA.119.314789
51. Qu J, Dou J, Wang A, Liu Y, Lin L, Chen K, et al. Fatty liver index for hyperuricemia diagnosis: a community-based cohort study. BMC Endocr Disord (2022) 22(1):114. doi: 10.1186/s12902-022-01030-6
52. Liu XZ, Xu X, Zhu JQ, Zhao DB. Association between three non-Insulin-Based indexes of insulin resistance and hyperuricemia. Clin Rheumatol (2019) 38(11):3227–33. doi: 10.1007/s10067-019-04671-6
53. Mazidi M, Katsiki N, Mikhailidis DP, Banach M. The link between insulin resistance parameters and serum uric acid is mediated by adiposity. Atherosclerosis (2018) 270:180–6. doi: 10.1016/j.atherosclerosis.2017.12.033
Keywords: fatty liver index, hyperuricemia, hypertension, sex differences, non-alcoholic fatty liver disease
Citation: Yu C, Zhou X, Wang T, Zhu L, Zhou W, Bao H and Cheng X (2023) Positive correlation between fatty liver index and hyperuricemia in hypertensive Chinese adults: a H-type hypertension registry study. Front. Endocrinol. 14:1183666. doi: 10.3389/fendo.2023.1183666
Received: 10 March 2023; Accepted: 08 May 2023;
Published: 02 June 2023.
Edited by:
Elena Succurro, University of Magna Graecia, ItalyReviewed by:
Asim Kumar Mandal, Harvard Medical School, United StatesCopyright © 2023 Yu, Zhou, Wang, Zhu, Zhou, Bao and Cheng. This is an open-access article distributed under the terms of the Creative Commons Attribution License (CC BY). The use, distribution or reproduction in other forums is permitted, provided the original author(s) and the copyright owner(s) are credited and that the original publication in this journal is cited, in accordance with accepted academic practice. No use, distribution or reproduction is permitted which does not comply with these terms.
*Correspondence: Wei Zhou, ei13Njc3QDE2My5jb20=; Lingjuan Zhu, NzU3MzU2OTU3QHFxLmNvbQ==
Disclaimer: All claims expressed in this article are solely those of the authors and do not necessarily represent those of their affiliated organizations, or those of the publisher, the editors and the reviewers. Any product that may be evaluated in this article or claim that may be made by its manufacturer is not guaranteed or endorsed by the publisher.
Research integrity at Frontiers
Learn more about the work of our research integrity team to safeguard the quality of each article we publish.