 Zhi-Ping Wu1
 Wei Wei2Yuan Cheng1Jing-Yi Chen1
 Yang Liu3Shan Liu1Meng-Die Hu1Heng Zhao1Xiao-Feng Li1
 Xin Chen1*
- 1Department of Epidemiology, School of Public Health, Dalian Medical University, Dalian, China
- 2Department of Neurosurgery, Central Hospital of Dalian University of Technology, Dalian, China
- 3Institute of Health Science, China Medical University, Shenyang, China
Objective: This study aimed to explore the relationship between the plasma metabolites of adolescent obesity and hypertension and whether metabolite alterations had a mediating effort between adolescent obesity and hypertension.
Methods: We applied untargeted ultra-performance liquid chromatography–mass spectrometry (UPLC-MS) to detect the plasma metabolomic profiles of 105 adolescents. All participants were selected randomly based on a previous cross-sectional study. An orthogonal partial least squares- discriminant analysis (OPLS-DA), followed by univariate statistics and enrichment analysis, was used to identify differential metabolites. Using logistic regression for variable selection, an obesity-related metabolite score (OMS, ) was constructed from the metabolites identified, and hypertension risk was estimated.
Results: In our study, based on P< 0.05, variable importance in projection (VIP) > 1.0, and impact value > 0.1, we identified a total of 12 differential metabolites. Significantly altered metabolic pathways were the sphingolipid metabolism, purine metabolism, pyrimidine metabolism, phospholipid metabolism, steroid hormone biosynthesis, tryptophan, tyrosine, and phenylalanine biosynthesis. The logistic regression selection resulted in a four-metabolite score (thymidine, sphingomyelin (SM) d40:1, 4-hydroxyestradiol, and L-lysinamide), which was positively associated with hypertension risk (odds ratio: 7.79; 95% confidence interval: 2.13, 28.47; for the quintile 4 compared with quartile 1 of OMS) after multivariable adjustment.
Conclusions: The OMS constructed from four differential metabolites was used to predict the risk of hypertension in adolescents. These findings could provide sensitive biomarkers for the early recognition of hypertension in adolescents with obesity.
1 Introduction
Adolescent obesity has reached epidemic proportions worldwide (1, 2). Particularly in low- and middle-income countries, the prevalence of adolescents who are overweight and have obesity is increasing rapidly (3). In China, the number of individuals who are overweight or obese has also increased significantly over the past 30 years. According to a report on nutrition and chronic diseases in Chinese residents in 2015-2019, 11.1% and 7.9% of children and adolescents aged 6-17 years were either overweight or obese, respectively (4). Several studies have demonstrated that obesity in childhood is not only strongly associated with the development of obesity in adulthood but may also increase the incidence of other cardiovascular diseases (5, 6). Baker et al. (7) reported that adolescents with obesity or those that are overweight are at higher risk of developing hypertension compared to normal-weight adolescents. The risk of developing hypertension increases with increasing body mass index (BMI). In addition, hypertension in childhood is a strong predictor of hypertension in adulthood (8). Consequently, the early detection of hypertension in obese children or adolescents and timely preventive measures in high-risk populations can effectively reduce the occurrence of cardiovascular events in adulthood.
Obesity hypertension is generally accepted to be the result of an interaction between genetics and the environment (9). Considering the complexity of hypertension development, an analysis of molecular processes may be “closer” to the disease than genetic markers and more conducive to revealing potential new biomarkers and the pathogenesis of hypertension. Pathophysiological alterations in hypertension are likely to have occurred before measurable elevated blood pressure in the brachial artery of the upper arm (10). When identified, these early physiological or biochemical perturbations will provide a better understanding of hypertensive pathogenesis and offer new opportunities for developing new therapeutic modalities and improving diagnostic methods. In the last decade, metabolomics, which is the qualitative and quantitative assessment of small molecular metabolites (<1500 Da) in bodily fluids, has played an increasingly important role in identifying disease biomarkers (11, 12). The strong association between hypertension and certain dyslipidemia such as cholesterol and triglycerides has been recognized for decades. However, there may also be a link between other metabolic disorders and hypertension, which remains to be discovered. Therefore, newly identified metabolic biomarkers could strengthen the risk prediction models for hypertension.
In our study, we aimed to analyze the differences in metabolic composition associated with obesity and to identify potential metabolic patterns using untargeted ultra-performance liquid chromatography (UPLC)–mass spectrometry (MS) metabolomic techniques based on supervised learning pattern recognition methods. We then explored the relationship between the constructed obesity-related metabolite score and hypertension. We hope to provide scientific evidence for the early identification of susceptibility to adolescent hypertension and for the primary prevention of adult hypertension.
2 Materials and methods
2.1 Study population
This study was based on a previous cross-sectional study (13), in which random cluster sampling methods were conducted in a randomly selected high school in Shenyang City, Liaoning Province, China. The cross-sectional study included three components: an administered questionnaire, health examination, and blood sample collection.
In this study, we randomly selected 105 adolescents aged 15 to 17 years (53 boys and 52 girls) from a previous cross-sectional study, in which the adolescents were included with complete anthropometric and biochemical information. The exclusion criteria were any other chronic disease, autoimmune diseases, or taking any medication. Normal-weight (BMI<85th percentile for age and sex), overweight (BMI ≥85th percentile but<95th percentile for age and sex), and obese (BMI ≥95th percentile for age and sex) groups were defined from Chinese population data (14). The study was approved by the ethics committee of Dalian Medical University. All participants and their parents gave informed consent.
2.2 Questionnaire administered and health examination
Standardized training was administered to the interviewers before the survey began. Only trained and qualified interviewers conducted the survey, using a face-to-face method at the school. Structured questionnaires were used to collect data on demographic information (age, sex, ethnicity, and the number of household sizes), emotional components (self-evaluation, family evaluation, friends evaluation, and self-control ability), and life sections (sleep status, living conditions, and physical activity). The completed surveys were reviewed by two independent quality control interviewers.
Weight, height, and blood pressure were performed by trained professionals following standard-based protocols (referenced to GB/T26343). According to the Chinese Reference on Blood Pressure in Children and Adolescents, hypertension was defined as systolic/diastolic blood pressure (SBP/DBP) ≥95th percentile for age, sex, and height (15).
2.3 Blood sample collection and preparation
Fasting blood samples were drawn from all the adolescents after a 12-hour fast. The samples were added to an ethylenediaminetetraacetic acid (EDTA) anticoagulation tube, mixed upside down 8–10 times, and centrifuged at 2,500 rpm for 10 minutes at room temperature for plasma separation. The extracted plasma sample (40 μL) was transferred to a 2 mL Eppendorf (EP) tube. Ice-cold methanol was added (160 μL) to remove protein. The centrifuge tube was vortexed at maximum speed for 10 s and centrifuged at 13,500 rpm for 15 min. Supernatants (80 μL) were transferred to liquid chromatography (LC) vials and stored at -80°C until the ultra-performance liquid chromatography (UPLC)–mass spectrometry (MS) analysis. In addition, triglycerides (TG), cholesterol (TC), high-density lipoprotein cholesterol (HDLC), and low-density lipoprotein cholesterol (LDLC) were measured by the Shengjing Hospital of China Medical University using a Hitachi 7600 clinical analyzer (Hitachi, Tokyo, Japan).
2.4 Untargeted ultra-performance liquid chromatography–mass spectrometry metabolomics analysis
Metabolomics analysis was conducted using standard operating procedures for untargeted metabolomics analysis (Figure 1). A UPLC system (Thermo Fisher Scientific, Waltham, MA, USA) was equipped with an ACQUITY BEH C8 column (1.7μm, 2.1×100nm, Waters Corp, Milford, USA). The binary gradient elution system consisted of (A) water and (B) 95% acetonitrile, which both contained 0.1% formic acid. Separation was performed by using the following: 0 min, 5% B; 1 min, 5% B; 24 min, 98% B; 27.5 min, 98% B; 27.6 min, 5% B; 31 min, 5% B. The flow rate was 0.35 mL/min. The injection volume was 10μL. All analyses were performed at 4°C.
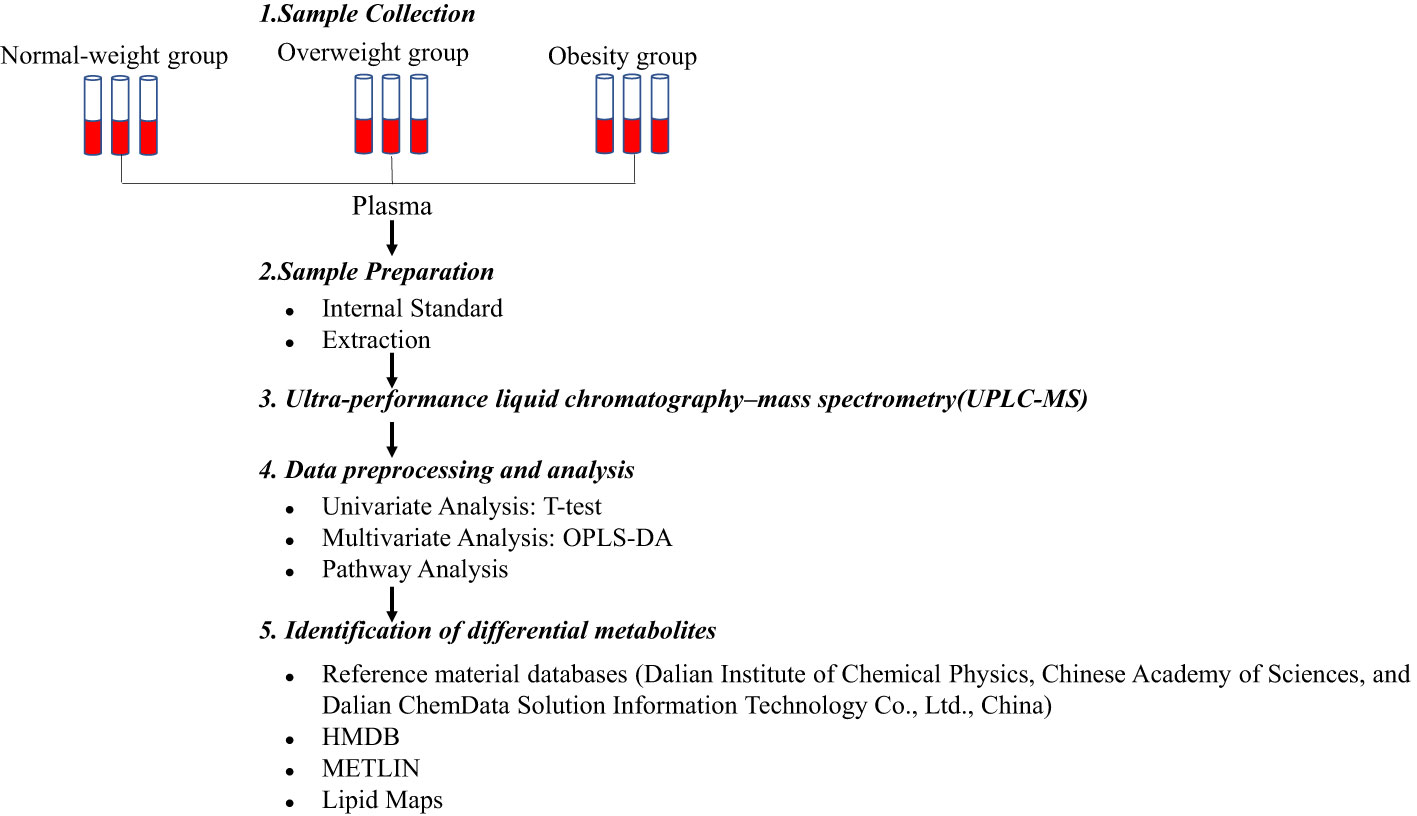
Figure 1 Study procedure for the untargeted metabolomics analysis.
MS analysis was conducted on a Q-Exactive mass spectrometer outfitted with a heated electrospray ionization source (Thermo Fisher Scientific, Waltham, MA, USA) with positive and negative ion modes. Data acquisition was performed in full scan mode (m/z ranges from 75 to 1,000) combined with data-dependent acquisition (DDA) mode (full MS/dd-MS2 scans). The parameters for full scan mode and DDA mode were as follows: resolution, 70,000/17,500; automatic gain control (AGC) target, 3e6/1e5; normalized collision energy (NCE): 20/40ev. The following were the parameters of the MS: spray voltage, 3.0kV (positive), 3.0kV (negative); evaporation temperature, 320°C; sheath gas flow rate, 35 arbitrary units; auxiliary gas flow rate, 8 arbitrary units; capillary temperature, 350 °C; S-lens radio frequency (RF): 50.6.
The quality control samples were performed by mixing an equivalent portion of supernatant (10 μL). They were injected periodically (every 12 samples) throughout the analysis run to provide a set of data that can be used for analytical repeatability.
2.5 Metabolomics data pre-processing and analysis
Metabolomics data were acquired using Xcalibur 2.1 software (Thermo Fisher Scientific), which generated a data matrix consisting of retention time (RT), mass-to-charge ratio (m/z) values, and peak intensity. OSI-SMMS (One-step Solution for Identification of Small Molecules in Metabolomics Studies) was used for peak annotation. Metabolites were identified by searching major metabolite databases, including reference material databases (Dalian Institute of Chemical Physics, Chinese Academy of Sciences, and Dalian ChemData Solution Information Technology Co., Ltd., China), HMDB (http://www.hmdb.ca/), METLIN (http://metlin.scripps.edu/), and Lipid Maps (https://lipidmaps.org/).
For the univariate statistical analyses, we used volcano plots to visualize metabolite differences between groups. A fold change of 1.5 was used as the threshold for up-regulated and down-regulated metabolites. Multivariate analysis was performed using orthogonal partial least-squares-discriminant analysis (OPLS-DA) to differentiate the obesity and normal-weight groups. In this study, we were more concerned with exploring the metabolite alterations between the normal-weight and obese groups, because obesity is a serious metabolic disease whose pathophysiological mechanisms are very different from those of normal-weight metabolism; we believe that the comparison between the normal-weight group and obese group can better reveal the characteristics and mechanisms of metabolic abnormalities in obesity. We evaluated the model performance using model parameters R2Y (interpretability of the model) and Q2 (predictability of the model), obtained from 7-fold cross-validation. In addition, the permutation test was applied to evaluate the model using the regression line, and the Y-axis intercept values (R2 and Q2) were used to measure whether the model was overfitted. If the intercept of Q2 was less than zero, then the model was valid (16). The preliminary criteria for identifying differential metabolites were P< 0.05 from the Student’s t-test and variable importance in projection (VIP) >1.0 in the OPLS-DA model. In addition, metabolic pathway analysis was performed using the Kyoto Encyclopedia of Genes and Genomes (KEGG), which identified metabolic pathways with a significant important value on metabolites (impact value > 0.1). We further used restricted cubic spline curves with three knots to visualize the dose–response relationship between the BMI and metabolites and box plots to visualize the metabolite values with statistically significant differences between the groups.
2.6 Statistical analysis
We calculated the mean (standard deviation) of the continuous variables and the number (percentage) of the categorical variables. One-way ANOVA and the chi-square test were used to compare the continuous and categorical variables, and Bonferroni correction was used for multiple group comparisons. Natural log transformation was performed on all the selected differential metabolite values, which were then converted to the standard normal distribution. We evaluated the relationships between the selected differential metabolites and biochemical indicators with the selected differential metabolites using the Spearman partial correlation coefficient. We used logistic regression to construct a parsimonious model that effectively represented the metabolic elements associated with adolescent obesity. These were used to create the obesity-related metabolite score (OMS), as follows:
where was the corresponding regression coefficient for metabolite (n), was the Z-score for metabolite (n), and n was the amount of selected differential metabolites. Next, we evaluated the association between the OMS and hypertension risk of the adolescents. The scores were assessed in quartiles (based on controls) using unconditional logistic regression after multivariable adjustment. We also used stepwise multiple linear regression to evaluate the relationship between the OMS and SBP/DBP. Finally, we used a mediation effect, which divided the total effect into the direct effect (i.e., independent OMS) and indirect effect (i.e., mediated OMS), to estimate the degree to which the selected differential metabolites (continuous OMS) could account for the relationship between obesity and the risk of developing hypertension in adolescents. To further explore potential confounders, we used sensitivity analyses to estimate the mediation effect of the OMS by adjusting for sex, age, ethnicity, and lipid indicators.
3 Results
3.1 Baseline information of the study population
In total, 105 adolescents who fulfilled the inclusion and exclusion criteria were included in this study and were assigned to normal-weight (n = 53), overweight (n = 34), and obesity (n = 18) groups, as presented in Table 1. Briefly, adolescents in the obesity group had significantly higher weight, BMI, SBP, DBP, and lipids (LDLC, CHOL, and TG) after Bonferroni correction (P<0.05/3). We also found that DBP in the overweight group was the lowest compared to the normal-weight and obese groups (P<0.05/3). In addition, there was no significant statistical difference between the groups in terms of age, sex, and height (P>0.05).
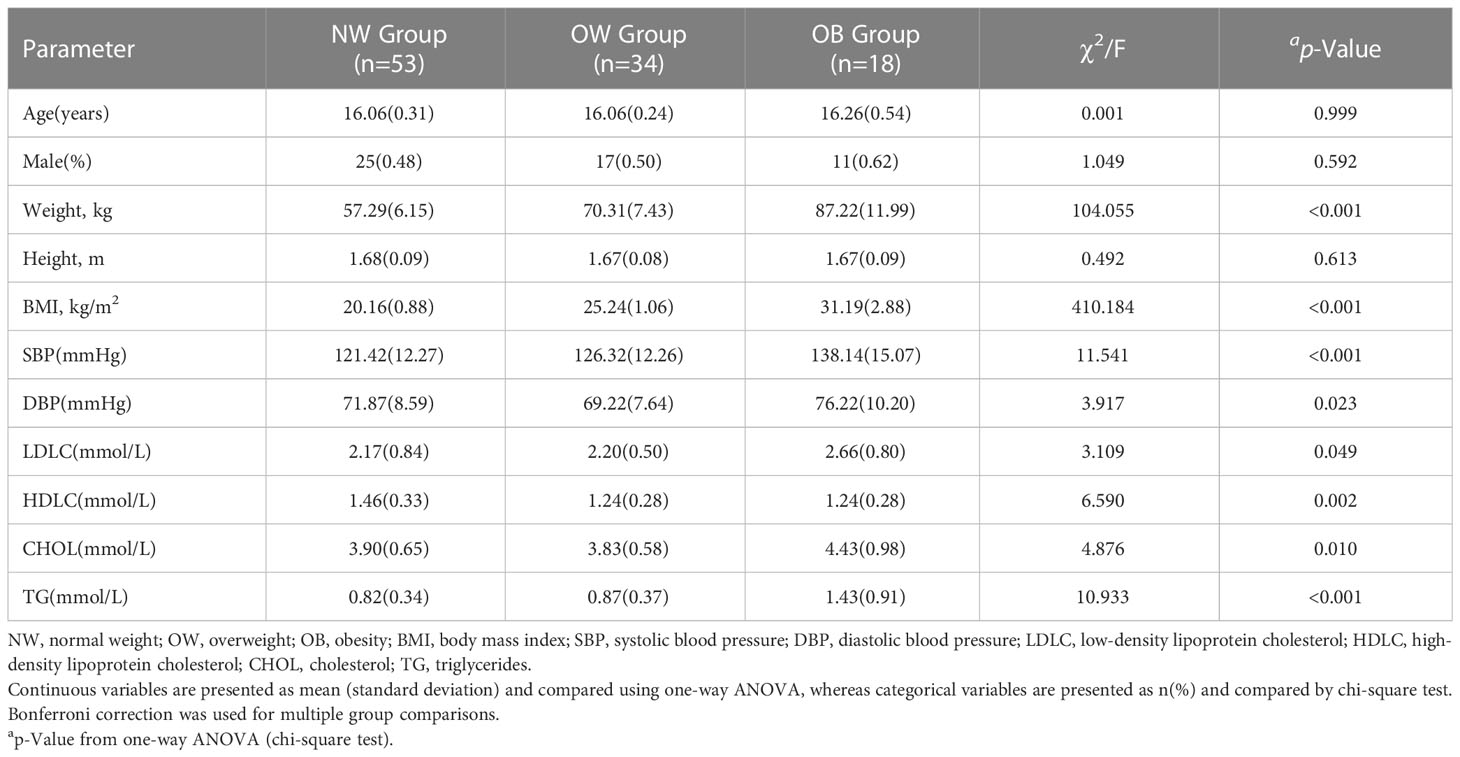
Table 1 Baseline characteristics of the studied population.
3.2 Untargeted metabolomics analysis
According to the OSI/SMMS software, 705 differential metabolites were identified. In the ESI-positive ion modes, 477 differential metabolites were identified in adolescents of normal weight and those with obesity. In the ESI-negative ion modes, 415 differential metabolites were identified (Supplementary Table 1). The OPLS-DA score plot obtained from the multivariate statistical analysis (Figures 2A, B) demonstrated that the normal-weight group and obesity group could be clearly distinguished. Subsequently, the results of the permutation test of the OPLS-DA model (Figures 2C, D) revealed that the positive ion mode was R2Y(cum) = 0.93, Q2Y(cum) = 0.57, while the negative ion mode was R2Y(cum) = 0.89, Q2Y(cum) = 0.58. These parameters demonstrated that the model was robust in terms of predictive performance without overfitting. In addition, we used the volcano plot to visualize the distribution of the differential metabolites between the groups (Figures 3A, B). Finally, the metabolic pathway analysis indicated that 705 metabolites were involved in 50 pathways. Through an impact-value screen (impact value > 0.1), nine pathways were selected for further analysis. The bubble plot (Figure 3C) also revealed that differential metabolites were predominantly enriched in the pathways of sphingolipid metabolism, purine metabolism, pyrimidine metabolism, steroid hormone biosynthesis, tryptophan biosynthesis, tyrosine biosynthesis, phenylalanine biosynthesis, inositol phosphate metabolism, and glycerophospholipid metabolism.
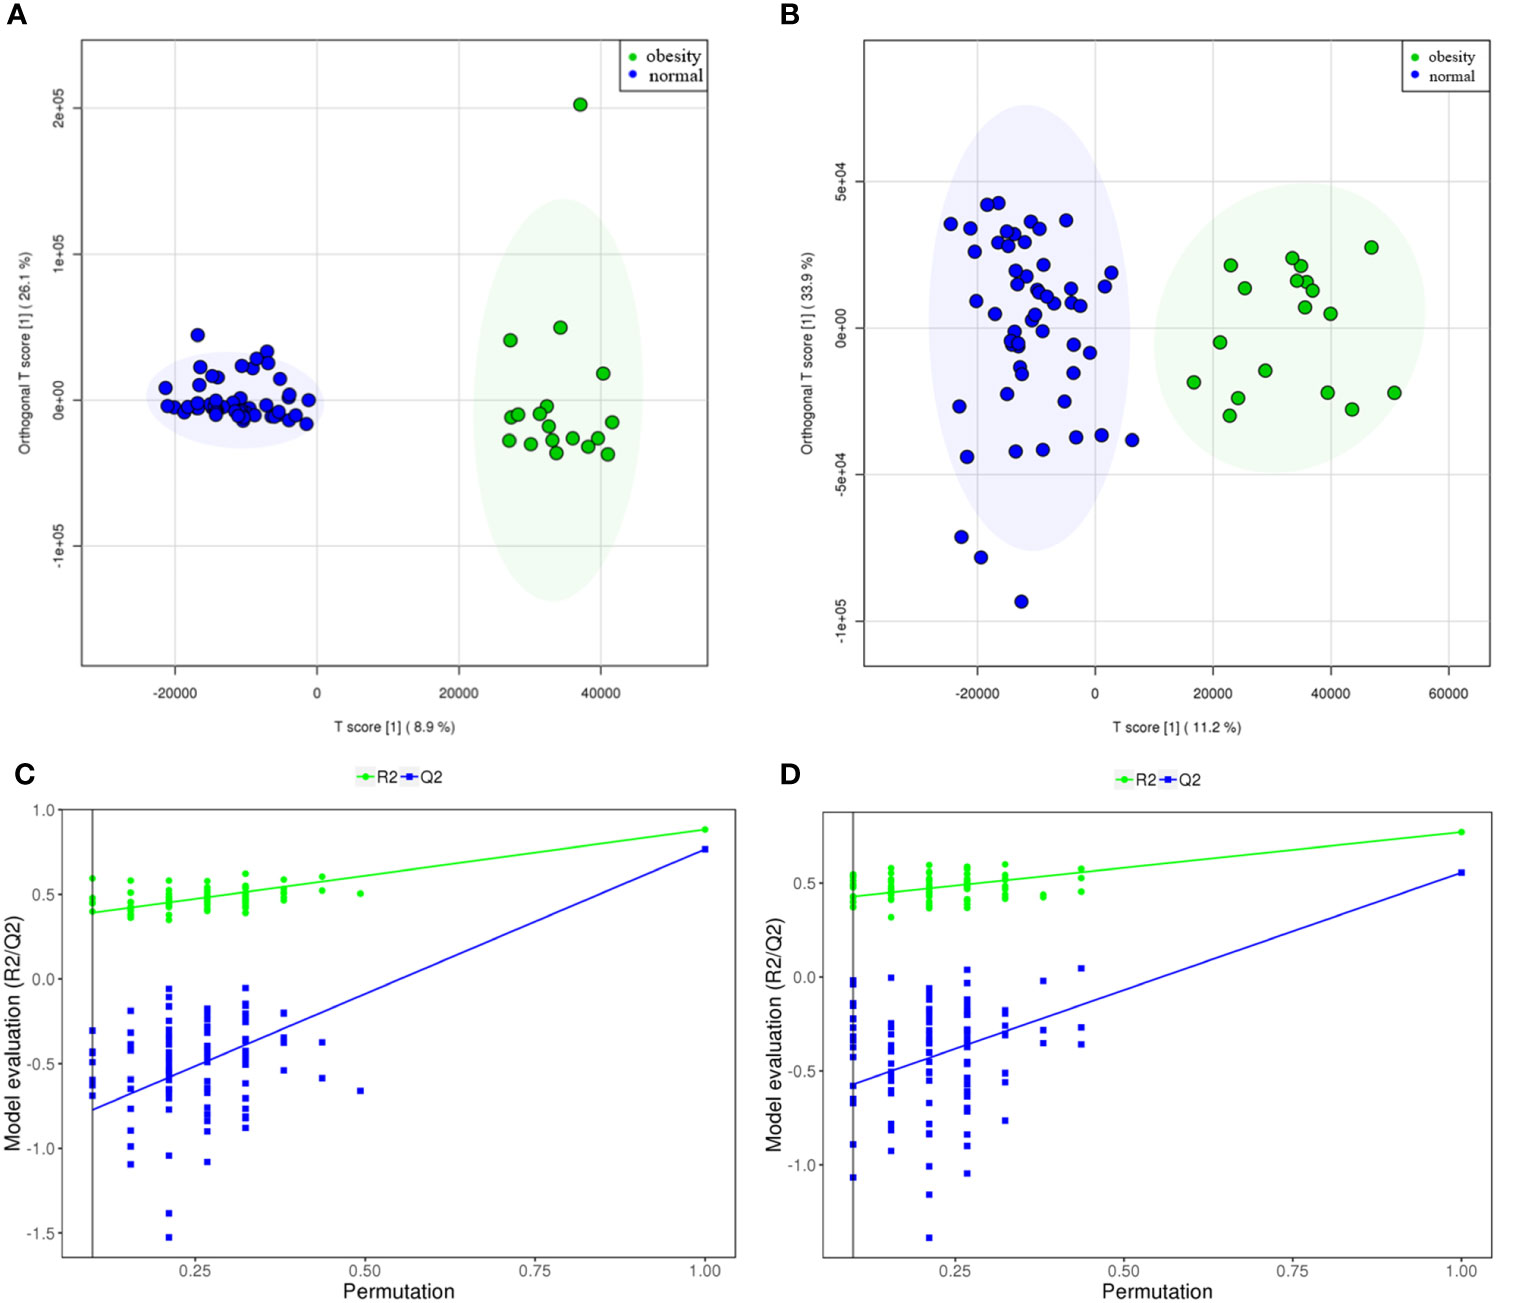
Figure 2 The metabolites from adolescents with obesity were compared to those from adolescents with normal weight. The scoring plot of the OPLS-DA model and the permutation test plot [positive ion mode (A, C), and negative ion mode (B, D). The permutation test plot can be explained as follows: the vertical axis represents the R2/Q2 value for the original model (far to the right) and of the cluster of Y-permuted models further to the left, which means that the positive ion mode was R2Y(cum)= 0.93, Q2Y(cum)= 0.57, while the negative ion mode was R2Y(cum)= 0.89, Q2Y(cum) =0.58.
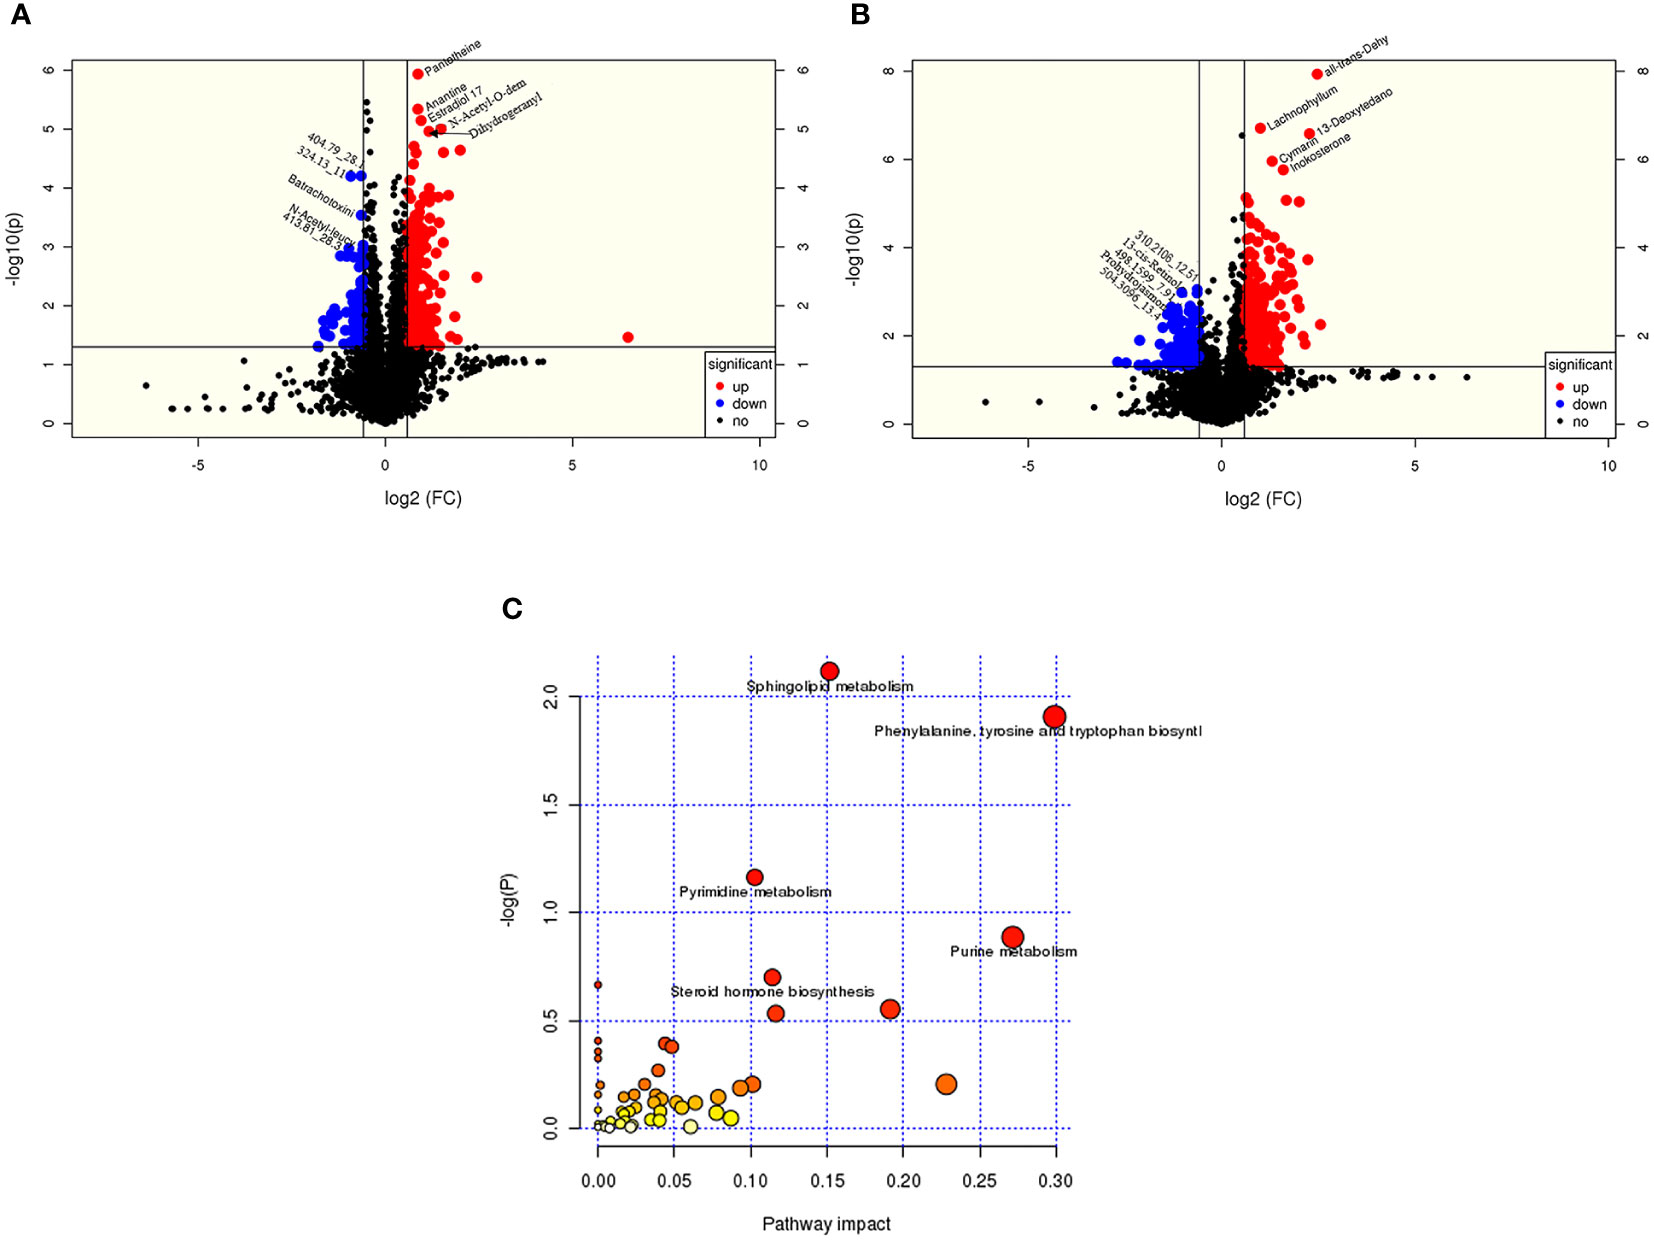
Figure 3 The metabolites from adolescents with obesity were compared to those from adolescents with normal weight. Positive ion (A) and negative (B) ion mode differential metabolite volcano map. The abscissa represented the fold change of the group compared to each substance (base 2 logarithm). The ordinate represented the P-value (base 10 logarithm), and pathway analysis (C) showed that differential metabolites are concentrated in sphingolipids, purines, and pyrimidine, and the biosynthesis of amphetamine acid, tyrosine, tryptophan, and steroid hormones.
3.3 Identification of differential metabolites
Based on P<0.05, VIP > 1.0, and impact value >0.1, we identified a total of 12 differential metabolites (including seven down-regulated and five up-regulated differential metabolites, Table 2). These selected differential metabolites presented a dose–response relationship with BMI by restricted cubic spline curves with three knots, and they were statistically significant differences in at least one group in a two-by-two comparison by boxplots (P<0.05/3) (Supplementary Figures 1, 2).
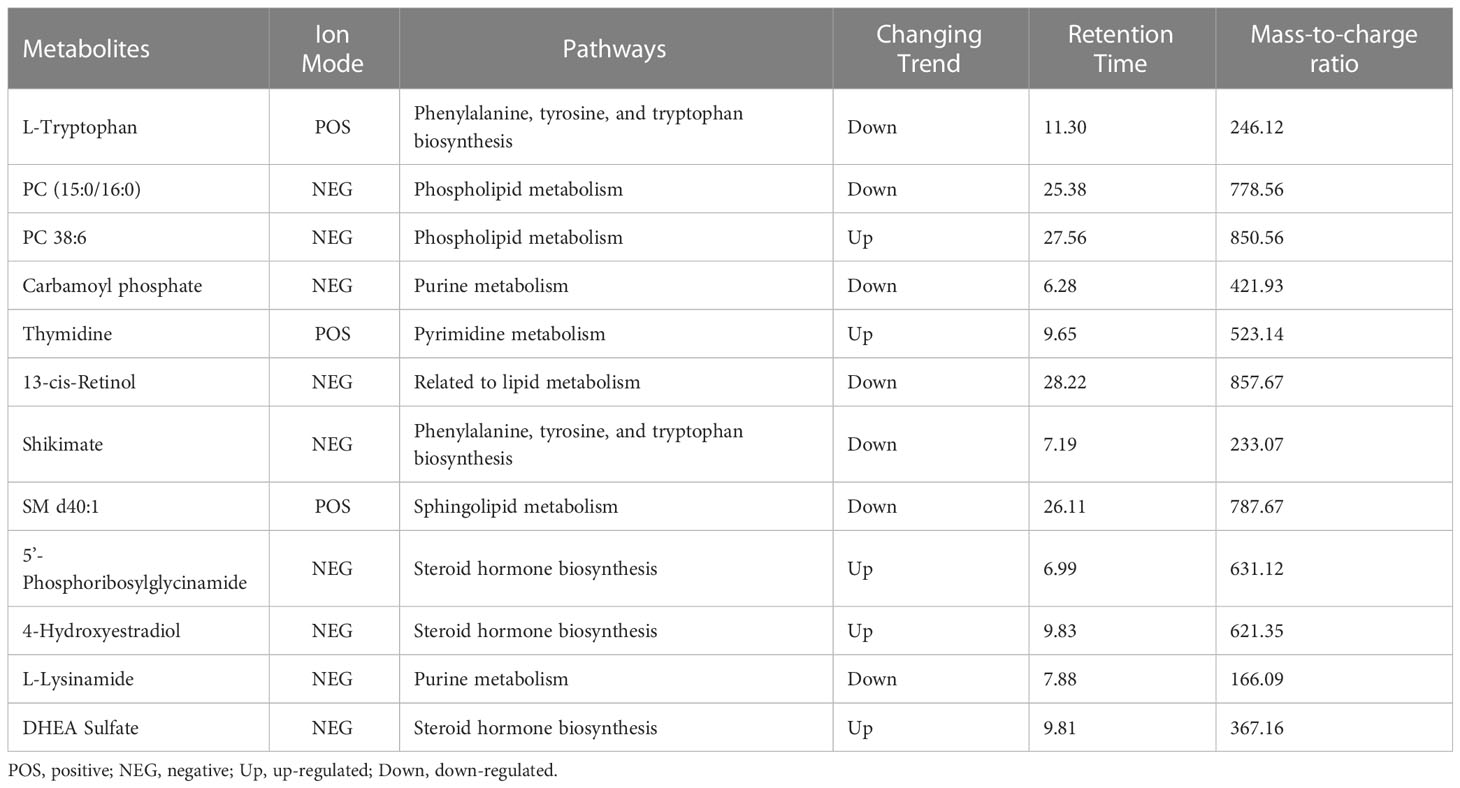
Table 2 Important plasma differential metabolites between obesity and normal-weight group.
Interestingly, we also found that PC 38:6 and 5´-phosphoribosylglycinamide had U-shaped associations with BMI, in which the inflection points of BMI were 23.07 kg/m2 and 21.97 kg/m2, respectively. Before the inflection point, PC 38:6 and 5´-phosphoglycinamide were negatively correlated with BMI; in contrast, they were positively correlated with BMI after the inflection point. P38:6 decreased before BMI reached 23.46 kg/m2 and then increased in the female participants (P for non-linear=0.005). However, this trend was not found among the male participants (P for non-linear=0.626). In the male participants, 5´-phosphoribosylglycinamide decreased before BMI reached 23.27 kg/m2 and then increased (P for non-linear=0.001). However, this trend was not found among the female participants (P for non-linear=0.674, Figure 4).
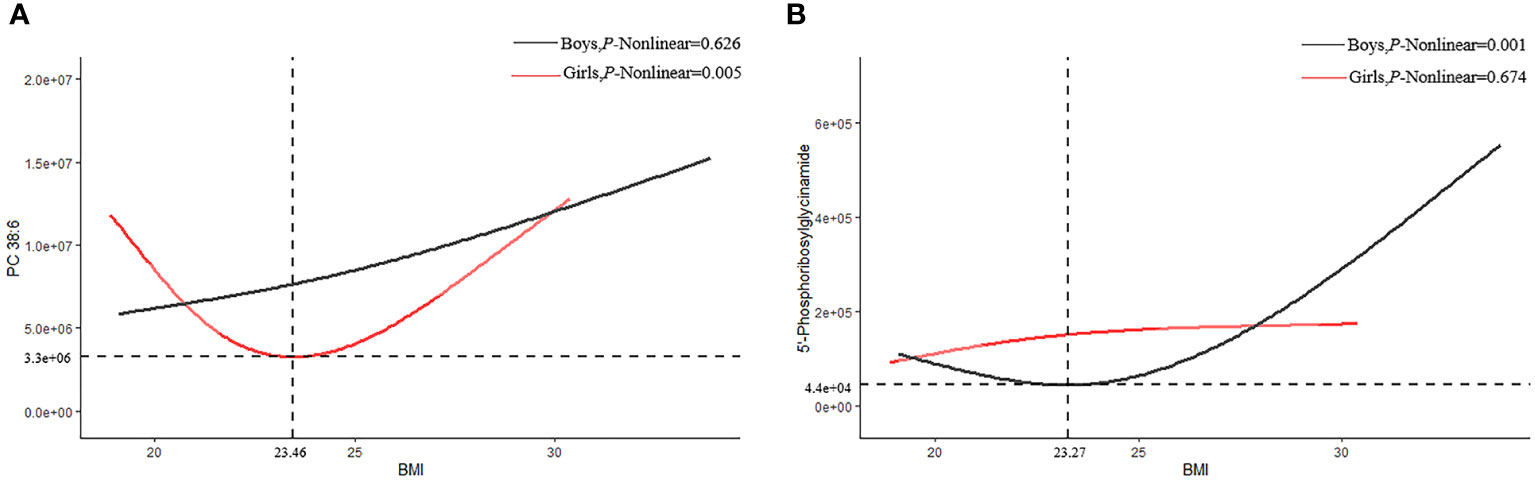
Figure 4 Restricted cubic splines of PC38:6 and 5'-Phosphoribosylglycinamid. (A) PC 38:6 (B) 5-phosphoribosylglycinamide.
3.4 Association between metabolite scores and hypertension in adolescent obesity
From the 12 differential metabolites, the logistic regression algorithm selected a parsimonious model of four metabolites, namely thymidine (OR=2.14, 95% CI=1.07-4.27, P=0.031), SM d40:1 (OR=0.53, 95% CI=0.29-0.99, P=0.047), 4-hydroxyestradiol (OR=2.16, 95% CI=1.16-4.03, P=0.015), and L-lysinamide (OR=0.44, 95% CI=0.24-0.79, P=0.006) (Figure 5). The OMS constructed from these four metabolites was positively associated with hypertension risk. In developing hypertension risk models adjusted for age, sex, and ethnicity, the odds ratio (95% CI) was 7.79 (2.13-28.47) for quintile 4 compared with quartile 1 of OMS. The linear trend across the quartiles was significant (P-trend=0.017). There was a 48% higher odd ratio of developing hypertension after multivariate adjustment associated with each SD increase in OMS when the scores were assessed continuously. Further adjustment of the lipid markers diminished this correlation, and the correlation vanished in quartile 3 compared with quartile 1 of the OMS (OR=2.83, 95% CI=0.68-11.84, Table 3).
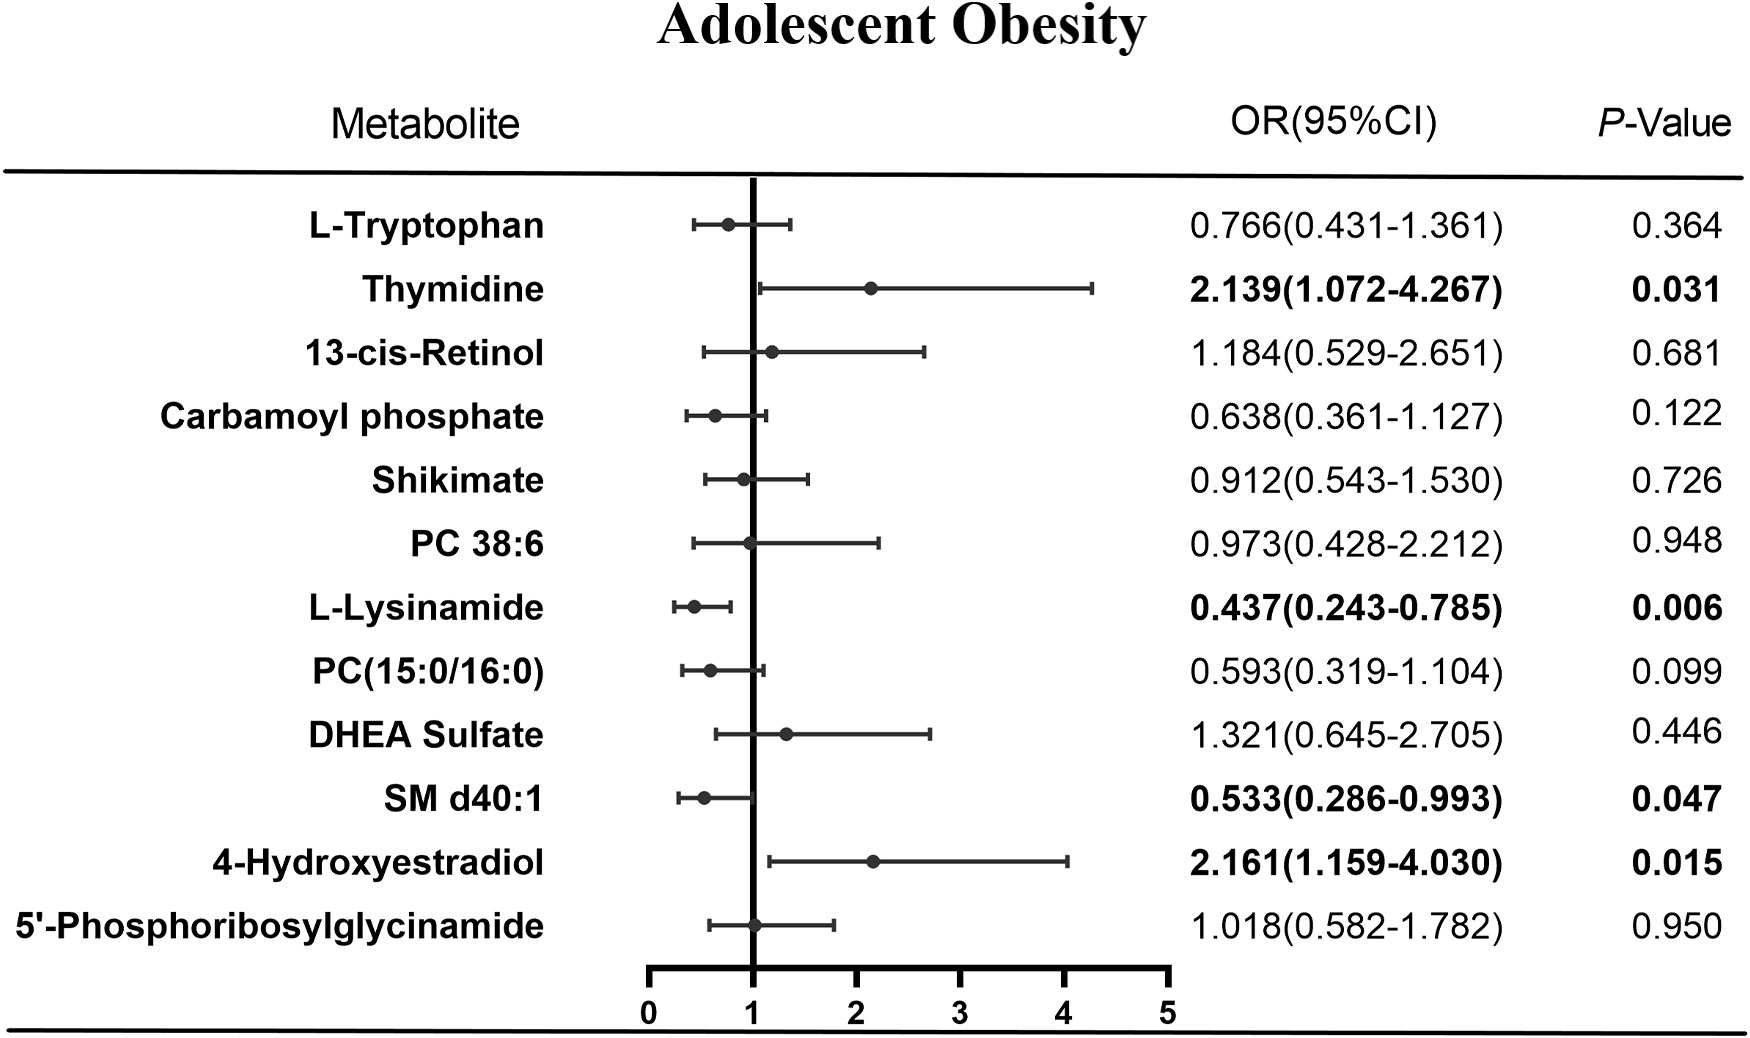
Figure 5 Results of logistic regression of metabolites and obesity.
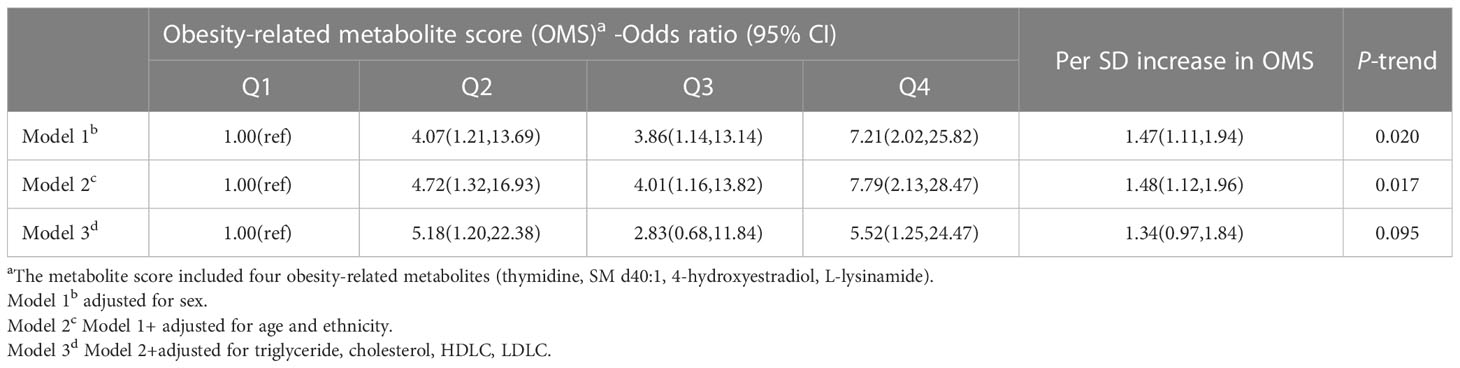
Table 3 Associations of the obesity-related metabolite score with hypertension risk.
Next, the stepwise multiple linear regression showed that after adjusting for age, sex, ethnicity, triglyceride, cholesterol, HDLC, LDLC, and OMS, the factors that independently influenced SBP were sex (β=-12.74,95% CI:-17.29,-8.20, P=0.001), triglyceride (β=7.39, 95% CI: 2.09-12.68, P=0.007), and OMS (β=1.88, 95% CI: 0.38-3.38, P=0.015, Supplementary Table 2), and the factor that independently influenced DBP was triglyceride (β=4.30, 95% CI:0.60-8.00, P=0.023, Supplementary Table 3); however, a similar association was not observed between OMS and DBP (P>0.05).
3.5 Mediation effect of obesity and hypertension risk
Compared with the normal-weight adolescents, the adolescents that were obese/overweight had a 23% higher hypertension risk (95% CI:1.09,1.39, Table 4). Approximately 47.5% of the association was mediated with OMS (OR: 1.18, 95%CI: 0.84,1.64). After adjusting for indicators of lipids, the relationship between obesity and the risk of developing hypertension was diminished, where the total effect of obesity and risk of developing hypertension was 1.19 (95%CI:1.02,1.37), and the indirect effect was 1.15 (95%CI: 0.80, 1.65). The OMS accounted for a comparable extent (48.6%) of the relationship between obesity and the risk of developing hypertension in the adjusted model.
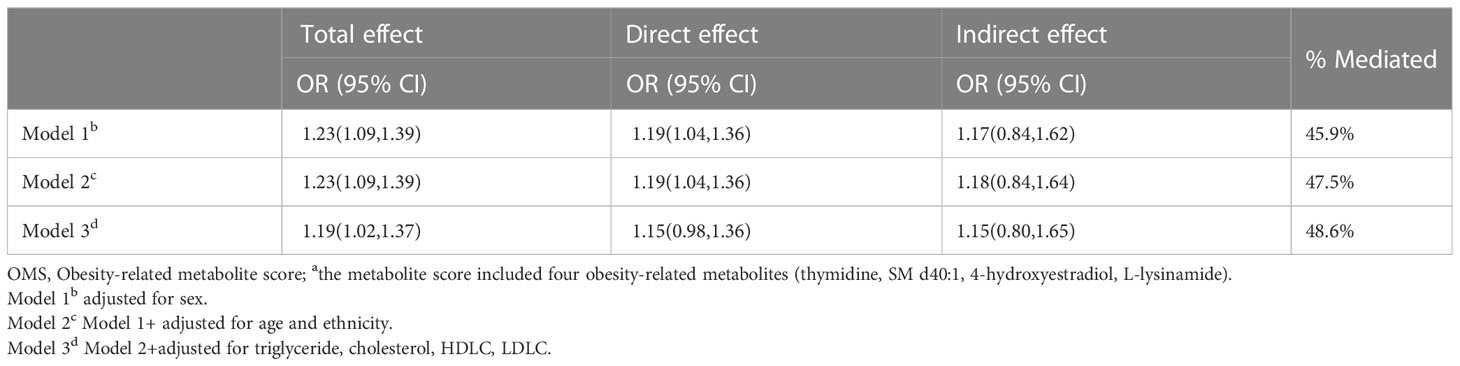
Table 4 Association of obesity with hypertension risk overall (total), mediated by OMSa (indirect) and independent of OMS (direct).
4 Discussion
The present study proposed that the OMS based on the four representative metabolites (thymidine, SM d40:1, 4-hydroxyestradiol, L-lysinamide) was associated with hypertension risk, and it was evaluated to potentially mediate the association between obesity and the risk of developing hypertension. These observational data demonstrated momentous mechanistic insights into how obesity might contribute to the risk of developing hypertension in adolescents through dysregulation of the lipid metabolism.
Previous studies have estimated the effects of obesity on plasma metabolites. An untargeted metabolomic study of 27 obese Caucasian adolescents and 15 sex- and age-matched normal-weight adolescents concluded that lipids and amino acids were the most important chemical classes among the different metabolites (17). Habibi et al. (18) reported that abnormalities of the sphingolipid and phospholipid metabolism were strongly associated with the lipid metabolism. Our findings showed that the sphingolipid metabolism was significantly abnormal in the obese adolescents, with their sphingolipid levels significantly lower than in the normal-weight/overweight groups, which is consistent with the results of a study in Chinese adolescents (19) but inconsistent with the study of Qatari adults (20). Purine metabolism and pyrimidine metabolism, which are highly related to the lipid metabolism, were also important metabolomic alterations in obese adolescents. This observation was consistent with the limited data available for children and adolescents (17, 21). The abnormalities of the aromatic amino acid metabolism resulted in lower levels of tyrosine, phenylalanine, and tryptophan in the obese adolescents compared to the normal-weight adolescents in this study, with significant trends in metabolites associated with the shikimate pathway in particular. However, several previous studies (22–24) have reported that elevated circulating Tyr and Phe levels have been frequently found in obesity, insulin resistance, or diabetes in humans. This may be explained by abnormalities in gut function, microbial populations, and diet structure in obese patients, resulting in metabolite alterations. In addition, we also found elevated levels of steroid hormones in the obese adolescents, which was consistent with several previous studies conducted on children and adolescents (17, 25, 26). Thus, in this study, the lipid metabolism and amino acid metabolism were proposed to be the most important metabolic pathways in obese adolescents.
Thymidine was found to be enriched in the pyrimidine metabolic pathway in this study. Gelpi et al. (27) demonstrated that prior exposure to thymidine analogs increased the risk of hypertension. Not only may thymidine analogs be irreversibly and deleteriously associated with visceral adipose tissue (VAT) accumulation, but the induced oxidative stress may lead to mild mitochondrial dysfunction in adipocytes (28). VAT was an independent risk factor for cardiovascular and metabolic diseases (29, 30). Our study showed that thymidine was up-regulated in obese adolescents and was associated with hypertension. The accumulation of VAT in obese adolescents stimulated the elevated thymidine level. Accumulation of VAT has been frequently found in the renin–angiotensin–aldosterone system (RAAS), free fatty acids, and insulin resistance (31), which were known risk factors for hypertension and abnormalities in the lipid metabolism.
SMs are components of lipid rafts, ceramide precursors, and other sphingolipid metabolites involved in the signaling pathway (32). Ceramide, which is produced in the endoplasmic reticulum, serves a central role in the sphingolipid metabolism (33). Ceramide synthases transfer a fatty acid from acyl-CoA to the SM scaffold to form dihydroceramide. Then, dihydroceramide desaturases (DES1 and DES2) are required to produce ceramide (34). In addition to its structural role in the cell membrane, ceramide elicits an initial cellular response to lipid burden during physiological or nutritional stress. In the long term, ceramide contributes to an understanding of the pathophysiology of type 2 diabetes, hypertension, and atherosclerosis. Notably, circulating ceramide levels have become a predictive biomarker for cardiometabolic complications (35–37). Our study showed that SM d40:1 was associated with hypertension in adolescents. This may be a result of elevated circulating lipid levels in adolescents with obesity leading to the accumulation of fat deposits in the vascular lumen and ectopic formation of ceramides in the vascular endothelial cells. Ceramide disrupts the interaction between protein phosphatase 2A (PP2A) and 2 of PP2A (I2PP2A), which results in an increased association between PP2A and eNOS (38). This impairs endothelium-dependent vasorelaxation and exacerbates vasoconstriction.
L-lysinamide, one of the products of L-lysine metabolism, was enriched in the purine metabolic pathway. Alterations in the lysine metabolism were strongly associated with hypertensive patients on low- or high-sodium diets (39–41). A urine metabolomics study in the Framingham cohort showed that high levels of lysine were responsible for the protective effect of hypertension (42). Lewis et al. (43) concluded that purines and purine products were closely associated with right ventricular–pulmonary vascular dysfunction. Several previous studies also demonstrated that the correlation between the final product of the purine metabolism (i.e., uric acid) and hypertension had been sufficiently described in children and adolescents, with mechanisms that primarily implicated oxidative stress and intracellular urate activity (44–46). Our study showed that L-lysinamide was associated with hypertension in adolescents. On the one hand, due to the high intake of purine food in adolescents with obesity, the purine metabolism was dysfunctional and induced oxidative stress-promoted endothelial dysfunction, vascular remodeling, and inflammation, resulting in vascular injury. On the other hand, due to abnormal sphingolipid metabolism, there was obvious insulin resistance in these obese adolescents, leading to abnormal purine metabolism and high uric acid (47, 48).
4-hydroxyestradiol is the most active of the endogenous estrogen metabolites. Adler et al. (49) reported that estrogen exposure increased endothelial-dependent vasodilation in lean healthy women. Activation of estrogen receptors α and β in the endothelial cells causes the production of endothelial nitric oxide synthase (eNOS) and the expression of genes encoding eNOS (50). Khan et al. (51) reported that abnormal estradiol concentrations may alter the normal function of insulin, which could lead to insulin resistance in patients. Estradiol deficiency and RAAS imbalance increased the incidence of hypertension, arrhythmia, and heart failure (52). Our study showed that 4-hydroxyestradiol was up-regulated in adolescents with obesity and was associated with hypertension. An increase in 4-hydroxyestradiol may prevent the effective stimulation of endothelial cells, resulting in a loss of intravascular homeostasis and vasoconstriction.
The lipid profile of obesity identified in this study has previously been found to predict the development of hypertension risk, diabetes, and insulin resistance (53–55). Consistent with prior studies, our findings demonstrate that the OMS constructed from obesity-based differential metabolites, three of which were well-distributed in the lipid metabolism (thymidine, SM d40:1, L-lysinamide), was strongly correlated with developing hypertension risk and positively correlated with systolic blood pressure, but it did not demonstrate a similar relationship with diastolic blood pressure, which was also an interesting finding. The mediated analysis further illustrated the effect of metabolomic alterations related to obesity in the development of hypertension, with the OMS accounting for approximately 48.6% of the correlation between obesity and the risk of developing hypertension. Dysregulation of the lipid metabolism may be an important mechanism by which obesity increases the risk of developing hypertension. Thus, it is important to find early sensitive biomarkers in obese adolescents that can identify hypertension. In the future, it would be interesting to explore and validate whether early intervention in adolescents with obesity may be a useful way to reduce the occurrence of hypertension.
The present study also had several limitations. First, the main limitation of the present study was the cross-sectional study, which could not derive a clear causal relationship between obesity-related metabolite scores and the risk of developing hypertension in adolescents. Therefore, the present study needs to be validated in other independent cohort studies. Second, alterations in some metabolites (e.g., lipids, amino acids, and steroid hormones) were susceptible to age-related effects. This can result in the deviation of the early identification of metabolic markers of hypertension. Third, dietary structure alterations also influence the expression of metabolites, especially high-fat diets, but the relevant information was inadequate. Therefore, our findings require targeted metabolomics to validate the effect of the gut microbiota on the metabolites. Fourth, all the adolescents in this study were from Shenyang, China, with a limited sample size. Therefore, our findings may not be applicable to the whole Chinese population. Finally, a population-based independent prospective cohort may be needed to verify the results of our predictive model.
5 Conclusions
In conclusion, it was identified that thymidine, SM d40:1, 4-hydroxyestradiol, and L-lysinamide in adolescents with obesity were associated with hypertension. These four differential metabolites combined might be also used to predict the risk of developing hypertension. Obesity may increase the hypertension risk through the dysregulation of the lipid metabolism. These findings can provide sensitive biomarkers for the early recognition of hypertension in obese adolescents and scientific evidence for the primary prevention of hypertension in adults.
Data availability statement
All datasets were included in the article/Supplementary Material in this study. Further used and analyzed can be available from the corresponding author upon reasonable request.
Ethics statement
The studies involving human participants were reviewed and approved by the ethics committee of Dalian Medical University. Written informed consent to participate in this study was provided by the participants’ legal guardian/next of kin.
Author contributions
Z-PW, WW, X-FL, and XC conceived the study. ZW, WW, YC, J-YC, SL, M-DH, and HZ collected data for all adolescent clinical information. Z-PW, XC, WW, and X-FL performed the statistical analyses. XC, WW, and X-FL supervised the study. Z-PW completed the first draft of the manuscript. All authors contributed to the article and read and approved the submitted final manuscript.
Funding
This work was supported by the National Natural Science Foundation of China (grant number 81602871) and Doctoral Start-up Foundation of Liaoning Province (grant number 20170520127).
Acknowledgments
The authors are grateful to the Dalian Chem Data Solution Information Technology Co. Ltd for providing non-targeted metabolic services.
Conflict of interest
The authors declare that the research was conducted in the absence of any commercial or financial relationships that could be construed as a potential conflict of interest.
Publisher’s note
All claims expressed in this article are solely those of the authors and do not necessarily represent those of their affiliated organizations, or those of the publisher, the editors and the reviewers. Any product that may be evaluated in this article, or claim that may be made by its manufacturer, is not guaranteed or endorsed by the publisher.
Supplementary material
The Supplementary Material for this article can be found online at: https://www.frontiersin.org/articles/10.3389/fendo.2023.1172290/full#supplementary-material
References
1. Cardel MI, Atkinson MA, Taveras EM, Holm J-C, Kelly AS. Obesity treatment among adolescents: a review of current evidence and future directions. JAMA Pediatr (2020) 174(6):609–17. doi: 10.1001/jamapediatrics.2020.0085
2. Di Cesare M, Sorić M, Bovet P, Miranda JJ, Bhutta Z, Stevens GA, et al. The epidemiological burden of obesity in childhood: a worldwide epidemic requiring urgent action. BMC Med (2019) 17(1):212. doi: 10.1186/s12916-019-1449-8
3. Yang L, Bovet P, Ma C, Zhao M, Liang Y, Xi B. Prevalence of underweight and overweight among young adolescents aged 12-15 years in 58 low-income and middle-income countries. Pediatr Obes (2019) 14(3):e12468. doi: 10.1111/ijpo.12468
4. Pan X-F, Wang L, Pan A. Epidemiology and determinants of obesity in China. Lancet Diabetes Endocrinol (2021) 9(6):373–92. doi: 10.1016/S2213-8587(21)00045-0
5. Chen Y, Cai C, Tan J, Lei X, Chen Q, Zhang J, et al. High-risk growth trajectory related to childhood Overweight/Obesity and its predictive model at birth. J Clin Endocrinol Metab (2022) 107(10):e4015–26. doi: 10.1210/clinem/dgac441
6. Mansell T, Magnussen CG, Nuotio J, Laitinen TT, Harcourt BE, Bekkering S, et al. Decreasing severity of obesity from early to late adolescence and young adulthood associates with longitudinal metabolomic changes implicated in lower cardiometabolic disease risk. Int J Obes (Lond) (2022) 46(3):646–54. doi: 10.1038/s41366-021-01034-7
7. Baker JL, Olsen LW, Sørensen TIA. Childhood body-mass index and the risk of coronary heart disease in adulthood. N Engl J Med (2007) 357(23):2329–37. doi: 10.1056/NEJMoa072515
8. Dong Y, Song Y, Zou Z, Ma J, Dong B, Prochaska JJ. Updates to pediatric hypertension guidelines: influence on classification of high blood pressure in children and adolescents. J Hypertens (2019) 37(2):297–306. doi: 10.1097/HJH.0000000000001903
9. Li J, Yang X, Zhou X, Cai J. The role and mechanism of intestinal flora in blood pressure regulation and hypertension development. Antioxid Redox Signal (2021) 34(10):811–30. doi: 10.1089/ars.2020.8104
10. Nikolic SB, Sharman JE, Adams MJ, Edwards LM. Metabolomics in hypertension. J Hypertens (2014) 32(6):1159–69. doi: 10.1097/HJH.0000000000000168
11. Laíns I, Gantner M, Murinello S, Lasky-Su JA, Miller JW, Friedlander M, et al. Metabolomics in the study of retinal health and disease. Prog Retin Eye Res (2019) 69:57–79. doi: 10.1016/j.preteyeres.2018.11.002
12. Rangel-Huerta OD, Pastor-Villaescusa B, Gil A. Are we close to defining a metabolomic signature of human obesity? a systematic review of metabolomics studies. Metabolomics (2019) 15(6):93. doi: 10.1007/s11306-019-1553-y
13. Huo Y-X, Wei W, Liu Y, Ma Y-N, Tao J-M, Wang N-N, et al. Serum cystatin c levels are associated with obesity in adolescents aged 14-17 years. Front Endocrinol (Lausanne) (2022) 13:816201. doi: 10.3389/fendo.2022.816201
14. Group of China Obesity Task Force. Body mass index reference norm for screening overweight and obesity in Chinese children and adolescents. Zhonghua Liu Xing Bing Xue Za Zhi (2004) 25(2):97–102.
15. National High Blood Pressure Education Program Working Group on High Blood Pressure in Children and Adolescents. The fourth report on the diagnosis, evaluation, and treatment of high blood pressure in children and adolescents. Pediatrics (2004) 114(2 Suppl 4th Report):555–76.
16. Mahadevan S, Shah SL, Marrie TJ, Slupsky CM. Analysis of metabolomic data using support vector machines. Anal Chem (2008) 80(19):7562–70. doi: 10.1021/ac800954c
17. Szczerbinski L, Wojciechowska G, Olichwier A, Taylor MA, Puchta U, Konopka P, et al. Untargeted metabolomics analysis of the serum metabolic signature of childhood obesity. Nutrients (2022) 14(1):214. doi: 10.3390/nu14010214
18. Habibi J, DeMarco VG, Hulse JL, Hayden MR, Whaley-Connell A, Hill MA, et al. Inhibition of sphingomyelinase attenuates diet - induced increases in aortic stiffness. J Mol Cell Cardiol (2022) 167:32–9. doi: 10.1016/j.yjmcc.2022.03.006
19. Yin R, Wang X, Li K, Yu K, Yang L. Lipidomic profiling reveals distinct differences in plasma lipid composition in overweight or obese adolescent students. BMC Endocr Disord (2021) 21(1):201. doi: 10.1186/s12902-021-00859-7
20. Yousri NA, Suhre K, Yassin E, Al-Shakaki A, Robay A, Elshafei M, et al. Metabolic and metabo-clinical signatures of type 2 diabetes, obesity, retinopathy, and dyslipidemia. Diabetes (2022) 71(2):184–205. doi: 10.2337/db21-0490
21. Liu C, Gu C, Huang W, Sheng X, Du J, Li Y. Targeted uplc-Ms/Ms high-throughput metabolomics approach to assess the purine and pyrimidine metabolism. J Chromatogr B Analyt Technol BioMed Life Sci (2019) 1113:98–106. doi: 10.1016/j.jchromb.2019.03.008
22. Handoko HY, Boyle GM, Ferguson B, Muller HK, Soyer HP, Walker GJ. Plasticity of melanoma in vivo: murine lesions resulting from Trp53, but not Cdk4 or arf deregulation, display neural transdifferentiation. Pigment Cell Melanoma Res (2013) 26(5):731–4. doi: 10.1111/pcmr.12124
23. Newgard CB, An J, Bain JR, Muehlbauer MJ, Stevens RD, Lien LF, et al. A branched-chain amino acid-related metabolic signature that differentiates obese and lean humans and contributes to insulin resistance. Cell Metab (2009) 9(4):311–26. doi: 10.1016/j.cmet.2009.02.002
24. Mohorko N, Petelin A, Jurdana M, Biolo G, Jenko-Pražnikar Z. Elevated serum levels of cysteine and tyrosine: early biomarkers in asymptomatic adults at increased risk of developing metabolic syndrome. BioMed Res Int (2015) 2015:418681. doi: 10.1155/2015/418681
25. Gawlik AM, Shmoish M, Hartmann MF, Wudy SA, Hochberg Ze. Steroid metabolomic signature of insulin resistance in childhood obesity. Diabetes Care (2020) 43(2):405–10. doi: 10.2337/dc19-1189
26. Sumińska M, Podgórski R, Fichna P, Fichna M. Steroid metabolism in children and adolescents with obesity and insulin resistance: altered Srd5a and 20α/20βhsd activity. Front Endocrinol (Lausanne) (2021) 12:759971. doi: 10.3389/fendo.2021.759971
27. Gelpi M, Afzal S, Fuchs A, Lundgren J, Knudsen AD, Drivsholm N, et al. Prior exposure to thymidine analogs and didanosine is associated with long-lasting alterations in adipose tissue distribution and cardiovascular risk factors. AIDS (Lond Engl) (2019) 33(4):675–83. doi: 10.1097/QAD.0000000000002119
28. Caron-Debarle M, Lagathu C, Boccara F, Vigouroux C, Capeau J. Hiv-associated lipodystrophy: from fat injury to premature aging. Trends Mol Med (2010) 16(5):218–29. doi: 10.1016/j.molmed.2010.03.002
29. Karlsson T, Rask-Andersen M, Pan G, Höglund J, Wadelius C, Ek WE, et al. Contribution of genetics to visceral adiposity and its relation to cardiovascular and metabolic disease. Nat Med (2019) 25(9):1390–5. doi: 10.1038/s41591-019-0563-7
30. Tchernof A, Després J-P. Pathophysiology of human visceral obesity: an update. Physiol Rev (2013) 93(1):359–404. doi: 10.1152/physrev.00033.2011
31. Srinivasa S, Fitch KV, Wong K, Torriani M, Mayhew C, Stanley T, et al. Raas activation is associated with visceral adiposity and insulin resistance among hiv-infected patients. J Clin Endocrinol Metab (2015) 100(8):2873–82. doi: 10.1210/jc.2015-1461
32. Bieberich E. Sphingolipids and lipid rafts: novel concepts and methods of analysis. Chem Phys Lipids (2018) 216:114–31. doi: 10.1016/j.chemphyslip.2018.08.003
33. Bandet CL, Mahfouz R, Véret J, Sotiropoulos A, Poirier M, Giussani P, et al. Ceramide transporter cert is involved in muscle insulin signaling defects under lipotoxic conditions. Diabetes (2018) 67(7):1258–71. doi: 10.2337/db17-0901
34. Zelnik ID, Rozman B, Rosenfeld-Gur E, Ben-Dor S, Futerman AH. A stroll down the cers lane. Adv Exp Med Biol (2019) 1159:49–63. doi: 10.1007/978-3-030-21162-2_4
35. Summers SA, Chaurasia B, Holland WL. Metabolic messengers: ceramides. Nat Metab (2019) 1(11):1051–8. doi: 10.1038/s42255-019-0134-8
36. Choi RH, Tatum SM, Symons JD, Summers SA, Holland WL. Ceramides and other sphingolipids as drivers of cardiovascular disease. Nat Rev Cardiol (2021) 18(10):701–11. doi: 10.1038/s41569-021-00536-1
37. Poss AM, Summers SA. Too much of a good thing? an evolutionary theory to explain the role of ceramides in nafld. Front Endocrinol (Lausanne) (2020) 11:505. doi: 10.3389/fendo.2020.00505
38. Bharath LP, Ruan T, Li Y, Ravindran A, Wan X, Nhan JK, et al. Ceramide-initiated protein phosphatase 2a activation contributes to arterial dysfunction in vivo. Diabetes (2015) 64(11):3914–26. doi: 10.2337/db15-0244
39. Cheng Y, Song H, Pan X, Xue H, Wan Y, Wang T, et al. Urinary metabolites associated with blood pressure on a low- or high-sodium diet. Theranostics (2018) 8(6):1468–80. doi: 10.7150/thno.22018
40. Rinschen MM, Palygin O, El-Meanawy A, Domingo-Almenara X, Palermo A, Dissanayake LV, et al. Accelerated lysine metabolism conveys kidney protection in salt-sensitive hypertension. Nat Commun (2022) 13(1):4099. doi: 10.1038/s41467-022-31670-0
41. Chen L, He FJ, Dong Y, Huang Y, Harshfield GA, Zhu H. Sodium reduction, metabolomic profiling, and cardiovascular disease risk in untreated black hypertensives. Hypertension (Dallas Tex 1979) (2019) 74(1):194–200. doi: 10.1161/HYPERTENSIONAHA.119.12880
42. McMahon GM, Hwang S-J, Clish CB, Tin A, Yang Q, Larson MG, et al. Urinary metabolites along with common and rare genetic variations are associated with incident chronic kidney disease. Kidney Int (2017) 91(6):1426–35. doi: 10.1016/j.kint.2017.01.007
43. Lewis GD, Ngo D, Hemnes AR, Farrell L, Domos C, Pappagianopoulos PP, et al. Metabolic profiling of right ventricular-pulmonary vascular function reveals circulating biomarkers of pulmonary hypertension. J Am Coll Cardiol (2016) 67(2):174–89. doi: 10.1016/j.jacc.2015.10.072
44. Montezano AC, Dulak-Lis M, Tsiropoulou S, Harvey A, Briones AM, Touyz RM. Oxidative stress and human hypertension: vascular mechanisms, biomarkers, and novel therapies. Can J Cardiol (2015) 31(5):631–41. doi: 10.1016/j.cjca.2015.02.008
45. Yu Z, Wang L, Wu S, Xue W, Zhao W, Li J. Potential mechanisms of the anti-hypertensive effects of rvpsl on spontaneously hypertensive rats using non-targeted serum metabolomics. Food Funct (2021) 12(18):8561–9. doi: 10.1039/d1fo01546j
46. Zhao H, Zhang Y, Liu B, Zhang L, Bao M, Li L, et al. A pilot study to identify the longitudinal serum metabolite profiles to predict the development of hyperuricemia in essential hypertension. Clin Chim Acta (2020) 510:466–74. doi: 10.1016/j.cca.2020.08.002
47. Kojta I, Chacińska M, Błachnio-Zabielska A. Obesity, bioactive lipids, and adipose tissue inflammation in insulin resistance. Nutrients (2020) 12(5):1305. doi: 10.3390/nu12051305
48. Meikle PJ, Summers SA. Sphingolipids and phospholipids in insulin resistance and related metabolic disorders. Nat Rev Endocrinol (2017) 13(2):79–91. doi: 10.1038/nrendo.2016.169
49. Adler TE, Usselman CW, Takamata A, Stachenfeld NS. Blood pressure predicts endothelial function and the effects of ethinyl estradiol exposure in young women. Am J Physiol Heart Circ Physiol (2018) 315(4):H925–33. doi: 10.1152/ajpheart.00188.2018
50. Buchner NJ, Rump LC. Oral contraceptives and endothelial function: harm or benefit? J Hypertens (2003) 21(12):2227–30. doi: 10.1097/00004872-200312000-00005
51. Khan WA, Malik A, Khan MWA. Estrogenization of insulin by catecholestrogen produced high affinity autoantibodies and altered the normal function of insulin in type 1 diabetes. Life Sci (2020) 256:117910. doi: 10.1016/j.lfs.2020.117910
52. Gersh FL, O'Keefe JH, Lavie CJ, Henry BM. The renin-Angiotensin-Aldosterone system in postmenopausal women: the promise of hormone therapy. Mayo Clin Proc (2021) 96(12):3130–41. doi: 10.1016/j.mayocp.2021.08.009
53. Pi H, Xia L, Ralph DD, Rayner SG, Shojaie A, Leary PJ, et al. Metabolomic signatures associated with pulmonary arterial hypertension outcomes. Circ Res (2023) 132(3):254–66. doi: 10.1161/CIRCRESAHA.122.321923
54. Morze J, Wittenbecher C, Schwingshackl L, Danielewicz A, Rynkiewicz A, Hu FB, et al. Metabolomics and type 2 diabetes risk: an updated systematic review and meta-analysis of prospective cohort studies. Diabetes Care (2022) 45(4):1013–24. doi: 10.2337/dc21-1705
Keywords: adolescent obesity, untargeted liquid chromatography-mass spectrometry analysis, hypertension, systolic blood pressure, diastolic blood pressure
Citation: Wu Z-P, Wei W, Cheng Y, Chen J-Y, Liu Y, Liu S, Hu M-D, Zhao H, Li X-F and Chen X (2023) Altered adolescents obesity metabolism is associated with hypertension: a UPLC-MS-based untargeted metabolomics study. Front. Endocrinol. 14:1172290. doi: 10.3389/fendo.2023.1172290
Received: 23 February 2023; Accepted: 19 April 2023;
Published: 09 May 2023.
Edited by:
Charalambos Fotakis, National Hellenic Research Foundation, GreeceReviewed by:
Zala Jenko Pražnikar, University of Primorska, SloveniaWeidong Dai, Tea Research Institute (CAAS), China
Copyright © 2023 Wu, Wei, Cheng, Chen, Liu, Liu, Hu, Zhao, Li and Chen. This is an open-access article distributed under the terms of the Creative Commons Attribution License (CC BY). The use, distribution or reproduction in other forums is permitted, provided the original author(s) and the copyright owner(s) are credited and that the original publication in this journal is cited, in accordance with accepted academic practice. No use, distribution or reproduction is permitted which does not comply with these terms.
*Correspondence: Xin Chen, Y2hlbnhAZG11LmVkdS5jbg==