 Carolina Moreno1,2,3†‡
 Otília C. d’Almeida1,3†‡
 Leonor Gomes1,2,3‡Isabel Paiva2‡
 Miguel Castelo-Branco1,3*‡
- 1Faculty of Medicine, University of Coimbra, Coimbra, Portugal
- 2Department of Endocrinology, Coimbra University and Hospital Centre (CHUC), Coimbra, Portugal
- 3Coimbra Institute for Biomedical Imaging and Translational Research (CIBIT), Institute of Nuclear Sciences Applied to Health (ICNAS), University of Coimbra, Coimbra, Portugal
Objective: Brain atrophy has been consistently associated with type 2 diabetes, beginning in early stages of dysglycemia, independently from micro and macrovascular complications. On the contrary, physical activity relates with larger brain volumes. Our aim is to assess the influence of regular physical activity on brain volumes in people with type 2 diabetes.
Methods: A cross-sectional multimodal evaluation with 3T MRI was performed on 170 individuals: 85 individuals with type 2 diabetes and 85 controls. They underwent clinical examination, blood sampling and 3T MRI. Brain volumes (mm3) were estimated using FreeSurfer 7. Physical activity duration was self-reported by the participants as the number of hours of physical activity per week for at least the previous 6 months. Statistical analysis was performed with IBM SPSS 27.
Results: People with type 2 diabetes had significantly lower cortical and subcortical volumes, adjusted for age and individual intracranial volume, comparing to controls. Regression analysis showed that within type 2 diabetes group, lower gray matter volumes were associated with lesser physical activity duration (hours/week), independently from HbA1c. Moreover, there were significant moderate positive correlations between regular physical activity duration and gray matter volumes of cortical and subcortical subregions, specifically in the diabetes group.
Conclusions: This study reveals a putative beneficial effect of regular physical activity independently of glycemic control, as assessed by HbA1c, which might contribute to reduce the negative impact of type 2 diabetes in the brain.
1 Introduction
Type 2 diabetes is associated with several brain structural abnormalities, mainly gray matter volume reduction, especially in older adults (1). These brain changes might be independent from microvascular and macrovascular complications, and precede neurological impairment (2). Alongside with vascular lesions (3), numerous mechanisms have been implicated in diabetes-associated neural injury, such as accumulation of advanced glycation end products (4), neuronal insulin resistance (5) and neuroinflammation (6). However, the impact of physical activity modulating these risk factors is not fully understood. Taking into consideration the ageing population and rapidly progressive prevalence of type 2 diabetes (7), it is imperative to identify the mechanisms underlying the links between diabetes and brain diseases and potential early interventions.
Several studies have investigated associations between physical activity and brain morphology. Despite some heterogeneity in findings, the majority suggested that physical activity relates with larger brain volumes (less brain atrophy) in older adults (8–10). Yet, there is a scarcity of data regarding the impact of regular physical activity on functional and structural brain health parameters of type 2 diabetes.
Review papers by Callisaya et al. and Bertram et al. highlight a possible effect of physical activity preventing or delaying dementia. The mechanisms hypothesized vary between improvement of endothelial function, attenuation of oxidative stress and increase of testosterone levels (11, 12). A systematic review by Podolski et al. with over 7000 individuals with type 2 diabetes concluded that physical activity could potentially contribute to improvement of cognitive performance (13). However, no link with brain morphometry was established.
The putative influence of physical activity on type 2 diabetes-related brain structural abnormalities is interesting, as it may precede cognitive decline and could play a key role in delaying neurodegenerative processes (14). In the present study, a cross-sectional case-control investigation was conducted in order to explore regional cerebral correlates, particularly the influence of regular physical activity on brain volumes of type 2 diabetes individuals.
2 Methods
2.1 Study design
This study was approved by the Ethics Commission of the Faculty of Medicine of the University of Coimbra and followed the tenets of the Declaration of Helsinki. Written informed consent was obtained from all participants after research procedures had been fully explained. Individuals with type 2 diabetes were recruited from the Endocrinology Department of Coimbra’s Hospital and University Center and a control group from the local community.
2.2 Eligibility criteria
All participants fulfilled the inclusion criteria: age between 45 and 75 years-old, type 2 diabetes diagnosis confirmed by 2019 WHO criteria (15) with determination of fasting glucose, HbA1c, absence of diabetes auto-antibodies (type 2 diabetes group) or exclusion of type 2 diabetes according the same criteria (control group). In all participants the absence of the following exclusion criteria was confirmed: history of neurological or psychiatric disease, dementia or cognitive impairment, active malignancy, inflammatory disease, chronic drug or alcohol dependence, severe visual impairment. Patients with previous cerebrovascular accident or other cortical vascular pathology were excluded, as well as participants with cognitive decline or with incomplete MRI protocol or low-quality criteria.
2.3 Clinical evaluation and laboratory assessments
Participants were submitted to a thorough clinical exam performed by a team of physicians, which included personal medical history, complete physical exam with ophthalmology assessment (retinal fundus photographs and optical coherencetomography) for diagnosis and characterization of micro/macrovascular complications (diabetic peripheral neuropathy defined using the Toronto Consensus Statement (16), previous history of peripheral artery occlusion or myocardial infarction). Blood and urine samples were collected to determine inclusion criteria and disease status and diabetic nephropathy staging (urinary albumin-to-creatinine ratio). Both clinical and laboratory assessments were performed on the same day of imaging acquisition.
Regular physical activity was considered as any moderate aerobic exercise with an intensity of at least 3 Metabolic Equivalent of Task (MET) performed for at least the previous 6 months. A MET is the resting metabolic rate, representing the amount of oxygen consumed while sitting at rest and is equal to 3.5mL per kg per minute or 1 kcal (4.2 kJ) per kg per hour. Only participants that fulfilled these criteria were eligible for further analysis. Physical activity duration was self-reported by the participants as the number of hours of physical activity per week.
2.4 Imaging procedures
All participants were submitted to a Magnetic Resonance Imaging scanning protocol on a 3T Tim Trio scanner (Siemens, Germany) equipped with a 12-channel birdcage head coil. A high-resolution T1-weighted anatomical image was acquired using a three-dimensional Magnetization Prepared Rapid Acquisition Gradient Echo sequence (repetition time/echo time/inversion time 2530/3.42/1100 ms; flip angle 7°; field of view 256×256 mm2; 176 slices with 1×1×1 mm3 voxel size, GRAPPA acceleration factor 2).
2.5 MRI data analysis
MR image processing was conducted using FreeSurfer version 7.0 (https://surfer.nmr.mgh.harvard.edu) software, following the standard “recon-all” stream to obtain global and regional cortical and subcortical GM volumes. Cortical regions were defined according to the Desikan-Killiany DKT40 atlas (17).
2.6 Statistical analysis
Global cortical and subcortical gray matter (GM) volumes were compared between individuals with type 2 diabetes and controls, using multivariate ANCOVA models adjusted for age and estimated total intracranial volume (eTIV) as confounding effects. Multiple regression analysis were carried out to evaluate the impact of weekly exercise hours on global (sub)cortical GM volumes and HbA1c in people with type 2 diabetes.
Correlational analysis were performed independently in each group to explore relationships between normalized (divided by eTIV×100) GM volumes of cortical and subcortical regions and the number of weekly physical activity hours, using bivariate Spearman correlation.
All statistical analysis were run in SPSS version 28 using two-tailed hypothesis testing with a 5% significance level.
3 Results
Of the 190 participants (93 with type 2 diabetes) that enrolled in the study, 170 participants fulfilled the eligibility criteria and were included for analysis: 85 individuals with type 2 diabetes, mean age 60 ± 8.0 years, 35 female; 85 control subjects, mean age 51 ± 8.8 years, 48 female. The baseline clinical and demographic characteristics are detailed in Table 1.
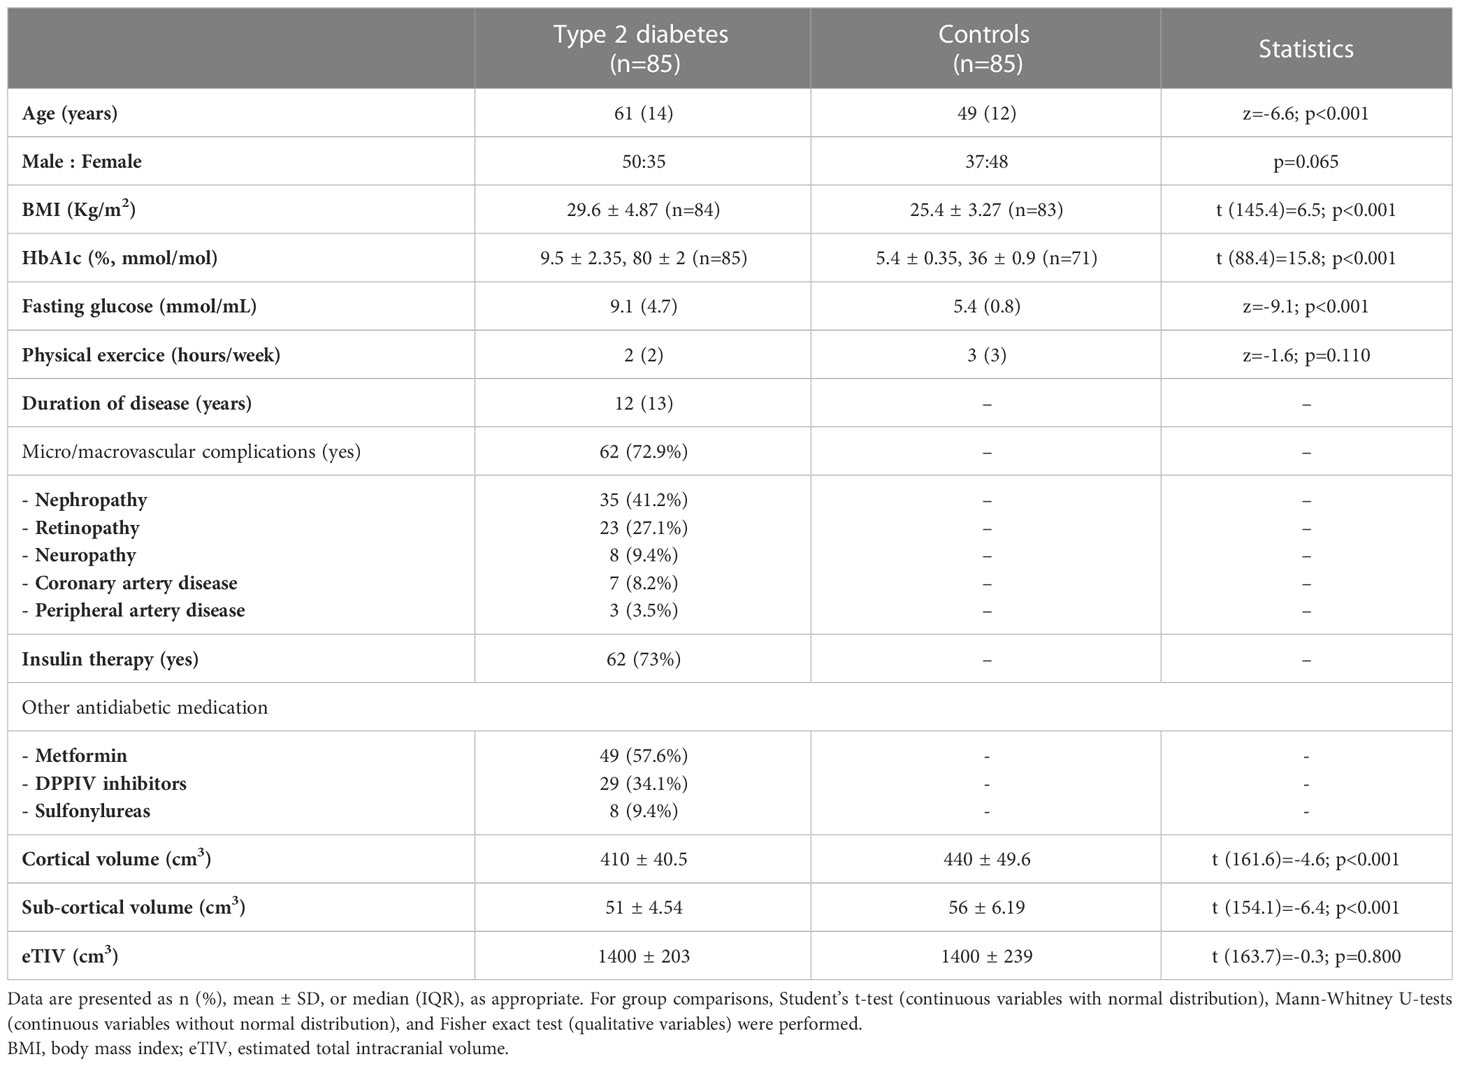
Table 1 Demographics, clinical and volumetric characteristics of the study subjects.
ANCOVA analyses of global (sub)cortical GM volumes between type 2 diabetes and control groups, controlling for age and eTIV, revealed significant differences for each region (cortical: F(1,166)=11.3, p<0.001; subcortical: F(1,166)=22.7, p<0.001) with greater atrophy in the diabetes group, as expected.
From the original cohort, 69 subjects (34 with type 2 diabetes and 35 controls) fulfilled the regular physical activity threshold and were further analyzed. Multiple linear regression was applied to test if physical activity duration (hours/week) significantly predicted gray matter (sub)cortical volumes of individuals with type 2 diabetes who exercised regularly (n=34), independently from HbA1c. For cortical volumes, the overall regression was statistically significant (R2adjusted=23.8%, F(2,31)=6.1, p=0.006). Physical activity duration significantly predicted GM volumes (β=0.74, p=0.008, CI95% [0.20,1.28]), but not HbA1c (β=-0.22, p=0.196, CI95% [-0.57,0.12]). Similar findings were found for total subcortical GM volumes (R2adjusted=15.1%, F(2,31)=3.9, p=0.030; physical activity: β=0.11, p=0.027, CI95% [0.01,0.21]; HbA1c: β =-0.03, p=0.350 CI95% [-0.09,0.03]).
Physical activity duration was significantly correlated with gray matter volumes of several cortical and subcortical subregions in type 2 diabetes group. Regarding the cortex of individuals with type 2 diabetes, the correlations were more pronounced in frontal areas such as superior frontal (ρ=0.50, p=0.003), inferior frontal (ρ=0.55, p<0.001) and orbitofrontal gyrus (ρ=0.52, p=0.002); lingual (ρ=0.56, p<0.001) and fusiform gyrus (ρ=0.60, p<0.001) of the temporal lobe (Figure 1A). In the subcortical analysis, significant effects were identified in the hippocampus (ρ=0.51, p=0.002), thalamus (ρ=0.50, p=0.003), pallidum (ρ=0.48, p=0.004) and putamen (ρ=0.44, p=0.009) in which volumes were strongly correlated with physical activity duration (Figure 1B). Instead, in control group, physical activity duration showed no significant correlation with cortical or subcortical GM volumes aside from orbitofrontal gyrus (ρ=0.39, p=0.021). All results from correlation analysis are detailed in Table 2.
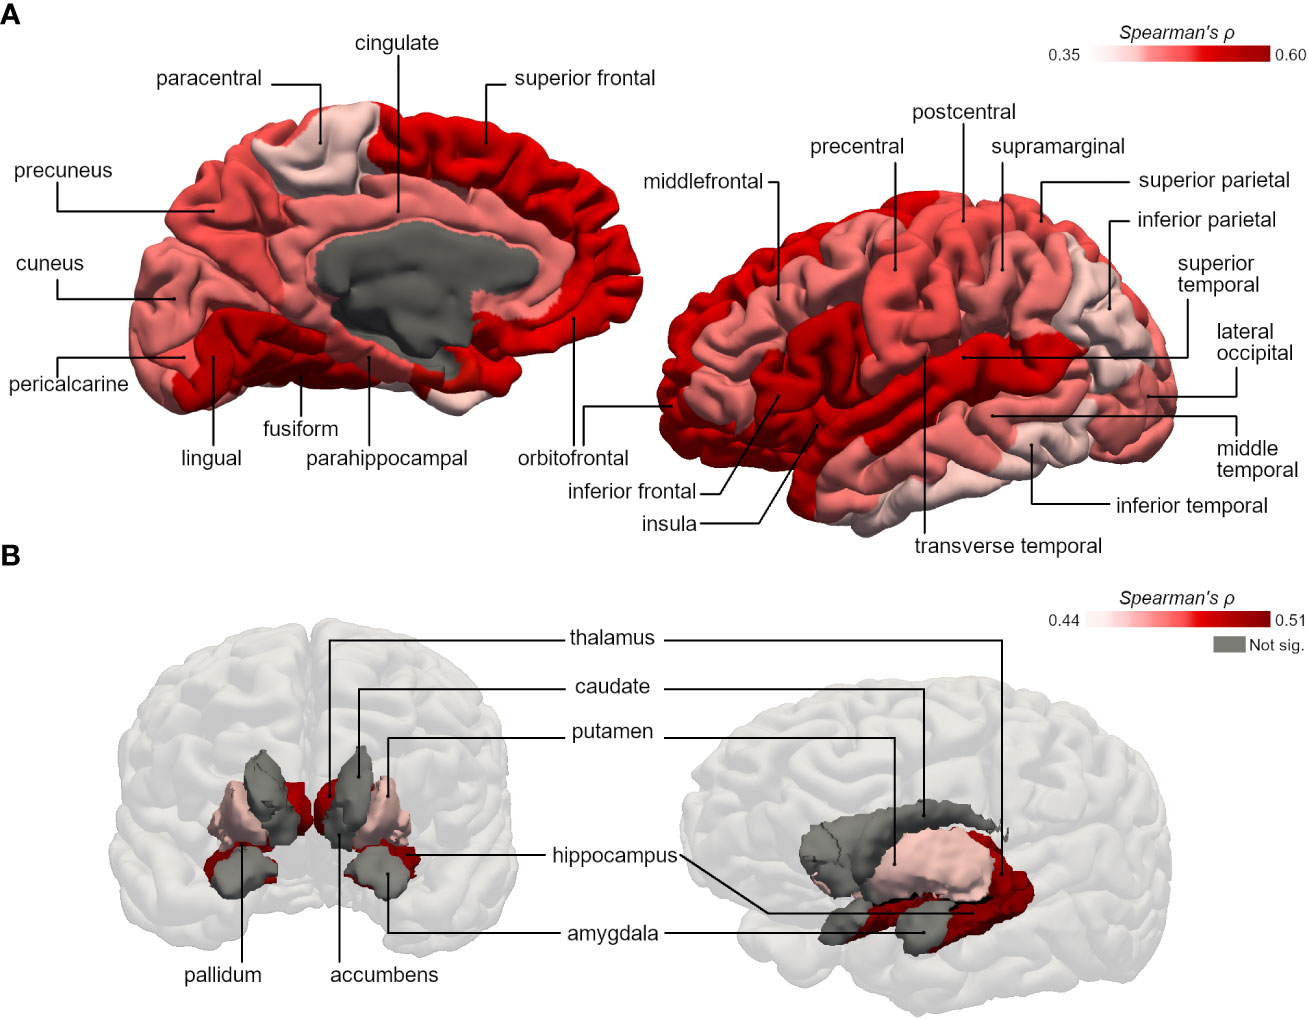
Figure 1 Representative 3D images of the parcellated and segmented brain regions assessed using FreeSurfer. Color intensity corresponds to the strength of the significant bivariate correlations between physical activity duration and gray matter volumes of (A) cortical areas (based on the DKT40 classifier atlas), and (B) subcortical areas, in type 2 diabetes group.
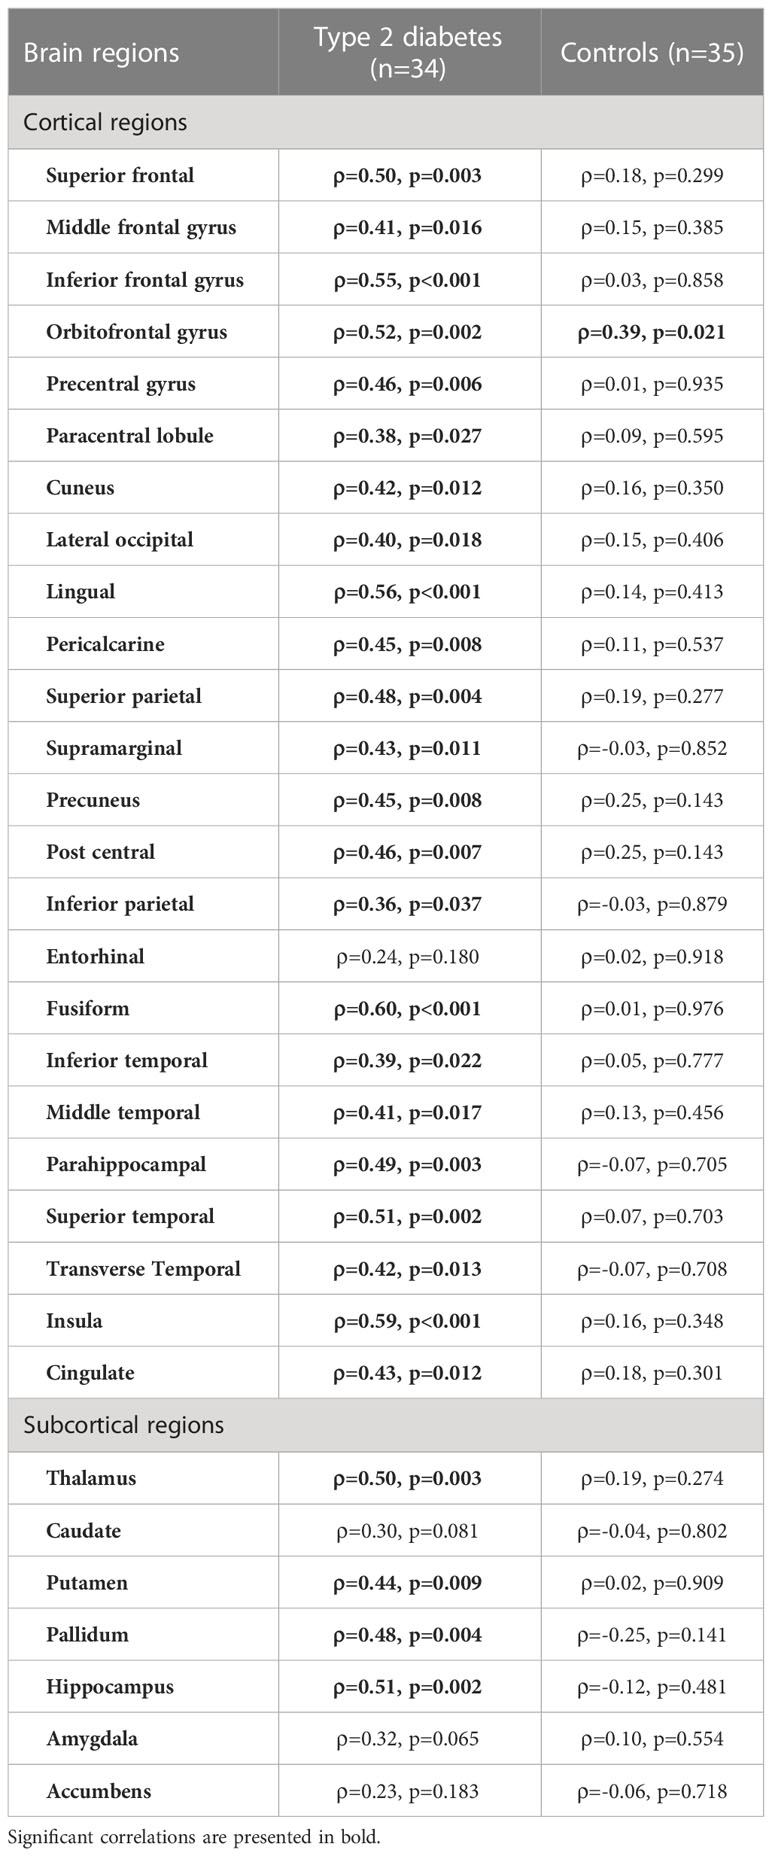
Table 2 Bivariate Spearman correlations between physical activity duration (hours/week) and regional (sub)cortical volumes normalized for eTIV (%) in type 2 diabetes and control groups.
4 Discussion
This study corroborates the commonly reported global gray matter volume reduction in type 2 diabetes versus controls (18, 19).To our knowledge this is the first study to assess a regional sensitivity of specific cortical and subcortical areas to physical activity in type 2 diabetes, revealing that physical activity contributes to a positive influence on gray matter integrity. Moreover, our findings suggests that this cortical and subcortical volume reduction might begin prior to cognitive decline. This outcome has implications for the understanding of pathophysiological mechanisms that promote structural brain changes in people with diabetes, as well as for the identification of modifiable factors that may play a role potentiating or decreasing brain atrophy. While some indisputable risk factors of diabetic brain changes have been reported: such as age (19), disease duration (20), micro and macrovascular complications (3, 21), or insulin resistance (22, 23) the impact of adjustable daily life aspects as nutrition or exercise maybe be positive, but not yet fully established (24).
Our results suggest that physical activity duration has an influence, amongst other factors, predicting brain volumes in type 2 diabetes, where individuals who exercised more regularly had larger (sub)cortical volumes. Surprisingly, this effect was independent from HbA1c, revealing possible beneficial outcomes of regular physical activity that surpasses the improvement of chronic mean glycemic control.
Physical activity duration seems to have a stronger correlation with the volume of specific brain regions, namely superior frontal, inferior frontal and orbitofrontal gyrus of the frontal lobe; lingual and fusiform gyrus of the temporal lobe; hippocampus, thalamus and pallidum. These are involved in executive function, decision and affective cognition as well as in perception, motor performance and memory (25). Ergo, the moderation of brain atrophy, will probably have a positive impact on several quality-of-life parameters of type 2 diabetes people who exercise regularly.
Previous works mainly addressed the influence of exercise on cognitive function and dementia, suggesting that certain types of physical activity appear to be beneficial to mental function in individuals with type 2 diabetes (12, 26). Zabetian-Targhi et al. found a positive correlation between hippocampal volume and attention-processing speed with step count, but not with global gray and white matter volumes (14). Other studies reported that hippocampal volume in older adults (20) and white matter hyperintensities (24) might also be influenced by regular physical activity in people with type 2 diabetes. Further studies, regarding the longitudinal impact of physical activity on detailed brain morphometry in a type 2 diabetes population need to be performed to confirm our results.
This study has some limitations regarding the quantification of physical activity, since this aspect was self-reported and there was no detailed information of specific aerobic and/or resistance training programs and performance outcomes. Also, the sample size of participants who engaged on regular physical activity was relatively small, revealing the sedentary habits of our study population (27).
In conclusion, the multifactorial therapeutic approach of type 2 diabetes must consider factors that might contribute to a preservation of structural brain integrity, such as physical activity, possibly preventing or delaying diabetes-related complications.
Data availability statement
The raw data supporting the conclusions of this article will be made available by the authors, without undue reservation.
Ethics statement
The studies involving human participants were reviewed and approved by Ethics Commission of the Faculty of Medicine of the University of Coimbra. The patients/participants provided their written informed consent to participate in this study.
Author contributions
CM and OCdA processed the MR imaging data, carried out the statistical analysis and wrote the first draft of the manuscript. CM and LG selected participants and collected data. LG, IP and MC-B approved the revisions and final version of the manuscript. MC-B is responsible for the conception, funding and design of the study. MC-B is the guarantor of this work and, as such, had full access to all the data in the study and takes responsibility for the integrity of the data and the accuracy of the analysis. All authors contributed to the article and approved the submitted version.
Funding
This work was supported by the EASD Innovative Outcomes Award 2019, FCT/DSAIPA/DS/0041/2020 and FCT/UIDB&P/4950/2020.
Acknowledgments
The authors thank the participants for their involvement, the members of the Endocrinology Department of Coimbra Hospital and University Center and researchers of Coimbra Institute for Biomedical Imaging and Translational Research for their support.
Conflict of interest
The authors declare that the research was conducted in the absence of any commercial or financial relationships that could be construed as a potential conflict of interest.
Publisher’s note
All claims expressed in this article are solely those of the authors and do not necessarily represent those of their affiliated organizations, or those of the publisher, the editors and the reviewers. Any product that may be evaluated in this article, or claim that may be made by its manufacturer, is not guaranteed or endorsed by the publisher.
References
1. Moran C, Phan TG, Chen J, Blizzard L, Beare R, Venn A, et al. Brain atrophy in type 2 diabetes. Diabetes Care (2013) 36(12):4036–42. doi: 10.2337/dc13-0143
2. Mankovsky B, Zherdova N, van den Berg E, Biessels GJ, de Bresser J. Cognitive functioning and structural brain abnormalities in people with type 2 diabetes mellitus. Diabetic Med (2018) 35(12):1663–70. doi: 10.1111/dme.13800
3. van Sloten TT, Sedaghat S, Carnethon MR, Launer LJ, Stehouwer CDA. Cerebral microvascular complications of type 2 diabetes: Stroke, cognitive dysfunction, and depression. Lancet Diabetes Endocrinol (2020) 8(4):325–36. doi: 10.1016/S2213-8587(19)30405-X
4. Coker LH, Wagenknecht LE. Advanced glycation end products, diabetes, and the brain. Neurology (2011) 77(14):1326–7. doi: 10.1212/WNL.0b013e318231532b
5. Hallschmid M, Schultes B. Central nervous insulin resistance: A promising target in the treatment of metabolic and cognitive disorders? Diabetologia (2009) 52(11):2264–9. doi: 10.1007/s00125-009-1501-x
6. van Dyken P, Lacoste B. Impact of metabolic syndrome on neuroinflammation and the blood–brain barrier. Front Neurosci (2018) 11:12. doi: 10.3389/fnins.2018.00930
7. Kaiser AB, Zhang N, Der Pluijm WV. Global prevalence of type 2 diabetes over the next ten years (2018-2028). Diabetes (2018) 67(Supplement_1):202–LB. doi: 10.2337/db18-202-LB
8. Domingos C, Pêgo JM, Santos NC. Effects of physical activity on brain function and structure in older adults: A systematic review. Behav Brain Res (2021) 402:113061. doi: 10.1016/j.bbr.2020.113061
9. Erickson KI, Raji CA, Lopez OL, Becker JT, Rosano C, Newman AB, et al. Physical activity predicts gray matter volume in late adulthood: The cardiovascular health study. Neurology (2010) 75(16):1415–22. doi: 10.1212/WNL.0b013e3181f88359
10. Jochem C, Baumeister SE, Wittfeld K, Leitzmann MF, Bahls M, Schminke U, et al. Domains of physical activity and brain volumes: A population-based study. Neuroimage (2017) 156:101–8. doi: 10.1016/j.neuroimage.2017.05.020
11. Bertram S, Brixius K, Brinkmann C. Exercise for the diabetic brain: How physical training may help prevent dementia and alzheimer’s disease in T2DM patients. Endocrine (2016) 53(2):350–63. doi: 10.1007/s12020-016-0976-8
12. Callisaya M, Nosaka K. Effects of exercise on type 2 diabetes mellitus-related cognitive impairment and dementia. J Alzheimer’s Dis (2017) 59(2):503–13. doi: 10.3233/JAD-161154
13. Podolski N, Brixius K, Predel HG, Brinkmann C. Effects of regular physical activity on the cognitive performance of type 2 diabetic patients: A systematic review. Metab Syndr Relat Disord (2017) 15(10):481–93. doi: 10.1089/met.2017.0120
14. Zabetian-Targhi F, Srikanth VK, Beare R, Breslin M, Moran C, Wang W, et al. The association between physical activity intensity, cognition, and brain structure in people with type 2 diabetes. Journals Gerontol: Ser A (2021) 76(11):2047–53. doi: 10.1093/gerona/glab067
15. World Health Organization. (2019). Classification of diabetes mellitus. World Health Organization. Available at: https://apps.who.int/iris/handle/10665/325182.
16. Tesfaye S, Boulton AJM, Dyck PJ, Freeman R, Horowitz M, Kempler P, et al. Diabetic neuropathies: Update on definitions, diagnostic criteria, estimation of severity, and treatments. Diabetes Care (2010) 33(10):2285–93. doi: 10.2337/dc10-1303
17. Klein A, Tourville J. 101 labeled brain images and a consistent human cortical labeling protocol. Front Neurosci (2012) 6:1–12. doi: 10.3389/fnins.2012.00171
18. Yao L, Yang C, Zhang W, Li S, Li Q, Chen L, et al. A multimodal meta-analysis of regional structural and functional brain alterations in type 2 diabetes. Front Neuroendocrinol (2021) 62:100915. doi: 10.1016/j.yfrne.2021.100915
19. Biessels GJ, Reijmer YD. Brain changes underlying cognitive dysfunction in diabetes: What can we learn from MRI? Diabetes (2014) 63(7):2244–52. doi: 10.2337/db14-0348
20. Hirabayashi N, Hata J, Ohara T, Mukai N, Nagata M, Shibata M, et al. Association between diabetes and hippocampal atrophy in elderly Japanese: The hisayama study. Diabetes Care (2016) 39(9):1543–9. doi: 10.2337/dc15-2800
21. Sink KM, Divers J, Whitlow CT, Palmer ND, Smith SC, Xu J, et al. Cerebral structural changes in diabetic kidney disease: African American–diabetes heart study MIND. Diabetes Care (2015) 38(2):206–12. doi: 10.2337/dc14-1231
22. Climie RED, Moran C, Callisaya M, Blizzard L, Sharman JE, Venn A, et al. Abdominal obesity and brain atrophy in type 2 diabetes mellitus. PloS One (2015) 10(11):e0142589. doi: 10.1371/journal.pone.0142589
23. Geijselaers SLC, Sep SJS, Stehouwer CDA, Biessels GJ. Glucose regulation, cognition, and brain MRI in type 2 diabetes: A systematic review. Lancet Diabetes Endocrinol (2015) 3(1):75–89. doi: 10.1016/S2213-8587(14)70148-2
24. Espeland MA, Erickson K, Neiberg RH, Jakicic JM, Wadden TA, Wing RR, et al. Brain and white matter hyperintensity volumes after 10 years of random assignment to lifestyle intervention. Diabetes Care (2016) 39(5):764–71. doi: 10.2337/dc15-2230
25. Harvey PD. Domains of cognition and their assessment. Dialogues Clin Neurosci (2019) 21(3):227–37. doi: 10.31887/DCNS.2019.21.3/pharvey
26. Colberg SR, Somma CT, Sechrist SR. Physical activity participation may offset some of the negative impact of diabetes on cognitive function. J Am Med Dir Assoc (2008) 9(6):434–8. doi: 10.1016/j.jamda.2008.03.014
27. Martins J, Marques A, Teixeira PJ, Mota J, Lopes C, Nicola PJ. Socio-demographic factors associated with physical activity and sitting time patterns in adults: An analysis based on the Portuguese food, nutrition and physical activity survey. Eur J Sport Sci (2021) 21(2):250–60. doi: 10.1080/17461391.2020.1736643
Keywords: type 2 diabetes, brain volume, MRI, cerebral atrophy, physical activity
Citation: Moreno C, d’Almeida OC, Gomes L, Paiva I and Castelo-Branco M (2023) Regular physical activity moderates the adverse impact of type 2 diabetes on brain atrophy independently from HbA1c. Front. Endocrinol. 14:1135358. doi: 10.3389/fendo.2023.1135358
Received: 31 December 2022; Accepted: 07 February 2023;
Published: 17 February 2023.
Edited by:
Howe Liu, Allen College, United StatesCopyright © 2023 Moreno, d’Almeida, Gomes, Paiva and Castelo-Branco. This is an open-access article distributed under the terms of the Creative Commons Attribution License (CC BY). The use, distribution or reproduction in other forums is permitted, provided the original author(s) and the copyright owner(s) are credited and that the original publication in this journal is cited, in accordance with accepted academic practice. No use, distribution or reproduction is permitted which does not comply with these terms.
*Correspondence: Miguel Castelo-Branco, bWNicmFuY29AZm1lZC51Yy5wdA==
†These authors have contributed equally to this work and share first authorship
‡ORCID: Carolina Moreno, orcid.org/0000-0002-1389-3800
Otília C. d’Almeida, orcid.org/0000-0003-4849-0507
Leonor Gomes, orcid.org/0000-0001-6576-7104
Isabel Paiva, orcid.org/0000-0002-8323-478X
Miguel Castelo-Branco, orcid.org/0000-0003-4364-6373